Sequence analysis and editing for bisulphite genomic sequencing projects (original) (raw)
Abstract
Bisulphite genomic sequencing is a widely used technique for detailed analysis of the methylation status of a region of DNA. It relies upon the selective deamination of unmethylated cytosine to uracil after treatment with sodium bisulphite, usually followed by PCR amplification of the chosen target region. Since this two-step procedure replaces all unmethylated cytosine bases with thymine, PCR products derived from unmethylated templates contain only three types of nucleotide, in unequal proportions. This can create a number of technical difficulties (e.g. for some base-calling methods) and impedes manual analysis of sequencing results (since the long runs of T or A residues are difficult to align visually with the parent sequence). To facilitate the detailed analysis of bisulphite PCR products (particularly using multiple cloned templates), we have developed a visually intuitive program that identifies the methylation status of CpG dinucleotides by analysis of raw sequence data files produced by MegaBace or ABI sequencers as well as Staden SCF trace files and plain text files. The program then also collates and presents data derived from independent templates (e.g. separate clones). This results in a considerable reduction in the time required for completion of a detailed genomic methylation project.
INTRODUCTION
Bisulphite sequencing is a technique that is widely used for analysis of the methylation status of mammalian DNA (1). The method allows cytosine and 5-methylcytosine to be distinguished, because of the selective deamination of unmethylated cytosine to uracil following sodium bisulphite treatment. Consequently, after conversion, unmethylated regions of DNA contain no cytosine. The dsDNA product obtained after subsequent strand-specific PCR amplification is abnormal in two respects: it contains only three nucleotide types in each strand (A,G,T versus A,C,T), and each strand has an excess of one nucleotide (T or A, respectively).
Analysis of bisulphite-treated DNA can be performed either by directly sequencing the PCR products or by cloning the product and sequencing a number of independent clones. Both methods have their respective advantages and disadvantages, and the final choice depends on the exact aim of the experiment. The experimental differences that arise between the two approaches fall into four main areas: the template characteristics and primer design; the way in which the base-calling software interprets the trace data; the cost and speed of the analysis and the loss of methylation phase information (see the Discussion Section).
When these modified DNAs are used as templates for automated sequencing by the Sanger dideoxy method, problematic aberrant base-calling can sometimes occur. Miscalling of the DNA sequence by some automated sequencers is the result of the adaptive algorithms, that are used by the analysis software in order to achieve extended reads. Such programs track the signal intensity of each dye and artificially amplify the signal when it is low for an extended period. The absence either of a C or of a G signal, in bisulphite sequencing of unmethylated DNA, triggers this adaptive response, which progressively amplifies the weak background signal and eventually inserts spurious C or G residues into the sequence.
A further, non-experimental difficulty that frequently hinders bisulphite sequencing projects relates to editing and alignment of sequences. The bisulphite-treated DNA strands are no longer complementary, and neither strand is a perfect match to the original sequence (unless completely methylated). While it is possible to align these sequences to a reference sequence that has been bisulphite-modified in silico, this process becomes problematic if the trace sequences come from a mixture of clones whose inserts originate from different daughter strands. In addition, in regions of extended runs of a single nucleotide the alignment may go out of register. Consequently, individual sequence reads often have to be manually corrected, which can be a tedious error-prone process when multiple clones are being analysed.
To address these problems, a number of software programs have been developed that facilitate individual steps in the bisulphite sequencing process. These include primer design (2,3), bisulphite-treated sequence alignment (4,5) and generation of graphical or text-based outputs (6). None of these programs offers an integrated solution for routine use; the individual programs are variously controlled from the command line, a graphical user interface (GUI) or a web browser. Their combined use requires a degree of computer literacy somewhat beyond that of the average biomedical scientist, which is a significant consideration now that bisulphite sequencing has been widely adopted into routine use in genetics laboratories. Also, while command-line programs are powerful and flexible (if well documented) they sometimes do not provide a facility for user intervention and data editing, which may be required for resolving anomalous results. A well-designed GUI allows easier interaction, since data can be entered and then repeatedly reanalysed and edited using different parameters, with the results readily visible.
As a practical solution for the genetics laboratory, we have therefore developed CpGviewer, a well-documented GUI-based program. It can use as input either multiple plain text files or sequence electropherograms (without adaptive peak height adjustment), and then align them to a reference sequence. The methylation status of each CpG dinucleotide is determined automatically and the results displayed as an interactive grid, within which each column represents one CpG dinucleotide found in the reference sequence. Interactive editing is facilitated by the fact that each cell in a row provides a direct link to the underlying sequence data surrounding the corresponding CpG dinucleotide, aligned to the reference sequence. The program also allows the user to view the entire electropherogram of each file. It offers the ability to save the exported summary methylation data in a variety of graphical formats for publication purposes. It also has a facility for assisting in the selection of primers for amplification of bisulphite-treated DNA.
MATERIALS AND METHODS
Software development and requirements
Programming was done using Microsoft Visual Studio 2005 using the Visual Basic language. The program has been tested only on Microsoft Windows XP, and requires the .NET framework 2.0 to be installed. The program and accompanying documentation are freely available for download at http://xserve1.leeds.ac.uk/~iancarr/cpgviewer
Bisulphite modification and cloning of DNA
A sodium bisulphite DNA modification protocol was used as described previously (7). The example data were derived from bisulphite sequencing of the differentially methylated region (DMR) in the imprinted ZAC (PLAGL1) tumour-suppressor gene (7). The reference sequence corresponds to nucleotides 48434376–48433838 of the Chromosome 6 assembly, accession NT_025741.14. PCR of bisulphite-modified DNA was carried out using the following primers, which amplify both methylated and unmethylated sequences: Zac9: dCCCAACCRTATCTAAATCAAAACT; and Zac1: dGTGTTTAGGATAGTGTTTGGTT. PCR conditions were as follows: denaturation at 94°C for 3 min followed by 35 cycles of 94°C, 30 s; 58°C, 30 s; 72°C, 30 s and a final extension step at 72°C for 3 min. PCR products were gel-extracted, purified using the Geneclean II kit (MP Biomedicals, Solon, OH, USA) and ligated into pGEM-T Easy vector (Promega, Madison, WI, USA) according to the manufacturer's protocol. Ligations were transformed into DH5α cells and DNA extracted from recombinant clones using the Qiaprep Spin miniprep kit (Qiagen, Valencia, CA, USA).
DNA sequencing
For analysis on the MegaBace500 sequencer (GE Healthcare, Amersham, UK), miniprep DNA was sequenced using the DYEnamic ET Terminator kit according to the manufacturer's protocol. For analysis on the ABI3130xl sequencer, sequencing reactions were prepared using the BigDye Terminator v3.1 Cycle Sequencing kit (Applied Biosystems, Foster City, CA, USA). Plasmid clones were sequenced using standard M13 forward and reverse primers.
Trace file analysis
Since the program is designed to use as input either raw or analysed trace data from a number of different sources, it first extracts the trace data from each file type, and converts them into a common format that is used by its internal basecaller. If the data originate from an unprocessed file, the program automatically adjusts the baseline intensities of each trace and then corrects for spectral overlap between different dyes and different dye motilities. (However, since Staden files can originate from a variety of sources, it is assumed that .SCF data have already been corrected for differences in dye migration and spectral overlay.) Once the data are in the correct format, the base caller detects nucleotide peak positions by differential analysis of the individual traces. The typical peak to peak distance is determined and the data reanalysed to detect missed and false peaks. The sequence is then trimmed to remove poor quality sequence as determined by peak spacing. Although CpGviewer can be used perfectly well with previously analysed sequence data, we wrote this non-adaptive basecalling routine in order to circumvent major difficulties that certain adaptive routines (notably the Cimmaron basecaller supplied with MegaBace instruments) have when analysing sequences derived from unmethylated templates.
Alignment of bisulphite sequences to genomic reference sequence
The alignment is created using a local extension algorithm similar to that used in BLAST (8). An array of overlapping DNA fragments 10 bp in length is created from the in silico bisulphite-modified reference sequence. (This fragment length can be changed via CpG > Alignment options > Word size.) These fragments are each mapped to regions on the query sequence that have an identical sequence. These sequences are then extended at both ends, the extension being terminated when three of the last five bases do not match between the reference and query sequences. The extended sequences are then sorted to remove duplicate alignments. The remaining alignments are then linked together, such that the largest fragment is linked to the start and end of the reference sequence using the remaining extended fragments, keeping the number and size of gaps to a minimum. Where gaps of unaligned sequences are created these are then aligned to each other using a pairwise alignment algorithm (9). Each alignment is given a quality score that is the percentage of the alignment's total length derived from the extended fragments. While this alignment is performed on the in silico converted reference sequence, the original reference sequence is also manipulated in the same way, and is displayed unmodified in the screen alignments, since this allows the user to identify specific CpG dinucleotides more easily than if traces are displayed aligned against the converted sequence.
RESULTS
Analysis of electropherogram data
DNA sequences can be loaded into the program in a number of different electropherogram file formats. However, some knowledge of the behaviour of the individual sequencing instrument is advisable. Thus, for the MegaBace family of sequencers (GE Healthcare, Amersham, UK), *.esd files are best avoided, because of the adaptive baseline manipulation performed in generating them; instead, data are imported from unprocessed *.rsd files. Similarly, it is possible to use the raw sequence data in a *.AB1 file, rather than the processed data. During the analysis, the program examines the peak spacing of the traces and uses this information to trim the nucleotide sequence at its ends. However, internal regions of low sequence quality are not discarded. Rather, we have chosen to detect and discard low quality regions and vector DNA sequences later, when aligning the sequences to the reference sequence.
Alignment of bisulphite-treated DNA sequences
Once the DNA sequence has been determined for each trace file, it is aligned against the reference sequence using a local extension algorithm written for the purpose. (Commonly used alignment programs are not ideal for this task, because of the variable degree of divergence between the reference and experimental sequences.) Since the alignment is performed using the output sequences, without reference to trace quality scores, it is also possible to load sequences as plain text files. Such files are treated in the same manner as electropherogram data, except that the program interface does not provide a link to any peak height data.
Bisulphite treatment of unmethylated DNA results in sister strands that are no longer complementary to each other and are imperfect matches to the original sequence. To facilitate alignment of these modified sequences to the original reference sequence, each experimental sequence is compared to the predicted bisulphite-modified forward and reverse strands, as well as the original reference sequence. The alignment generating the highest score (see the Methods Section) is then used for subsequent sequence displays.
Visualization of CpG methylation status
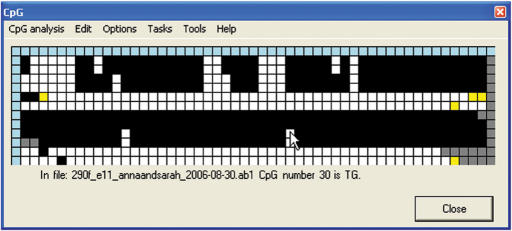
The sequence alignment can be viewed either in the form of an interactive grid (Figure 1) or as a web page, containing ‘snapshot’ images of the local trace and alignment around each CpG in the reference sequence. These views each allow verification of the quality of the sequence and its alignment, around each CpG dinucleotide. The web page view can also be saved to disk, and so viewed independently of the source data.
Figure 1.
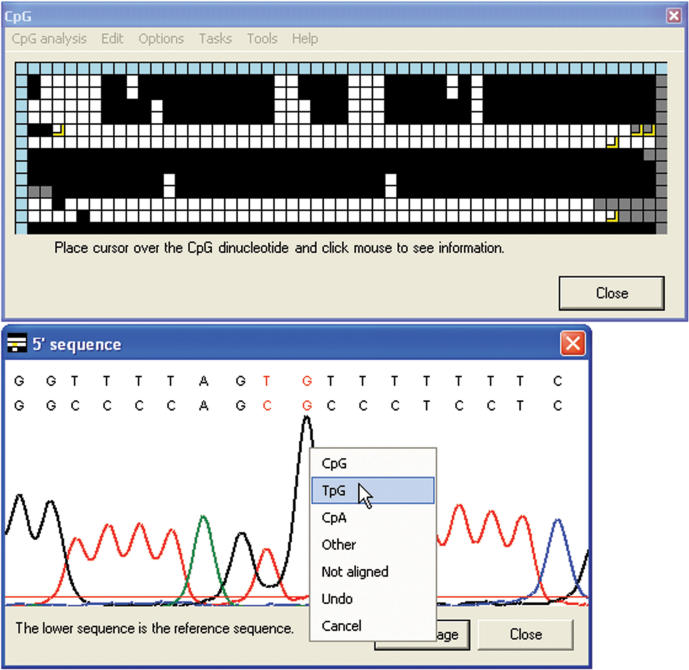
Interactive methylation status grid. The CpGviewer grid window, after loading the ZAC sample electropherograms. The traces can be seen to fall into two classes, either predominantly methylated (maternal allele) or unmethylated (paternal allele), as typical for an imprinted gene DMR. Clicking on a cell with the left mouse button displays the status of that CpG dinucleotide and the name of the sequence file from which it derives.
The interactive view comprises a window containing a grid of colour-coded squares (Figure 1). Each column represents one CpG dinucleotide in the reference sequence and each row an individual experimental DNA sequence. Clicking on an individual cell displays its underlying data. The blue cells at the head of each column contain information on the position of that CpG dinucleotide in the reference sequence, while those at the start of each row identify the file name containing that sequence. For the remaining cells, black is used to highlight methylated CpG dinucleotides. Unmethylated CpG dinucleotides can either be displayed in white, or CpA and TpG can be shown in two distinguishable colours (pink and green). (In general, only one of CpA and TpG is applicable for a single experiment, but the two-colour display enables identification of any anomalous results.) Where a CpG dinucleotide in the reference sequence has been aligned to a sequence other than CpG, TpG or CpA its cell is yellow; this implies either the presence of a SNP at that position, or a sequencing or PCR artefact. Cells that correspond to positions that lie outside the alignment of an individual sequence trace are shaded grey.
When a blue border square is left-clicked, the caption below the grid displays either (i) for a row, the source file name and the aligned sequence's percentage of dC and dG content or (ii) for a column, information about the position of that CpG within the reference sequence. Similarly, left-clicking a square within the main body of the grid identifies the individual CpG, its methylation status and its file name (Figure 1).
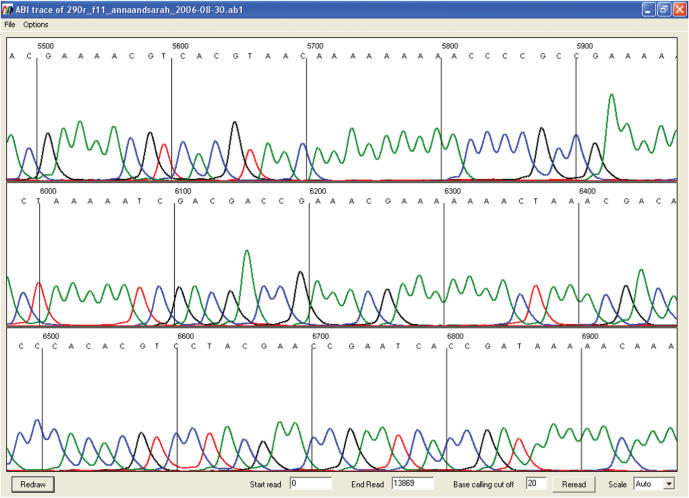
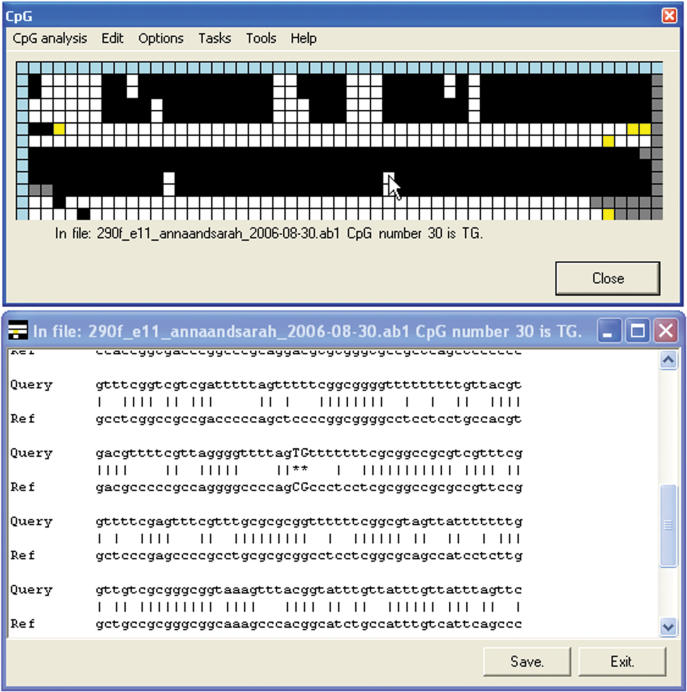
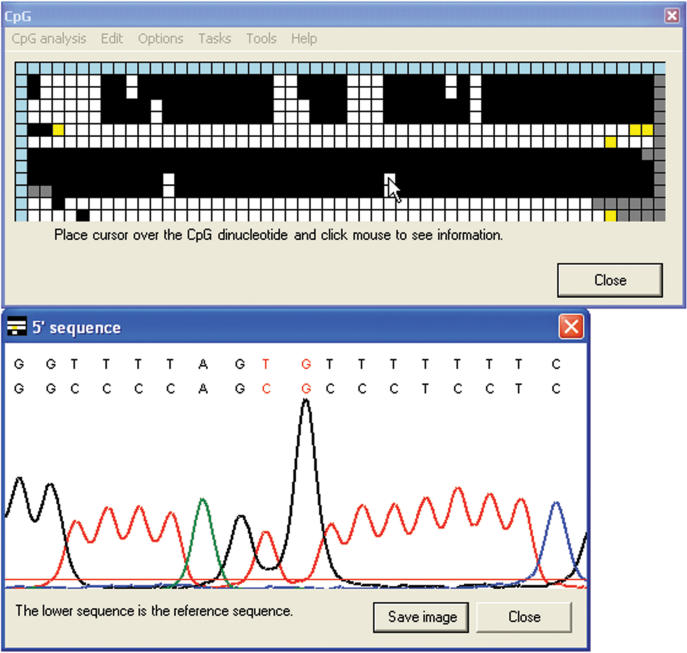
Right-clicking on a blue row square will display that file's electropherogram image, allowing the quality of the sequence to be observed (Figure 2). Right-clicking on a main grid cell produces an output that depends on the origin of the sequence file: if the sequence was loaded as text, the sequence alignment is displayed with the chosen CpG position capitalized and marked by two asterisks (Figure 3). If the sequence was generated from an electropherogram, right-clicking displays the local sequence trace with the corresponding part of the alignment (Figure 4). This trace image display can be disabled by selecting Options > Always show text alignment.
Figure 2.
Electropherogram of a bisulphite-treated DNA clone. Right-clicking on one of the blue row cells displays the entire electropherogram for that individual sequence.
Figure 3.
Display of the text alignment underlying the methylation status grid. This display option is used under two circumstances: if the original input sequence was plain text rather than trace data; if the Always show text alignment option is selected. In these circumstances, right-clicking on a cell shows that sequence's alignment against the reference sequence with the display window centred on the selected CpG dinucleotide.
Figure 4.
Display of the electropherogram data underlying the methylation status grid. Ordinarily (see Figure 3 for exceptions), right-clicking on a cell in the main body of the interactive grid displays an image of the local region of the sequence trace and its alignment with the reference sequence (lower text row).
Using the CpG grid display window, it is also possible to generate a consensus sequence interactively. Selecting Edit > Create consensus … adds a new row at the bottom of the grid. The cells in this row are initially grey, but change to match whichever colour is chosen by clicking on any cell in the same column. Once the consensus row is completed, the underlying sequence can be saved via Edit > Save consensus … . This feature may be useful for various purposes. For example, if multiple sequence runs are performed on a single cloned product, the consensus row can be used to assemble the most accurate sequence of that clone. Alternatively, if each row represents a separate clone, a sequence can be built that represents the population consensus methylation state, e.g. for a specific tissue or patient. Also, since consensus sequences can be saved and then reloaded as text input files, the feature can be used consecutively to generate clone sequences and then a population consensus. For an imprinted CpG island, where the methylation patterns fall into two clearly distinguishable groups, a separate consensus can be created and saved for each allele.
Most bisulphite sequencing projects require some additional editing of the alignment. Therefore, the true status of mismatched CpGs that are highlighted in yellow or grey can be manually assigned after inspecting the sequence data. To do this, the Edit > Edit data option is first selected. A left-click on a square then allows the user to choose any of the possible alternative states of this CpG dinucleotide. (This choice is overlaid on the original grid square as a slightly smaller square of the new colour.) A right-click while in this mode brings up (as described earlier) the electropherogram or sequence alignment display window; the user can inspect this and then click on the window to assign the correct status (Figure 5).
Figure 5.
Editing the CpG methylation status. Clicking in the electropherogram image window allows the methylation status of the CpG dinucleotide to be edited via a dropdown menu. In the grid, the edited squares can be seen as smaller squares representing the edited values, overlaying the larger squares representing the originals. The editing menu can also be accessed by clicking on the text of the alignment (Figure 3) or by clicking the grid when in edit mode.
For a large project, a partially edited set of data can be saved to disk as a *.edi file with the same prefix as the input reference sequence. This file can be reloaded for later use, but does not contain all the original electropherogram data, which must therefore be retained for use in conjunction with the *.edi file.
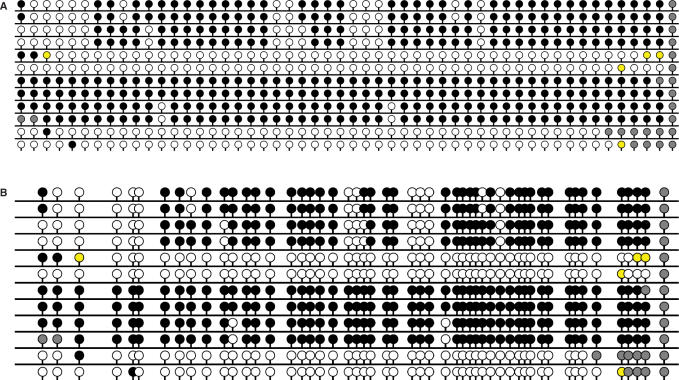
The Tasks > Save Image … command allows the grid display to be exported to a variety of graphics file formats. In addition to the square pattern used for the interactive grid, two ‘lollipop’ styles as commonly used in publications are available, either with fixed spacing or scaled to show the relative positions of each CpG within the sequence (Figure 6). This exported graphic can also be generated either with the edited or the original cell data (Options > Use edited data when saving images).
Figure 6.
Summary output of methylation data. Publication type CpG dinucleotide information shown as equally spaced (A) or scaled (B) ‘lollipops’. (To prevent closely spaced lollipops from overlying one another in the scaled view, a fixed gap of half the width of a lollipop is inserted in the x axis after each lollipop stick).
DISCUSSION
As stated earlier, methylation analysis can be performed either by direct sequencing of PCR products or by sequencing a number of cloned PCR products. Each approach has its merits. At first sight, direct PCR sequencing appears a much quicker and cheaper option than cloning and then sequencing multiple copies of the product. However, it often requires significant effort to optimize the initial PCR conditions so as to eliminate template contamination with spurious amplification products. This is probably a consequence of the reduced sequence complexity of bisulphite-treated DNA. Also, if the genomic DNA displays two divergent methylation states (as is the case for differentially methylated regions (DMRs) of imprinted genes), the bisulphite PCR product contains two very different template sequences. These highly divergent sequences may then demonstrate quite disparate electrophoretic mobilities, (e.g. due to one sequence having a greater tendency to form a stable secondary structure). This can lead to superimposed ‘staggered’ electropherograms representing methylated and unmethylated alleles, which are hard to read. Neither of these technical issues is a problem when sequencing cloned products; since each clone contains just one sequence, differences in mobility do not arise, while any spuriously amplified PCR products can also be readily identified and discarded.
CpGviewer is therefore primarily aimed at projects in which multiple cloned bisulphite-PCR sequences are being compared. Others, in contrast, have taken computational approaches that aim at robust quantitative analysis of directly sequenced bisulphite-PCR products (4). The latter approach is necessary for high-throughput ‘epigenomic’ studies. For smaller studies focussed on one or two genomic regions, however, the cost and time incurred in template optimization for direct sequencing may be greater than that of cloning and sequencing the products. Furthermore, direct sequencing can never reveal the full information content present in bisulphite-PCR products derived from a diploid genome or from a mixed population of cells. For example, if a tumour DNA appears to show a methylation level of 50%, this could represent randomly distributed methylation of ∼50% of each CpG, or the existence of a mixture of two cell populations, one completely methylated and one completely unmethylated. Similar considerations apply to the interpretation of direct sequencing of DMRs of imprinted genes, where the two alleles may differ markedly in methylation status. Sometimes it is wise also to compare the results of direct sequencing with cloning and sequencing, thus permitting the detection of cloning biases that occur at some DMRs.
Both direct and clonal bisulphite sequencing approaches can also sometimes be affected by base-calling problems. Recent advances in sequencing technology have been directed primarily at increased read length with the undesired side effect that the computational approaches used by some base callers can hamper the analysis of DNA with an unusual base composition. As described above, adaptive amplification of the C (or G) baseline can be induced by the deficiency of C (or G) residues in templates derived from bisulphite-modified DNA. Even if this effect (which is much more pronounced when methylated CpGs are absent from the starting material) is not severe enough to cause extra bases to be called, it also reduces the sequence quality score. We have found this effect to be particularly problematic when sequencing unmethylated DNA sources on the MegaBace500 instrument; this was the principal reason for including a non-adaptive base-calling algorithm for analysing raw sequence traces that does not adjust baseline intensity according to perceived sequence context. For the related reason alluded to above, we have also chosen not to discard sequence traces based on their quality scores. While such quality scores are very important in the construction of de novo sequence contigs, they are of limited value when aligning multiple independent test sequences against a known reference sequence.
In any bisulphite sequencing project, once the sequences have been base called, they must be aligned against the reference sequence. Again, the commonly used local and global alignment tools are not well suited to this task, both because the sister strands of bisulphite-treated template DNA no longer match the original sequence, and because variability in methylation status means that individual product molecules vary in sequence. We have therefore used an algorithm that can align DNA sequences irrespective of the sequence direction, methylation status and completeness of cytosine deamination. As stated earlier, it is at this stage of analysis that sequences are discarded, if they cannot be aligned to the reference. This approach allows us to shift the experimental quality control away from analysis of fluorescence peak heights, onto the comparison of the base-called sequence with a reference sequence (which it should align perfectly to, and against which discrepancies can be rapidly eliminated interactively).
The final convenience offered by this program is the production of a graphical representation of the methylation status of all the experimental sequences. Graphical representations of this type are commonly used when publishing the results of bisulphite sequencing studies. Our program automates this tedious and error-prone data collation step, with user input limited to interactive editing and generation of a final consensus sequence (if desired). It is a simple matter at this stage to identify sequences with poorer quality reads, by the presence of yellow cells. Rapid display of the trace data corresponding to these cells allows the rapid validation or discarding of individual results.
In conclusion, analysis of the methylation status of DNA by the sequencing of cloned sodium bisulphite-treated DNA products is a well-established and important laboratory technique that has for some time been hindered by a lack of easy to use data analysis software. We have made a number of design decisions in developing this program, that focus on the special requirements of this methodology. By discarding unnecessary or inappropriate steps that create bottlenecks in the analytical process, we have found that the time required to complete a methylation study can be dramatically reduced.
Supplementary Material
[Supplementary Material]
ACKNOWLEDGEMENTS
This work was supported by the West Riding Medical Research Trust, by the Leukaemia Research Fund Grant 00/56 and by a pump-priming grant from Yorkshire Cancer Research. Funding to pay the Open Access publication charges for this article was provided by the West Riding Medical Research Trust.
Conflict of interest statement. None declared.
REFERENCES
- 1.Clark SJ, Harrison J, Paul CL, Frommer M. High sensitivity mapping of methylated cytosines. Nucleic Acids Res. 1994;22:2990–2997. doi: 10.1093/nar/22.15.2990. [DOI] [PMC free article] [PubMed] [Google Scholar]
- 2.Li L-C, Dahiya R. MethPrimer: designing primers for methylation PCRs. Bioinformatics. 2002;18:1427–1431. doi: 10.1093/bioinformatics/18.11.1427. [DOI] [PubMed] [Google Scholar]
- 3.Tusnády GE, Simon I, Váradi A, Arányi T. BiSearch: primer-design and search tool for PCR on bisulfite-treated genomes. Nucleic Acids Res. 2005;33:e9. doi: 10.1093/nar/gni012. [DOI] [PMC free article] [PubMed] [Google Scholar]
- 4.Lewin J, Schmitt AO, Adorján P, Hildmann T, Piepenbrock C. Quantitative DNA methylation analysis based on four-dye trace data from direct sequencing of PCR amplificates. Bioinformatics. 2004;20:3005–3012. doi: 10.1093/bioinformatics/bth346. [DOI] [PubMed] [Google Scholar]
- 5.Bock C, Reither S, Mikeska T, Paulsen M, Walter J, Lengauer T. BiQ Analyzer: visualization and quality control for DNA methylation data from bisulfite sequencing. Bioinformatics. 2005;21:4067–4068. doi: 10.1093/bioinformatics/bti652. [DOI] [PubMed] [Google Scholar]
- 6.Grunau C, Schattevoy R, Mache N, Rosenthal A. MethTools – a toolbox to visualize and analyze DNA methylation data. Nucleic Acids Res. 2000;28:1053–1058. doi: 10.1093/nar/28.5.1053. [DOI] [PMC free article] [PubMed] [Google Scholar]
- 7.Kamiya M, Judson H, Okazaki Y, Kusakabe M, Muramatsu M, Takada S, Takagi N, Arima T, Wake N, et al. The cell cycle control gene ZAC/PLAGL1 is imprinted – a strong candidate gene for transient neonatal diabetes. Hum. Mol. Genet. 2000;9:453–460. doi: 10.1093/hmg/9.3.453. [DOI] [PubMed] [Google Scholar]
- 8.Altschul SF, Gish W, Miller W, Myers EW, Lipman DJ. Basic local alignment search tool. J. Mol. Biol. 1990;215:403–410. doi: 10.1016/S0022-2836(05)80360-2. [DOI] [PubMed] [Google Scholar]
- 9.Needleman SB, Wunsch CD. A general method applicable to the search for similarities in the amino acid sequence of two proteins. J. Mol. Biol. 1970;48:443–453. doi: 10.1016/0022-2836(70)90057-4. [DOI] [PubMed] [Google Scholar]
Associated Data
This section collects any data citations, data availability statements, or supplementary materials included in this article.
Supplementary Materials
[Supplementary Material]
