Genetic control of the innate immune response (original) (raw)
Abstract
Background
Susceptibility to infectious diseases is directed, in part, by the interaction between the invading pathogen and host macrophages. This study examines the influence of genetic background on host-pathogen interactions, by assessing the transcriptional responses of macrophages from five inbred mouse strains to lipopolysaccharide (LPS), a major determinant of responses to gram-negative microorganisms.
Results
The mouse strains examined varied greatly in the number, amplitude and rate of induction of genes expressed in response to LPS. The response was attenuated in the C3H/HeJ_lps_ d strain, which has a mutation in the LPS receptor Toll-like receptor 4 (TLR4). Variation between mouse strains allowed clustering into early (C57Bl/6J and DBA/2J) and delayed (BALB/c and C3H/ARC) transcriptional phenotypes. There was no clear correlation between gene induction patterns and variation at the Bcg locus (Slc11A1) or propensity to bias Th1 versus Th2 T cell activation responses.
Conclusion
Macrophages from each strain responded to LPS with unique gene expression profiles. The variation apparent between genetic backgrounds provides insights into the breadth of possible inflammatory responses, and paradoxically, this divergence was used to identify a common transcriptional program that responds to TLR4 signalling, irrespective of genetic background. Our data indicates that many additional genetic loci control the nature and the extent of transcriptional responses promoted by a single pathogen-associated molecular pattern (PAMP), such as LPS.
Background
Susceptibility to infection is determined by the nature of the pathogen, and by the fitness of an individual to respond appropriately. The nature of the host response is controlled in part by the appropriate recognition of PAMPs by cells of the innate immune system [1,2]. Ineffective PAMP recognition, or an inappropriate response underlies clinical complications such as circulating bacterial load or septic shock. Lipopolysaccharide (LPS), a component of bacterial cell walls, is the predominant trigger of adverse clinical consequences of infection with gram-negative bacteria, including host procoagulant response and septic shock [3].
Susceptibility to gram-negative bacteria in human populations has been associated with allelic variation at TLR4 [4,5], with consequences for infectious, inflammatory and cardiovascular disease [6]. Yet the complexity of the innate immune response to PAMPs constrains large-scale experimental analysis in outbred human populations. Microarray experiments comparing PAMPs from different organisms on human peripheral blood monocytes have shown a remarkably stereotyped response, even between different TLR ligands [7-9]. By contrast, LPS responses studied by high-density microarray in the mouse transformed monocyte line RAW264 establish that in a controlled cell culture system there is transcriptional diversity between different TLR agonists [10], and that even this controlled cell culture system demonstrates heterogeneity of response to a single PAMP [11].
As a model for human variation, inbred mouse strains have been central to our understanding of the function of innate and acquired immune systems. Individual strains have differing susceptibilities to disease onset and pathology in a wide number of experimental disease models. In this study we have chosen to use five inbred mouse strains, with a spectrum of LPS susceptibility as genetic tools to determine the nature and diversity of innate immune responses to a single pathogenic stimulus. The strains chosen (C57Bl/6J, DBA2, BALB/c, C3H/ARC_lps_ n and C3H/HeJ_lps_ d) differ on at least two genetic loci known to influence innate immune responses. For example, polymorphism in Slc11A1 at the Bcg (also known as Ity or Lsh) locus controls susceptibility to intracellular pathogens. C57Bl/6J and BALB/c carry the susceptible allele (Bcg s), a G169D substitution in the predicted TM4 of the Slc11A1 protein [12], whereas DBA2 and C3H substrains carry the resistant allele (Bcg r). Slc11A1 variants exert pleiotropic effects on LPS-inducible cytokine gene expression [13]. The LPS-hypo responsive strain C3H/HeJ_lps_ d has a P712H substitution in the cytoplasmic Toll-IL1 receptor (TIR) domain of TLR4, which prevents activation of the Myd88 signalling cascade shared with many other Toll-like receptors [14,15]. The comparison of C3H/HeJ_lps_ d with the near-isogenic line C3H/ARC_lps_ n, which has functional TLR4, provides an important control for specificity of TLR4 signalling, since LPS contaminants may signal via TLR2 [16].
In this study we show that macrophages from each strain display an idiosyncratic gene expression profile upon LPS activation, indicating that loci other than Tlr4 profoundly affect LPS responsiveness. We have also identified a core set of genes that respond to LPS in a TLR4-dependent fashion, regardless of genetic background. This set describes a conserved transcriptional program underlying inflammatory responses to LPS.
Results and discussion
To determine the effect of genetic background on macrophage responses to LPS, we exposed primary populations of bone marrow-derived macrophages (BMM) from each mouse strain to LPS over a 21 h time course. For the purposes of cDNA microarray analysis, this system had the additional advantage that pure populations of cells undergo large, relatively synchronous, and reproducible changes in gene expression. We have previously shown that macrophages derived from the bone marrow of three of these strains cluster as a single tissue subtype when compared to 49 other mouse and embryonic tissues. In this system, C3H/HeJ_lps_ d mice do not express inflammatory transcripts in response to our LPS preparation, and cluster on a separate branch of the macrophage lineage tree to activated LPS-responsive strains [17].
BMM were stimulated in the presence of macrophage growth factor, CSF-1, which has been shown to amplify induction of key pro-inflammatory cytokines by LPS [18]. The LPS concentration (10ng/ml) is saturating, and the times chosen (30 min, 2, 7, 21 hours) distinguish temporal classes of inducible genes in a sequential cascade of gene activation. We interrogated the 19,000 element arrays arising from the RIKEN mouse gene encyclopaedia project [19], using 17.5dpc C57Bl/6J embryo RNA as a reference for each point of the time series.
LPS stimulation of macrophages elicits global transcriptional changes
Analysis was restricted to elements that were detected in every hybridisation on the reference channel. This filter provided confidence that variation in expression between time points or mouse strains was not due to spot artefacts, and although this eliminated some genes that are expressed in macrophages but undetectable in the reference embryo RNA, it greatly increased the reproducibility of the data. 3612 array elements passed filters for reproducibility, signal detection 2 fold above background and reliability of reference signal across all of the hybridisations. The normalized distribution of cDNA signal intensities is displayed for each time point and each mouse strain in Fig 1. Each element was coloured with respect to the unstimulated C57Bl/6J time point to illustrate the rapid changes in gene expression upon LPS activation. Across the C57Bl6J time course alone, 918 (25%) of genes expressed at the median level (yellow) or below the median (blue) at time zero were substantially induced by LPS, and 696 (19%) of genes expressed at the median level (yellow) or above (red) were repressed at some time point, using a 2 fold cut-off from the median. Table 1 lists the numbers of elements that were induced or repressed in any given activated macrophage population, and shows that this global pattern was recapitulated for each of the LPS responsive mouse strains. Each strain presented an idiosyncratic gene expression profile in response to LPS. Only 11% of elements (415/3612) were co-regulated in all 4 responder mouse strains. This variation in global gene induction between the mouse strains is obvious in Fig. 1, particularly in the C57Bl/6J and C3H/ARC comparison.
Figure 1.
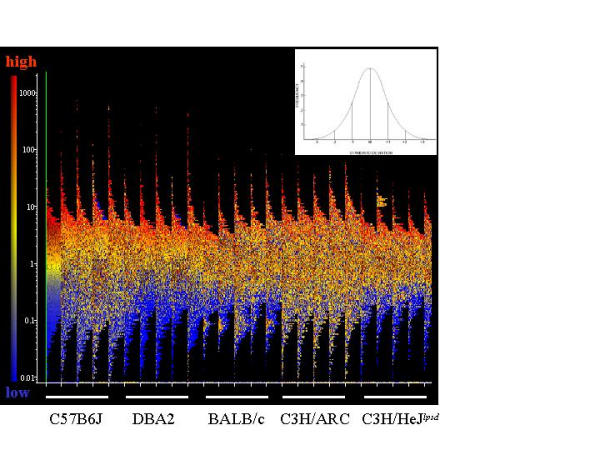
Temporal distribution of the entire 19,000 RIKEN cDNA dataset. Figure 1 describes the distribution of expression of 19,000 RIKEN full-length cDNAs across a 21-hour time course for each of 5 mouse strains, C57Bl/6J, DBA2, BALB/c, C3H/Arc and C3H/HeJ_lps_ d. A normal distribution plot allows standard deviations (SD) from the mean of the population to be calculated (inset). The graph describes a series of overlaid normal distribution plots; each time point is plotted as a normal distribution of signal intensities on the y-axis, frequency on the x-axis, with a log median intensity of 1 across the dataset. Each element is coloured with respect to its expression in the unstimulated C57Bl/6J time point, where blue is expressed at least 2SD below the median, yellow is considered within 2SD of the median and red is at least 2SD above the median.
Table 1.
The number of probes on the 19 K RIKEN array that were 2 fold induced or repressed compared to the unstimulated time point, after the addition of LPS. The data is also expressed as a percentage (%) of the 3612 genes that were reliably expressed across the entire experimental series.
| STRAIN | Induced | Repressed |
|---|---|---|
| C57Bl/6J | 918 (25%) | 696 (19%) |
| DBA/2J | 438 (12%) | 1275 (35%) |
| C3H/ARC | 619 (17%) | 409 (11%) |
| BALB/c | 563 (15%) | 791 (21%) |
| C3H/HeJ | 779 (21%) | 200 (5%) |
Identification of a transcriptional program describing the core Tlr-4 dependent pathway
415 elements were identified (Table 1 Additional file: 1) as inducible in a temporally regulated manner in all four of the LPS responsive strains, but were not regulated by LPS in C3H/HeJ_Lps_ d mice. This set represents candidate targets specifically of the TLR4/MyD88/NFk B regulated signalling pathway, as the TLR4 mutation carried by these mice is known to prevent NF-Kappa B activation in response to LPS [14,16,20]. Hierarchical clustering of the core inflammatory set (Fig. 2) illustrates temporal conservation of gene induction between the responder mouse strains for most, but not all clusters of genes. Notably, DBA2 and C57Bl6J shared the most similar temporal profiles, whereas BALB/c showed a universal delay in induction of this set. Due to redundancy in the RIKEN set these 415 elements compress to 383 unique transcripts, and approximately 40% of these (146 transcripts) are uncharacterised. 237 genes were annotated as part of the following cellular processes (Fig. 3): cytoskeleton (43 genes); growth and differentiation (35 genes); phagocytosis (33 genes); cell signalling pathways (32 genes); transcription (26 genes); cytokine or chemokine (19 genes); oxidative stress (14 genes); apoptosis/anti-apoptosis (13 genes); antigen presentation (12 genes) and lipid metabolism (9 genes). All describe inducible processes known to accompany macrophage activation, but this is the first and most comprehensive assembly of the individual parts of each process in macrophage activation by LPS. The largest proportion (32%) of known genes that were induced upon LPS activation were cytoskeletal components or components of the phagosome, which correlates with the dramatic morphological changes that occur in BMM upon activation with LPS [21]. This dataset provides new candidates for the still poorly understood processes involved in changes to secretory machinery induced by activation of macrophages and dendritic cells [22].
Figure 2.
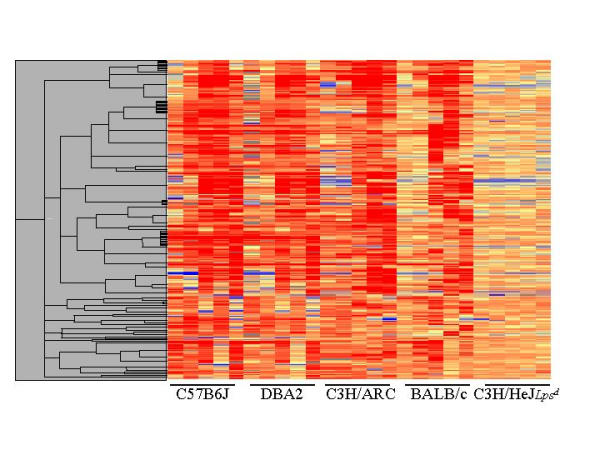
Hierarchical clustering of the core transcriptional program. Unsupervised hierarchical clustering of 415 elements that were determined to be co-induced across the time course in all responder mouse strains tested, but not in the Tlr4-null mice C3H/HeJ_lps_ d. The temporal samples (from left to right 0, 0.5, 2, 7, 21 h) for each strain are shown as columns across the X-axis, and each row on the Y-axis represents a single cDNA. The colour indicates expression levels of the cDNAs, where blue is low expression, red is high expression, and yellow is the same expression relative to the embryo control.
Figure 3.
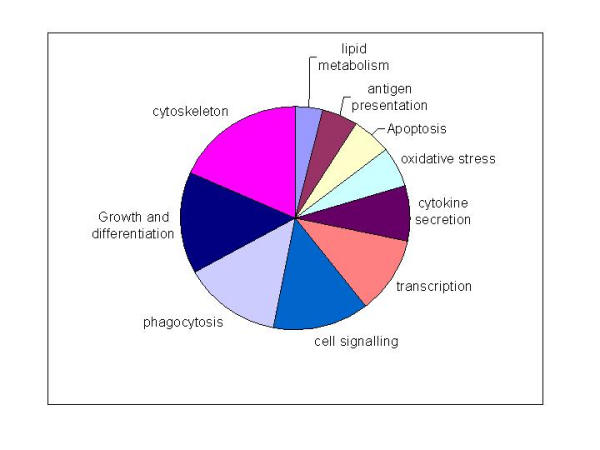
Functional classification of the core transcriptional program The core inflammatory program consisted of 383 unique transcripts including 146 with no known function. 237 known genes were annotated using GO terms, and the results displayed as a pie graph. Genes were classified into the following groups: cytoskeleton (pink, 43 genes); growth and differentiation (navy, 35 genes); phagocytosis (lavender, 33 genes); cell signalling pathways (blue, 32 genes); transcription (orange, 26 genes); cytokine or chemokine (aubergine, 19 genes); oxidative stress (aqua, 14 genes); apoptosis/ anti-apoptosis (yellow, 13 genes); antigen presentation (maroon, 12 genes) and lipid metabolism (pale blue, 9 genes).
Impact of LPS on proliferation and differentiation transcriptional programs
Macrophages were differentiated from bone marrow progenitors in vitro in the presence of CSF-1. Many in vitro studies that characterise immunological responses of macrophages are performed in the absence of CSF-1. CSF-1 is, however, constitutively present in vivo, and is further induced upon activation with LPS. CSF-1 has itself been shown to enhance the activation of some genes by LPS [18]. In vitro studies aimed at assessing macrophage activation should therefore be performed in the presence of CSF-1.
LPS has been shown to down-modulate the CSF-1 receptor, leading to growth arrest, but at the same time providing a signal favouring cell survival [18]. We looked for transcriptional evidence of this LPS modulated survival pathway in the set of transcripts conserved between the LPS-responsive mouse strains. 30 elements corresponding to 22 genes with roles in regulating growth, cell cycle and differentiation were identified as part of the conserved TLR4 dependent transcriptional pathway, and these clustered together in the earliest temporal group, induced within 30 mins (immediate – early) of LPS exposure. Amongst this set were known targets of NF-κB in human and mouse monocytes, including the anti-apoptotic genes BCL2-related protein A1 (BFL-1) [23], immediate-early gene 3 [24], Gadd45β [25,26] and myeloid cell leukaemia [27] which have been reported as mediators of cell survival upon an inflammatory stimulus. Haematopoietic growth and differentiation factors, including CSF-1, granule cell differentiation protein (gdf3), the myeloid oncogene PIM1, glia maturation factor (gmfg) and the interferon-inducible stem cell marker Ly6e were also actively induced by LPS as part of the core TLR4-mediated transcriptional program. The inclusion of fibroblast growth factor 1 (fgf1) and its intracellular binding protein (fgfbp) in this early cluster suggests a novel role for basic fibroblast growth factor in LPS mediated macrophage growth and survival. We observed little regulation of cell cycle genes early in the time course, however these were clustered together and were induced in the late temporal group. Potentially pro-apoptotic transcripts were also present in this set – 5 elements corresponding to 4 genes, although these did not cluster together. These were the Mitochondrial ribosomal protein S30 (induced late in the time course), Caspase 7, a downstream target of LPS-inducible capsase11 (induced 7 hours post-LPS), and Fas antigen (induced 2 hours post LPS-induction). Alix, (ALG-2-interacting protein X), was initially repressed at 2 hrs post-LPS, but induced by the 21 hr time point. The later induction of these elements suggests that they are induced by secondary events in the inflammatory cascade. These data are consistent with LPS activating a survival pathway in macrophages, even in the presence of CSF-1, through TLR4 signalling that is fundamentally conserved between different genetic backgrounds.
Temporal modulation of the inflammatory cascade
The examination of the gene expression profile with time provided information about clusters of genes with similar regulatory patterns and inferred functions. Figure 4 shows the principal component analysis for the core data set and summarizes the transcriptional program underlying the core inflammatory processes shared by the LPS responsive strains, further illustrated in fig. 5. The PCA analysis segregated genes induced within 30 mins (immediate-early), induced within 2 hours (early), induction peaking by 7 hrs (mid), and induction continuing across the timecourse (late). The earliest sets of genes, induced by 30 mins, activated protective mechanisms against oxidative challenge, survival/anti-apoptosis signals and cellular adhesion molecules involved in macrophage mobilization. Inflammatory mediators such as the cytokines IL-1α, IL-18, components of the complement system such as H2-Bf, and chemoattractants such as galectin-9 [28] were induced in the early and mid clusters (peaking between 2 and 7 hours post-LPS). A large cluster of elements, including arginase 1 and 2, the transcription factor Hif-1α and lysosomal enzymes cathepsin C, D, L and Z were induced rapidly, and their transcription remained elevated even at 21 hours. This temporal cluster provided the most information on pathways that feedback into the inflammatory cascade. Previous studies have indicated that LPS induces a complex transcriptional regulatory cascade leading to an adapted transcriptional steady state that depends upon continuous LPS exposure [29]. The cluster of elements expressed highly at 21 hours demonstrated the continuing amplification of the inflammatory cascade through continual exposure to LPS, and through induction of secondary autocrine factors such as TNF-alpha and nitric oxide (NO). Arginase is induced by nitric oxide [30], and acts as a negative regulator of NO synthesis by competing with inducible nitric oxide synthetase for substrate. The induction of both positive and negative regulators of inflammation demonstrated the dynamic nature of the transcriptional cascade.
Figure 4.
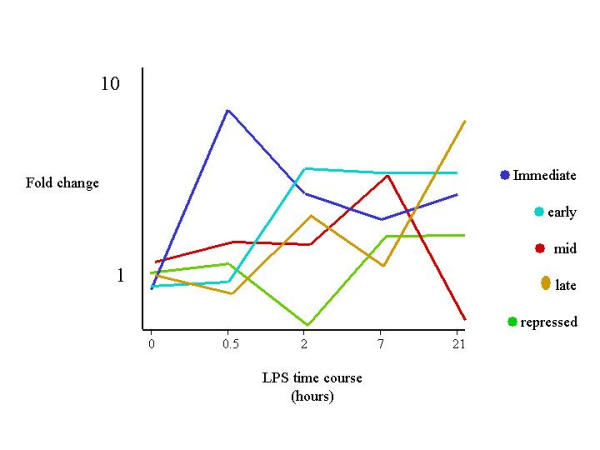
Temporal profiling of the core transcriptional program. Temporal clustering of the inflammatory template by Principal Component Analysis (PCA) revealed a highly regulated set with early (30 min–2 hours), mid (2–7 hours) and late (21 hours) onset of gene induction. Average relative intensity of expression is displayed on the Y-axis, time in hours on the x-axis.
Figure 5.
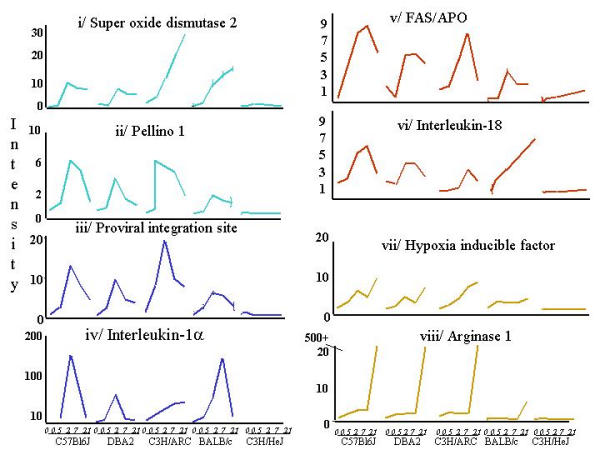
Temporal profiling of the core transcriptional program. The profiles of 8 key genes representing each temporal cluster. Immediate (30 min peak) IL1α, SOD2, Pellino and EVI Early (2 hr peak) IL18, FAS; Late (24 hr peak) Hif1α, Arginase I.
Mapping inducible transcripts to genomic clusters
LPS stimulation of the macrophages in all strains produced a very marked induction of genes with in 30 minutes of exposure. The induction of these transcripts in the LPS_d_ strain and the absence of obvious NF-k B transcription factor sites in a substantial proportion of the promoters examined (Matt Takovic, personal communication) makes it unlikely that this early gene induction phenomenon is specifically directed, but rather may be due to transitory changes in chromatin structure [31], RNA transport [32] or stability of inducible messages [33].
LPS has been reported to rapidly alter chromatin structure at the MHC locus [34], and chromatin remodelling has been shown to induce transcription of closely mapped genes [35,36]. There are many examples of functional grouping of immune related genes in the same genomic region, including the cytokine-receptor cluster on mouse chromosome 16 [37] and a group of cytokine-related genes associated with IL-4 on mouse chromosome 11 [38]. We mapped 379 of the 415 conserved LPS responsive transcripts to the mouse genome. The transcripts mapped across all 19 autosomal chromosomes, as well as the X chromosome. Transcripts grouped into clusters across most of the chromosomes, particularly Chromosomes 2 and 17 (Fig. 6 and table 2 Additional file: 2), and these genomic clusters did not segregate with the temporal expression patterns.
Figure 6.
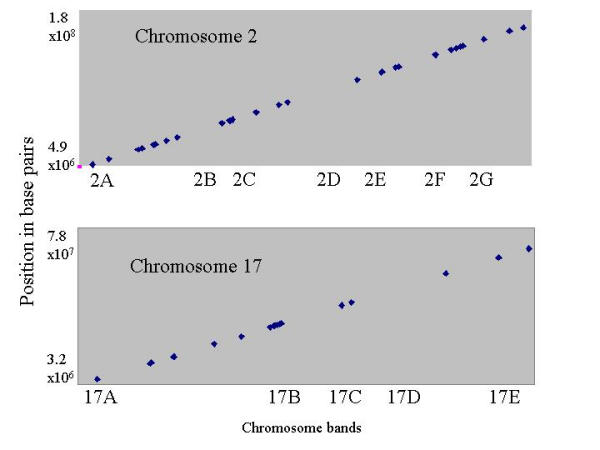
Genomic clustering of conserved LPS inducible transcripts. Full length cDNA sequences corresponding to the conserved LPS responsive set were mapped to the mouse genome using the BLAST function of the FANTOM2 server at http://fantom.gsc.riken.go.jp/viewer/ Map positions (in base pairs) were plotted against the position of chromosome band boundaries to identify sequences mapping within the same chromosomal region. Chromosomes 2 and 17 are given as examples, the remaining data may be found in the supplementary information accompanying this paper.
Most of the genes associated together in genomic groupings in this study were novel, and did not necessarily share the same temporal expression patterns. This suggests that while chromatin remodelling may contribute to rapid transcription in inducible systems, temporal regulation of at least the conserved LPS-responsive set provides evidence for specific amplification of these transcripts within the inflammatory cascade.
Strain specific sensitisation of the LPS response
LPS transcriptionally modified 800 array elements in two or more LPS-responsive strain (Fig. 7). 385 transcripts were co-regulated in two or more mouse strains, and of these 305 elements were co-responsive in DBA2 and C57Bl6/J alone. 415 transcripts were regulated in all LPS responsive strains, described above as the candidate targets of TLR4-dependant signalling. Even within this highly conserved set C57Bl6/J and DBA2 BMM were delineated particularly with a subset of 18 genes induced so rapidly that they are presumed to be direct targets of the LPS signalling cascade, evident in Fig. 2 and 5. The delayed induction of this set in C3H/ARC and BALB/c macrophages suggested that the transcripts were induced as a secondary response in these strains, implying the initial lack of a necessary signalling factor which itself was LPS inducible. Given the continuous LPS exposure in our system, it is likely that expression of this group of genes is co-dependent on both this unknown autocrine factor and LPS, and implies that C57Bl6J and DBA2 BMM were sensitised to LPS by the endogenous production of this factor. Many LPS inducible genes are known to be dependent upon priming of the cells with either type 1 or type II interferon [39]. 55 elements corresponding to 28 proteins associated with interferon signalling are present on the RIKEN 19 K array. The average profile of these interferon regulated genes in C57Bl6J and BALB/c mice is shown in figure 8, where a delay in induction from 30 mins to 7 hours is evident in the BALB/c profile. Strain specific differences in endogenous type 1 interferon production, or a downstream target of type 1 interferons could underlie the two patterns of gene induction. A knockout of the IFN-α-receptor 1 (IFNAR1) desensitises BMM to LPS-mediated growth inhibition [40] and C57Bl/6J and BALB/c differ in their ability to produce type 1 interferon in response to pathogen challenge [41-43]. Consistent with this hypothesis, 7 of the 13 interferon-responsive genes found in the conserved LPS responsive set distinguish C57Bl6/J and DBA/2 from BALB/c and C3H/ARC and include Isg20 (interferon stimulated gene (20 kD)), interferon α induced gene Ifi56 and guanylate-binding protein-2 (Gbp2) (Figure 8); Interferon-γ induced GTPase (GTPI); torsin-3, an ATP-dependent interferon responsive gene [44]; IFIT-1 and IFIT-2, a family of interferon-induced genes with tetratricopeptide repeats. Also delayed in C3H/ARC and BALB/c were Tpl2/Cot, and the NF-κB-regulated myeloid differentiation primary response gene MyD118/GADD45β, which are necessary for LPS induced proinflammatory signalling in macrophages [26,45] as well as the chemokine Ccl-6, and six ESTs with no annotated function. The interferon receptor IFNAR2 was also elevated in C57Bl6/J macrophages compared to BALB/c (Supplementary Table 2).
Figure 7.
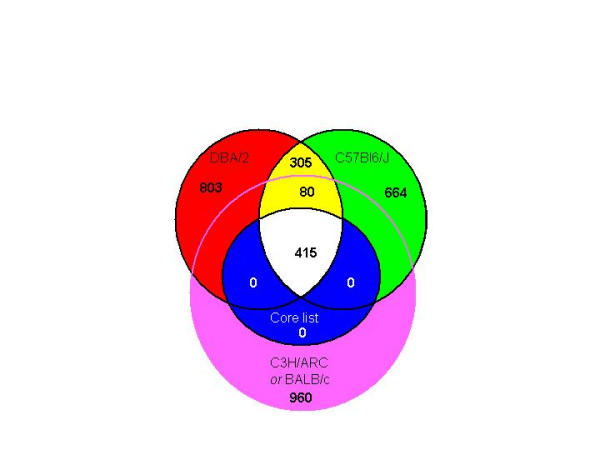
The distribution of LPS-responsive transcripts between mouse strains. Venn Diagram showing the number of LPS-responsive elements shared between the 4 LPS n mouse strains. 960 were inducible in C3H/ARC and/or BALB/c alone, 803 were expressed in DBA/2 alone and 664 were expressed in C57Bl/6J alone. 415 elements were expressed in all 4 LPS-responsive strains. 80 transcripts were expressed in 3 of the 4 LPS responsive strains, including C57Bl6J and DBA/2. 305 elements were shared only between DBA and C57Bl/6J.
Figure 8.
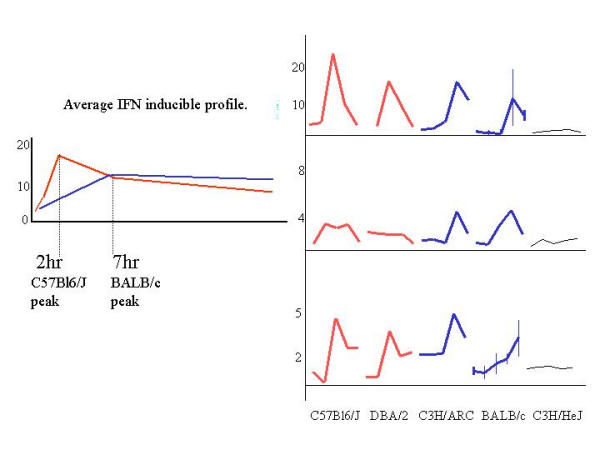
The sensitisation of interferon-responsive transcripts in C57Bl6J mice. The averaged temporal profile of 13 interferon-responsive genes compared between C57Bl/6J and BALB/c mice, where the Y axis represents the fold induction from the unstimulated timepoint and the X-Axis categorises the time points for both mouse strains. The C57Bl6/J profile (red) is induced by 2 hours, whereas the BALB/c profile is delayed at 7hours. This segregation of temporal induction was observed in 18 genes within the conserved TLR4-dependent set, and 3 examples are given: A/ Isg20; B/ Ifi56 and C/ Gbp2 for all 5 mouse strains.
Human microarray studies have shown remarkable consistencies of response between individuals to a range of PAMPs, including LPS. The massive variation that we have observed between mouse strains appears diluted in the heterogeneity of an outbred human population. One study did find a "donor variant response" among healthy individuals in a set of interferon-responsive transcripts [7]. Our data suggests that genetic variation in an autocrine factor modulating the type1 interferon signalling pathway may be critical for appropriate induction of an innate response to LPS.
Evidence for novel genetic loci underlying strain specific LPS responses
The cytokine expression profiles of stimulated T lymphocytes differ between mouse strains. Such variation led to the discovery of T helper cell phenotypes associated with cell-mediated immunity (Th1) or humoral immunity (Th2) [46]. C57Bl/6J and BALB/c are archetypal Th1 and Th2 strains respectively [47,48]. We directly compared these strains to look for transcriptional differences in the macrophage populations that may prime the nature of any subsequent Th1/Th2 polarization. This smaller, focused analysis allowed 5039 elements to pass restrictions between BALB/c and C57Bl6J across the time course and in all replicates. Of these, 436 differed significantly (p < 0.05) between the two strains (Table 3 Additional file: 3). We saw no evidence for endogenous differences in expression of known Th1/Th2-regulating cytokines IL-12 or 18, although IL-18 was induced earlier in C57Bl6J than in BALB/c (Fig. 5). In their definition of M1-M2 macrophage phenotypes, Mills et al. [47] identified the regulation of arginase as a key distinguishing factor in the propensity to bias Th1 or Th2 T-cell responses. It is the alternative metabolism of arginine to nitric oxide or ornithine that predicts M1 or M2 development. Accordingly, BALB/c and DBA/2 mice fall into the M2 class whilst C57Bl6J is an M1 strain. Arginase I and II also distinguished C57Bl/6 from BALB/c in our study. Surprisingly, arginase mRNA was induced 10–50 fold less in BALB/c macrophages than in C57Bl/6J BMM or either of the other LPS-responsive strains (Fig 5). The model proposed by Mills et al was generated on enzyme levels, where our gene expression data contradicts the M1/M2 hypothesis. Our observation that C57Bl/6J and DBA/2 have similar expression profiles, even in an unactivated state may actually reflect the fact that these two strains are genetically related [49]. These data do not support classification of DBA as an M2 strain, nor indeed the predilection for a strain based M1 or M2 bias, at least at a transcriptional level.
Several effectors of the Rac 1 activation pathway were found to be significantly up regulated in C57Bl6J compared to BALB/c, including Rac 1, the activating enzyme farnesyltransferase, and interactor Profilin. Rac1 has a role in the generation of reactive oxygen species (ROS) in phagocytic and nonphagocytic cells [50], and has been shown to activate STAT3 in response to ROS [51]. Similarly, a number of genes required for ROS induction, including cytochrome b-245 and neutrophil cytosolic factor 4 were also differentially expressed between C57Bl/6J and BALB/c macrophages. These data suggest that C57Bl6/J macrophages are more readily activated to produce cytocidal oxygen free radicals. Interestingly, the redox status of BMM has been shown by others to be critical in supporting polarization of antigen presenting cells [48]. Slc11A1 is predicted to affect redox potential through iron homeostasis in the phagosome (reviewed in [52,53]), but BALB/c and C57Bl6J share the susceptible Slc11A1 allele at the Bcg locus.
61 (12.5%) of the 436 genes differentially expressed between BALB/c and C57Bl/6J mapped to mouse chromosome 11 (Figure 9, table 4 Additional file: 4). 45% of these mapped to a single cytogenetic band, 11b. This region of mouse chromosome 11 was identified as conferring a salmonella-resistant phenotype in a study between resistant C57Bl/6J and the susceptible wild-mouse strain MOLF/Ei [54], although the mapping was of low resolution. Our data further refines the 11b locus to two regions where differentially expressed genes cluster within 10 Mb of each other (Figure 10).
Figure 9.
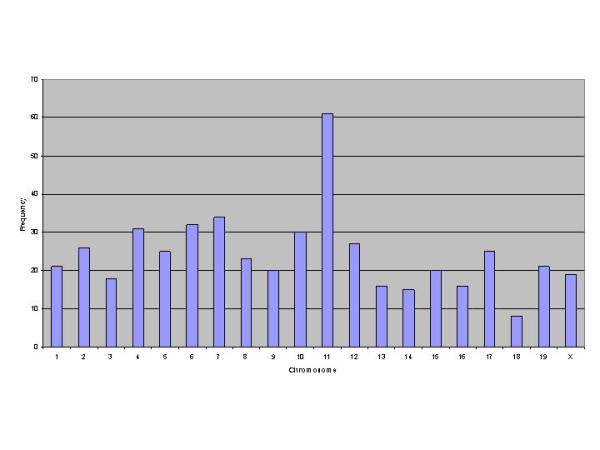
Genomic clustering of transcripts differentially expressed between C57Bl/6J and BALB/c mice. Full-length cDNA sequences corresponding to the 436 transcripts identified as significantly (p = 0.05) differentially expressed were mapped to the mouse genome using the BLAST function of the FANTOM2 server at http://fantom.gsc.riken.go.jp/viewer/. The chromosome locations are graphed as frequency (number of transcripts) vs Chromosome number.
Figure 10.
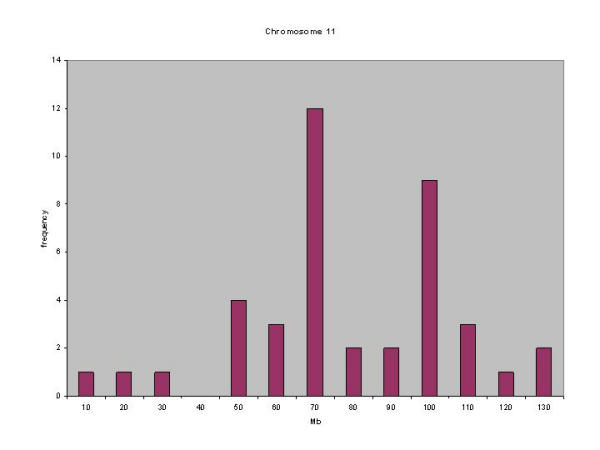
Genomic clustering of transcripts differentially expressed between C57Bl/6J and BALB/c mice. Sixty-one transcripts mapped to chromosome 11. The graph plots frequency (number of transcripts) vs Mb (x-axis).
12 candidates cluster at 70 Mb, and these include 7 novel proteins and one putative noncoding RNA. 11 of the 12 transcripts in this cluster had significantly lower expression in the Salmonella-resistant strain C57Bl/6J than in BALB/c. Profilin1 (Pfn1) was the only transcript mapping into this cluster with significantly higher expression in unstimulated C57Bl6J than BALB/c BMM, and was induced by LPS across the C57Bl6J but not BALB/c time course. Pfn1 is a cytoskeletal protein that is essential for cell survival and division and acts in a dose-dependent manner [55]. The three other known genes were Slc25a11, a mitochondrial transporter; the cell adhesion molecule vitronectin and Supt6h, a chromatin structural protein thought to regulate transcription [56]. Vitronectin is the only protein in this set with a known biology in macrophage adhesion and activation, binding plasminogen activator inhibitor 1 (PAI-1) and urokinase plasminogen activator (u-PA) [57,58], and recruiting ERK1 signalling through alpha(v)beta 3 integrin [59]. Interestingly iNOS also maps into this region, but is not present on the RIKEN 19 K arrays, and its expression may not be regulated in the absence of IFN-γ priming of the BMM [60].
9 genes clustered together around 100 Mb. This region encompasses the keratin complex 1 – a region of 9 acidic keratins, 4 of which are identified as significantly different between BALB/c and C57Bl6/J in this analysis; keratin 1, 13, 17 and 19. The remaining keratins in this complex were present on the array, but did not pass confidence criteria, particularly that of low signal threshold. Also identified in this cluster were the calcitonin receptor modifying protein 2 (Ramp2); granulin; a macropain (Psmc5); and the lymphocyte antigen CMRF35. These data suggest that the dominant genetic regions controlling LPS-induced changes in redox status lie outside the Bcg locus, and highlight new candidates for LPS/Salmonella susceptibility in a region of chromosome 11 plentiful in innate-immune mediators.
Conclusions
We provide transcriptional evidence for the enormous potential for variation in individual response to pathogen challenge, which is unsurprising given the infinitely variable and changing face of pathogens. Our data provides a description of the genetic networks activated by LPS induction in primary murine macrophages from different genetic backgrounds. The data shows the many possible transcriptional consequences of macrophage activation by LPS in a strain dependent manner. Functional conclusions drawn solely from gene expression data can be at odds with protein levels – indeed increases in gene expression can be a direct consequence of falls in corresponding protein level. We describe a conserved TLR4/MyD88/NfkB signalling cascade that is amplified at a transcriptional level over the 24 hour time course. These co-ordinately regulated transcripts provide insights into pathways that are likely to function in an innate immune context, and provide candidates for further functional analysis on individual mouse backgrounds. The differences that we have demonstrated between inbred mouse strains contrast to the stereotyped response observed in monocytes of healthy human individuals to a suite of pathogenic materials including LPS [7,8]. Nevertheless, variation in TLR4 and Slc11A1 occurs in humans and underlies susceptibility to infectious disease and arteriosclerosis [6]. The P712H Tlr4 mutation has been shown to act as a dominant negative on some mouse backgrounds (C3H/b_11_r_30_m) [61], and the degree of LPS hypo responsiveness in Tlr4 null mice may be modulated by mutations in RAN/Gtpase [62,63] on the C3H background, or in IL-12R on the C57Bl10Cr background [64]. The Tlr4 locus is clearly important in determining LPS sensitivity, but many additional genetic loci control the extent and the nature of transcriptional response promoted by LPS.
Methods
Mouse Strains
BALB/c, C3H/ARC, C57Bl/6J and DBA2 mice were sourced from the Animal Resources Center, Western Australia and housed at the SPF facility, Biological and Chemical Faculty, University of QLD, Australia. C3H/HeJ_lps_ d mice were sourced from the Walter and Eliza Hall Institute, Victoria. The Tlr4 genotype of each strain was confirmed by genomic sequencing.
All procedures were carried out under the NH&MRC guidelines for animal research; animal ethics license number IMB132/00.
Derivation and culture of BMM
Bone marrow derived macrophages were taken from the femurs of a pool of 6–8 week old male mice. Macrophages were differentiated from bone marrow progenitors in RPMI1640 (BRL), 10% FCS and 104 U/ml (100 ng/ml) recombinant human CSF-1 (a gift from Chiron, Emeryville, CA) for 6 days [65]. Specific, homogeneous differentiation of macrophages under these conditions has been well characterised by our and other laboratories [18,66-68]. Gross phenotypic changes associated with macrophage differentiation were monitored and by day 5 BMMs from all strains had become semi-adherent on bactoplastic, were of uniform size and displayed characteristic cytoplasmic and nuclear morphology. No gross differences were observed between the strains in cell yield or morphology under these controlled culture conditions. At day 6 macrophages were seeded at 1 × 10⁶ cells/ml and stimulated on the following day with 10 ng/ml LPS Salmonella minnesota (Sigma-Aldrich, St. Louis, MO). 3 × 10 cm dishes were harvested for each time point – unstimulated (time 0), 30 min, 2, 7 and 21 h. RNA was extracted using RNeasy midi kit (Qiagen) according to the manufacturers instructions. The optimal LPS dose of 10 ng/ml was determined by assaying iNOS and TNF-α production in the presence and absence of IFN-γ, where 10 ng/ml gave maximal activation in all strains, but no response in C3H/HeJLpsd mice (data not shown). Replica data was derived from independent RNA extractions of a different pool of 6–8 week old mouse femurs.
Microarray labeling, hybridizing, scanning and analysis
The experimental design, using 17.5dpc C57Bl/6J embryo as a common reference, has been described previously [19]. Briefly, cDNA was indirectly labeled with aminoallyl-conjugated Cy3 (time course) or Cy5 (embryo), and hybridized overnight to RIKEN 19,000 full-length cDNA microarrays. Slides were washed and scanned on a ScanArray 5000 confocal laser scanner. Molecularware (Digital Genome) was use to process the images, and data was corrected for local background, and confidence status flagged for empty spots, signal/noise ratio, spot CV ratio and spot morphology. Data was imported into GeneSpring4.2 (Silicon Genetics) for further filtering, clustering and comparative analysis. Hybridisations were performed in duplicate to replicate each data point, shown as an average in the figures. Each element was spotted onto the arrays once, but the redundancy in the RIKEN 19 K set provides multiple hybridisation events for many of the genes represented on the array. These are treated as separate elements in the data analysis, but do present a high level of confidence in the consistency of the hybridisation across each array. Most of the elements (80%) expressed by BMM did not alter across each time course, and many of these (>60%) did not change in expression level between mouse strains. The Global Error Model in GeneSpring4.2 (Silicon Genetics) tested each element for reproducibility against its replica hybridisation, and against the population of invariantly expressed elements on the array using a single sample t-test to generate a confidence (p) value. Microarray hybridisations are inherently noisy at signal strengths outside the linear range of detection. Elements expressed below 700 units and above 65,000 units were therefore excluded from subsequent analysis. Data was flagged for empty spots, high signal/noise ratio, aberrant spot CV ratio and abnormal spot morphology, and replica confidence (p) value of less than 0.1 (or greater than 90% confident).
Data handling and annotation of clusters
The ratio of the experimental signal/the control signal for each spot was calculated; intensity-dependent normalization was also applied, where the ratio was reduced to the residual of the Lowess fit of the intensity versus ratio curve [69]. The dataset was restricted to those spots passing confidence status on the control channel of every hybridization, across each temporal series and on 5 separate mouse strains. 3612 elements passed these criteria. Figure 1 describes the normalised distribution of elements at each time point, and for each mouse strain. A 2-fold cutoff was employed to identify elements expressed 2 standard deviations (S.D.) from the normalised population median of 1. An additional normalisation was performed to identify those elements that were temporally regulated, where at each post-lps time point the intensity of each element was divided by its average intensity at time 0. A set of genes was identified induced or repressed across the time course if they were found more than 2 S.D. from the sample-normalised population median of 1 and a list was compiled for each mouse strain. A small subset (415) of genes was identified in all 4 responder strains, but not C3H/HeJ_lps_ d. This set was clustered using the unsupervised hierarchical clustering tool in GeneSpring, where similarity was measured by Pearson correlation; the separation ratio was 0.5 and the minimum distance was 0.001. Temporally conserved profiles were identified by principle component analysis of the co-expressed subset.
441 genes were identified by Genespring4.2 as statistically different between C57Bl/6J and BALB/c (Table 3 Additional file: 3), using parametric test, variances not assumed equal (Welch t-test), p-value cutoff 0.05, where the multiple testing correction used was the Benjamini and Hochberg False Discovery Rate option. This restriction tested 5,039 genes; 153 genes had insufficient data for a comparison, and 5.0% of the identified genes could be expected to pass the restriction by chance.
Clusters of co-expressed genes were annotated using SOURCE http://genome-www5.stanford.edu/cgi-bin/SMD/source//sourceBatchSearch assisted extraction of Gene Ontologies (GO) from UniGene http://www.ncbi.nlm.nih.gov/entrez/query.fcgi?db=unigene.
Genomic analysis of LPS-inducible transcripts
Full length cDNA sequences were mapped to the mouse genome using the BLAST function of the FANTOM2 server at http://fantom.gsc.riken.go.jp/viewer/[70]. Array identifiers were first associated with their representative transcript using a local BLAST of the sequence tags from the RIKEN 19 K array and the representative transcript and protein set RTPS version 6.2. 415 RIKEN clones from the conserved TLR4 dependent set were associated with 379 representative transcripts, 35 RIKEN clones were not found in the RTPS v6.2 set. Similarly, of the 436 RIKEN clones identified as statistically different between C57Bl6/J and BALB/c mice, 347 were associated with a corresponding representative transcript, and 89 were not found in the RTPSv 6.2 set. These clones are most likely to have been excluded from the RTPS set because of sequence artefacts associated with the clones – poor available sequence, or no similarity with sequences in the EST and genomic databases, and were annotated as "unclassifiable transcripts" in the FANTOM annotation process.
The FANTOM annotation pipeline included automated mapping of each RTPS with SIM4 and blEST, which are cDNA-genome alignment programs integrated in TIGR Gene Index genomic mapping pipeline. The output used in this analysis was obtained as chromosome number, and base pair position numbered from proximal to distal. Transcript frequency was plotted against chromosome number in excel to determine distribution of transcripts across the genome (figure 8). A number of conventional mouse mapping studies have identified genetic loci associated with susceptibility to pathogens, but these have been based on cytogenetic or genetic maps rather than physical maps. The location of each transcript on its corresponding chromosome was displayed as a function of both physical position (basepairs on the y axis) and cytogenetic position (chromosome band) on the x-axis (figure 6). The number of diamonds plotted on the graph indicates frequency of transcripts at any one position.
List of Abbreviations
CSF-1 colony stimulating factor-1
GO Gene Ontology
dpc Days post coitum
LPS lipopolysaccharide
lps d Defective LPS allele
lps n Normal LPS allele
NO Nitric Oxide
PAMP pathogen associated molecular pattern
PAI-1 plasminogen activator inhibitor 1
PCA Principle Component Analysis
ROS reactive oxygen species
TLR Toll-like receptor
u-PA urokinase plasminogen activator
Authors' contributions
Christine Wells performed experimental design, collection of cell lines, manufacture of RNA and analysis & interpretation of the data, under the supervision of Professor David Hume and Professor Brandon Wainwright. Dr Timothy Ravasi performed hybridizations in the laboratory of Yasushi Okasaki, and contributed to data analysis and interpretation. Geoffrey Faulkner wrote the scripts to extract mapping information for transcripts differentially expressed between BALB/c and C57Bl/6J. He provided locus link information for mouse chromosome 11. Matthew Sweet provided RNA for the DBA/2 analysis. The microarray slides were manufactured in the laboratory of Dr Okasaki under the RIKEN Mouse Genome Encyclopedia project, which is directed by Professor Hayashazaki. The microarray clones were selected from libraries made by Dr Piero Carninci.
Supplementary Material
Additional File 1
A conserved set of 415 cDNAs, identified as candidate targets of the core TLR4/MyD88 signalling pathway, downloadable tab-delimitated text file.
Additional File 2
Mapping of the conserved LPS responsive set to the mouse genome. Tab-delimitated text file.
Additional File 3
Identification of 436 genes that differed significantly (p < 0.05) between C57Bl6/J and BALB/c inbred mouse strains. Tab-delimitated text file.
Additional File 4
Acknowledgments
Acknowledgements
The authors wish to thank Ms Anita Swallow and Ms Anne Hardacre for invaluable assistance with mouse colony management in the SPF facility, The University of QLD. Analysis of data was performed on software and computing hardware provided by the SRC for Functional and Applied Genomics, The University of QLD. Christine Wells, Timothy Ravasi and David Hume are supported by the Co-operative Research Centre for Chronic Inflammatory Diseases.
Contributor Information
Christine A Wells, Email: c.wells@imb.uq.edu.au.
Timothy Ravasi, Email: t.ravasi@imb.uq.edu.au.
Geoffrey J Faulkner, Email: s4009050@student.uq.edu.au.
Piero Carninci, Email: carninci@postman.riken.go.jp.
Yasushi Okazaki, Email: okazaki@gsc.riken.go.jp.
Yoshihide Hayashizaki, Email: yosihide@gsc.riken.go.jp.
Matthew Sweet, Email: M.Sweet@imb.uq.edu.au.
Brandon J Wainwright, Email: B.wainwright@imb.uq.edu.au.
David A Hume, Email: D.Hume@imb.uq.edu.au.
References
- Janeway CA, Jr, Medzhitov R. Introduction: The role of innate immunity in the adaptive immune response. Seminars in Immunology. 1998;10:349–350. doi: 10.1006/smim.1998.0142. [DOI] [PubMed] [Google Scholar]
- Aderem A, Ulevitch RJ. Toll-like receptors in the induction of the innate immune response. Nature. 2000;406:782–787. doi: 10.1038/35021228. [DOI] [PubMed] [Google Scholar]
- Opal SM, Gluck T. Endotoxin as a drug target. Critical care medicine. 2003;31:S57–S64. doi: 10.1097/00003246-200301001-00009. [DOI] [PubMed] [Google Scholar]
- Arbour NC, Lorenz E, Schutte BC, Zabner J, Kline JN, Jones M, Frees KL, Watt JL, Schwartz DA. TLR4 mutations are associated with endotoxin hyporesponsiveness in humans. Nature Genetics. 2000;25:187–191. doi: 10.1038/76048. [DOI] [PubMed] [Google Scholar]
- Schwartz DA. The genetics of Innate Immunity. Chest. 2002;121:62S–68S. doi: 10.1378/chest.121.3_suppl.62S. [DOI] [PubMed] [Google Scholar]
- Kiechl S, Lorenz E, Reindl M, Wiedermann CJ, Oberhollenzer F, Bonora E, Willeit J, Schwartz DA. Toll-like receptor 4 polymorphisms and atherogenesis. New England Journal of Medicine. 2002;347:185–192. doi: 10.1056/NEJMoa012673. [DOI] [PubMed] [Google Scholar]
- Boldrick JC, Alizadeh AA, Diehn M, Dudoit S, Liu CL, Belcher CE, Botstein D, Staudt LM, Brown PO, Relman DA. Stereotyped and specific gene expression programs in human innate immune responses to bacteria. PNAS. 2002;99:972–977. doi: 10.1073/pnas.231625398. [DOI] [PMC free article] [PubMed] [Google Scholar]
- Nau GJ, Richmond JFL, Schlesinger A, Jennings EG, Lander ES, Young RA. Human macrophage activation programs induced by bacterial pathogens. PNAS. 2002;99:1503–1508. doi: 10.1073/pnas.022649799. [DOI] [PMC free article] [PubMed] [Google Scholar]
- Rosenberger CM, Scott MG, Gold MR, Hancock REW, Finlay BB. Salmonella typhimurium Infection and Lipopolysaccharide Stimulation Induce Similar Changes in Macrophage Gene Expression. J Immunol. 2000;164:5894–5904. doi: 10.4049/jimmunol.164.11.5894. [DOI] [PubMed] [Google Scholar]
- Gao JJ, Diesl V, Wittmann T, Morrison DC, Ryan JL, Vogel SN, Follettie MT. Regulation of gene expression in mouse macrophages stimulated with bacterial cpG-DNA and lipopolysaccharide. Journal of Leukocyte Biology. 2002;72:1234–1245. [PubMed] [Google Scholar]
- Ravasi T, Wells CA, Forest A, Underhill DM, Wainwright BJ, Aderem A, Grimmond S, Hume DA. Generation of Diversity in the Innate Immune System: Macrophage Heterogeneity Arises from Gene-Autonomous Transcriptional Probability of Individual Inducible Genes. The Journal of Immunology. 2002;168:44–50. doi: 10.4049/jimmunol.168.1.44. [DOI] [PubMed] [Google Scholar]
- Govoni G, Vidal S, Gauthier S, Skamene E, Malo D, Gros P. The Bcg/Ity/Lsh locus: genetic transfer of resistance to infections in C57BL/6J mice transgenic for the Nramp1 Gly169 allele. Infect Immun. 1996;64:2923–2929. doi: 10.1128/iai.64.8.2923-2929.1996. [DOI] [PMC free article] [PubMed] [Google Scholar]
- Wardrop SL, Wells C, Ravasi T, Hume DA, Richardson DR. Induction of Nramp2 in activated mouse macrophages is dissociated from regulation of the Nramp1, classical inflammatory genes, and genes involved in iron metabolism. J Leukoc Biol. 2002;71:99–106. [PubMed] [Google Scholar]
- Poltorak A, He X, Smirnova I, Liu M-Y, Huffel CV, Du X, Birdwell D, Alejos E, Silva M, Galanos C, Freudenberg M, Ricciardi-Castagnoli P, Layton B, Beutler B. Defective LPS Signaling in C3H/HeJ and C57BL/10ScCr Mice: Mutations in Tlr4 Gene. Science. 1998;282:2085–2088. doi: 10.1126/science.282.5396.2085. [DOI] [PubMed] [Google Scholar]
- Xu Y, Tao X, Shen B, Horng T, Medzhitov R, Manley JL, Tong L. Structural basis for signal transduction by the Toll/interleukin-1 receptor domains. Nature. 2000;408:111–115. doi: 10.1038/35047056. [DOI] [PubMed] [Google Scholar]
- Hirschfeld M, Ma Y, Weis JH, Vogel SN, Weis JJ. Cutting Edge: Repurification of Lipopolysaccharide Eliminates Signaling Through Both Human and Murine Toll-Like Receptor 2. J Immunol. 2000;165:618–622. doi: 10.4049/jimmunol.165.2.618. [DOI] [PubMed] [Google Scholar]
- Wells CA, Ravasi T, Sultana R, Yagi K, Carinci P, Bono H, Faulkner G, Okazaki Y, Quackenbush J, Hume DA, Members RGG, Lyons PA. Continued discovery of transcriptional units expressed in cells of the mouse mononuclear phagocyte lineage. Genome Research. [DOI] [PMC free article] [PubMed]
- Sweet MJ, Campbell CC, Sester DP, Xu D, McDonald RC, Stacey KJ, Hume DA, Liew FY. Colony-Stimulating Factor-1 Suppresses Responses to CpG DNA and Expression of Toll-Like Receptor 9 but Enhances Responses to Lipopolysaccharide in Murine Macrophages. The Journal of Immunology. 2002;168:392–399. doi: 10.4049/jimmunol.168.1.392. [DOI] [PubMed] [Google Scholar]
- Miki R, Kadota K, Bono H, Mizuno Y, Tomaru Y, Carninci P, Itoh M, Shibata K, Kawai J, Konno H, Watanabe S, Sato K, Tokusumi Y, Kikuchi N, Ishii Y, Hamaguchi Y, Nishizuka I, Goto H, Nitanda H, Satomi S, Yoshiki A, Kusakabe M, DeRisi JL, Eisen MB, Iyer VR, Brown PO, Muramatsu M, Shimada H, Okazaki Y, Hayashizaki Y. Delineating developmental and metabolic pathways in vivo by expression profiling using the RIKEN set of 18,816 full-length enriched mouse cDNA arrays. Proceedings of the National Academy of Science, USA. 2001;98:2199–2204. doi: 10.1073/pnas.041605498. [DOI] [PMC free article] [PubMed] [Google Scholar]
- Thieblemont N, Wright SD. Transport of Bacterial Lipopolysaccharide to the Golgi Apparatus. Journal of Experimental Medicine. 1999;190:523–534. doi: 10.1084/jem.190.4.523. [DOI] [PMC free article] [PubMed] [Google Scholar]
- Shurety W, Merino-Trigo A, Brown D, Hume DA, Stow JL. Localization and post-Golgi trafficking of tumor necrosis factor-alpha in macrophages. J Interferon Cytokine Res. 2000;20:427–438. doi: 10.1089/107999000312379. [DOI] [PubMed] [Google Scholar]
- Pagan JK, Wylie FG, Joseph S, Widberg C, Bryant NJ, James DE, Stow JL. The t-SNARE Syntaxin 4 Is Regulated during Macrophage Activation to Function in Membrane Traffic and Cytokine Secretion. Current Biology. 2003;13:156–160. doi: 10.1016/S0960-9822(03)00006-X. [DOI] [PubMed] [Google Scholar]
- Orlofsky A, Weiss LM, Kawachi N, Prystowsky MB. Deficiency in the Anti-Apoptotic Protein A1-a Results in a Diminished Acute Inflammatory Response. J Immunol. 2002;168:1840–1846. doi: 10.4049/jimmunol.168.4.1840. [DOI] [PubMed] [Google Scholar]
- Wu MX, Ao Z, Prasad KVnS, Wu R, Schlossman SF. IEX-1L, an Apoptosis Inhibitor Involved in NF-{kappa}B-Mediated Cell Survival. Science. 1998;281:998–1001. doi: 10.1126/science.281.5379.998. [DOI] [PubMed] [Google Scholar]
- De Smaele E, Zazzeroni F, Papa S, Nguyen D, Jin R, Jones J, Cong R, Franzoso G. Induction of gadd45 by NF-B downregulates pro-apoptotic JNK signalling. Nature. 2001;414:308–313. doi: 10.1038/35104560. [DOI] [PubMed] [Google Scholar]
- Jin R, De Smaele E, Zazzeroni F, Nguyen DU, Papa S, Jones J, Cox C, Gelinas C, Franzoso G. Regulation of the gadd45beta promoter by NF-kappaB. DNA Cell Biol. 2002;21:491–503. doi: 10.1089/104454902320219059. [DOI] [PubMed] [Google Scholar]
- Derenne S, Monia B, Dean NM, Taylor JK, Rapp M-J, Harousseau J-L, Bataille R, Amiot M. Antisense strategy shows that Mcl-1 rather than Bcl-2 or Bcl-xL is an essential survival protein of human myeloma cells. Blood. 2002;100:194–199. doi: 10.1182/blood.V100.1.194. [DOI] [PubMed] [Google Scholar]
- Matsumoto R, Hirashima M, Kita H, Gleich GJ. Biological Activities of Ecalectin: A Novel Eosinophil-Activating Factor. J Immunol. 2002;168:1961–1967. doi: 10.4049/jimmunol.168.4.1961. [DOI] [PubMed] [Google Scholar]
- Hume DA, Underhill DM, Sweet MJ, Ozinsky AO, Liew FY, Aderem A. Macrophages exposed continuously to lipopolysaccharide and other agonists that act via toll-like receptors exhibit a sustained and additive activation state. BMC Immunol. 2001;2:11. doi: 10.1186/1471-2172-2-11. [DOI] [PMC free article] [PubMed] [Google Scholar]
- Munder M, Eichmann K, Moran JM, Centeno F, Soler G, Modolell M. Th1/Th2-Regulated Expression of Arginase Isoforms in Murine Macrophages and Dendritic Cells. J Immunol. 1999;163:3771–3777. [PubMed] [Google Scholar]
- Horn PJ, Peterson CL. Chromatin higher order folding: wrapping up transcription. Science. 2002;297:1824–1827. doi: 10.1126/science.1074200. [DOI] [PubMed] [Google Scholar]
- Jackson DA, Pombo A, Iborra F. The balance sheet for transcription: an analysis of nuclear RNA metabolism in mammalian cells. FASEB J. 2000;14:242–254. [PubMed] [Google Scholar]
- Raghavan A, Ogilvie RL, Reilly C, Abelson ML, Raghavan S, Vasdewani J, Krathwohl M, Bohjanen PR. Genome-wide analysis of mRNA decay in resting and activated primary human T lymphocytes. Nucl Acids Res. 2002;30:5529–5538. doi: 10.1093/nar/gkf682. [DOI] [PMC free article] [PubMed] [Google Scholar]
- Donev R, Horton R, Beck S, Doneva T, Vatcheva R, Bowen WR, Sheer D. Recruitment of Heterogeneous Nuclear Ribonucleoprotein A1 in Vivo to the LMP/TAP Region of the Major Histocompatibility Complex. J Biol Chem. 2003;278:5214–5226. doi: 10.1074/jbc.M206621200. [DOI] [PubMed] [Google Scholar]
- Magner WJ, Kazim AL, Stewart C, Romano MA, Catalano G, Grande C, Keiser N, Santaniello F, Tomasi TB. Activation of MHC Class I, II, and CD40 Gene Expression by Histone Deacetylase Inhibitors. J Immunol. 2000;165:7017–7024. doi: 10.4049/jimmunol.165.12.7017. [DOI] [PubMed] [Google Scholar]
- Johnson DR. Locus-Specific Constitutive and Cytokine-Induced HLA Class I Gene Expression. J Immunol. 2003;170:1894–1902. doi: 10.4049/jimmunol.170.4.1894. [DOI] [PubMed] [Google Scholar]
- Hardy M, Sanij E, Hertzog P, Owczarek C. Characterisation and transcriptional analysis of the mouse Chromosome 16 cytokine receptor gene cluster. Mammalian Genome. 2003;14:105–118. doi: 10.1007/s00335-002-2225-0. [DOI] [PubMed] [Google Scholar]
- Wenderfer SE, Slack , Jay P, McCluskey , Scott T, Monaco JJ. Identification of 40 Genes on a 1-Mb Contig around the IL-4 Cytokine Family Gene Cluster on Mouse Chromosome 11. Genomics. 2000;63:354–373. doi: 10.1006/geno.1999.6100. [DOI] [PubMed] [Google Scholar]
- Sweet MJ, Hume DA. Endotoxin signal transduction in macrophages. J Leukoc Biol. 1996;60:8–26. doi: 10.1002/jlb.60.1.8. [DOI] [PubMed] [Google Scholar]
- Hamilton JA, Whitty G, Kola I, Hertzog P. Endogenous IFN-alpha beta suppresses colony-stimulating factor (CSF)-1-stimulated macrophage DNA synthesis and mediates inhibitory effects of lipopolysaccharide and TNF-alpha. Journal of Immunology. 1996;156:5223–5227. [PubMed] [Google Scholar]
- De Maeyer E, De Maeyer-Guignard J, Bailey D. Effect of mouse genotype on interferon production. I. Lines congenic at the If-1 locus. Immunogenetics. 1975;1:438–443. [Google Scholar]
- De Maeyer E, Jullien P, J DM-G, Demant P. Effect of mouse genotype on interferon production. II. Distribution of If-1 alleles among inbred strains and transfer of phenotype by grafting bone marrow cells. Immunogenetics. 1975;2:151–160. [Google Scholar]
- De Maeyer E, De Maeyer-Guignard J, Hall W, Bailey D. A locus affecting circulating interferon levels induced by mouse mammary tumour virus. J Gen Virol. 1974;23:209–211. doi: 10.1099/0022-1317-23-2-209. [DOI] [PubMed] [Google Scholar]
- Dron M, Meritet JF, Dandoy-Dron F, Meyniel J-P, Maury C, Tovey MG. Molecular Cloning of ADIR, a Novel Interferon Responsive Gene Encoding a Protein Related to the Torsins. Genomics. 2002;79:315–325. doi: 10.1006/geno.2002.6709. [DOI] [PubMed] [Google Scholar]
- Eliopoulos AG, Dumitru CD, Wang C-C, Cho J, Tsichlis PN. Induction of COX-2 by LPS in macrophages is regulated by Tpl2-dependent CREB activation signals. EMBO J. 2002;21:4831–4840. doi: 10.1093/emboj/cdf478. [DOI] [PMC free article] [PubMed] [Google Scholar]
- Mosmann T, Cherwinski H, Bond M, Giedlin M, Coffman R. Two types of murine helper T cell clone. I. Definition according to profiles of lymphokine activities and secreted proteins. J Immunol. 1986;136:2348–2357. [PubMed] [Google Scholar]
- Mills CD, Kincaid K, Alt JM, Heilman MJ, Hill AM. M-1/M-2 macrophages and the Th1/Th2 paradigm. The Journal of Immunology. 2000;164:6166–6173. doi: 10.4049/jimmunol.164.12.6166. [DOI] [PubMed] [Google Scholar]
- Murata Y, Shimamura T, Hamuro J. The polarization of Th1/Th2 balance is dependent on the intracellular thiol redox status of macrophages due to the distinctive cytokine production. Int Immunol. 2002;14:201–212. doi: 10.1093/intimm/14.2.201. [DOI] [PubMed] [Google Scholar]
- Beck JA, Lloyd S, Hafezparast M, Lennon-Pierce M, Eppig JT, Festing MFW, Fisher EMC. Genealogies of mouse inbred strains. Nature Genetics. 2000;24:23–25. doi: 10.1038/71641. [DOI] [PubMed] [Google Scholar]
- Kheradmand F, Werner E, Tremble P, Symons M, Werb Z. Role of Rac1 and Oxygen Radicals in Collagenase-1 Expression Induced by Cell Shape Change. Science. 1998;280:898–902. doi: 10.1126/science.280.5365.898. [DOI] [PubMed] [Google Scholar]
- Sundaresan M, Yu Z-X, Ferrans VJ, Sulciner DJ, Gutkind JS, Irani K, Goldschmidt-Clermont PJ, Finkel T. Regulation of reactive-oxygen species generation in fibroblasts by Rac1. Biochemical Journal. 1996;318:379–382. doi: 10.1042/bj3180379. [DOI] [PMC free article] [PubMed] [Google Scholar]
- Barton C, Biggs T, Baker S, Bowen H, Atkinson P. Nramp1: a link between intracellular iron transport and innate resistance to intracellular pathogens. J Leukoc Biol. 1999;66:757–762. doi: 10.1002/jlb.66.5.757. [DOI] [PubMed] [Google Scholar]
- Wyllie S, Seu P, Goss JA. The natural resistance-associated macrophage protein 1 Slc11a1 (formerly Nramp1) and iron metabolism in macrophages. Microbes and Infection. 2002;4:351–359. doi: 10.1016/S1286-4579(02)01548-4. [DOI] [PubMed] [Google Scholar]
- Sebastiani G, Olien L, Gauthier S, Skamene E, Morgan K, Gros P, Malo D. Mapping of Genetic Modulators of Natural Resistance to Infection withSalmonella typhimuriumin Wild-Derived Mice. Genomics. 1998;47:180–186. doi: 10.1006/geno.1997.5116. [DOI] [PubMed] [Google Scholar]
- Witke W, Sutherland JD, Sharpe A, Arai M, Kwiatkowski DJ. Profilin I is essential for cell survival and cell division in early mouse development. PNAS. 2001;98:3832–3836. doi: 10.1073/pnas.051515498. [DOI] [PMC free article] [PubMed] [Google Scholar]
- Chiang P-W, Wang S, Smithivas P, Song W-J, Ramamoorthy S, Hillman J, Puett S, Van Keuren ML, Crombez E, Kumar A. Identification and Analysis of the Human and Murine Putative Chromatin Structure Regulator SUPT6H andSupt6h. Genomics. 1996;34:328–333. doi: 10.1006/geno.1996.0294. [DOI] [PubMed] [Google Scholar]
- Kjoller L, Kanse SM, Kirkegaard T, Rodenburg KW, Ronne E, Goodman SL, Preissner KT, Ossowski L, Andreasen PA. Plasminogen Activator Inhibitor-1 Represses Integrin- and Vitronectin-Mediated Cell Migration Independently of Its Function as an Inhibitor of Plasminogen Activation. Experimental Cell Research. 1997;232:420–429. doi: 10.1006/excr.1997.3540. [DOI] [PubMed] [Google Scholar]
- May AE, Kanse SM, Lund LR, Gisler RH, Imhof BA, Preissner KT. Urokinase Receptor (CD87) Regulates Leukocyte Recruitment via beta 2 Integrins In Vivo. J Exp Med. 1998;188:1029–1037. doi: 10.1084/jem.188.6.1029. [DOI] [PMC free article] [PubMed] [Google Scholar]
- Roberts MS, Woods AJ, Shaw PE, Norman JC. ERK1 Associates with alpha vbeta 3 Integrin and Regulates Cell Spreading on Vitronectin. J Biol Chem. 2003;278:1975–1985. doi: 10.1074/jbc.M208607200. [DOI] [PubMed] [Google Scholar]
- Lowenstein C, Alley E, Raval P, Snowman A, Snyder S, Russell S, Murphy W. Macrophage Nitric Oxide Synthase Gene: Two Upstream Regions Mediate Induction by Interferon {gamma} and Lipopolysaccharide. PNAS. 1993;90:9730–9734. doi: 10.1073/pnas.90.20.9730. [DOI] [PMC free article] [PubMed] [Google Scholar]
- Vogel SN, Johnson D, Perera P-Y, Medvedev A, Lariviere L, Qureshi ST, Malo D. Cutting Edge: Functional Characterization of the Effect of the C3H/HeJ Defect in Mice that Lack an Lpsn Gene: In Vivo Evidence for a Dominant Negative Mutation. J Immunol. 1999;162:5666–5670. [PubMed] [Google Scholar]
- Yuan Q, Zhao F, Chung S-W, Fan P, Sultzer BM, Kan YW, Wong PMC. Dominant negative down-regulation of endotoxin-induced tumor necrosis factor alpha production by Lps(d)/Ran. Proceedings of the National Academy of Science, USA. 2000;97:2852–2857. doi: 10.1073/pnas.040567797. [DOI] [PMC free article] [PubMed] [Google Scholar]
- Wong PMC, Yuan Q, Chen H, Sultzer BM, Chung S-W. A Single Point Mutation at the 3'-Untranslated Region of Ran mRNA Leads to Profound Changes in Lipopolysaccharide Endotoxin-mediated Responses. J Biol Chem. 2001;276:33129–33138. doi: 10.1074/jbc.M105400200. [DOI] [PubMed] [Google Scholar]
- Poltorak A, Merlin T, Nielsen PJ, Sandra O, Smirnova I, Schupp I, Boehm T, Galanos C, Freudenberg MA. A Point Mutation in the IL-12R{beta}2 Gene Underlies the IL-12 Unresponsiveness of Lps-Defective C57BL/10ScCr Mice. J Immunol. 2001;167:2106–2111. doi: 10.4049/jimmunol.167.4.2106. [DOI] [PubMed] [Google Scholar]
- Stacey KJ, Nagamine Y, Hume DA. RNA synthesis inhibition stabilises urokinase mRNA in macrophages. FEBS Lett. 1994;356:311–313. doi: 10.1016/0014-5793(94)01294-6. [DOI] [PubMed] [Google Scholar]
- Tushinski RJ, Oliver IT, Guilbert LJ, Tynan PW, Warner JR, ER. S. Survival of mononuclear phagocytes depends on a lineage-specific growth factor that the differentiated cells selectively destroy. Cell. 1982;28:71–81. doi: 10.1016/0092-8674(82)90376-2. [DOI] [PubMed] [Google Scholar]
- Hume DA, Gordon S. Optimal conditions for proliferation of bone marrow-derived mouse macrophages in culture: the roles of CSF-1, serum, Ca2+, and adherence. J Cell Physiol. 1983;117:189–194. doi: 10.1002/jcp.1041170209. [DOI] [PubMed] [Google Scholar]
- Sester DP, Beasley SJ, Sweet MJ, Fowles LF, Cronau SL, Stacey KJ, Hume DA. Bacterial/CpG DNA Down-Modulates Colony Stimulating Factor-1 Receptor Surface Expression on Murine Bone Marrow-Derived Macrophages with Concomitant Growth Arrest and Factor-Independent Survival. The Journal of Immunology. 1999;163:6541–6550. [PubMed] [Google Scholar]
- Smyth GK, Yang YH, Speed T. Statistical Issues in cDNA microarray data analysis. In: Brownstein MJ, Khodursky AB, editor. Functional Genomics: Methods and Protocols. Totowa, NJ: Humana Press; 2002. [Google Scholar]
- Okazaki Y, Furuno M, Kasukawa T, Adachi J, Bono H, Kondo S, Nikaido I, Osato N, Saito R, Suzuki H, Yamanaka I, Kiyosawa H, Yagi K, Tomaru Y, Hasegawa Y, Nogami A, Schonbach C, Gojobori T, Baldarelli R, Hill DP, Bult C, Hume DA, Quackenbush J, Schriml LM, Kanapin A, Matsuda H, Batalov S, Beisel KW, Blake JA, Bradt D, Brusic V, Chothia C, Corbani LE, Cousins S, Dalla E, Dragani TA, Fletcher CF, Forrest A, Frazer KS, Gaasterland T, Gariboldi M, Gissi C, Godzik A, Gough J, Grimmond S, Gustincich S, Hirokawa N, Jackson IJ, Jarvis ED, Kanai A, Kawaji H, Kawasawa Y, Kedzierski RM, King BL, Konagaya A, Kurochkin IV, Lee Y, Lenhard B, Lyons PA, Maglott DR, Maltais L, Marchionni L, McKenzie L, Miki H, Nagashima T, Numata K, Okido T, Pavan WJ, Pertea G, Pesole G, Petrovsky N, Pillai R, Pontius JU, Qi D, Ramachandran S, Ravasi T, Reed JC, Reed DJ, Reid J, Ring BZ, Ringwald M, Sandelin A, Schneider C, Semple CA, Setou M, Shimada K, Sultana R, Takenaka Y, Taylor MS, Teasdale RD, Tomita M, Verardo R, Wagner L, Wahlestedt C, Wang Y, Watanabe Y, Wells C, Wilming LG, Wynshaw-Boris A, Yanagisawa M, et al. Analysis of the mouse transcriptome based on functional annotation of 60,770 full-length cDNAs. Nature. 2002;420:563–573. doi: 10.1038/nature01266. [DOI] [PubMed] [Google Scholar]
Associated Data
This section collects any data citations, data availability statements, or supplementary materials included in this article.
Supplementary Materials
Additional File 1
A conserved set of 415 cDNAs, identified as candidate targets of the core TLR4/MyD88 signalling pathway, downloadable tab-delimitated text file.
Additional File 2
Mapping of the conserved LPS responsive set to the mouse genome. Tab-delimitated text file.
Additional File 3
Identification of 436 genes that differed significantly (p < 0.05) between C57Bl6/J and BALB/c inbred mouse strains. Tab-delimitated text file.
Additional File 4