Highly Sensitive Method for Genomewide Detection of Allelic Composition in Nonpaired, Primary Tumor Specimens by Use of Affymetrix Single-Nucleotide–Polymorphism Genotyping Microarrays (original) (raw)
Abstract
Loss of heterozygosity (LOH), either with or without accompanying copy-number loss, is a cardinal feature of cancer genomes that is tightly linked to cancer development. However, detection of LOH is frequently hampered by the presence of normal cell components within tumor specimens and the limitation in availability of constitutive DNA. Here, we describe a simple but highly sensitive method for genomewide detection of allelic composition, based on the Affymetrix single-nucleotide–polymorphism genotyping microarray platform, without dependence on the availability of constitutive DNA. By sensing subtle distortions in allele-specific signals caused by allelic imbalance with the use of anonymous controls, sensitive detection of LOH is enabled with accurate determination of allele-specific copy numbers, even in the presence of up to 70%–80% normal cell contamination. The performance of the new algorithm, called “AsCNAR” (allele-specific copy-number analysis using anonymous references), was demonstrated by detecting the copy-number neutral LOH, or uniparental disomy (UPD), in a large number of acute leukemia samples. We next applied this technique to detection of UPD involving the 9p arm in myeloproliferative disorders (MPDs), which is tightly associated with a homozygous JAK2 mutation. It revealed an unexpectedly high frequency of 9p UPD that otherwise would have been undetected and also disclosed the existence of multiple subpopulations having distinct 9p UPD within the same MPD specimen. In conclusion, AsCNAR should substantially improve our ability to dissect the complexity of cancer genomes and should contribute to our understanding of the genetic basis of human cancers.
Genomewide detection of loss of heterozygosity (LOH), as well as copy-number (CN) alterations in cancer genomes, has drawn recent attention in the field of cancer genetics,1–3 because LOH has been closely related to the pathogenesis of cancers, in that it is a common mechanism for inactivation of tumor suppressor genes in Knudson’s paradigm.4 Moreover, the recent discovery of the activating Janus kinase 2 gene (JAK2 [MIM *147796]) mutation that is tightly associated with the common 9p LOH with neutral CNs, or uniparental disomy (UPD), in myeloproliferative disorders (MPDs)5–8 uncovered a new paradigm—that a dominant oncogenic mutation may be further potentiated by duplication of the mutant allele and/or exclusion of the wild-type allele—underscoring the importance of simultaneous CN detection with LOH analysis. On this point, Affymetrix GeneChip SNP-detection arrays, originally developed for large-scale SNP typing,9 provide a powerful platform for both genomewide LOH analysis and CN detection.10–12 On this platform, the use of large numbers of SNP-specific probes showing linear hybridization kinetics allows not only for high-resolution LOH analysis at ∼2,500–150,000 heterozygous SNP loci but also for accurate determination of the CN state at each LOH region.12–14 Unfortunately, however, the sensitivity of the currently available algorithm for LOH detection by use of SNP arrays may be greatly reduced when they are applied to primary tumor specimens that are frequently heterogeneous and contain significant normal cell components.
In this article, we describe a simple but highly sensitive method to detect allelic dosage (CNs) in primary tumor specimens on a GeneChip platform, with its validations, and some interesting applications to the analyses of primary hematological tumor samples. It does not require paired constitutive DNA of tumor specimens or a large set of normal reference samples but uses only a small number of anonymous controls for accurate determination of allele-specific CN (AsCN) even in the presence of significant proportions of normal cell components, thus enabling reliable genomewide detection of LOH in a wide variety of primary cancer specimens.
Material and Methods
Samples and Microarray Analysis
Genomic DNA extracted from a lung cancer cell line (NCI-H2171) was intentionally mixed with DNA from its paired lymphoblastoid cell line (LCL) (NCI-BL2171) to generate a dilution series, in which tumor contents started at 10% and increased by 10% up to 90%. The ratios of admixture were validated using measurements of a microsatellite (D3S1279) within a UPD region on chromosome 3 (data not shown). The nine mixed samples, together with nonmixed original DNAs (0% and 100% tumor contents), were analyzed with GeneChip 50K Xba SNP arrays (Affymetrix). Microarray data corresponding to 5%, 15%, 25%,…, and 95% tumor content were interpolated by linearly superposing two adjacent microarray data sets after adjusting the mean array signals of the two sets. Both cell lines were obtained from the American Type Culture Collection (ATCC). Genomic DNA was also extracted from 85 primary leukemia samples, including 39 acute myeloid leukemia (AML [MIM #601626]) samples and 46 acute lymphoblastic leukemia (ALL) samples, and was subjected to analysis with 50K Xba SNP arrays. Of the 85 samples, 34 were analyzed with their matched complete-remission bone marrow samples. DNA from 53 MPD samples—13 polycythemia vera (PV [MIM #263300]), 21 essential thrombocythemia (ET [MIM #187950]), and 19 idiopathic myelofibrosis (IMF [MIM #254450])—43 of which had been studied for JAK2 mutations,8 were also analyzed with 50K Xba SNP arrays. Microarray analyses were performed according to the manufacturer’s protocol,15 except with the use of LA Taq (Takara) for adaptor-mediated PCR. Also, DNA from 96 normal volunteers was used for the analysis. All clinical specimens were made anonymous and were incorporated into this study in accordance with the approval of the institutional review boards of the University of Tokyo and Harvard Medical School.
AsCN Analyses Using Anonymous Control Samples (AsCNAR)
SNP typing on the GeneChip platform uses two discrete sets of SNP-specific probes, which are arbitrarily but consistently named “type _A_” and “type _B_” SNPs, at every SNP locus, each consisting of an equal number of perfectly matched probes (PM_A_s or PM_B_s) and mismatched probes (MM_A_s or MM_B_s). For AsCN analysis, the sums of perfectly matched probes (PM_A_s or PM_B_s) for the i_th SNP locus in the tumor (tum) sample and reference samples (ref1, ref2,…, ref_N),

and

are compared separately at each SNP locus, according to the concordance of the SNP calls in the tumor sample (O tum i) and the SNP calls in a given reference sample (O refI i),

and the total CN ratio is calculated as follows:

For CN estimations, however, R refI AB,i, R refI A,i, and R refI B,i are biased by differences in mean array signals and different PCR conditions between the tumor sample and each reference sample and need to be compensated for these effects to obtain their adjusted values  ,
,  , and
, and  , respectively (appendix A).16
These values are next averaged over the references that have a concordant genotype for each SNP in a given set of references (K), and we obtain  ,
,  , and
, and  . Note that
  and
and  are calculated only for heterozygous SNPs in the tumor sample (see appendix A for more details).
A provisional total CN profile Λ_K_ is provided by
and provisional AsCN profiles are obtained by

These provisional analyses, however, assume that the tumor genome is diploid and has no gross CN alterations, when the coefficients are calculated in regressions. In the next step, the regressions are iteratively performed using a diploid region that is truly or is expected to be diploid, to determine the coefficients on the basis of the provisional total CN, and then the CNs are recalculated.
Finally, the optimized set of references is selected that minimizes the SD of total CN at the diploid region by stepwise reference selection, as described in appendix A. Allele-specific analysis using a constitutive reference, refSelf, is provided by
and
Computational details of AsCNAR are provided in appendix A.
Comparison with Other Algorithms
dChip,17 and PLASQ,18 were downloaded from their sites, and the identical microarray data were analyzed using these programs. Since PLASQ requires both Xba and Hind array data, microarray data of mixed tumor contents for Hind arrays were simulated by linearly superimposing the tumor cell line (NCI-H2171) and LCL (NCI-BL2171) data at indicated proportions.
Statistical Analysis
Significance of the presence of allelic imbalance (AI) in a given region, Γ, called as having AI by the hidden Markov model (HMM), was statistically tested by calculating t statistics for the difference in AsCNs,  , between Γ and a normal diploid region, where the tests were unilateral. Significance between the numbers of UPDs detected by the SNP call–based method and by AsCNAR was tested by one-tailed binominal tests. P values for AI detection by allele-specific PCR were calculated by one-tailed t tests, comparing triplicates of the target sample and triplicates of five normal samples that have heterozygous alleles in the SNP.
Detection of the JAK2 Mutation and Measurements of Relative Allele Doses
The JAK2 V617F mutation was examined by a restriction enzyme–based analysis, in which PCR-amplified JAK2 exon 12 fragments were digested with _Bsa_XI, and the presence of the undigested fragment was examined by gel electrophoresis.5 Relative allele dose between wild-type and mutated JAK2 was determined by measuring allele-specific PCR products for wild-type and mutated JAK2 alleles by capillary electrophoresis by use of the 3100 Genetic Analyzer (Applied Biosystems), as described in the literature.19 Likewise, the fraction of tumor components having 9p and other UPDs was measured by either allele-specific PCR or STR PCR,7,19 by use of the primers provided in appendix B. The percentage of UPD-positive cells (%UPD(+)) was also estimated as the mean difference of AsCNs for heterozygous SNPs within the UPD region divided by that for homozygous SNPs within an arbitrary selected normal region:

where AsCNs for the denominator were calculated as if the homozygous SNPs were heterozygous. However, in those samples with a high percentage of UPD-positive components, the heterozygous SNP rate in the UPD region decreased. For such regions, we calculated the percentage of UPD-positive cells by randomly selecting 30% (the mean heterozygous SNP call rate for this array) of all the SNPs therein and by assuming that they were heterozygous SNPs. Cellular composition of JAK2 wild-type (wt) and mutant (mt) homozygotes (wt/wt and mt/mt) and heterozygotes (wt/mt) in each MPD specimen was estimated assuming that all UPD components are homozygous for the JAK2 mutation. The fractions of the wt/mt heterozygotes in cases with a 9p gain were estimated assuming that the duplicated 9p alleles had the JAK2 mutation. Throughout the calculations, small negative values for wt/mt were disregarded.
FISH
FISH analysis was performed according to the previously published method, to confirm the absolute total CNs in NCI-H2171.20 The genomic probes were generated by whole-genome amplification of FISH-confirmed RP11 BAC clones 169N13 (3q13; _CN_=2), 227F7 (8q24; _CN_=2), 196H14 (12q14; _CN_=2), 25E13 (13q33; _CN_=2), 84E24 (17q24; _CN_=2), 12C9 (19q13; _CN_=2), 153K19 (3q13; _CN_=3), 94D19 (3p14; _CN_=1), 80P10 (8q22; _CN_=1), and 64C21 (13q12-13; _CN_=1), which were obtained from the BACPAC Resources Center at the Children’s Hospital Oakland Research Institute in Oakland, California.
Results
SNP Call–Based Genomewide LOH Detection by Use of SNP Arrays
When a pure tumor sample is analyzed with a paired constitutive reference on a GeneChip Xba 50K array, LOH is easily detected as homozygous SNP loci in the tumor specimen that are heterozygous in the constitutive DNA (fig. 1_A_, pink bars). In addition, given a large number of SNPs to be genotyped, the presence of LOH is also inferred from the grossly decreased heterozygous SNP calls, even in the absence of a paired reference (fig. 1_D_). The accuracy of the LOH inference would depend partly on the algorithm used but more strongly on the tumor content of the specimens. Thus, our SNP call–based LOH inference algorithm in CNAG (appendix C), as well as that of dChip,17 show almost 100% sensitivity and specificity for pure tumor specimens. But, as the tumor content decreases, the LOH detection rate steeply declines (fig. 1_G_), and, with <50% tumor cells, no LOH can be detected, even when complete genotype information for both tumor and paired constitutive DNA is obtained (fig. 1_B_, 1_E_, 1_H_, and 1_I_).
Figure 1. .

AsCN analysis with or without paired DNA. DNA from a lung cancer cell line (NCI-H2171) was mixed with DNA from an LCL (NCI-BL2171) established from the same patient at the indicated percentages and was analyzed with GeneChip 50K Xba SNP arrays. AsCNs, as well as total CNs, were analyzed using either the paired reference sample (NCI-BL2171) (upper panels, A–C) or samples from unrelated individuals simultaneously processed with the tumor samples (middle and lower panels, D–I). On each panel, the upper two graphs represent total CNs and their moving averages for the adjacent 10 SNPs, whereas moving averages of AsCNs for the adjacent 10 SNPs are shown below (red and green lines). Green and pink bars in the middle are heterozygous (hetero) calls and discordant SNP calls between the tumor and its paired reference, respectively. At the bottom of each panel, LOH regions inferred from AsCNAR (orange), SNP call–based LOH inference of CNAG (blue), dChip (purple), and PLASQ (light green) are depicted. Asterisks (*) indicate the loci at which total CNs were confirmed by FISH analysis (data not shown). The calibrations of CN graphs are linearly adjusted so that the mean CNs of null and single alleles should be 0 and 1, respectively.
LOH Detection Based on AsCN Analysis
On the other hand, the capability of allele-specific measurements of CN alterations in cancer genomes is an excellent feature of the SNP array-based CN-detection system that uses a large number of SNP-specific probe sets.16,18,21 When constitutive DNA is used as a reference, AsCN analysis is accomplished by separately comparing the SNP-specific array signals from the two parental alleles at the heterozygous SNP loci in the constitutive genomic DNA.16 It determines not only the total CN changes but also the alterations of allelic compositions in cancer genomes, which are captured as the split lines in the two AsCN graphs (fig. 1_A_ and 1_B_). In this mode of analysis, the presence of LOH can be detected as loss of one parental allele, even in specimens showing almost no discordant calls (fig. 1_B_).
AsCNAR
The previous method for AsCN analysis, however, essentially depends on the availability of constitutive DNA, since AsCNs are calculated only at the heterozygous SNP loci in constitutive DNA.16 Alternatively, allele-specific signals can be compared with those in anonymous references on the basis of the heterozygous SNP calls in the tumor specimen. In the latter case, the concordance of heterozygous SNP calls between the tumor and the unrelated sample is expected to be only 37% with a single reference. However, the use of multiple references overcomes the low concordance rate with a single reference, and the expected overall concordance rate for heterozygous SNPs and for all SNPs increases to 86% and 92%, respectively, with five unrelated references (appendix D). Thus, for AsCNAR, allele-specific signal ratios are calculated at all the concordant heterozygous SNP loci for individual references, and then the signal ratios for the identical SNPs are averaged across different references over the entire genome. For the analysis of total CNs, all the concordant SNPs, both homozygous and heterozygous, are included in the calculations, and the two allele-specific signal ratios for heterozygous SNP loci are summed together. Since AsCNAR computes AsCNs only for heterozygous SNP loci in tumors, difficulty may arise on analysis of an LOH region in highly pure tumor samples, in which little or no heterozygous SNP calls are expected. However, as shown above, such LOH regions can be easily detected by the SNP call–based algorithm, where AsCNAR is formally calculated assuming all the SNPs therein are heterozygous. Thus, the AsCNAR provides an essentially equivalent result to that from AsCN analysis using constitutional DNA, with similar sensitivity in detecting AI and LOH (compare fig. 1_A_ with 1_D_ and 1_B_ with 1_E_).
As expected from its principle, AsCNAR is more robust in the presence of normal cell contaminations than are SNP call–based algorithms. To evaluate this quantitatively, we analyzed tumor DNA that was intentionally mixed with its paired normal DNA at varying ratios in 50K Xba SNP arrays, and the array data were analyzed with AsCNAR. To preclude subjectivity, LOH regions were detected by an HMM-based algorithm, which evaluates difference in AsCNs in both parental alleles (appendix E).22 As the tumor content decreases, the SNP call–based LOH inference fails to detect LOH because of the appearance of heterozygous SNP calls from the contaminated normal cell component (fig. 1_E_ and 1_G_–1_I_), but these heterozygous SNP calls, in turn, make AsCNAR operate effectively. In fact, this algorithm precisely identifies known LOH regions, as well as regions with AI, in intentionally mixed tumor samples containing as little as 20% (for LOH without CN loss) to 25% (LOH with CN loss) tumor contents (fig. 2_A_–2_C_). Note that this large gain in sensitivity is obtained without the expense of specificity, which is very close to 100%, as observed with other algorithms (fig. 2_D_). In AsCNAR, small regions of AI (<1 million bases in length) are difficult to detect in samples contaminated with normal cells. However, such regions are also difficult to detect using other algorithms (data not shown).
Figure 2. .

Sensitivity and specificity of LOH detection for intentionally mixed tumor samples. Sensitivity of detection of LOH with or without CN loss (A and B) in different algorithms were compared using a mixture of the tumor sample (NCI-H2171) and the paired LCL sample (NCI-BL2171). The results for all LOH regions are shown in panel C, and the specificities of LOH detection are depicted in panel D. For precise estimation of sensitivity and specificity, we defined the SNPs truly positive and negative for LOH as follows. The tumor sample and the paired LCL sample were genotyped on the array three times independently, and we considered only SNPs that showed the identical genotype in the three experiments. SNPs that were heterozygous in the paired LCL sample and were homozygous in the tumor sample were considered to be truly positive for LOH, and SNPs that were heterozygous both in the paired LCL sample and in the tumor sample were considered to be truly negative. Proportions of heterozygous SNP calls (%hetero-call) that remained in LOH regions of each sample are also shown in panels A–C.
Identification of UPD in Primary Tumor Samples
To examine further the strength of the newly developed algorithms for AsCN and LOH detection, we explored UPD regions in 85 primary acute leukemia samples, including 39 AML and 46 ALL samples, on GeneChip 50K Xba SNP arrays, since recent reports identified frequent (∼20%) occurrence of this abnormality in AML.23,24 In the SNP call–based LOH inference algorithm, 16 UPD regions were identified in 14 cases, 8 (20.5%) AML and 6 (13.0%) ALL. However, the frequencies were almost doubled with the AsCNAR algorithm; a total of 28 UPD loci were identified in 25 cases, including 14 (35.9%) AML and 11 (23.9%) ALL (fig. 3_A_ and table 1). In 5 of the 25 UPD-positive cases, a matched remission sample was available for AsCN analysis, which provided essentially the same results as AsCNAR, except for one relapsed AML case (W150673). In the latter case, a discrepancy in AsCN shifts in 17p UPD occurred between AsCN analysis with and without a constitutive reference, with more CN shift detected with anonymous references (fig. 4_A_ and 4_B_). The discrepancy was, however, explained by the unexpected detection of a subtle UPD change in 17p in the reference sample by AsCNAR (P<.0001, by t test) (fig. 4_C_), which offset the CN shift in the relapsed sample, although it was morphologically and cytogenetically diagnosed as in complete remission.
Figure 3. .

The number of UPD regions for acute leukemia and MPD samples detected by either the SNP call–based method or AsCNAR. The number of UPD regions for ALL and AML samples detected by the SNP call–based method or by AsCNAR is shown in panel A, and the number of 9p UPDs for MPD samples detected by the two methods is shown in panel B. Some samples have more than one UPD region. Details of UPD regions are given in table 1. Significance between the numbers of UPDs detected by the SNP call–based method and by the AsCNAR method was tested by one-tailed binomial tests.
Table 1. .
CN-Neutral LOH in Primary Acute Leukemia
| Sample | Disease | Chromosome | Size(Mb) | Detection by SNP Call–Based Methodb |
|---|---|---|---|---|
| W176866 | ALL | 1q | 92.4 | ND |
| W158256 | ALL | 2 | 243.0 | ND |
| W113372 | ALL | 4q | 138.4 | D |
| W125534 | ALL | 5q | 88.8 | D |
| W124523 | ALL | 6p | 33.9 | D |
| W180545 | ALL | 9p | 36.9 | D |
| W113372 | ALL | 9p | 35.4 | D |
| W121456 | ALL | 9p | 28.2 | ND |
| W125626 | ALL | 9q | 47.6 | ND |
| W106094 | ALL | 9q | 34.2 | D |
| W138712 | ALL | 10p | 28.8 | ND |
| W168799 | ALL | 16p | 7.2 | D |
| W100145 | AML | 1p | 44.1 | D |
| W150234a | AML | 1p | 17.2 | D |
| W111862a | AML | 3q | 9.2 | D |
| W122271 | AML | 4q | 108.9 | D |
| W157831 | AML | 9p | 34.1 | ND |
| W157831 | AML | 11p | 41.1 | D |
| W138303a | AML | 11p | 38.7 | ND |
| W163744a | AML | 11p | 32.1 | ND |
| W132710 | AML | 11q | 66.0 | D |
| W123820 | AML | 13 | 114.1 | ND |
| W163322 | AML | 13 | 114.1 | ND |
| W194318 | AML | 17p | 19.6 | D |
| W150673a | AML | 17p | 15.6 | ND |
| W129779 | AML | 17q | 55.7 | ND |
| W157831 | AML | 19q | 41.3 | D |
| W103042 | AML | 22q | 25.6 | D |
Figure 4. .

Detection of AI in samples of primary AML and MPD. AsCN analyses disclosed the presence of a small population with 17p UPD in a primary AML specimen (W150673) (93% blasts in microscopic examination) with either a paired sample (A) or anonymous reference samples (B). The difference of the mean CNs of the two parental alleles is statistically different between panels A (0.38) and B (0.55) (P<.0001, by t test), which is explained by the residual tumor component within the bone marrow sample in complete remission (1% blast) used as a paired reference (W150673CR) (C). AI in the 9p arm was also sensitively detected in JAK2 mutation–positive MPD cases. UPD may be carried only by a very small population (∼20% estimated from the mean deviation of AsCNs in 9p) (IMF_10) (D), or by two discrete populations within the same case (PV_06), as indicated by two-phased dissociation of AsCN graphs (pink and green arrows) (F). AI in 9p is mainly caused by UPD but may be caused by gains of one parental allele without loss of the other allele (E), both of which are not discriminated by conventional allele measurements. Blue and pink bars are UPD and AI calls, respectively, from the HMM-based LOH detection algorithm. Other features are identical to those indicated in figure 1.
Analysis of 9p UPD in MPDs
Another interesting application of the AsCNAR is the analysis of allelic status in the 9p arm among patients with MPD, which includes PV, ET, and IMF. According to past reports, ∼10% (in ET) to ∼40% (in PV) of MPD cases with the activating JAK2 mutation (V617F) show evidence of clonal evolution of dominant progeny that carry the homozygous JAK2 mutation caused by 9p UPD.5,7,8 In our series that included 53 MPD cases, the JAK2 mutation was detected in 32 (60%), of which 13 (41%) showed >50% mutant allele by allele measurement with the use of allele-specific PCR, and thus were judged to have one or more populations carrying homozygous JAK2 mutations (table 2). This frequency is comparable to that reported elsewhere.8 However, when the same specimens were analyzed with 50K Xba SNP arrays by use of the AsCNAR algorithm, 20 of the 32 JAK2 mutation–positive cases were demonstrated to have minor UPD subpopulations (table 2 and fig. 3_B_), in which as little as 17% of UPD-positive populations were sensitively detected (fig. 4_D_). In fact, these minor (<50%) UPD-positive populations in these cases were also confirmed by allele-specific PCR of SNPs on 9p (table 2). The proportion of 9p UPD–positive components estimated both from allele-specific PCR and from AsCNAR (see the “Material and Methods” section) shows a good concordance (table 2). In some cases, 9p UPD–positive cells account for almost all the JAK2 mutation–positive population, whereas, in others, they represent only a small subpopulation of the entire JAK2 mutation–positive population (fig. 5). AsCNAR analysis also disclosed the additional three cases that have 9p gain (9p trisomy) (fig. 4_E_). The 9p trisomy is among the most-frequent cytogenetic abnormalities in MPDs25 and is implicated in duplication of the mutated JAK2 allele6 but could not have been discriminated from UPD or “LOH with CN loss” by use of conventional techniques—for example, allele-specific PCR to measure relative allele dose. Since the proportions of the mutated JAK2 allele coincide with two-thirds of the observed trisomy components in all three cases, the data suggest that the mutated JAK2 allele is duplicated in the 9p trisomy cases (table 2). Of particular interest is the unexpected finding of the presence of two discrete populations carrying 9p UPD in three cases, in which the AsCN graph showed a two-phased dissociation along the 9p arm (fig. 4_F_). In the previous observations, homozygous JAK2 mutations have been reported to be more common in PV cases (∼40%) than in ET cases (<∼10%). With AsCNAR analysis, the difference in the frequency of 9p UPD becomes more conspicuous; nearly all PV cases (11/11) and IMF cases (9/10) with a JAK2 mutation had one or more UPD components or other gains of 9p material, whereas only 3 of the 11 JAK2 mutation-positive ET cases carried a 9p UPD component or gain of 9p (_P_=1.3×10⁻⁴, by Fisher’s exact test).
Table 2. .
AI of 9p in JAK2 Mutation-Positive MPDs[Note]
| 9p Status by AsCNAR | Allele-Specific PCRc | |||||||
|---|---|---|---|---|---|---|---|---|
| Case | Type | Break Pointd | %UPDe | Detection by SNP Call–Based Methoda | % JAK2 Mutationb | SNP | %UPDf | Pg |
| PV_02 | Gain | 42.9 | 99 | NA | 63 | rs2009991 | 84 | .004 |
| PV_03 | Gain | Whole | 60 | NA | 39 | rs10511431 | 63 | .008 |
| PV_04 | UPD | 37.0 | 93 | D | 95 | 5Homo | 5Homo | 5Homo |
| PV_08 | UPD | 34.2 | 91 | D | 93 | 5Homo | 5Homo | 5Homo |
| PV_07 | UPD | 23.8 | 88 | D | 90 | 5Homo | 5Homo | 5Homo |
| PV_06 | UPDh | 7.1/35.3 | 83 | D | 93 | 5Homo | 5Homo | 5Homo |
| PV_11 | UPD | 31.2 | 68 | D | 76 | 5Homo | 5Homo | 5Homo |
| PV_13 | UPD | 28.1 | 66 | ND | 48 | rs1416582 | 64 | .001 |
| PV_01 | UPD | 20.9 | 56 | ND | 62 | rs10511431 | 49 | .007 |
| PV_09 | UPD | 30.8 | 38 | ND | 30 | rs10491558 | 32 | .020 |
| PV_05 | UPD | 23.5 | 32 | ND | 33 | rs1374172 | 31 | .010 |
| IMF_04 | UPD | 33.8 | 79 | D | 90 | 5Homo | 5Homo | 5Homo |
| IMF_05 | UPD | 37.0 | 58 | ND | 57 | rs1416582 | 49 | .004 |
| IMF_07 | UPD | 20.3 | 52 | ND | 50 | rs1416582 | 57 | .005 |
| IMF_12 | UPDh | 26.8/42.9 | 52 | ND | 66 | 5Homo | 5Homo | 5Homo |
| IMF_14 | UPDh | 22.8/33.8 | 45 | ND | 56 | rs1374172 | 35 | .015 |
| IMF_19 | UPD | 34.4 | 26 | ND | 43 | rs10511431 | 33 | .017 |
| IMF_10 | UPD | 34.6 | 21 | ND | 36 | rs1374172 | 21 | .049 |
| IMF_15 | UPD | 33.8 | 21 | ND | 17 | rs10511431 | 20 | .084 |
| IMF_06 | UPD | 35.3 | 17 | ND | 28 | rs1374172 | 20 | .048 |
| IMF_16 | (−) | NA | NA | NA | 37 | NA | NA | NA |
| ET_12 | Gain | Whole | 42 | NA | 27 | rs2009991 | 36 | .046 |
| ET_14 | UPD | 42.9 | 63 | ND | 45 | rs1374172 | 54 | .006 |
| ET_01 | UPD | 35.4 | 19 | ND | 59 | rs10511431 | 33 | .017 |
| ET_05 | (−) | NA | NA | NA | 23 | NA | NA | NA |
| ET_08 | (−) | NA | NA | NA | 42 | NA | NA | NA |
| ET_09 | (−) | NA | NA | NA | 34 | NA | NA | NA |
| ET_10 | (−) | NA | NA | NA | 16 | NA | NA | NA |
| ET_15 | (−) | NA | NA | NA | 27 | NA | NA | NA |
| ET_18 | (−) | NA | NA | NA | 17 | NA | NA | NA |
| ET_19 | (−) | NA | NA | NA | 27 | NA | NA | NA |
| ET_21 | (−) | NA | NA | NA | 55 | NA | NA | NA |
Figure 5. .

Estimation of tumor populations carrying 9p UPD and the JAK2 mutation in MPD samples. The populations of 9p UPD–positive components in the 53 MPD cases were estimated by calculation of the mean difference of AsCNs within the UPD regions. Heterozygous (blue bars) or homozygous (red bars) JAK2 mutations in MPD samples were also estimated by measurement of JAK2 mutated alleles and UPD alleles, under the assumption that all the UPD alleles have a JAK2 mutation. Measurement of JAK2 mutated alleles was performed by allele-specific PCR. For three cases having trisomy components (orange bars), the duplicated allele was assumed to have a JAK2 mutation, which is the consistent interpretation of the observed fraction of trisomy and mutated JAK2 alleles for case PV_02 (table 2). mt = JAK2 mutated allele; wt = wild-type allele.
Discussion
The robustness of the AsCNAR method lies in its capacity to measure accurately allele dosage and thereby to detect LOH even in the presence of significant normal cell components, which often occurs in primary tumor samples. In principle, an accurate LOH determination is accomplished only by demonstrating an absolute loss of one parental allele, not simply by detecting AI with conventional allele-measurement techniques. This is especially the case for contaminated samples, where it is essentially impossible to discriminate the origin of the remaining minor-allele component (i.e., differentiating normal cells and tumor cells).1,3 Nevertheless, and paradoxically, it is these normal cells within the tumor samples that enable determination of AsCNs in AsCNAR. It computes AsCNs on the basis of the strength of heterozygous SNP calls produced from the “contaminated” normal component, which effectively works as “an internal reference,” precluding the need for preparing a paired germline reference. It far outperforms the SNP call–based LOH-inference algorithms and other methods and definitively determines the state of LOH by sensing CN loss of one parental allele.
In the previously published algorithms, AsCN analysis was enabled by fitting observed array data to a model constructed from a fixed data set from normal samples.18,21 However, the model that explicitly assumes integer CNs fails to cope with primary tumor samples that contain varying degrees of normal cell components (PLASQ)18 (fig. 2). Another algorithm (CARAT) requires a large number of references to construct a model by which AsCNs are predicted, but such a model may not necessarily be properly applied to predict AsCNs for the newly processed samples, if the experimental condition for those samples is significantly different from that for the reference samples, which were used to construct the model (fig. 6 and data not shown).21 Signal ratios between array data from very different experiments could be strongly biased, to the extent that they can no more be properly compensated by conventional regressions. In contrast, AsCNAR uses just a small number of references simultaneously processed with tumor specimens, to minimize difference in experimental conditions between tumor and references, which act as excellent controls in calculating AsCNs, although references analyzed in short intervals also work satisfactorily (data not shown).
Figure 6. .

Effects of the use of the different reference sets on signal-to-noise ratios (S/N) in CN analysis. The same DNA sample, containing 30% tumor (NCI-H2171) content, was analyzed on the 50K Xba SNP array in two different experiments by use of the identical reference set, including the paired LCL (NCI-BL2171). AsCN profiles obtained with the simultaneously processed reference set with the paired LCL (A and B) and with the anonymous references (E and F) show higher S/N than do those obtained with the same reference set but processed in different experiments by use of paired LCL (C and D) or anonymous references (G and H). S/N values are provided by the mean CN shift from baseline in the CN loss region divided by the SD of the diploid region.
The CN analysis software for the Illumina array provides allele frequencies, as well as CNs, by use of a model-based approach, and, as such, it enables AsCN analysis but seems to be less sensitive for detection of AIs.26 AsCNAR can be easily adapted to other Affymetrix arrays, including 10K and 500K arrays, and may be potentially applied to Illumina arrays.
The probability of finding at least one concordant SNP between a tumor sample and a set of anonymous references is enough with five references, but use of just one reference provides almost an equivalent AsCN profile to that obtained with its paired reference (fig. 7). The sensitivity and specificity of LOH detection with this algorithm are excellent, even in the presence of significant degrees of normal cell components (∼70%–80%), which circumvent the need for purifying the tumor components for analysis—for example, by time-consuming microdissection.
Figure 7. .

CN profile obtained with the use of a varying number of anonymous references. NCI-H2171 was analyzed with either one (A), three (B), or five (C) anonymous references, as well as its paired LCL (NCI-BL2171) (D) by use of the AsCNAR algorithm. Even though the expected concordance rate of SNP calls between the tumor and a single reference is only 37%, almost-equivalent CN profiles were obtained, regardless of the number of anonymous references used. Ch = chromosome.
Because the AsCNAR algorithm is quite simple, it requires much less computing power and time (several seconds per sample on average laptop computers) than do model-based algorithms. For example, with PLASQ, it takes overnight for model construction and an additional hour for processing each sample.
The high sensitivity of LOH detection by AsCNAR has been validated not only by the analysis of tumor DNA intentionally mixed with normal DNA but also by the analysis of primary leukemia samples. It unveiled otherwise undetected, minor UPD-positive populations within leukemia samples. Especially, the extremely high frequency of 9p UPD or gains of 9p in particular types of JAK2 mutation–positive MPDs, as well as multiple UPD-positive subclones in some cases, demonstrated how strongly and efficiently a genetic change (point mutation) works to fix the next alteration (mitotic recombination) in the tumor population during clonal evolution in human cancer. Finally, the conspicuous difference in UPD frequency among different MPD subtypes (PV and IMF vs. ET) is noteworthy. This is supported by a recent report that demonstrated the presence of minor subclones carrying exclusively the mutated JAK2 allele in all PV samples, but in none of the ET samples, by examining a large number of erythroid burst-forming units and Epo-independent erythroid colonies for JAK2 mutation.27 Our observation also supports their hypothesis that the biological behavior of these prototypic stem-cell disorders with a continuous disease spectrum could be determined by the components with either homozygous or duplicated JAK2 mutations.
In conclusion, the AsCNAR with use of high-density oligonucleotide microarrays is a robust method of genomewide analysis of allelic changes in cancer genomes and provides an invaluable clue to the understanding of the genetic basis of human cancers. The AsCNAR algorithm is freely available on our CNAG Web site for academic users.
Acknowledgments
This work was supported by Research on Measures for Intractable Diseases, Health and Labor Sciences Research Grants, Ministry of Health, Labor and Welfare, by Research on Health Sciences focusing on Drug Innovation, by the Japan Health Sciences Foundation, by Core Research for Evolutional Science and Technology, Japan Science and Technology Agency, and by Japan Leukemia Research Fund.
Appendix A: AsCNAR
Quadratic Regression
The log2 signal-ratio,  is regressed by the quadratic terms (the length [L _i_] and the GC content [M _i_] of the PCR fragment of the _i_th SNP) as

where ɛ_i_ is the error term and the coefficients of regressions α, β, χ, δ, and γ are dependent on the reference used and are determined to minimize the residual sum of squares (i.e.,  ). Note that the sum is taken for those SNPs that have concordant SNP calls between the tumor and the reference samples.
We suppose that both allele A DNA and allele B DNA follow the same PCR kinetics, and allele-specific ratios R refI A,i and R refI B,i, respectively, can be regressed by the same parameters, as

and

and the corrected total CN ratio is

Averaging over the References of Concordance SNPs
Concordant reference sets C K i and C K,hetero i for each SNP S i for a given set of references, K, are defined as follows:

and the averaged CN ratio,  , is provided by

where “#” denotes the number of the elements of the set. Similarly, AsCN ratios are obtained by

Exceptional Handling with Regions of Homozygous Deletion, High Amplification, and LOH
To prevent SNPs within the regions that show homozygous deletion or high-grade amplification from being analyzed as “homozygous SNPs,” a homozygous SNP S i in the tumor sample is redefined as a heterozygous SNP with  , if
, if  or
or  , where
  and
and  are calculated supposing SNP S i is heterozygous. These cutoff values (0.1 and −0.1) are determined by receiver operating characteristic (ROC) curve for detection of gain of the larger allele and loss of the smaller allele in a sample containing 20% tumor cells (data not shown). In addition, SNPs within inferred LOH regions are also analyzed as “heterozygous” SNPs.
Reference Selection
The optimized set of references is selected that minimizes the SD of total CN at the diploid region D,
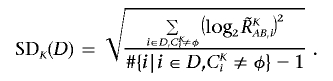
To do this, instead of testing all possible 2_N_ combinations of N references, we calculate SD K(D) for individual references  to order the references such that SD_1(D)⩽…⩽_SD s(D)⩽SD s+1(D)⩽…⩽SD N(D), where 1, 2, 3,…,s, s+1,…, N denotes the ordered references. The optimal set
  is determined by choosing N_0 that satisfies SD K(1)(D)⩾…⩾_SD K(_N_0)(D)<SD K(_N_0+1)(D).
Note that, in principle, a diploid region cannot be unequivocally determined without doing single-cell–based analysis—for example, FISH or cytogenetics. Otherwise, a diploid region is empirically determined by setting the CN-minimal regions with no AI as diploid, which provides correct estimation of the ploidy in most cases (data not shown).
Appendix B
Table B1. .
PCR Primers and Conditions for STR PCR and Allele-Specific PCR
| Primer Sequence | |||
|---|---|---|---|
| STR/SNP | Forward | Reverse 1 | Reverse 2 |
| D3S1279a | FAM-CACCATCTGTGTGGTATTGG | GACCTATTTTGGTTAACAATTTAGA | |
| rs10511431b | FAM-TGCTTCCCCCATAATCAGTC | TGGCATTAACTAATTCTCCTAGTGC | AAATGGCATTAACTAATTCTCCTAGTGG |
| rs1374172b | FAM-GAAATTCAAAATGCCTGACGA | AATTCTATGATCAAAAGTGTGATTTC | TTTAATTCTATGATCAAAAGTGTGATTTA |
| rs10491558b | FAM-CAAGTTCATCACAGGAGTTTTTCT | GAAACAACACTAGGTGGAAACTAGC | AAAGAAACAACACTAGGTGGAAACTAGG |
| rs1416582b | FAM-GCAACCCAAGTCCAGATTGT | GAAAAAGTAAAGTGCTGCATAAATAG | AAAGAAAAAGTAAAGTGCTGCATAAATAC |
| rs2009991b | FAM-ATTTGGATGAAGAGGGAAGGA | AATAGGACAATGTGGCATCG | AAAAATAGGACAATGTGGCATCA |
Appendix C
Inference of LOH Based on Heterozygous SNP Calls
For a given contiguous region Ω_i_,j between the _i_th and j_th SNPs (i_⩽_j) and for the complete set of observed SNP calls therein, O(Ω_i,j), consider the log likelihood ratio

where the ratio is taken between the conditional probabilities that the current observation, O(Ω_i_,j), is obtained under the assumption that O(Ω_i_,j) belongs to LOH or not. We assume a constant miscall rate (_q_=0.001) for all SNP and use the conditional probability that the _k_th SNP is heterozygous (h k), depending on the observed _k−_1th SNP call, for partially taking the effect of linkage disequilibrium into account:

where h k is calculated using the data from the 96 normal Japanese individuals, whereas O k takes either 1 or 0, depending on the k_th SNP call, with 1 for a homozygous call and 0 for a heterozygous call. For each chromosome, a set of regions, Ω_I n,J n(J _n_-1<I n_⩽_J n,_J_0=0) (_n_=1,2,3,…), can be uniquely determined as follows.
Beginning with the SNP at the short arm end (S_0), find the SNP S I n that satisfies Z(Ω_I n,I n)>0 and Z(Ω_i_,i)⩽0 for J n_-1<∀_i_<_I_ _n_ (fig. C1_A_). Identify the SNP _S_ _J_+, such that _Z_(Ω_I_ _n_,_j_)>0 for I n_⩽∀_j_⩽_J+ and Z(Ω_I n,J++1)⩽0, or that S J+ is the end of the chromosome (fig. C1_B_). Then, put J n as  (fig. C1_C_). This procedure is iteratively performed, beginning the next iteration with the SNP S J n+1, until it reaches to the end of the long arm, generating a set of nonoverlapping regions, Ω_I_1,_J_1,Ω_I_2,J_2,Ω_I_3,J_3,…Ω_I n,J n,…. LOH inference is now enabled by testing each Z(Ω_I n,J n) against a threshold (25), which is arbitrarily determined from the ROC curve for LOH determination on a DNA sample from a lung cancer cell line, NCI-H2171 (fig. C1_D_). This algorithm is implemented in our CNAG program, which is available at our Web site.
Figure C1. .

Inference of LOH on the basis of heterozygous SNP calls. A–C, The schema of determination of LOH blocks in inference of LOH. D, ROC curve for LOH determination. The sensitivity and specificity of LOH detection for pure tumor specimens were plotted for varying thresholds of Z(Ω) for LOH determination, where SNPs that were heterozygous in the paired LCL sample and were homozygous in the tumor sample were considered to be truly positive for LOH and SNPs that were heterozygous in both the paired LCL and tumor sample were considered to be truly negative.
Appendix D
Figure D1. .

Expected concordance rate of SNP calls between normal samples. In the AsCNAR algorithm, SNP-specific signals of each SNP in a tumor sample were compared with those in reference samples that had a SNP call identical to that of the tumor sample. The probability of finding such concordant SNPs between a given tumor sample and a set of references was estimated as the function of the number of reference samples, by use of genotyping data from the 96 normal individuals. To do this, the latter were first divided into a test set and a reference set, each consisting of 48 individuals. Then, for each individual from the test set, the number of those SNP loci was enumerated that were identical to one or more SNPs within i references randomly selected from the reference set (_i_=1,2,3,…,10). No-call SNPs in test samples were excluded from the enumerations. The concordance rates were expressed as the mean ± SD for the 48 test samples. The concordance rate was separately estimated for heterozygous (hetero call) SNPs and for all SNPs in 50K Xba and 50K Hind arrays.
Appendix E
Algorithm for Detection of AI With or Without LOH
The regions with AI are inferred from the AsCN data by use of an HMM, where the real state of AI (a hidden state) is inferred from the observed states of difference in AsCNs of the two parental alleles, which are expressed as dichotomous values (“preset” or “absent”) according to a threshold (μ). The emission probabilities at the _i_th SNP locus (Si) are

and
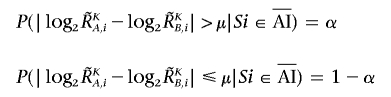
(see also the “Material and Methods” section and appendix A for calculation of  and
and  ).
).
The parameters (μ, α, and β) are determined by the results of 10%, 20%, and 30% tumor samples. Sensitivity and specificity are calculated with varying threshold (μ), where sensitivity is defined as the ratio of detected SNPs of UPD region detected in the 100% tumor sample, specificity is defined as the ratio of nondetected SNPs in normal samples, and α and β parameters are determined from mixed tumor-sample data for each threshold value. Sensitivity and specificity are relatively stable and are within the acceptable range when the threshold is between 0.05 and 0.15 in 20% and 30% tumor samples (fig. E1_A_ and E1_B_). We used 0.12, 0.17, and 0.06 for μ, α, and β, respectively, on the basis of 20% tumor-sample data.
Figure E1. .

Sensitivity and specificity for determination of AI, LOH, and UPD. The sensitivity and specificity of detection of AI (A and B), LOH (i.e., decrease of the smaller allele in AI region) (C and D), and UPD (i.e., increase of the larger allele in LOH region) (E and F) in 10%, 20%, and 30% tumor (NCI-H2171) samples are plotted for varying threshold parameters of the HMM analysis. The sensitivity and specificity were calculated assuming that the analysis with the pure tumor and its paired LCL provides truly positive and truly negative results. In panel B, the specificity of the 10% tumor sample is <0.8. Asterisks (*) represent the thresholds used for determination of AI, LOH, and UPD.
Considering that UPD is caused by a process similar to recombination, the Kosambi’s map function (1/2)tanh(2θ) is used for transition probability, where θ is the distance between two SNPs, expressed in cM units; for simplicity, 1 cM should be 1 Mbp. Thus, the most likely underlying, hidden, real states of AI are calculated for each SNP according to Vitervi’s method, by which AI-positive regions are defined by contiguous SNPs with “present” AI calls flanked by either chromosomal end or an “absent” AI call. Next, to determine the LOH status for each AI-positive region (Γ), AsCN states at each SNP locus within Γ are inferred as “reduced (R)” and “not reduced ( )” for the smaller AsCNs, and “increased (I)” and “not increased (
 )” for the larger AsCNs, using similar HMMs from the “observed CN states” of the smaller and the larger AsCNs, which are expressed as dichotomous values according to thresholds μ_S_ and μ_L_, respectively. The emission probabilities of these models are

and

These parameters (μ_S_, α_S_, β_S_, μ_L_, α_L_, and β_L_) are determined by evaluating sensitivities and specificities of the results for 10%, 20%, and 30% tumor samples, where sensitivities and specificities are calculated the same way as was AI. Sensitivity and specificity are relatively stable for μ_S_ between −0.03 and −0.13 and are relatively stable for μ_L_ between 0.04 and 0.09 in 20% and 30% tumor samples (fig. E1_C_–E1_F_). We employed μ_S_=-0.1, α_S_=0.3, β_S_=0.26, μ_L_=0.08, α_L_=0.27, and β_L_=0.31 on the basis of the data for 20% tumor content.
Web Resources
The URLs for data presented herein are as follows:
- ATCC, http://www.atcc.org/common/cultures/NavByApp.cfm
- BACPAC Resources Center, http://bacpac.chori.org/
- CNAG, http://www.genome.umin.jp/
- dChip, http://www.dchip.org/
- Online Mendelian Inheritance in Man (OMIM), http://www.ncbi.nlm.nih.gov/Omim/ (for JAK2, AML, PV, ET, and IMF)
- PLASQ, http://genome.dfci.harvard.edu/~tlaframb/PLASQ/
References
- 1.Mei R, Galipeau PC, Prass C, Berno A, Ghandour G, Patil N, Wolff RK, Chee MS, Reid BJ, Lockhart DJ (2000) Genome-wide detection of allelic imbalance using human SNPs and high-density DNA arrays. Genome Res 10:1126–1137 10.1101/gr.10.8.1126 [DOI] [PMC free article] [PubMed] [Google Scholar]
- 2.Horvath A, Boikos S, Giatzakis C, Robinson-White A, Groussin L, Griffin KJ, Stein E, Levine E, Delimpasi G, Hsiao HP, et al (2006) A genome-wide scan identifies mutations in the gene encoding phosphodiesterase 11A4 (PDE11A) in individuals with adrenocortical hyperplasia. Nat Genet 38:794–800 10.1038/ng1809 [DOI] [PubMed] [Google Scholar]
- 3.Lindblad-Toh K, Tanenbaum DM, Daly MJ, Winchester E, Lui WO, Villapakkam A, Stanton SE, Larsson C, Hudson TJ, Johnson BE, et al (2000) Loss-of-heterozygosity analysis of small-cell lung carcinomas using single-nucleotide polymorphism arrays. Nat Biotechnol 18:1001–1005 10.1038/79269 [DOI] [PubMed] [Google Scholar]
- 4.Knudson AG (2001) Two genetic hits (more or less) to cancer. Nat Rev Cancer 1:157–162 10.1038/35101031 [DOI] [PubMed] [Google Scholar]
- 5.Baxter EJ, Scott LM, Campbell PJ, East C, Fourouclas N, Swanton S, Vassiliou GS, Bench AJ, Boyd EM, Curtin N, et al (2005) Acquired mutation of the tyrosine kinase JAK2 in human myeloproliferative disorders. Lancet 365:1054–1061 [DOI] [PubMed] [Google Scholar]
- 6.James C, Ugo V, Le Couedic JP, Staerk J, Delhommeau F, Lacout C, Garcon L, Raslova H, Berger R, Bennaceur-Griscelli A, et al (2005) A unique clonal JAK2 mutation leading to constitutive signalling causes polycythaemia vera. Nature 434:1144–1148 10.1038/nature03546 [DOI] [PubMed] [Google Scholar]
- 7.Kralovics R, Passamonti F, Buser AS, Teo SS, Tiedt R, Passweg JR, Tichelli A, Cazzola M, Skoda RC (2005) A gain-of-function mutation of JAK2 in myeloproliferative disorders. N Engl J Med 352:1779–1790 10.1056/NEJMoa051113 [DOI] [PubMed] [Google Scholar]
- 8.Levine RL, Wadleigh M, Cools J, Ebert BL, Wernig G, Huntly BJ, Boggon TJ, Wlodarska I, Clark JJ, Moore S, et al (2005) Activating mutation in the tyrosine kinase JAK2 in polycythemia vera, essential thrombocythemia, and myeloid metaplasia with myelofibrosis. Cancer Cell 7:387–397 10.1016/j.ccr.2005.03.023 [DOI] [PubMed] [Google Scholar]
- 9.Kennedy GC, Matsuzaki H, Dong S, Liu WM, Huang J, Liu G, Su X, Cao M, Chen W, Zhang J, et al (2003) Large-scale genotyping of complex DNA. Nat Biotechnol 21:1233–1237 10.1038/nbt869 [DOI] [PubMed] [Google Scholar]
- 10.Zhao X, Li C, Paez JG, Chin K, Janne PA, Chen TH, Girard L, Minna J, Christiani D, Leo C, et al (2004) An integrated view of copy number and allelic alterations in the cancer genome using single nucleotide polymorphism arrays. Cancer Res 64:3060–3071 10.1158/0008-5472.CAN-03-3308 [DOI] [PubMed] [Google Scholar]
- 11.Huang J, Wei W, Zhang J, Liu G, Bignell GR, Stratton MR, Futreal PA, Wooster R, Jones KW, Shapero MH (2004) Whole genome DNA copy number changes identified by high density oligonucleotide arrays. Hum Genomics 1:287–299 [DOI] [PMC free article] [PubMed] [Google Scholar]
- 12.Bignell GR, Huang J, Greshock J, Watt S, Butler A, West S, Grigorova M, Jones KW, Wei W, Stratton MR, et al (2004) High-resolution analysis of DNA copy number using oligonucleotide microarrays. Genome Res 14:287–295 10.1101/gr.2012304 [DOI] [PMC free article] [PubMed] [Google Scholar]
- 13.Wang ZC, Buraimoh A, Iglehart JD,Richardson AL (2006) Genome-wide analysis for loss of heterozygosity in primary and recurrent phyllodes tumor and fibroadenoma of breast using single nucleotide polymorphism arrays. Breast Cancer Res Treat 97:301–309 10.1007/s10549-005-9124-5 [DOI] [PubMed] [Google Scholar]
- 14.Zhou X, Mok SC, Chen Z, Li Y, Wong DT (2004) Concurrent analysis of loss of heterozygosity (LOH) and copy number abnormality (CNA) for oral premalignancy progression using the Affymetrix 10K SNP mapping array. Hum Genet 115:327–330 10.1007/s00439-004-1163-1 [DOI] [PubMed] [Google Scholar]
- 15.Matsuzaki H, Dong S, Loi H, Di X, Liu G, Hubbell E, Law J, Berntsen T, Chadha M, Hui H, et al (2004) Genotyping over 100,000 SNPs on a pair of oligonucleotide arrays. Nat Methods 1:109–111 10.1038/nmeth718 [DOI] [PubMed] [Google Scholar]
- 16.Nannya Y, Sanada M, Nakazaki K, Hosoya N, Wang L, Hangaishi A, Kurokawa M, Chiba S, Bailey DK, Kennedy GC, et al (2005) A robust algorithm for copy number detection using high-density oligonucleotide single nucleotide polymorphism genotyping arrays. Cancer Res 65:6071–6079 10.1158/0008-5472.CAN-05-0465 [DOI] [PubMed] [Google Scholar]
- 17.Beroukhim R, Lin M, Park Y, Hao K, Zhao X, Garraway LA, Fox EA, Hochberg EP, Mellinghoff IK, Hofer MD, et al (2006) Inferring loss-of-heterozygosity from unpaired tumors using high-density oligonucleotide SNP arrays. PLoS Comput Biol 2:e41 10.1371/journal.pcbi.0020041 [DOI] [PMC free article] [PubMed] [Google Scholar]
- 18.Laframboise T, Harrington D, Weir BA (2007) PLASQ: a generalized linear model-based procedure to determine allelic dosage in cancer cells from SNP array data. Biostatistics 8:323–336 10.1093/biostatistics/kxl012 [DOI] [PubMed] [Google Scholar]
- 19.Kralovics R, Teo SS, Li S, Theocharides A, Buser AS, Tichelli A, Skoda RC (2006) Acquisition of the V617F mutation of JAK2 is a late genetic event in a subset of patients with myeloproliferative disorders. Blood 108:1377–1380 10.1182/blood-2005-11-009605 [DOI] [PubMed] [Google Scholar]
- 20.Wang L, Ogawa S, Hangaishi A, Qiao Y, Hosoya N, Nanya Y, Ohyashiki K, Mizoguchi H, Hirai H (2003) Molecular characterization of the recurrent unbalanced translocation der(1;7)(q10;p10). Blood 102:2597–2604 10.1182/blood-2003-01-0031 [DOI] [PubMed] [Google Scholar]
- 21.Huang J, Wei W, Chen J, Zhang J, Liu G, Di X, Mei R, Ishikawa S, Aburatani H, Jones KW, et al (2006) CARAT: a novel method for allelic detection of DNA copy number changes using high density oligonucleotide arrays. BMC Bioinformatics 7:83 10.1186/1471-2105-7-83 [DOI] [PMC free article] [PubMed] [Google Scholar]
- 22.Dugad R, Desai U (1996) A tutorial on hidden Markov models. Technical report SPANN-96.1. Signal Processing and Artificial Neural Networks Laboratory, Bombay, India [Google Scholar]
- 23.Raghavan M, Lillington DM, Skoulakis S, Debernardi S, Chaplin T, Foot NJ, Lister TA,Young BD (2005) Genome-wide single nucleotide polymorphism analysis reveals frequent partial uniparental disomy due to somatic recombination in acute myeloid leukemias. Cancer Res 65:375–378 [PubMed] [Google Scholar]
- 24.Fitzgibbon J, Smith LL, Raghavan M, Smith ML, Debernardi S, Skoulakis S, Lillington D, Lister TA,Young BD (2005) Association between acquired uniparental disomy and homozygous gene mutation in acute myeloid leukemias. Cancer Res 65:9152–9154 10.1158/0008-5472.CAN-05-2017 [DOI] [PubMed] [Google Scholar]
- 25.Najfeld V, Montella L, Scalise A,Fruchtman S (2002) Exploring polycythaemia vera with fluorescence in situ hybridization: additional cryptic 9p is the most frequent abnormality detected. Br J Haematol 119:558–566 10.1046/j.1365-2141.2002.03763.x [DOI] [PubMed] [Google Scholar]
- 26.Peiffer DA, Le JM, Steemers FJ, Chang W, Jenniges T, Garcia F, Haden K, Li J, Shaw CA, Belmont J, et al (2006) High-resolution genomic profiling of chromosomal aberrations using Infinium whole-genome genotyping. Genome Res 16:1136–1148 10.1101/gr.5402306 [DOI] [PMC free article] [PubMed] [Google Scholar]
- 27.Scott LM, Scott MA, Campbell PJ,Green AR (2006) Progenitors homozygous for the V617F mutation occur in most patients with polycythemia vera, but not essential thrombocythemia. Blood 108:2435–2437 10.1182/blood-2006-04-018259 [DOI] [PubMed] [Google Scholar]