Molecular evidence for increased expression of genes related to immune and chaperone function in the prefrontal cortex in schizophrenia (original) (raw)
. Author manuscript; available in PMC: 2008 Oct 1.
Abstract
Background
Schizophrenia is characterized by complex gene expression changes. The transcriptome alterations in the prefrontal cortex have been the subject of several recent postmortem studies which yielded both convergent and divergent findings.
Methods
To increase measurement precision, we used a custom-designed DNA microarray platform with long oligonucleotides and multiple probes with replicates. The platform was designed to assess the expression of >1,800 genes specifically chosen because of their hypothesized roles in the pathophysiology of schizophrenia. The gene expression differences in dorsolateral prefrontal cortex samples from 14 matched pairs of schizophrenia and control subjects were analyzed using two technical replicates and four data mining approaches.
Results
In addition to replicating many expression changes in synaptic, oligodendrocyte and signal transduction genes, we uncovered and validated a robust immune/chaperone transcript upregulation in the schizophrenia samples.
Conclusions
We speculate that the overexpression of SERPINA3, IFITM1, IFITM2, IFITM3, CHI3L1, MT2A, CD14, HSPB1, HSPA1B and HSPA1A in schizophrenia subjects represents a long-lasting and correlated signature of an early environmental insult during development that actively contributes to the pathophysiology of prefrontal dysfunction.
Keywords: Immune system, DNA microarray, heat-shock protein, schizophrenia, qPCR, prefrontal cortex, postmortem brain
INTRODUCTION
Schizophrenia is a severe mental disorder that affects ∼1% of the population (Jablensky 2000). Although both genetic and environmental factors play critical roles in the etiology of schizophrenia, the molecular substrate for the pathophysiology of the disease remains elusive and is recognized as complex (Lewis and Levitt 2002). To address this issue, a number of DNA microarray studies have been conducted (for review see (Iwamoto and Kato 2006; Mirnics et al 2006)). These high throughput transcriptome profiling experiments have identified several altered molecular processes in schizophrenia, including downregulation of genes in the GABA and glutamate systems (Mirnics et al 2000; Mirnics et al 2001; Vawter et al 2002), gene expression changes related to synaptic and mitochondrial functions (Altar et al 2005; Iwamoto et al 2005; Middleton et al 2005; Mirnics et al 2000; Prabakaran et al 2004) and a repression of oligodendrocyte mRNAs in the prefrontal cortex (Aston et al 2004; Hakak et al 2001; Pongrac et al 2002; Tkachev et al 2003).
There have been both convergent and divergent results from the transcriptome profiling studies (Mirnics et al 2006). Differences could be attributed to 1) systematic cohort biases arising from brain collection procedures (e.g., hospitalized subjects vs. subjects who died suddenly, divergent inclusion/exclusion criteria, etc.); 2) sample processing differences in RNA isolation procedures, cDNA synthesis, in vitro transcription or fluorescent labeling; 3) microarray platform differences; or 4) differences in segmentation, data extraction, normalization and statistical analyses (Hollingshead et al 2005). Thus, the combined experimental variation and noise in every microarray experiment is considerable, and the microarray data can be less precise and accurate than desired.
Given these limitations, the present study was aimed at analyzing putative schizophrenia-associated molecular pathways at increased measurement precision. We postulated that the ideal microarray would: 1) be built with longer oligonucleotides in order to achieve a higher level of probe specificity; 2) contain multiples probes against the same gene; 3) have a high probe replicate redundancy; and 4) incorporate microarray probes based on published schizophrenia datasets and hypotheses. In addition, we established that the comprehensive microarray experiments would analyze only samples with the highest RNA integrity using two technical replicates. Finally, we utilized several analytical approaches to maximize the identification of convergent data.
The present study reports on a cohort composed of 14 pairs of control and schizophrenic brain samples matched for age, sex and postmortem interval (PMI). We identified significant changes in expression for 67 genes and ESTs between schizophrenia and control samples. In addition to confirming some of the previously reported gene expression changes, we found a highly correlated alteration in the expression of genes involved in immune/chaperone function as part of the transcriptome disturbances in schizophrenia. These results are discussed in the context of the environmental influences that may predispose to the disease.
MATERIALS AND METHODS
1-Human brain samples and tissue preparation
Fresh-frozen human tissue was obtained from the University of Pittsburgh’s Center for the Neuroscience of Mental Disorders Brain Bank. In this study, 14 pairs of schizophrenia and control post-mortem brains were matched for gender, and as closely as possible for age, race and postmortem interval (PMI). The two groups of normal control (CTR) and schizophrenia (SCZ) subjects (Table 1) did not differ in mean (±SD) age at the time of death (42.21 ± 14.8 and 42.57 ± 12.31 years, respectively), PMI (17.34 ± 5.39 and 17.43 ± 8 hours, respectively), tissue storage time (67.4 ± 24.8 and 73.7 ± 18.2 months, respectively), brain pH (6.88 ± 0.21 and 6.88 ± 0.20, respectively), and RNA integrity number (RIN) number (8.6 ± 0.40 and 8.4 ± 0.67, respectively). Consensus DSM-IV diagnoses for all subjects were made using data from clinical records, toxicology studies and structured interviews with surviving relatives, as described previously (Volk et al 2000). The details of the demographic and clinical features of this subject cohort have been previously described in (Hashimoto et al 2006; Hashimoto et al 2003).
Table 1. Subjects studied.
Demographic data of these 14 matched pairs of schizophrenic and control subjects. RNA RIN denotes RNA integrity number measured by BioAnalyzer 2100 (Agilent Technologies).
| Pairs | Control | Sex/Race | Age | PMI* | Cause of Death** | pH | RNA RIN | Schizophrenia | Sex/Race | Age | PMI* | DSM IV Diagnosis | Cause of Death** | pH | RNA RIN |
|---|---|---|---|---|---|---|---|---|---|---|---|---|---|---|---|
| 1 | 592c | M/B | 41 | 22.1 | ASCVD | 6.72 | 9 | 533s | M/W | 40 | 29.1 | Chronic undifferentiated schizophrenia | Accidental asphyxiation | 6.82 | 8.4 |
| 2 | 567c | F/W | 46 | 15 | Mitral valve prolapse | 6.72 | 8.9 | 537s | F/W | 37 | 14.5 | Schizoaffective disorder+ | Suicide by hanging | 6.68 | 8.6 |
| 3 | 516c | M/B | 20 | 14 | Gun shot wound to chest | 6.86 | 8.4 | 547s | M/B | 27 | 16.5 | Schizoaffective disorder | Heat stroke | 6.95 | 7.4 |
| 4 | 630c | M/W | 65 | 21.2 | ASCVD | 6.95 | 9 | 566s | M/W | 63 | 18.3 | Chronic undifferentiated schizophreniac | ASCVD | 6.8 | 8 |
| 5 | 604c | M/W | 39 | 19.3 | Hypoplastic coronary artery | 7.08 | 8.6 | 581s | M/W | 46 | 28.1 | Chronic paranoid schizophreniaa,e | Accidental combined overdose | 7.22 | 7.9 |
| 6 | 546c | F/W | 37 | 23.5 | ASCVD | 6.74 | 8.6 | 587s | F/B | 38 | 17.8 | Chronic undifferentiated schizophreniac | Myocardial hypertrophy | 7.02 | 9 |
| 7 | 1047c | M/W | 43 | 12.4 | ASCVD | 6.63 | 9 | 722s | M/B | 45 | 9.1 | Undifferentiated schizophrenia f | Gastrointest hemorrhage | 6.71 | 9.2 |
| 8 | 551c | M/W | 61 | 16.4 | Cardiac tamponade | 6.63 | 8.3 | 625s | M/B | 49 | 23.5 | Chronic disorganized schizophreniab | ASCVD | 7.32 | 7.6 |
| 9 | 685c | M/W | 56 | 14.5 | Hypoplastic coronary artery | 6.57 | 8.1 | 622s | M/W | 58 | 18.9 | Chronic undifferentiated schizophrenia+ | Right MCA infarction | 6.78 | 7.4 |
| 10 | 681c | M/W | 51 | 11.6 | Hypertrophic cardiomyopathy | 7.15 | 8.9 | 640s | M/W | 49 | 5.2 | Chronic paranoid schizophrenia | Pulmonary embolism | 6.86 | 8.4 |
| 11 | 806c | M/W | 57 | 24 | Pulmonary thromboembolism | 6.94 | 7.8 | 665s | M/B | 59 | 28.1 | Chronic paranoid schizophreniaa | Intestinal hemorrhage | 6.92 | 9.2 |
| 12 | 822c | M/B | 28 | 25.3 | ASCVD | 7.04 | 8.5 | 787s | M/B | 27 | 19.2 | Schizoaffective disorderd | Suicide by gun shot | 6.67 | 8.4 |
| 13 | 727c | M/B | 19 | 7 | Trauma | 7.15 | 9.2 | 829s | M/W | 25 | 5 | Schizoaffective disordera,f,+ | Suicide by drug overdose | 6.8 | 9.3 |
| 14 | 871c | M/W | 28 | 16.5 | Trauma | 7.14 | 8.5 | 878s | M/W | 33 | 10.8 | Disorganized schizophreniaa | Myocardial fibrosis | 6.72 | 8.9 |
| mean | 42.2 | 17.3 | 6.88 | 8.63 | 42.5 | 17.4 | 6.88 | 8.41 | |||||||
| StDev | 14.8 | 5.39 | 0.21 | 0.40 | 12.3 | 8.01 | 0.20 | 0.67 |
2-Nimblegen Array design and processing
Our custom-designed Nimblegen DNA microarrays were composed of 60-mer single-stranded oligonucleotides synthesized by maskless in situ photolithographic synthesis. Each microarray contained probes against ∼1,800 genes. The expression of each gene was assessed by 5 independent probe sequences and each of the probes was printed at 4 technical replicates on a sub-array (Figure 1). Each microarray consisted of 5 sub-arrays, resulting in a total of 100 measurements/gene/array (5 probes × 4 replicate spots × 5 identical sub-arrays). In addition, the experiment was performed in two technical replicates using independent cDNA and cRNA synthesis steps. As a result, our dataset consisted of 56 microarrays.
Figure 1. DNA microarray design.
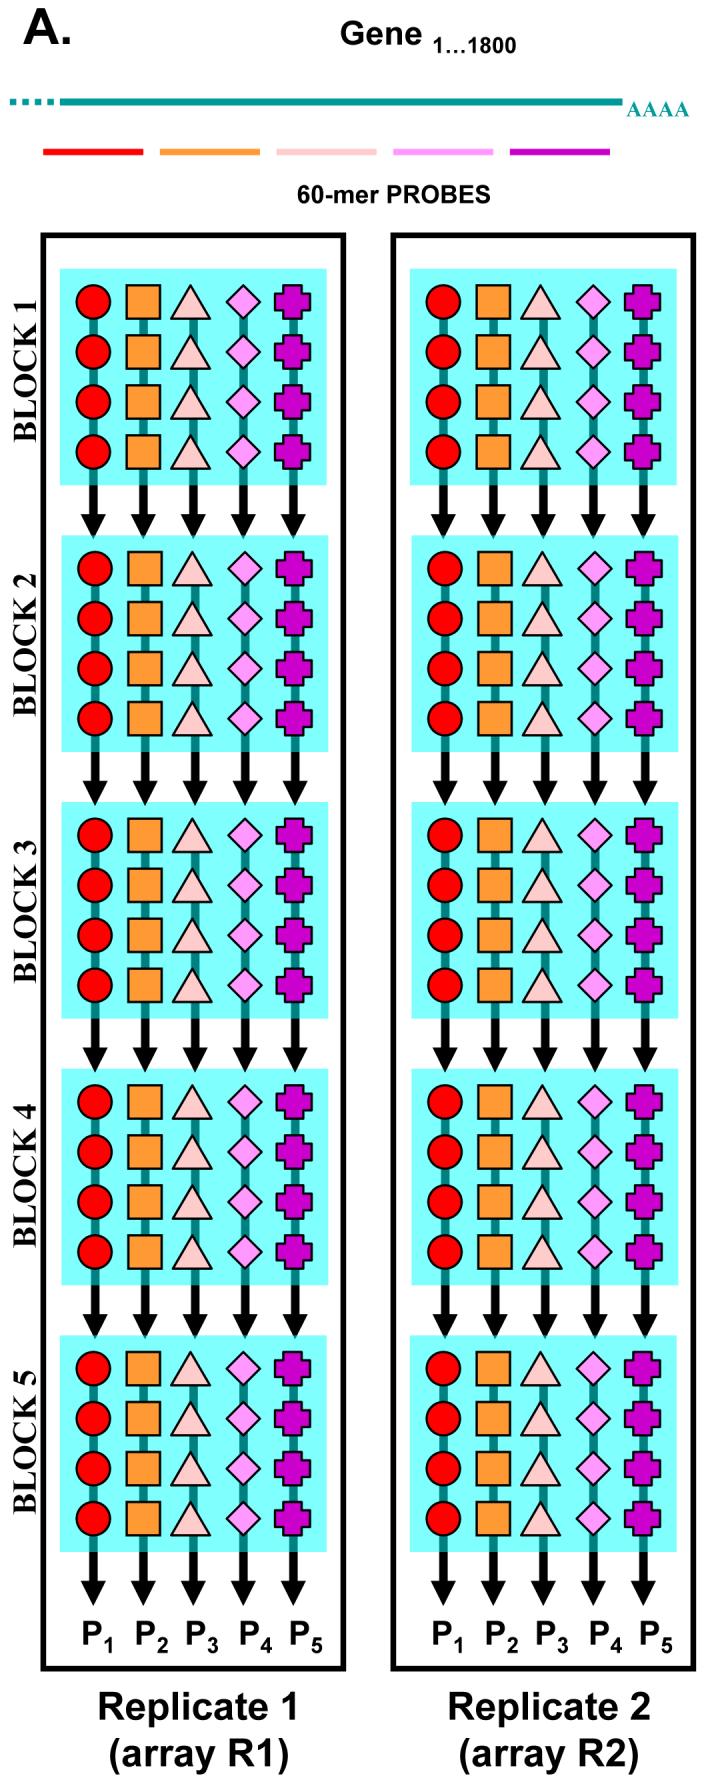
For each of the >1,800 genes 5 independent, non-overlaping 60-mer DNA probes were designed. Each array contained five identical probe-containing, photolitographically synthesized blocks (sub-arrays). Each block contained 4 probe replicates for each of the 5 probes. Fluorescent intensity values were first averaged within the block, and then across the blocks for each of the 5 probes. This gave rise to 5 intensity values, one for each probe (P1-P5). As the experiment was performed with two replicates, we obtained 10 intensity values for each of the investigated genes (5 for R1 + 5 for R2). These RMA normalized intensities entered the data mining process described in Figure 2.
The ∼1,800 gene expression probes were chosen based on 1) previous microarray studies conducted in our laboratory, 2) previously published gene expression and genetic data in schizophrenia, and 3) genes participating in cellular processes implicated in the pathophysiology of PFC dysfunction in schizophrenia. As a result, the list of microarray probes was enriched in GABA, glutamate, synaptic, glial, dopamine, serotonin system and other transcripts. Furthermore, based on previous microarray studies of subjects with schizophrenia and matched controls, an additional ∼400 genes with unaltered expression were chosen to ensure proper normalization across the microarrays.
Coronal blocks containing area 9 of the prefrontal cortex (PFC) were cut on a cryostat at 20 μm thickness. The sections were collected into tubes containing Trizol reagent (Invitrogen, Carlsbad, CA) and RNA was isolated according to the manufacturer’s instructions. RNA quality was assessed using an Agilent BioAnalyzer 2100 system (Agilent, Palo Alto, CA). After cDNA synthesis (cDNA SuperScript Custom Kit by Invitrogen Corporation, Carlsbad) and in vitro transcription (MEGAscript T7 Kit, Ambion Inc., Austin), the resulting cRNA was labeled according to Nimblegen recommendations. Hybridization was performed at the Nimblegen Systems facility using established protocols (for further information, see http://www.nimblegen.com/technology/hybe.html).
3- Data analysis
The microarray images were segmented and analyzed using a customized system named NimbleScan (http://www.nimblegen.com/products/software/nimblescan.html). Data were then normalized and analyzed using Robust Multi-array Analysis (RMA) (Irizarry et al 2003). For analysis purposes and for each gene, the 5 probes were treated as independent measurements and for each probe the result of the 20 measurements/ array were averaged into a single value. In order to define differentially expressed genes between SCZ and CTR brain samples and across the two technical replicates (R1 and R2), data were analyzed using four different strategies (Figure 2):
Figure 2. Data analysis design.

A total of four data analysis methods were employed. All 5 probes were treated independently: data across the 5 probes were never combined or averaged. A. In the first approach (groupwise analysis with independent replicates) the data from the first replicate (R1) was compared across schizophrenic (S1-S14) and control subjects (C1-C14). A similar comparison was performed across the second replicate (R2). To be considered a differentially expressed gene, a corresponding microarray probe had to show |ALR| > 0.263 and p > 0.05 in both replicates. B. In the second approach (groupwise analysis with averaged replicates), log2-normalized intensity values were averaged across the two technical replicated originating from a same subjects, and the averaged values were compared in the groupwise fashion between the controls and schizophrenic subjects (|ALR| > 0.263 and p < 0.05). C. In the third approach (pairwise analysis with independent replicates) the 14 matched pairs were compared in a pairwise fashion, generating two ALRs for each of the pairs (one for each technical replicate). Gene probes showing similar expression changes across the R1 and R2 analysis were considered differentially expressed. D. In the fourth approach (pairwise analysis with averaged replicates), the normalized log2 probe intensities were averaged across R1 and R2 for each of the five probes. Then, these average values were compared across the 14 S-C subject pairs in a matched, pairwise fashion.
A: Group wise strategy with R1 and R2 analyzed independently
In this strategy, the normalized expression levels for all 14 SCZ samples and all 14 CTR samples were first averaged and then compared. This analysis was performed for both R1 and R2 independently. A gene was then considered differentially expressed if: 1) it showed an absolute average Log2 ratio (ALR) between SCZ and CTR samples of more than 20 % (|ALR|>0.263; 1.2-fold); 2) at least one gene probe showed a groupwise Student’s t-test significance of p<0.05 between SCZ and CTR samples; and 3) the differential expression was observed in both R1 and R2.
B: Group wise strategy with R1 and R2 averaged
In B, the normalized expression levels for R1 and R2 were averaged for each SCZ and CTR samples. Then, the resulting expression levels for all 14 SCZ and 14 CTR samples were averaged and compared. A gene was then considered differentially expressed if: 1) at least one gene probe showed an absolute average Log2 expression difference between SCZ and CTR of more than 20% (|ALR|>0.263; 1.2-fold); and 2) it showed a groupwise Student’s t-test significance of p<0.05 between SCZ and CTR samples.
C: Pair wise strategy with R1 and R2 analyzed independently
In C, the normalized expression levels were compared in a pair wise fashion for each of the 14 SCZ and CTR samples. Then, the results for all 14 pairs were averaged. The same comparison was performed for each R1 and R2 independently. A gene was then considered differentially expressed if: 1) at least one gene probe showed an absolute average Log2 expression difference of more than 20% (|ALR|>0.263; 1.2-fold) between SCZ and CTR samples; 2) it showed a pairwise Student’s t-test significance of p<0.05 between SCZ and CTR samples; and 3) the differential expression was observed in both R1 and R2.
D: Pair wise strategy with R1 and R2 averaged
In D, the normalized expression levels for all CTR and SCZ pairs in R1 and R2 were averaged. Then, each matched SCZ and CTR brain samples were compared in a pair wise fashion to determine gene expression differences. A gene was then considered differentially expressed if: 1) at least one probe showed an absolute average Log2 expression difference of more than 20% (|ALR|>0.263; 1.2-fold); and 2) it showed a pairwise Student’s t-test significance of p<0.05 between SCZ and CTR samples.
A gene was considered differentially expressed if it reported significant and unidirectional differential expression in all 4 analysis strategies.
4- Clustering
Two-way cluster analyses (genes and samples) were performed on normalized log2 transformed signal levels across the 28 subjects using Euclidian distance analysis in Genes@Work developed by IBM (Lepre et al 2004).
5- Testing for confounds
The two potenial confounding factors in our study are antipsychotic medication and ethanol abuse. For post hoc testing for antipsychotic medication effects, we divided the subjects into two groups: A) pairs of subjects where the schizophrenic subjects were off medication at the time of death (Pairs 2, 9 and 13) and B) pairs of subjects where the schizophrenic subjects were on antipsychotic medication at the time of death. For post hoc testing of effects of ethanol dependence on the observed gene expression differences, we also separated the subject pairs into two groups (EtOH group: pairs 5, 9, 11, 13 and 14), this time by history of ethanol dependence and compared the expression ALRs of the two cohorts. For testing of both confounds, we assessed the gene expression of the 20 critically changed genes in across the two newly created pair groups. Data were not available about smoking history of the subjects.
6- Correlation testing
Pearson’s correlation testing was performed on the normalized log2 values for 8 selected genes (SERPINA3, IFITM1, IFITM3, CHI3L1, CD14, HSPA1B, HSPB1 and HSPA1A). The correlation was calculated on the averaged R1R2 data and across all 28 human subjects. We obtained 5 correlation values for each gene (one for each probe). The highest across-gene and within gene correlation is reported.
7- False discovery assessment
The false discovery rate (FDR) assessment, a built-in feature of this experimental design, was assessed by establishing how often the independent probes from the same gene reported opposite expression changes. In all of our analyses, two or more different probes against the same gene never reported a statistically significant expression change across the SCZ-CTR comparison in opposite directions (e.g. increase vs. decrease). This suggests a very high measurement precision and a negligible FDR for the differentially expressed genes. However, we acknowledge that our converging data mining strategy may carry an increased amount of type II error (false negative observations), which are not possible to address in current microarray experiments.
8- RT-qPCR
For selected genes showing differential expression between CTR and SCZ subjects, cDNA synthesis was performed using two independent reverse transcriptions for each sample with the High Capacity cDNA Archive Kit from Applied Biosystems (Foster City, CA). For each reaction, we used 50 ng of total RNA from each subject. Priming was performed with random hexamers according to the manufacturer’s recommendations. For each sample, amplified product differences were measured with 4 replicates using SYBR Green chemistry-based detection (Mimmack et al 2004). Mitochondrial ATP synthase 6 (MTATP6) and GAPDH were used as the endogenous reference genes, because they did not display significant variation in gene expression between CTR and SCZ samples. The efficiency for each primer set was assessed prior to qPCR measurements, and a primer set was considered valid if its efficiency was between 92 and 100 %. The qPCR reactions were carried out in an ABI Prism 7000 thermal cycler (Applied Biosystems Inc.) using the ABI Prism 7000 SDS software with the automatic baseline and threshold detection options selected. These quantified data were exported to Microsoft Excel for establishing SCZ and CTR ΔCt, determining SCZΔCt - CTRΔCt (ΔΔCt) and significance testing. A one-tailed Student’s t-test was used to determine the significance of the qPCR-reported SCZ-CTR expression differences.
9 - Data sharing
All microarray data will be made publicly available at the authors’ Web site at the time of publication.
RESULTS
In this study, a Nimblegen custom microarray analysis allowed us to compare the expression levels of >1800 different genes, including >400 control genes between SCZ and CTR samples from area 9 of human postmortem PFC. The combination of 4 independent analytical strategies reduced the dataset to 67 transcripts reporting significant differential expression between PFC-harvested samples from SCZ and CTR (|ALR|>0.263; 1.2-fold and pVal<0.05; Table 2). Of these 67 genes, 45 (67%) were found downregulated in SCZ samples compared to CTR samples with a mean ALR value of -0.58 (-1.5-fold) and 22 genes (33%) were found upregulated with a mean ALR value of 0.68 (1.6-fold). These results are in agreement with previous studies reporting a global downregulation of the expression of a variety of functional gene groups in schizophrenia (for review see (Iwamoto and Kato 2006)). The 67 differentially expressed genes between SCZ and CTR samples represented a heterogenic group of transcripts, some of which have been previously associated with the pathophysiological processes in schizophrenia. Downregulation of transferrin (TF), synapsin 2 (SYN2), synaptojanin 1 (SYNJ1), regulator of G-protein signaling 4 (RGS4), mitogen-activated protein kinase 1 (MAPK1), glutamic-oxaloacetic transaminase 1 (GOT1), potassium channel, subfamily K, member 1 (KCNK1) and mu-crystallin (CRYM) have all been previously reported to be downregulated in subjects with schizophrenia (Aston et al 2004; Hakak et al 2001; Iwamoto et al 2005; Middleton et al 2002; Mirnics et al 2000; Pongrac et al 2002; Vawter et al 2002). Finally, this experimental series also confirmed and extended previous findings of altered GABAergic system transcriptome in schizophrenia (Lewis et al 2005). Due to the volume and complexity of these findings, the GABA system related expression changes are the subject of a separate manuscript (Hashimoto et al 2006).
Table 2.
Differentially expressed genes in the PFC: A) increased and B) decreased expression in schizophrenia
| UniGene | Gene name | Chr | SYMBOL | mALR | pval |
|---|---|---|---|---|---|
| Hs.534293 | Serine (or cysteine) proteinase inhibitor A3 (alpha-1 antitrypsin) | 14q32.1 | SERPINA3 | 1.29 | 0.0017 |
| Hs.382202 | Chitinase 3-like 1 (cartilage glycoprotein-39) | 1q32.1 | CHI3L1 | 1.12 | 0.0039 |
| Hs.274402 | Heat shock 70kDa protein 1B | 6p21.3 | HSPA1B | 1.06 | 0.0004 |
| Hs.520973 | 28 kDa heat shock protein | 7q11.23 | HSPB1 | 0.89 | 0.0001 |
| Hs.374650 | Interferon induced transmembrane protein 3 (1-8U protein) | 11p15.5 | IFITM3 | 0.78 | 0.0002 |
| Hs.458414 | Interferon induced transmembrane protein 1 (9-27 protein) | 11p15.5 | IFITM1 | 0.77 | 0.0013 |
| Hs.9701 | Growth arrest and DNA-damage-inducible, gamma | 9q22.1-2 | GADD45G | 0.76 | 0.0204 |
| Hs.520028 | Heat shock 70kD protein 1A | 6p21.3 | HSPA1A | 0.75 | 0.0044 |
| Hs.78788 | Leucine-zipper-like transcriptional regulator 1 | 22q11.21 | LZTR1 | 0.60 | 0.0005 |
| Hs.163867 | CD14 antigen | 5q31.1 | CD14 | 0.58 | 0.0021 |
| Hs.534330 | Metallothionein 2A | 16q13 | MT2A | 0.58 | 0.0073 |
| Hs.632314 | Paired immunoglobulin-like receptor beta | 7q22.1 | PILRB | 0.56 | 0.0004 |
| Hs.298280 | ATP synthase, H+ transporting, mitochondrial F1 complex, alpha 1 | 18q12-21 | ATP5A1 | 0.52 | 0.0014 |
| Hs.632099 | Transgelin | 11q23.2 | TAGLN | 0.49 | 0.0065 |
| Hs.143250 | Tenascin C (hexabrachion) | 9q33 | TNC | 0.48 | 0.0014 |
| Hs.113275 | Orphan purinergic receptor P2X-like 1 | 22q11.21 | P2RXL1 | 0.45 | 0.0005 |
| Hs.166204 | PHD finger protein 1 variant 2 | 6p21.3 | PHF1 | 0.44 | 0.0002 |
| Hs.593722 | Transmembrane protein 63C | 14q24.3 | TMEM63C | 0.43 | 0.0016 |
| Hs.474935 | Semaphorin 4B | 15q25 | SEMA4B | 0.41 | 0.0000 |
| UniGene | Gene name | Chr | SYMBOL | mALR | pval |
|---|---|---|---|---|---|
| Hs.386726 | Regulator of G-protein signaling 4 | 1q23.3 | RGS4 | -0.99 | 0.0016 |
| Hs.591198 | Ecotropic viral integration site 2A (EVI2A) | 17q11.2 | EVI2A | -0.99 | 0.0062 |
| Hs.518267 | Transferrin (TF) | 3q21 | TF | -0.86 | 0.0253 |
| Hs.4865 | Sodium channel, voltage-gated, type III, beta | 11q24.1 | SCN3B | -0.75 | 0.0183 |
| Hs.431850 | Mitogen-activated protein kinase 1, transcript variant 2 | 22q11.21 | MAPK1 | -0.73 | 0.0070 |
| Hs.165636 | GTP-binding RAS-like 2 | 9q22.31 | DIRAS2 | -0.72 | 0.0074 |
| Hs.482587 | Secretory carrier membrane protein 1, variant 2 | 5q13.3-q14.1 | SCAMP1 | -0.71 | 0.0073 |
| Hs.516656 | Ephrin-A3 precursor (EHK-1 tyrosine kinase ligand EFL-2) | 1q21-q22 | EFNA3 | -0.70 | 0.0037 |
| Hs.924 | Mu-crystallin | 16p13.11-12.3 | CRYM | -0.64 | 0.0068 |
| Hs.481133 | Sparc/osteonectin (testican) 3 | 4q32.3 | SPOCK3 | -0.63 | 0.0129 |
| Hs.500015 | Cyclin-dependent kinase 5, regulatory subunit 1 (p35) | 17q11.2 | CDK5R1 | -0.62 | 0.0087 |
| Hs.208544 | Potassium channel, subfamily K, member 1 | 1q42-q43 | KCNK1 | -0.60 | 0.0045 |
| Hs.473632 | Synaptojanin 1 | 21q22.2 | SYNJ1 | -0.60 | 0.0038 |
| Hs.253844 | DnaJ (Hsp40) homolog, subfamily C, member 14 | 12q13.2 | DNAJC14 | -0.59 | 0.0179 |
| Hs.371218 | Ephrin type-A receptor 4 precursor | 2q36.1 | EPHA4 | -0.57 | 0.0192 |
| Hs.559412 | HMP19 protein | 5q35.2 | HMP19 | -0.56 | 0.0015 |
| Hs.433845 | Keratin 5 | 12q12-q13 | KRT5 | -0.56 | 0.0038 |
| Hs.213264 | Tyrosyl-tRNA synthetase | 1p34.3 | YARS | -0.56 | 0.0044 |
| Hs.132902 | CAP, adenylate cyclase-associated protein, 2 | 6p22.3 | CAP2 | -0.55 | 0.0357 |
| Hs.590868 | Zinc finger, CCCH-type with G patch domain | 20q13.3 | ZGPAT | -0.53 | 0.0048 |
| Hs.180414 | Heat shock 70kDa protein 8, transcript variant 1 | 11q24.1 | HSPA8 | -0.52 | 0.0135 |
| Hs.75249 | ADP-ribosylation factor-like 6 interacting protein | 16p12-p11.2 | ARL6IP | -0.50 | 0.0060 |
| Hs.500756 | Glutamic-oxaloacetic transaminase 1, soluble | 10q24.1-25.1 | GOT1 | -0.50 | 0.0029 |
| Hs.77318 | Platelet-activating factor acetylhydrolase Ib, alpha 45kDa | 17p13.3 | PAFAH1B1 | -0.50 | 0.0021 |
| Hs.237825 | Signal recognition particle 72kDa | 4q11 | SRP72 | -0.47 | 0.0130 |
| Hs.433442 | Kinesin-associated protein 3 | 1q23.3 | KIFAP3 | -0.47 | 0.0162 |
| Hs.34560 | LIM domain only 2 (rhombotin-like 1) | 11p13 | LMO2 | -0.47 | 0.0147 |
| Hs.528222 | NADH dehydrogenase Fe-S protein 4 (NADH Q reductase) | 5q11.1 | NDUFS4 | -0.47 | 0.0259 |
| Hs.482301 | Small glutamine rich protein with tetratricopeptide repeats 2 | 5q12.3 | SGTB | -0.47 | 0.0077 |
| Hs.792 | ADP-ribosylation factor domain protein 1, 64kDa | 5q12.2 | ARFD1 | -0.44 | 0.0175 |
| Hs.445503 | Synapsin II (SYN2), transcript variant Iia | 3p25 | SYN2 | -0.43 | 0.0023 |
| Hs.463456 | Non-metastatic cells 1, protein (NM23A) | 17q21.3 | NME1 | -0.40 | 0.0135 |
| Hs.29665 | Calsyntenin 1 | 1p36.22 | CLSTN1 | -0.38 | 0.0133 |
| Hs.503453 | Discs, large homolog 2, chapsyn-110 | 11q21 | DLG2 | -0.37 | 0.0061 |
The analyses revealed an unexpected upregulation of genes related to immune function and chaperone system. Of the 19 fully annotated transcripts that reported increased expression in subjects with schizophrenia, 10 (>50%) have been linked to functions in immune/chaperone systems (Table 2). For example, in subjects with schizophrenia >50% expression upregulation was observed for the transcripts encoding 28kDa heat shock protein (HSPB1), 70kDa heat shock protein 1B (HSPA1B), 70kDa heat shock protein 1A (HSPA1A), metallothionein 2A (MT2A), interferon induced transmembrane protein 1 (IFITM1), interferon induced transmembrane protein 3 (IFITM3), CD14 antigen (CD14), chitinase 3-like1 (CHI3L1), serine-cysteine protease inhibitor A3 (SERPINA3) and paired immunoglobulin-like receptor beta (PILRB). These transcripts and their protein products are known to exhibit increased expression in response to cellular stress and/or immune stimulation (Chung et al 2004; Chung et al 2003b; Gosslau and Rensing 2000; Kohler et al 2003; Lewin et al 1991; Mosser et al 2000; Mousseau et al 2000; Penkowa and Hidalgo 2001; Potter et al 2001; Seidberg et al 2003; Shiratori et al 2004; Smith et al 2006; Takekawa and Saito 1998; van Bilsen et al 2004; Xia et al 2006).
A two-way unsupervised clustering (genes and subjects) of the annotated gene probe signal intensities resulted in the separation of the samples in 2 different clusters (Figure 3). Of the 14 SCZ subjects, 9 3clustered together and these subjects clearly were major contributors to the statistical significance across the dataset. In contrast, the remaining 5 SCZ subjects appeared to be indistinguishable from the controls, suggesting a molecular sub-stratification within the SCZ samples. The clustering also yielded an interesting separation along the dimension of expressed genes; here, the immune/chaperone-related transcripts (MT2A, IFITM1, IFITM3, CHI3L1, SERPINA3, CD14, TNC, GADD45G, HSPB1, HSPA1B and HSPA1A) strongly clustered together as a distinct sub-group, suggesting a potential co-regulation of these molecules.
Figure 3. Hierarchical clustering of gene expression changes.

Normalized log2 intensities were clustered by Genes@Work in two dimensions (horizontal-genes; vertical-samples) based on Euclidian distance. Each colored pixel represents a single gene expression value in a single subject. The color intensity is proportional to its relative expression level (green-underexpressed; red-overexpressed). Note that a subset of subjects with schizophrenia (9/14, vertical clustering on the left) shows a commonly altered expression pattern that is distinct from the rest of the schizophrenic and control subjects. ESTs and unannotated probesets were removed from the dataset, while GABA-ergic transcripts are denoted with ***.
The pre-established criterion of the differentially expressed transcripts needing to fulfill a combination of 4 distinct data analysis strategies resulted in the reporting of only the most reliable expression changes (Table 2). Due 2 to the conservative nature of this data mining approach, however, a number of true differential expressions may have been eliminated from our dataset. In Supplemental Material 1 we report all other non-GABA system related transcripts that were differentially expressed by at least one of the four analysis strategies. Of these additional 170 putatively changed transcripts, ∼15% were found changed in previous schizophrenia studies, suggesting that these data may also contain findings for further exploration.
Testing for effects of medication and ethanol abuse
The reported expression findings did not appear to be a result of administration of chronic antipsychotic medication: subjects with schizophrenia that were off medication at time of death showed similar expression changes to subjects on medication at the time of death. For subset of the 21 most changed genes, subjects with schizophrenia on medication showed an average ALR= -0.53 for decreased, and 0.60 for the increased expression (Supplemental Material 2A). Similarly, subjects off medication at the time of death showed for the same genes an average ALR of -0.80 and 1.11, respectively, with an overall correlation of r=0.94 (p<0.01). Furthermore, in an unsupervised clustering of the gene expression changes in Figure 3, two of the three subjects with schizophrenia that were off medication (829s,622s,537s) clustered together with the subjects that were on medication at the time of death. Similarly, sample pairs where the schizophrenic subject had current alcohol abuse/dependence at the time of death showed the similar gene expression changes as the rest of the pairs where the schizophrenic subject had no active EtOH abuse/dependence. The expression differences for the critical genes were highly correlated (r=0.90, p<0.01) between these two groups, with a trend of more robust expression changes in pairs without EtOH abuse/dependence (average ALRs 0.59 vs 0.77 and -0.26 vs -0.77 - Supplemental Material 2B). Thus, based on these data, it appears that antipsychotic medication and EtOH consumption were not confounding factors in our dataset.
qPCR findings
In order to validate the microarray findings we selected 12 genes for real-time quantitative PCR (qPCR) analysis. Six of these transcripts were overexpressed (SERPINA3, CHI3L1, HSPB1, MT2A, IFITM1, IFITM3) while six other genes were underexpressed (DIRAS2, CRYM, TF, MOG, MAPK1, RGS4) in the SCZ samples. The agreement between the ΔΔCt of qPCR and DNA microarray ALR datasets was striking: the differential expression for the 12 investigated genes was correlated at r=0.93 (p<0.001) between the two methods (Figure 4).
Figure 4. qPCR and microarray data are highly correlated.

We performed qPCR validation for 12 genes showing robust gene expression differences in the microarray experiments. Validation was performed on 13 of the 14 pairs of matched subjects. Differential S-C microarray expression ALRs are plotted on X axis, while Y axis denotes ΔΔCt in the qPCR experiment. Each symbol corresponds to a single gene. Note that the microarray data are highly correlated with the qPCR data (r=0.93, p < 0.001).
In addition, as there were no probes against IFITM2 on the microarray, in the context of IFITM1 and IFITM3 transcript increases, we quantified the expression of the third family member, IFITM2. By qPCR measurement the IFITM2 overexpression in the SCZ samples was comparable to that seen to the other two IFITM family members (-ΔΔCt =0.54 or 1.45 fold increase, p<0.05).
The successful verification of the immune/chaperone system transcript findings raised the question of the origin of these robust transcriptome changes. To determine whether the observed transcriptome changes were the result of an active immune process in the brains of subjects with schizophrenia, we investigated the levels of 2-prime,5-prime oligoadenylate synthetase 1 (OAS1), a critical marker of acute viral infection and interferon gamma (IFNγ), a critical first activator of multiple downstream immune cascades, including the OAS system. Subjects with schizophrenia, when compared to matched controls, did not show altered transcript levels of OAS1 or INFγ (data not shown).
Immune/chaperone transcript co-regulation
The clustered data strongly suggested that the upregulated immune- and HSP-related transcripts may represent a robust, selectively regulated gene expression network. To test this, we performed an expression level cross-correlation of 5 immune genes with 3 HSP family members. This correlational analysis was performed across the whole dataset (28 human PFC samples) for the 5 probes/gene (Figure 5). The data revealed that the expression levels for the 5 immune markers tested (SERPINA3, IFITM1, IFITM3, CHI3L1 and CD14) were highly correlated within the human PFC (max r=0.73-0.93, all p<0.01). Similarly, the 3 HSP family members (HSPA1B, HSPB1 and HSPA1A) showed a high within-group correlation (max r=0.85-0.99, all p<0.01). In contrast, only a weak to moderate correlation was observed between the members of the chaperone and immune genes, suggesting that the modulation of the changed immune-related genes and altered chaperone-related transcripts may occur independently, and not as a direct adaptive relationship between these two systems.
Figure 5. Immune and chaperone transcripts are highly correlated.

Microarray data from 5 immune and 3 chaperone genes were examined for correlation across all schizophrenic and control samples. Numbers in black boxes report maximal self-correlation between the 5 different probes for the same gene. Brown boxes denote high correlation (r>0.70), tan boxes suggest moderate (r= 0.40-0.60) while grey boxes correspond to low correlation (r<0.39). Note that IFITM1, IFITM3, SERPINA3, CHI3L1 and CD14 show a very high correlation, and so do the HSP family molecules. However, the correlation between the immune and chaperone molecules was only moderate to weak.
DISCUSSION
Detailed analysis of the custom DNA microarray data from a cohort of 14 matched pairs of CTR and SCZ brain samples from area 9 of human PFC revealed a number of important observations related to changes in gene expression in schizophrenia. First, using rigorous and convergent statistical approaches, we identified 67 genes that were differentially regulated across CTR and SCZ samples. Second, the number of downregulated transcripts outnumbered the upregulated ones by ∼2:1 margin, confirming previous reports that gene expression changes in the PFC of subjects with schizophrenia are predominantly characterized by transcript reductions, rather than increases (Iwamoto and Kato 2006; Mirnics et al 2000). Third, we confirmed many of gene expression changes reported in previous postmortem studies, including downregulation of TF (Hakak et al 2001), RGS4 (Mirnics et al 2001), SYN2, SYNJ1, MAPK1, GOT1, KCNK1 and CRYM (Mirnics et al 2000) and upregulation of CHI3L1 (Chung et al 2003a), HSPB1 (Kuromitsu et al 2001), HSPA1B (Hakak et al 2001) and MT2A (Aston et al 2004). Fourth, we identified an unexpected and strongly correlated upregulation of a subset of genes involved in immune/chaperone function. Fifth, we found that the immune/chaperone signature was primarily present in a subset of subjects with schizophrenia. Although we recognize that chaperones can function in a wide range of roles that are independent of immune processes (e.g. response to cellular stress and signal transduction) (Garcia-Osta et al 2003; Kim et al 2001; Pae et al 2005), in our dataset we favor the interpretation that the observed chaperone and immune changes are of common origin and causally interrelated, and they will be discussed in this context.
The neuroimmune hypothesis of schizophrenia has been debated for decades (Giovannoni and Baker 2003; Hanson and Gottesman 2005; Jones et al 2005; Muller et al 2000; Muller and Schwarz 2006; Patterson 2002; Rothermundt et al 2001; Strous and Shoenfeld 2006). Relative risk for developing schizophrenia is increased more than 2-fold compared to the general population with 2nd trimester infection (reviewed by (Cannon and Clarke 2005)). Additionally, epidemiological, serological, gene expression and pathological findings all suggest an infective-immune component of the disease, albeit replication across different cohorts of patients has been elusive (Rothermundt et al 2001). Nevertheless, the combined evidence suggests an infective-immune predisposition to schizophrenia, and that this predisposition is likely to interact with genetic susceptibility for developing the disease. In this context, the changes related to immune/chaperone functions can represent either a response to an ongoing infective-immune challenge or a long-lasting signature of an immune system challenge that may have acted during brain development, which in the human extends in a lengthy fashion from 1st trimester through puberty. Most of the studies of schizophrenia to date suggest that the observed neuroimmune changes are a long-lasting consequence of a previous infective-immune challenge (for review see (Nawa and Takei 2006; Sperner-Unterweger 2005)). Here, we addressed this more directly by determining that there is no change in the transcript levels of OAS1 and INFγ, two critical markers of acute immune response (Rothwell and Hopkins 1995; Rothwell et al 1996). Thus, we also favor the interpretation of a developmentally-based, long-term alteration in the transcriptome of genes related to immune/chaperone function, although one must be aware that certain pre-mortem life stressors and adverse socio-economic conditions, which are highly prevalent in patients with schizophrenia, may also contribute to some of the observed expression changes.
Long-term consequences of early immune challenge are not unprecedented. Studies in rodents that undergo prenatal or perinatal exposure to immune challenges (such as maternal exposure to polyriboinosinic-polyribocytidilic acid - poly(I:C), a synthetic cytokine inducer), high levels of pro-inflammatory cytokines or viral infections develop post-adolescent behavioral deficits that are similar in nature to clinical manifestations in schizophrenia (Ashdown et al 2006; Meyer et al 2005; Tohmi et al 2004; Zuckerman and Weiner 2005). In the mouse, prenatal exposure in mid-pregnancy to poly(I:C) reduces the number of reelin positive cells in hippocampus (Meyer et al 2006). Furthermore, poly(I:C) administration also causes increased dopamine turnover, prepulse inhibition deficits and cognitive impairments in the adult offspring, and the latter is improved by administration of clozapine (Ozawa et al 2006). Finally, in a rat model, poly(I:C) administration during pregnancy also produced long-lasting pathophysiological changes that are also observed in schizophrenia, including dopaminergic hyperfunction and loss of latent inhibition (Zuckerman et al 2003).
In view of these data, we propose that the transcriptome signature of altered genes related to immune/chaperone function may be a consequence of early life TNF-α, IL-1, IL-6 and/or INFγ brain activation. In this proposed mechanism, the elevated pro-inflammatory cytokine levels during late embryonic development or perinatal period could not only impair normal differentiation and/or refinement of neural connectivity, but also leave behind a specific immune/chaperone signature primarily consisting of altered IFITM, SERPINA3 and HSP transcript increases.
How does elevation of these immune/chaperone system molecules contribute to the symptoms of schizophrenia? The present study does not address this directly, but we speculate that this immune/chaperone signature extends beyond a correlation with an early environmental insult and may actively contribute to the clinical features of the illness. Many immune/chaperone genes are known to be essential for the normal functioning of the CNS, and immune function genes are capable of altering cognitive performance (Blalock et al 2003; Heyser et al 1997; Hoffman et al 1998; Wilson et al 2002; Ziv et al 2006). The causality between the immune/chaperone gene expression changes and altered cognitive performance in schizophrenic patients needs to be addressed in comprehensive clinical studies and in animal models.
In conclusion, our data suggest that a subgroup of subjects with schizophrenia carries an immune/chaperone transcriptome signature of an early environmental insult in the PFC. The identification of this putative immune/chaperone molecular sub-phenotype of schizophrenia, if it is validated across other cohorts of subjects, will allow a separate, mechanistic follow-up in the context of behavioral changes associated with the disease.
Supplementary Material
01
02
03
ACKNOWLEGEMENT
We are thankful to Drs. Christine Konradi and Krassimira Garbett for valuable comments on the manuscript. We also thank to Katherine C. Douglas, Annie Bedison and Melissa Macioce for superb technical assistance with the experiments. This work was supported by R01 MH067234 (KM), 2 P50 MH45156 CCNMD Project 2 (KM) and K02 MH070786 (KM).
Footnotes
Publisher's Disclaimer: This is a PDF file of an unedited manuscript that has been accepted for publication. As a service to our customers we are providing this early version of the manuscript. The manuscript will undergo copyediting, typesetting, and review of the resulting proof before it is published in its final citable form. Please note that during the production process errors may be discovered which could affect the content, and all legal disclaimers that apply to the journal pertain.
References
- Altar CA, Jurata LW, Charles V, et al. Deficient hippocampal neuron expression of proteasome, ubiquitin, and mitochondrial genes in multiple schizophrenia cohorts. Biol Psychiatry. 2005;58:85–96. doi: 10.1016/j.biopsych.2005.03.031. [DOI] [PubMed] [Google Scholar]
- Ashdown H, Dumont Y, Ng M, Poole S, Boksa P, Luheshi GN. The role of cytokines in mediating effects of prenatal infection on the fetus: implications for schizophrenia. Mol Psychiatry. 2006;11:47–55. doi: 10.1038/sj.mp.4001748. [DOI] [PubMed] [Google Scholar]
- Aston C, Jiang L, Sokolov BP. Microarray analysis of postmortem temporal cortex from patients with schizophrenia. J Neurosci Res. 2004;77:858–66. doi: 10.1002/jnr.20208. [DOI] [PubMed] [Google Scholar]
- Blalock EM, Chen KC, Sharrow K, et al. Gene microarrays in hippocampal aging: statistical profiling identifies novel processes correlated with cognitive impairment. J Neurosci. 2003;23:3807–19. doi: 10.1523/JNEUROSCI.23-09-03807.2003. [DOI] [PMC free article] [PubMed] [Google Scholar]
- Cannon M, Clarke MC. Risk for schizophrenia--broadening the concepts, pushing back the boundaries. Schizophr Res. 2005;79:5–13. doi: 10.1016/j.schres.2005.05.027. [DOI] [PubMed] [Google Scholar]
- Chung C, Tallerico T, Seeman P. Schizophrenia hippocampus has elevated expression of chondrex glycoprotein gene. Synapse. 2003a;50:29–34. doi: 10.1002/syn.10228. [DOI] [PubMed] [Google Scholar]
- Chung RS, Adlard PA, Dittmann J, Vickers JC, Chuah MI, West AK. Neuron-glia communication: metallothionein expression is specifically up-regulated by astrocytes in response to neuronal injury. J Neurochem. 2004;88:454–61. doi: 10.1046/j.1471-4159.2003.02193.x. [DOI] [PubMed] [Google Scholar]
- Chung RS, Vickers JC, Chuah MI, West AK. Metallothionein-IIA promotes initial neurite elongation and postinjury reactive neurite growth and facilitates healing after focal cortical brain injury. J Neurosci. 2003b;23:3336–42. doi: 10.1523/JNEUROSCI.23-08-03336.2003. [DOI] [PMC free article] [PubMed] [Google Scholar]
- Garcia-Osta A, Frechilla D, Del Rio J. Reduced basal and phencyclidine-induced expression of heat shock protein-70 in rat prefrontal cortex by the atypical antipsychotic abaperidone. Prog Neuropsychopharmacol Biol Psychiatry. 2003;27:31–6. doi: 10.1016/s0278-5846(02)00311-1. [DOI] [PubMed] [Google Scholar]
- Giovannoni G, Baker D. Inflammatory disorders of the central nervous system. Curr Opin Neurol. 2003;16:347–50. doi: 10.1097/01.wco.0000073936.19076.9c. [DOI] [PubMed] [Google Scholar]
- Gosslau A, Rensing L. Induction of Hsp68 by oxidative stress involves the lipoxygenase pathway in C6 rat glioma cells. Brain Res. 2000;864:114–23. doi: 10.1016/s0006-8993(00)02195-8. [DOI] [PubMed] [Google Scholar]
- Hakak Y, Walker JR, Li C, et al. Genome-wide expression analysis reveals dysregulation of myelination-related genes in chronic schizophrenia. Proc Natl Acad Sci U S A. 2001;98:4746–51. doi: 10.1073/pnas.081071198. [DOI] [PMC free article] [PubMed] [Google Scholar]
- Hanson DR, Gottesman II. Theories of schizophrenia: a genetic-inflammatory-vascular synthesis. BMC Med Genet. 2005;6:7. doi: 10.1186/1471-2350-6-7. [DOI] [PMC free article] [PubMed] [Google Scholar]
- Hashimoto T, Arion D, Unger T, et al. Analysis of GABA-related transcriptome in the prefrontal cortex of subjects with schizophrenia. J Neurosci. 2006 doi: 10.1038/sj.mp.4002011. in submission. [DOI] [PMC free article] [PubMed] [Google Scholar]
- Hashimoto T, Volk DW, Eggan SM, et al. Gene expression deficits in a subclass of GABA neurons in the prefrontal cortex of subjects with schizophrenia. J Neurosci. 2003;23:6315–26. doi: 10.1523/JNEUROSCI.23-15-06315.2003. [DOI] [PMC free article] [PubMed] [Google Scholar]
- Heyser CJ, Masliah E, Samimi A, Campbell IL, Gold LH. Progressive decline in avoidance learning paralleled by inflammatory neurodegeneration in transgenic mice expressing interleukin 6 in the brain. Proc Natl Acad Sci U S A. 1997;94:1500–5. doi: 10.1073/pnas.94.4.1500. [DOI] [PMC free article] [PubMed] [Google Scholar]
- Hoffman SA, Shucard DW, Harbeck RJ. The immune system can affect learning: chronic immune complex disease in a rat model. J Neuroimmunol. 1998;86:163–70. doi: 10.1016/s0165-5728(98)00052-6. [DOI] [PubMed] [Google Scholar]
- Hollingshead D, Lewis DA, Mirnics K. Platform influence on DNA microarray data in postmortem brain research. Neurobiol Dis. 2005;18:649–55. doi: 10.1016/j.nbd.2004.10.020. [DOI] [PubMed] [Google Scholar]
- Irizarry RA, Hobbs B, Collin F, et al. Exploration, normalization, and summaries of high density oligonucleotide array probe level data. Biostatistics. 2003;4:249–64. doi: 10.1093/biostatistics/4.2.249. [DOI] [PubMed] [Google Scholar]
- Iwamoto K, Bundo M, Kato T. Altered expression of mitochondria-related genes in postmortem brains of patients with bipolar disorder or schizophrenia, as revealed by large-scale DNA microarray analysis. Hum Mol Genet. 2005;14:241–53. doi: 10.1093/hmg/ddi022. [DOI] [PubMed] [Google Scholar]
- Iwamoto K, Kato T. Gene expression profiling in schizophrenia and related mental disorders. Neuroscientist. 2006;12:349–61. doi: 10.1177/1073858406287536. [DOI] [PubMed] [Google Scholar]
- Jablensky A. Epidemiology of schizophrenia: the global burden of disease and disability. Eur Arch Psychiatry Clin Neurosci. 2000;250:274–85. doi: 10.1007/s004060070002. [DOI] [PubMed] [Google Scholar]
- Jones AL, Mowry BJ, Pender MP, Greer JM. Immune dysregulation and self-reactivity in schizophrenia: do some cases of schizophrenia have an autoimmune basis? Immunol Cell Biol. 2005;83:9–17. doi: 10.1111/j.1440-1711.2005.01305.x. [DOI] [PubMed] [Google Scholar]
- Kim JJ, Lee SJ, Toh KY, Lee CU, Lee C, Paik IH. Identification of antibodies to heat shock proteins 90 kDa and 70 kDa in patients with schizophrenia. Schizophr Res. 2001;52:127–35. doi: 10.1016/s0920-9964(00)00091-8. [DOI] [PubMed] [Google Scholar]
- Kohler LB, Berezin V, Bock E, Penkowa M. The role of metallothionein II in neuronal differentiation and survival. Brain Res. 2003;992:128–36. doi: 10.1016/j.brainres.2003.08.049. [DOI] [PubMed] [Google Scholar]
- Kuromitsu J, Yokoi A, Kawai T, et al. Reduced neuropeptide Y mRNA levels in the frontal cortex of people with schizophrenia and bipolar disorder. Brain Res Gene Expr Patterns. 2001;1:17–21. doi: 10.1016/s1567-133x(01)00003-5. [DOI] [PubMed] [Google Scholar]
- Lepre J, Rice JJ, Tu Y, Stolovitzky G. Genes@Work: an efficient algorithm for pattern discovery and multivariate feature selection in gene expression data. Bioinformatics. 2004;20:1033–44. doi: 10.1093/bioinformatics/bth035. [DOI] [PubMed] [Google Scholar]
- Lewin AR, Reid LE, McMahon M, Stark GR, Kerr IM. Molecular analysis of a human interferon-inducible gene family. Eur J Biochem. 1991;199:417–23. doi: 10.1111/j.1432-1033.1991.tb16139.x. [DOI] [PubMed] [Google Scholar]
- Lewis DA, Hashimoto T, Volk DW. Cortical inhibitory neurons and schizophrenia. Nat Rev Neurosci. 2005;6:312–24. doi: 10.1038/nrn1648. [DOI] [PubMed] [Google Scholar]
- Lewis DA, Levitt P. Schizophrenia as a disorder of neurodevelopment. Annu Rev Neurosci. 2002;25:409–32. doi: 10.1146/annurev.neuro.25.112701.142754. [DOI] [PubMed] [Google Scholar]
- Meyer U, Feldon J, Schedlowski M, Yee BK. Towards an immuno-precipitated neurodevelopmental animal model of schizophrenia. Neurosci Biobehav Rev. 2005;29:913–47. doi: 10.1016/j.neubiorev.2004.10.012. [DOI] [PubMed] [Google Scholar]
- Meyer U, Nyffeler M, Engler A, et al. The time of prenatal immune challenge determines the specificity of inflammation-mediated brain and behavioral pathology. J Neurosci. 2006;26:4752–62. doi: 10.1523/JNEUROSCI.0099-06.2006. [DOI] [PMC free article] [PubMed] [Google Scholar]
- Middleton FA, Mirnics K, Pierri JN, Lewis DA, Levitt P. Gene expression profiling reveals alterations of specific metabolic pathways in schizophrenia. J Neurosci. 2002;22:2718–29. doi: 10.1523/JNEUROSCI.22-07-02718.2002. [DOI] [PMC free article] [PubMed] [Google Scholar]
- Middleton FA, Peng L, Lewis DA, Levitt P, Mirnics K. Altered expression of 14-3-3 genes in the prefrontal cortex of subjects with schizophrenia. Neuropsychopharmacology. 2005;30:974–83. doi: 10.1038/sj.npp.1300674. [DOI] [PubMed] [Google Scholar]
- Mimmack ML, Brooking J, Bahn S. Quantitative polymerase chain reaction: validation of microarray results from postmortem brain studies. Biol Psychiatry. 2004;55:337–45. doi: 10.1016/j.biopsych.2003.09.007. [DOI] [PubMed] [Google Scholar]
- Mirnics K, Levitt P, Lewis DA. Critical appraisal of DNA microarrays in psychiatric genomics. Biol Psychiatry. 2006;60:163–76. doi: 10.1016/j.biopsych.2006.02.003. [DOI] [PubMed] [Google Scholar]
- Mirnics K, Middleton FA, Marquez A, Lewis DA, Levitt P. Molecular characterization of schizophrenia viewed by microarray analysis of gene expression in prefrontal cortex. Neuron. 2000;28:53–67. doi: 10.1016/s0896-6273(00)00085-4. [DOI] [PubMed] [Google Scholar]
- Mirnics K, Middleton FA, Stanwood GD, Lewis DA, Levitt P. Disease-specific changes in regulator of G-protein signaling 4 (RGS4) expression in schizophrenia. Mol Psychiatry. 2001;6:293–301. doi: 10.1038/sj.mp.4000866. [DOI] [PubMed] [Google Scholar]
- Mosser DD, Caron AW, Bourget L, et al. The chaperone function of hsp70 is required for protection against stress-induced apoptosis. Mol Cell Biol. 2000;20:7146–59. doi: 10.1128/mcb.20.19.7146-7159.2000. [DOI] [PMC free article] [PubMed] [Google Scholar]
- Mousseau DD, Banville D, L’Abbe D, Bouchard P, Shen SH. PILRalpha, a novel immunoreceptor tyrosine-based inhibitory motif-bearing protein, recruits SHP-1 upon tyrosine phosphorylation and is paired with the truncated counterpart PILRbeta. J Biol Chem. 2000;275:4467–74. doi: 10.1074/jbc.275.6.4467. [DOI] [PubMed] [Google Scholar]
- Muller N, Riedel M, Gruber R, Ackenheil M, Schwarz MJ. The immune system and schizophrenia. An integrative view. Ann N Y Acad Sci. 2000;917:456–67. doi: 10.1111/j.1749-6632.2000.tb05410.x. [DOI] [PubMed] [Google Scholar]
- Muller N, Schwarz MJ. Neuroimmune-endocrine crosstalk in schizophrenia and mood disorders. Expert Rev Neurother. 2006;6:1017–38. doi: 10.1586/14737175.6.7.1017. [DOI] [PubMed] [Google Scholar]
- Nawa H, Takei N. Recent progress in animal modeling of immune inflammatory processes in schizophrenia: Implication of specific cytokines. Neurosci Res. 2006;56:2–13. doi: 10.1016/j.neures.2006.06.002. [DOI] [PubMed] [Google Scholar]
- Ozawa K, Hashimoto K, Kishimoto T, Shimizu E, Ishikura H, Iyo M. Immune activation during pregnancy in mice leads to dopaminergic hyperfunction and cognitive impairment in the offspring: a neurodevelopmental animal model of schizophrenia. Biol Psychiatry. 2006;59:546–54. doi: 10.1016/j.biopsych.2005.07.031. [DOI] [PubMed] [Google Scholar]
- Pae CU, Kim TS, Kwon OJ, et al. Polymorphisms of heat shock protein 70 gene (HSPA1A, HSPA1B and HSPA1L) and schizophrenia. Neurosci Res. 2005;53:8–13. doi: 10.1016/j.neures.2005.05.004. [DOI] [PubMed] [Google Scholar]
- Patterson PH. Maternal infection: window on neuroimmune interactions in fetal brain development and mental illness. Curr Opin Neurobiol. 2002;12:115–8. doi: 10.1016/s0959-4388(02)00299-4. [DOI] [PubMed] [Google Scholar]
- Penkowa M, Hidalgo J. Metallothionein treatment reduces proinflammatory cytokines IL-6 and TNF-alpha and apoptotic cell death during experimental autoimmune encephalomyelitis (EAE) Exp Neurol. 2001;170:1–14. doi: 10.1006/exnr.2001.7675. [DOI] [PubMed] [Google Scholar]
- Pongrac J, Middleton FA, Lewis DA, Levitt P, Mirnics K. Gene expression profiling with DNA microarrays: advancing our understanding of psychiatric disorders. Neurochem Res. 2002;27:1049–63. doi: 10.1023/a:1020904821237. [DOI] [PubMed] [Google Scholar]
- Potter H, Wefes IM, Nilsson LN. The inflammation-induced pathological chaperones ACT and apo-E are necessary catalysts of Alzheimer amyloid formation. Neurobiol Aging. 2001;22:923–30. doi: 10.1016/s0197-4580(01)00308-6. [DOI] [PubMed] [Google Scholar]
- Prabakaran S, Swatton JE, Ryan MM, et al. Mitochondrial dysfunction in schizophrenia: evidence for compromised brain metabolism and oxidative stress. Mol Psychiatry. 2004;9:684, 643–97. doi: 10.1038/sj.mp.4001511. [DOI] [PubMed] [Google Scholar]
- Rothermundt M, Arolt V, Bayer TA. Review of immunological and immunopathological findings in schizophrenia. Brain Behav Immun. 2001;15:319–39. doi: 10.1006/brbi.2001.0648. [DOI] [PubMed] [Google Scholar]
- Rothwell NJ, Hopkins SJ. Cytokines and the nervous system II: Actions and mechanisms of action. Trends Neurosci. 1995;18:130–6. doi: 10.1016/0166-2236(95)93890-a. [DOI] [PubMed] [Google Scholar]
- Rothwell NJ, Luheshi G, Toulmond S. Cytokines and their receptors in the central nervous system: physiology, pharmacology, and pathology. Pharmacol Ther. 1996;69:85–95. doi: 10.1016/0163-7258(95)02033-0. [DOI] [PubMed] [Google Scholar]
- Seidberg NA, Clark RS, Zhang X, et al. Alterations in inducible 72-kDa heat shock protein and the chaperone cofactor BAG-1 in human brain after head injury. J Neurochem. 2003;84:514–21. doi: 10.1046/j.1471-4159.2003.01547.x. [DOI] [PubMed] [Google Scholar]
- Shiratori I, Ogasawara K, Saito T, Lanier LL, Arase H. Activation of natural killer cells and dendritic cells upon recognition of a novel CD99-like ligand by paired immunoglobulin-like type 2 receptor. J Exp Med. 2004;199:525–33. doi: 10.1084/jem.20031885. [DOI] [PMC free article] [PubMed] [Google Scholar]
- Smith RA, Young J, Weis JJ, Weis JH. Expression of the mouse fragilis gene products in immune cells and association with receptor signaling complexes. Genes Immun. 2006;7:113–21. doi: 10.1038/sj.gene.6364278. [DOI] [PubMed] [Google Scholar]
- Sperner-Unterweger B. Immunological aetiology of major psychiatric disorders: evidence and therapeutic implications. Drugs. 2005;65:1493–520. doi: 10.2165/00003495-200565110-00004. [DOI] [PubMed] [Google Scholar]
- Strous RD, Shoenfeld Y. Schizophrenia, autoimmunity and immune system dysregulation: A comprehensive model updated and revisited. J Autoimmun. 2006 doi: 10.1016/j.jaut.2006.07.006. [DOI] [PubMed] [Google Scholar]
- Takekawa M, Saito H. A family of stress-inducible GADD45-like proteins mediate activation of the stress-responsive MTK1/MEKK4 MAPKKK. Cell. 1998;95:521–30. doi: 10.1016/s0092-8674(00)81619-0. [DOI] [PubMed] [Google Scholar]
- Tkachev D, Mimmack ML, Ryan MM, et al. Oligodendrocyte dysfunction in schizophrenia and bipolar disorder. Lancet. 2003;362:798–805. doi: 10.1016/S0140-6736(03)14289-4. [DOI] [PubMed] [Google Scholar]
- Tohmi M, Tsuda N, Watanabe Y, Kakita A, Nawa H. Perinatal inflammatory cytokine challenge results in distinct neurobehavioral alterations in rats: implication in psychiatric disorders of developmental origin. Neurosci Res. 2004;50:67–75. doi: 10.1016/j.neures.2004.05.010. [DOI] [PubMed] [Google Scholar]
- van Bilsen JH, van Dongen H, Lard LR, et al. Functional regulatory immune responses against human cartilage glycoprotein-39 in health vs. proinflammatory responses in rheumatoid arthritis. Proc Natl Acad Sci U S A. 2004;101:17180–5. doi: 10.1073/pnas.0407704101. [DOI] [PMC free article] [PubMed] [Google Scholar]
- Vawter MP, Crook JM, Hyde TM, et al. Microarray analysis of gene expression in the prefrontal cortex in schizophrenia: a preliminary study. Schizophr Res. 2002;58:11–20. doi: 10.1016/s0920-9964(01)00377-2. [DOI] [PubMed] [Google Scholar]
- Volk DW, Austin MC, Pierri JN, Sampson AR, Lewis DA. Decreased glutamic acid decarboxylase67 messenger RNA expression in a subset of prefrontal cortical gamma-aminobutyric acid neurons in subjects with schizophrenia. Arch Gen Psychiatry. 2000;57:237–45. doi: 10.1001/archpsyc.57.3.237. [DOI] [PubMed] [Google Scholar]
- Wilson CJ, Finch CE, Cohen HJ. Cytokines and cognition--the case for a head-to-toe inflammatory paradigm. J Am Geriatr Soc. 2002;50:2041–56. doi: 10.1046/j.1532-5415.2002.50619.x. [DOI] [PubMed] [Google Scholar]
- Xia Y, Yamagata K, Krukoff TL. Differential expression of the CD14/TLR4 complex and inflammatory signaling molecules following i.c.v. administration of LPS. Brain Res. 2006 doi: 10.1016/j.brainres.2006.03.112. [DOI] [PubMed] [Google Scholar]
- Ziv Y, Ron N, Butovsky O, et al. Immune cells contribute to the maintenance of neurogenesis and spatial learning abilities in adulthood. Nat Neurosci. 2006;9:268–75. doi: 10.1038/nn1629. [DOI] [PubMed] [Google Scholar]
- Zuckerman L, Rehavi M, Nachman R, Weiner I. Immune activation during pregnancy in rats leads to a postpubertal emergence of disrupted latent inhibition, dopaminergic hyperfunction, and altered limbic morphology in the offspring: a novel neurodevelopmental model of schizophrenia. Neuropsychopharmacology. 2003;28:1778–89. doi: 10.1038/sj.npp.1300248. [DOI] [PubMed] [Google Scholar]
- Zuckerman L, Weiner I. Maternal immune activation leads to behavioral and pharmacological changes in the adult offspring. J Psychiatr Res. 2005;39:311–23. doi: 10.1016/j.jpsychires.2004.08.008. [DOI] [PubMed] [Google Scholar]
Associated Data
This section collects any data citations, data availability statements, or supplementary materials included in this article.
Supplementary Materials
01
02
03