Kinetic Outlier Detection (KOD) in real-time PCR (original) (raw)
Abstract
Real-time PCR is becoming the method of choice for precise quantification of minute amounts of nucleic acids. For proper comparison of samples, almost all quantification methods assume similar PCR efficiencies in the exponential phase of the reaction. However, inhibition of PCR is common when working with biological samples and may invalidate the assumed similarity of PCR efficiencies. Here we present a statistical method, Kinetic Outlier Detection (KOD), to detect samples with dissimilar efficiencies. KOD is based on a comparison of PCR efficiency, estimated from the amplification curve of a test sample, with the mean PCR efficiency of samples in a training set. KOD is demonstrated and validated on samples with the same initial number of template molecules, where PCR is inhibited to various degrees by elevated concentrations of dNTP; and in detection of cDNA samples with an aberrant ratio of two genes. Translating the dissimilarity in efficiency to quantity, KOD identifies outliers that differ by 1.3–1.9-fold in their quantity from normal samples with a _P_-value of 0.05. This precision is higher than the minimal 2-fold difference in number of DNA molecules that real-time PCR usually aims to detect. Thus, KOD may be a useful tool for outlier detection in real-time PCR.
INTRODUCTION
The high sensitivity and accuracy of real-time PCR make it the preferred method for quantification of minute amounts of specific DNA sequences. It is mainly used in research but is rapidly finding its way to high-throughput clinical diagnostics. Quantification by real-time PCR is very sensitive to subtle differences in PCR efficiency between samples. Even a small difference of 5% in PCR efficiency will result in a 3-fold difference in the amount of DNA after 25 cycles of exponential amplification. Hence, for proper quantification, most quantification methods assume that the compared samples have similar PCR efficiency (1–3). However, PCR inhibition that substantially impairs the accuracy of the quantification is common and is therefore a major problem when working with biological samples (4–7). Four solutions that take sample-specific PCR efficiency into account have been suggested (8–11). The first requires running two additional PCR systems in multiplex configuration, which rather complicates the set up of the system (10). The second involves extensive dilutions which are not feasible with low copy number sample and are laborious in high throughput studies (9). The third and fourth solutions quantify the DNA amount by estimating the PCR efficiency of each sample (8,11) and technically are the easiest to implement. However, both studies neglect the variance of the results due to the variance of the measured PCR efficiency and consequently leave the usability of these methods an open question. Surprisingly, despite the wide awareness to the problem of dissimilar PCR efficiencies and the extensive efforts that have been put forward to solve it, no method to identify dissimilarities in PCR efficiency has been published. There fore, the aim of this study was to develop a tool to detect samples that do not obey the assumption of similar PCR efficiencies.
In real-time PCR, the rise in fluorescence with increasing cycle number reflects the efficiency of the reaction. PCR efficiency can be estimated by fitting the logarithmic phase of the amplification curve above a certain threshold to an exponential equation (12) or by modeling the entire amplification curve (13–15). These approaches are called ‘kinetic PCR’. The way real-time PCR raw data are processed and analyzed affects the accuracy of the estimation of PCR efficiency. Changes in the estimation of PCR efficiency may arise from different background subtraction, threshold setting, number of data points fitted and the fitting algorithm used. However, when examining whether samples have similar PCR efficiency or not, the reproducibility of the estimation is more important than its accuracy. Hence, as long as the same procedure is used to estimate PCR efficiencies in all samples, any significant difference between estimated efficiencies should reflect differences in true efficiencies.
In this work, we use kinetic PCR (12) to estimate the PCR efficiencies of a large number of samples, then we characterize the variance of the efficiency, and finally we apply its square root (the standard deviation, S.D.) as the criterion to tell whether a test sample has a PCR efficiency similar to that of a training set or not. We name this method Kinetic Outlier Detection (KOD). We test KOD on two systems. In the first system we compare the PCR efficiency of a training set based on dilution series of purified PCR product to that of a series of test samples inhibited to various levels by elevated concentrations of dNTP. In the second system we compare the PCR efficiency of a training set to that of cDNA samples and identify samples with aberrant gene expression.
MATERIALS AND METHODS
Animal experiments
Fifteen Male Sprague–Dawley rats (B&K Universal AB, Sollentuna, Sweden) weighing 230–260 g at death were used in this study. They were kept at standard laboratory conditions; 0.2 or 0.7 mg/kg of the noncompetitive _N_-methyl-d-aspartate (NMDA) receptor antagonist, dizocilpine (5R,10S)-(+)- 5-methyl-10,11-dihydro-5H-dibenzo[a,_d_]cyclohepten-5,10-imine, here referred to as (+)-MK 801 hydrogen maleate (Sigma) or saline were administered intraperitoneally 60 min before death. Injection volumes were 5 ml/kg and control animals were given corresponding vehicle injections.
Briefly, the rats were sacrificed by decapitation, their brains quickly removed, put on an ice-chilled Petri dish and dissected into limbic forebrain, corpus striatum, mesencephalon and thalamus. All dissected parts were immediately frozen on dry ice and thereafter stored at –80°C until used.
RNA isolation and reverse transcription
Total RNA was extracted from the mesencephalon, thalamus, corpus striatum and limbic forebrain of the 15 rats as described (16), altogether giving 60 RNA samples. RNA pellets were dissolved in MQ water and the sample concentration was determined spectrophotometrically. Reverse transcription was performed in a total volume of 20 µl using a ThermoScript kit (Invitrogen Life Technologies), 1 µg total RNA, 15 U ThermoScript RT, 50 pmol of oligo(dT)20, 100 ng random hexamers, 1× synthesis buffer, 0.05 M DTT, 40 U RNaseOUT and 1 mM dNTP mix (all supplied in the ThermoScript kit). The cDNA synthesis was performed according to the instructions of the manufacturer. PCR amplicons were purified with QIAquick PCR Purification Kit (QIAGEN, Washington, USA) for later use in the dNTP titration experiment.
Real-time PCR measurements
The primers for rat 18S and cyclophilin (accession numbers V01270 and M19533) were designed using Primer3 (http://www-genome.wi.mit.edu/cgi-bin/primer/primer3_www.cgi). Primers for the 18S assay: 5′-ACGGAAGGGCACCACCAGGA-3′ and 5′-CACCACCACCCACGGAATCG-3′, cyclophilin assay: 5′-GTCTCTTTTCGCCGCTTGCT-3′ and 5′-TCTGCTGTCTTTGGAACTTTGTCTG-3′ were synthesized and purified by MWG Biotech (Ebersberg, Germany). Real-time PCR conditions for the 18S and cyclophilin assay: 1 U Taq DNA polymerase (Sigma–Aldrich, St Louis, MO, USA), 10 mM Tris–HCl at pH 8.3, 50 mM KCl, 2.5 mM MgCl2, 0.4 µM of each primer, 0.2 g/l BSA (MBI Fermentas), 0.2 mM dNTP (Sigma–Aldrich, St Louis, MO, USA), 0.2× SYBR Green I (Molecular Probes, Rockland, ME, USA). The final volume of samples was 20 µl. PCR was inhibited by elevated concentrations of 0.3–1 mM dNTP (17).
Real-time PCR was measured on a LightCycler (Roche Diagnostics) using the following settings for rat 18S and cyclophilin assays: 15 s pre-incubation at 95°C followed by 50 cycles of denaturation at 95°C for 1 s, annealing at 56°C for 3 s, elongation at 72°C for 7 s. Fluorescence was measured at the end of the elongation phase using 470 nm excitation and 530 nm emission (channel 1). Correct PCR products were confirmed by agarose gel electrophoresis (2% w/v) and melting curve analysis (18). The ratio of gene expression was calculated by standard curve (2), where for every run, a new standard curve was constructed based on the same purified PCR product of the quantified gene.
All computation was done with MATLAB version 6.1.0.450, MathWorks, Inc.
Estimation of PCR efficiency
Outlier detection by KOD involves estimating the sample specific PCR efficiency from the amplification curve. Several methods for estimation of PCR efficiency are known (12–14). Here we use Exponential Fit (EF) (12). In EF, the background signal is removed by subtracting the arithmetic average of the five lowest fluorescence readings from all data points in the amplification curve. The PCR efficiency is then estimated by fitting selected points (Fig. 1) above a certain threshold to:
Figure 1.
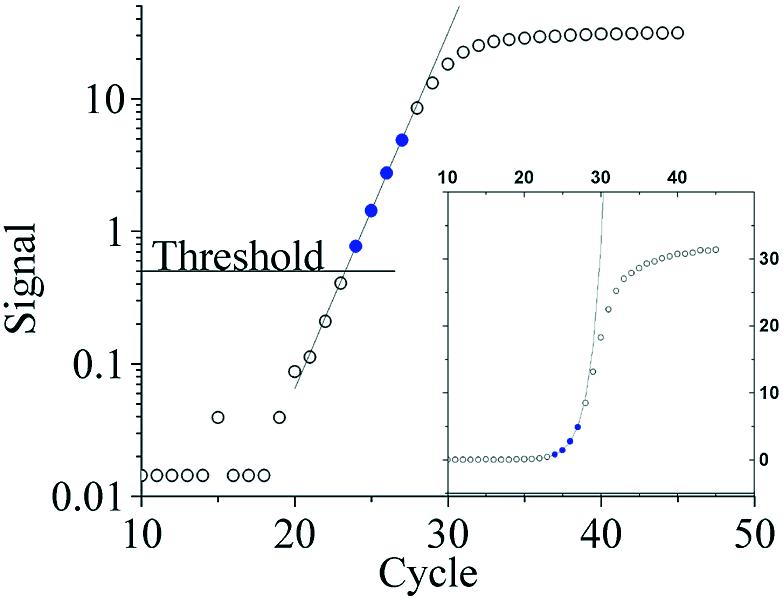
Estimation of PCR efficiency by exponential fit. Three to five data points (filled circles) above threshold level are fitted by an exponential equation 1 to estimate PCR efficiency. Main frame: semi-logarithmic scale, inset: linear scale.
_R_n = _R_0 × (1 + E)n 1
where _R_n is the signal corresponding to the number of template molecules at cycle n and _R_0 is the signal corresponding to the initial number of template molecules. E is the PCR efficiency (0 ≤ E ≤ 1, i.e. E = 1 is equal to 100% efficiency).
Mathematical model of KOD
Having a method to estimate PCR efficiency, the next step was to set a criterion to identify deviating test samples. This was done by comparing PCR efficiency of a test sample with the efficiencies of a training set composed of 8–15 samples (e.g. dilution series) that were estimated at the same setting of threshold and number of fitted points. A test sample is classified as an outlier if
Here, Φ is the cumulative distribution function for the standard normal distribution, _e_i is the observed efficiency of a test sample, µtrain is the mean efficiency of the training set and σ is the S.D. of the efficiency of the training set, here according to the optimization study.
RESULTS
Setting optimization
The reliability of KOD is based on precise estimation of PCR efficiency. To achieve the highest precision in the estimation, the fitted points should be in the exponential phase, where PCR efficiency is most similar among different amplification curves and constant within each amplification curve (19). To verify this assumption we tested fitting 3–5 data points within and around the exponential region (the liner part of the curve in Fig. 1) in sets of 8–15 samples based on purified PCR product. These sets are referred to as training set. The S.D. of the PCR efficiency was calculated for each setting. Even slight changes in threshold level may have a large effect on the S.D. of PCR efficiency calculated from a 15-sample training set (data not shown). This change is probably due to inclusion or exclusion of a critical data point in the estimation of the efficiency. This instability in the estimation of S.D. from a small training set might affect outlier detection when comparing different settings. To avoid this effect, we suggest using a constant value of S.D. for all experiments that are performed with similar technical specification, i.e. detection chemistry, machine and method of efficiency estimation. Here we calculate the S.D. from a total of 25 training sets. cDNA samples were not included in the training sets to eliminate biological influence on the results. The PCR efficiencies in each training set estimated at every setting were normally distributed [95% confidence, Lilliefors test (20)]. Figure 2 shows the mean S.D. of PCR efficiency for the 25 training sets calculated for different settings. A range of settings produced a S.D. of less than 0.02 and is referred to as the ‘optimal range of setting’. The data points fitted by the settings in the optimal range roughly overlap the exponential phase of the PCR as found by LinRegPCR (11) and SoFAR (21) software for automated evaluation of real-time PCR data. Any of those settings should give a sufficiently precise estimate of PCR efficiency for comparative purposes. The upper limit of S.D. (0.02) within this range was assumed for all calculations of KOD.
Figure 2.
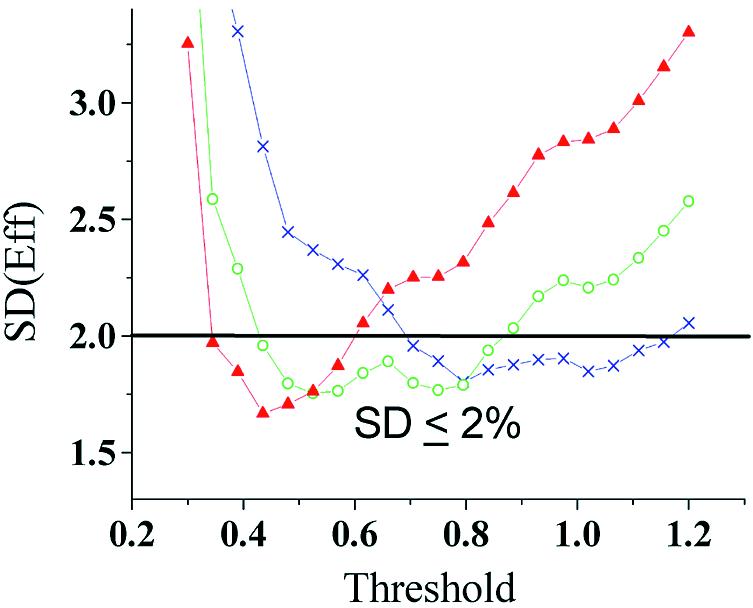
The PCR efficiencies of 330 samples from 25 training sets based on purified PCR product were estimated by exponential fit of three (crosses), four (circles), or five (triangles) data points above different threshold levels. The S.D. of PCR efficiency was calculated for each training set at every setting and the average values of the 25 sets are shown. The optimal range of settings includes all the settings corresponding to the crosses/circles/triangles below the horizontal line of S.D. = 0.02.
Precision of KOD
The use of KOD is to identify samples with aberrant PCR efficiencies that might lead to erroneous quantification. The effect of PCR efficiency on cycle of threshold (CT) is given by equation 3 (22):
Here _R_0 is the signal corresponding to the initial number of template molecules and _R_CT is the signal corresponding to the number of template molecules after CT cycles. The CT of a sample inhibited by 1.96 S.D., _CT_in, which is the criterion for outlier detection is:
The difference in CT values of two samples with identical starting number of template molecules with efficiency difference of 1.96 S.D. is:
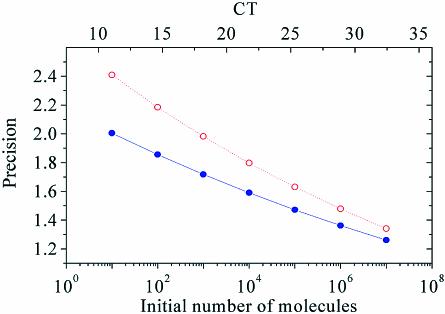
The ratio of the initial number of template molecules of two samples with a given ΔCT is (1 + E)ΔCT, e.g. for ΔCT = 1 and E = 1 (100% efficiency) the sample with the lower CT has twice the amount of initial template molecules than the sample with the higher CT. For a sample with an efficiency equal to the mean efficiency of the training set and a sample with outlier efficiency, i.e. 1 + E – 1.96×S.D., (1 + E)ΔCT is the smallest difference in template quantity that can be detected by KOD and hence, is the precision of KOD. Assuming S.D. = 0.02 which was found in the first part of the study, the precision of KOD can be calculated for a given efficiency as a function of CT or for the initial number of template molecules. As seen in Figure 3, the precision is improved as the number of template molecules or PCR efficiency increases, but decreasing with increasing S.D.
Figure 3.
To translate the dissimilarity in efficiency that KOD identifies to minimal error in quantification, the following representative values were applied to equations 3 and 5: R CT corresponding to 1010 molecules (for SYBR Green I) (18), E = 0.9, S.D. = 0.02 (filled circles), S.D. = 0.025 (open circles). Precision of 1 means no error in quantification.
Improper background subtraction
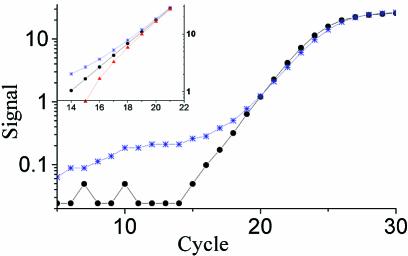
In 5% of the amplification curves analyzed (650 in total), the lower part had a concave shape after background subtraction when plotted in semi-logarithmic scale, instead of the expected linear shape (Fig. 4). This could be the result of Under Background Subtraction (UBS), i.e. too low a value has been subtracted from the data, or the existence of varying background fluorescence that requires a more advanced background subtraction method (21). Comparing UBS samples to duplicates where background was properly subtracted, the CT values of the UBS samples were shifted about 0.7 cycles to lower values, resulting in about 60% overestimation of the copy number. The opposite phenomenon—over background subtraction, was observed in about 2% of the samples. Over background subtraction led to underestimation of copy number. Amplification curves with background subtraction aberrations were identified both visually and by KOD.
Figure 4.
Effect of improper background subtraction on the shape of the amplification curve. Data points from a sample with properly subtracted background (filled circles) fall on a straight line in the exponential phase of the amplification curve, while under background subtracted (stars) and over background subtracted amplification curves (triangles, inset only) form concave and convex shapes, respectively.
Testing KOD on samples with equal initial number of template molecules
To find out how well outlier samples can be identified by KOD, we designed a test system based on a training set of 15 uninhibited samples and 11 dNTP inhibited test samples; all were based on a purified PCR product of the18S gene of rat. The training set was a dilution series and the test samples contained the same amount of template as three of the training set samples. Figure 5 shows the amplification curves of the 11 test samples and the three uninhibited samples. Also indicated is the 95% confidence interval of the efficiency for outlier detection. As seen, the more inhibited the test sample, the higher is its CT value. And as assumed, the amplification curves of the inhibited samples also have lower slopes. This correlation is clearly seen in Figure 6, where the PCR efficiencies of the amplification curves are plotted versus their CT values. A 95% confidence interval of the efficiency is indicated by a horizontal line. Several samples with low PCR efficiency are outside the confidence interval and, hence, are outliers. The CTs of the outliers deviate from the average CT of the uninhibited samples by up to 3.9 cycles. This is equivalent to more than a 10-fold error in the quantification. We repeated this experiment with some different dNTP concentration ranges with a total of 71 test samples. Outlier detection was performed at every setting within the optimal range and the mean number of outliers identified in different settings was 40.2 ± 4.5.
Figure 5.
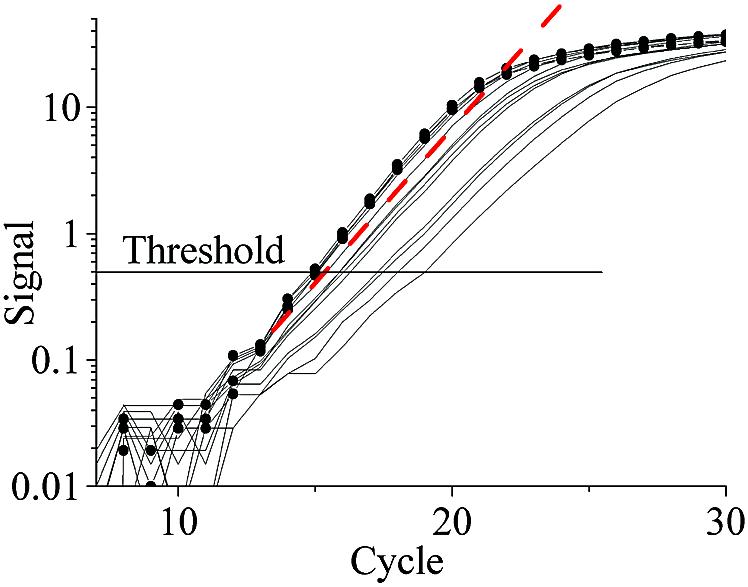
Effect of PCR inhibition on CT and slope of amplification curve of uninhibited (circles) and inhibited (solid line) samples with equal starting number of template molecules from the dNTP titration experiment. The inhibited samples have flatter slope and reach the threshold later. Dashed lines indicate the confidence interval with slope and CT of minimally detected outliers.
Figure 6.
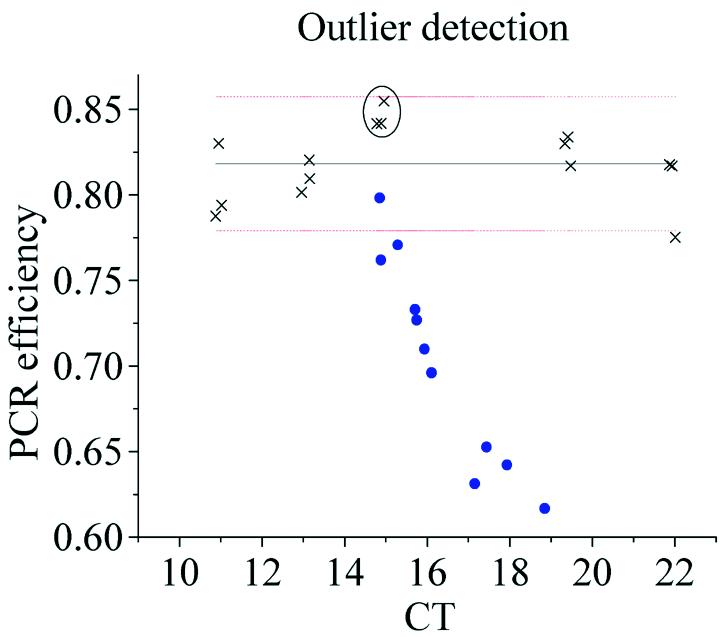
Dilution series of purified PCR product was used as a training set (crosses) for outlier detection in test samples (circles) containing equal starting numbers of template molecules as the encircled concentration in the dilution series, but with elevated concentrations of dNTP as inhibitor. PCR efficiency was estimated by exponential fit in the optimal range of setting and plotted versus CT. The central line is the mean and the dotted lines indicate 95% confidence interval of the efficiency.
Using KOD to improve gene expression analysis
The idea with KOD is to identify erroneously quantified samples. In the following experiment, KOD was used to improve the measurements of relative expression of the 18S and cyclophilin genes in rat. The expression of the two genes was quantified in four brain regions of 15 rats (five rats for each drug concentration) giving a total of 60 cDNA samples divided into 12 groups with five samples in each (see Table 1 in the Supplementary Material). Twenty-one outliers were identified by KOD in eight of the 12 groups; no sample had background subtraction problems. Fourteen of the outliers were in groups 7, 8 and 12 leaving a single sample in each of these groups which was not an outlier. Hence, no comparative analysis between outliers and non-outliers in these groups was possible. To test if the outliers give rise to an aberrant 18S/cyclophilin ratio, the gene expression ratios in each group were ranked by their distance from the median ratio of the group (from 0 for the sample with the median ratio up to 4 for the sample with the most deviating ratio). Assuming the ranks are independent identically distributed uniform random variables, the probability of obtaining by chance a sum of n ranks larger than RANK is:
where E(rank) and V(rank) are the expected value and variance of the rank according to uniform distribution and Φ is the cumulative distribution function of the standard normal distribution. Seven outliers were included in the calculation. The expected sum of ranks was 14 and the observed sum of ranks was 22. The probability of obtaining by chance a larger or equal sum of rank is 0.01. This means that the 18S/cyclophilin ratios of the outliers detected by KOD are significantly different from the median ratios.
Having about 15% of the samples outliers, we examined if the relative quantification method of Liu and Saint (8), which is based on estimation of sample specific PCR efficiency by EF, improves the accuracy of the quantification. In this method, the expression ratio of target (_R_0,T) to reference (_R_0,R) genes is given by:
where _E_R and _E_T, are the sample specific efficiencies and CT,R and CT,T are the CTs of the reference and target gene, respectively. The assumption was that more accurate quantification will yield a smaller spread of the results. There was no significant difference between the ratios or coefficients of variance (CV) of the ratios in each group, obtained by Liu and Saint’s method and the standard curve method. Replacing the results obtained from the standard curve for outliers by the results of Liu and Saint’s method did not reduce the CV of the ratios.
To test whether exclusion of outlier samples reduces the spread of the results, we used Wilcoxon signed rank test to compare the CV of the 18S/cyclophilin ratios in each group when including or excluding outlier samples. In four of the five groups, the CV was lower when outliers were excluded (Table 1). The only group where the CV was not improved (group 5), had the smallest difference in CV when excluding the outliers from the calculation. The probability of such a reduction in CV to occur by chance was 0.06.
Table 1. Coefficient of variance (CV) of five replicates of expression ratio of 18S and cyclophilin in groups 1, 2, 5, 9 and 10 from Table 1 in the Supplemenatry Material.
| No. in group | CV inc. outliers | CV ex. outliers |
|---|---|---|
| 1 | 0.53 | 0.46 |
| 2 | 0.17 | 0.12 |
| 5 | 0.62 | 0.67 |
| 9 | 0.32 | 0.24 |
| 10 | 0.65 | 0.06 |
DISCUSSION
Real-time PCR is rapidly becoming the method of choice for detection and quantification of nucleic acids. Its broad use has led to the development of various quality assurance and standardization methods for PCR (for review see 23). Some of these methods consider normalization tools (24,25) or housekeeping genes (26–28), while others examine the reliability and reproducibility of the RT and PCR (29,30). DNA polymerase inhibition is established as a major problem in PCR (4,7,12,31) that severely affects the accuracy of the quantification (1,22). The most commonly used quantification methods neglect this problem (1,2) and no statistical tool has been available to identify outliers for them. The usability of methods that do take this problem into account (8,9,11) has not been established yet, mainly due to the lack of thorough analysis of variance of PCR efficiency and its effect on the precision of the quantification by these methods.
In this work, we have presented a method to identify samples that are erroneously quantified due to aberrant PCR efficiency. The PCR efficiency of a test sample is estimated by kinetic PCR and compared to the PCR efficiency of a training set. A sample with significantly different PCR efficiency is considered an outlier.
For KOD to be as sensitive as possible, the PCR efficiency should be estimated in the exponential phase of the reaction, where the estimation by EF is most precise and the efficiencies of different samples are most similar (19). The use of different settings in the exponential phase may yield slightly different results. Those ‘partially detected’ samples may require re-run to clear the uncertainty. Two free software packages are available to automatically identify the exponential phase of the amplification curve (11,21). We preferred LinRegPCR (11) which also estimates the PCR efficiency.
Analyzing a large number of amplification curves, we found background subtraction to be important in the processing of real-time PCR data. If background is inappropriately treated, UBS may introduce substantial errors in quantification by EF. In the software developed for many instruments, background is automatically subtracted and UBS may go unnoticed. The deformed curves caused by UBS were identified either visually or by KOD. Samples with background subtraction problems should be excluded from analysis.
Ideally, outliers should be detected by a single sample two-tailed _t_-test that is solely based on the training set data. In practice, an external measure of the S.D. of PCR efficiency is needed. Analyzing a large number of training sets, we estimate the S.D. of PCR efficiency to be less than 0.02 when measured by EF in the exponential phase, similar to previously reported S.D. values for optimized assays (8). This value may vary with the detection chemistry, machine or type of training set used. The smaller the S.D. of PCR efficiency, the smaller the differences in PCR efficiency that can be detected by KOD (Fig. 3).
The use of a training set to control amplification quality is only as good as the samples used in the training set. In essence, the KOD procedure is a test for differences in amplification efficiency between a test sample and the training set. If the training set samples are purified preparations, they might not represent the possibly impure experimental cDNA test samples they are to be tested against, and the KOD will detect that experimental and purified samples display different kinetics. The choice of training set is therefore critical to the application of KOD. The main use of the training sets in this study was to characterize the variance of PCR efficiency originating from technical factors; hence, to minimize biological influence, the training sets contained standard samples based on purified PCR product. Once S.D. was characterized and the user is only interested in the mean efficiency, several alternative training sets can be used. For example, one may construct the standard curve from a dilution series of RNA or cDNA (32,33). By serially diluting a cDNA sample to construct the standard curve, the user keeps the training set representative of the experimental test samples even in case that the entire set of test samples contains inhibitors. However, the wrong choice of an outlier cDNA for dilution series and the standard curve will display, again, different kinetics of the training set and the experimental samples. The choice of the type of standard curve or training set, therefore, depends on the presence of PCR inhibitors in the experimental samples themselves. If they are not inhibited, a training set based on purified PCR product is acceptable, otherwise, a representative experimental sample should be used.
An implementation of KOD was demonstrated on a series of cDNA samples where the expression ratio of two genes was measured, and two estimators of the spread of the results were calculated—distance of ratios containing outliers from the median ratio of their replicates group and CVs of groups of replicate ratios including and excluding the outliers. The outliers identified by KOD gave rise to expression ratios that were significantly different from the median ratio. These aberrant ratios are likely a result of unequal inhibition of the 18S and cyclophilin PCR systems. These results are supported by previous observations of unequal PCR inhibition (9,10).
Variable PCR efficiency poses an important question whether to use identical PCR efficiency for relative quantification (1,2) or to adopt alternative quantification methods that rely on sample specific PCR efficiency (8,9,11). In the current work, no improvement of the results (reduction in spread of replicates) was achieved using Liu and Saint’s method. This could be explained by equation 8 that gives the 95% confidence interval for the signal that corresponds to the expected initial amount of copy number (_R_0) in a single sample when quantified by Liu and Saint’s method (here all symbols as used before) (8):
A 95% confidence interval may span a range of almost 3-fold in quantification of a typical sample [_E_ = 0.9, S.D. = 0.02 and CT = 25, _R_CT = 1010 for SYBR Green (18)] and makes quantification with Liu and Saint’s method advantageous mostly in cases of severe inhibition of the PCR efficiency, above about 0.1, where the error in quantification with identical efficiency is large.
Here we used the EF method for the estimation of PCR efficiency and found it accurate and simple to implement, but in principle, KOD can be implemented with any method for estimation of PCR efficiency, as long as the same method is used for all samples. We have also tested the method of Tichopad et al. for estimation of PCR efficiency, which fits the entire amplification curve (15), and a combination of that method and EF. These approaches yielded poorer results (not shown).
CONCLUSIONS
Real-time PCR is considered the most sensitive method for detection and quantification of nucleic acids since it can detect a single template molecule. Typical samples, however, contain a few tens to many thousands of template molecules. Using KOD one can detect outlier samples with at least 1.3–1.9-fold error in quantification with a _P_-value of 0.05. This precision is higher than the minimal 2-fold difference in the number of DNA molecules that real-time PCR usually is claimed to detect (34).
By excluding aberrant samples from further analysis, false results can be avoided, the spread of results in a group of replicates can be reduced and the potential of real-time PCR to detect smaller differences in DNA amount is improved.
The advantages of KOD were demonstrated here on quantification of gene expression using SYBR Green, but microbial diagnostics, molecular pathology, food analysis, allelic discrimination and virtually any application based on real-time PCR using any of the known chemistries can possibly benefit from KOD.
SUPPLEMENTARY MATERIAL
Supplementary Material is available at NAR Online.
[Supplementary Material]
REFERENCES
- 1.Livak K.J. (1997) ABI Prism 7700 Sequence Detection System, User Bulletin 2. PE Applied Biosystems.
- 2.Pfaffl M.W. (2001) A new mathematical model for relative quantification in real-time RT–PCR. Nucleic Acids Res., 29, e45. [DOI] [PMC free article] [PubMed] [Google Scholar]
- 3.Gentle A., Anastasopoulos,F. and McBrien,N.A. (2001) High-resolution semi-quantitative real-time PCR without the use of a standard curve. Biotechniques, 31, 502, 504,–506, 508. [DOI] [PubMed] [Google Scholar]
- 4.Wilson I.G. (1997) Inhibition and facilitation of nucleic acid amplification. Appl. Environ. Microbiol., 63, 3741–3751. [DOI] [PMC free article] [PubMed] [Google Scholar]
- 5.Wiedbrauk D.L., Werner,J.C. and Drevon,A.M. (1995) Inhibition of PCR by aqueous and vitreous fluids. J. Clin. Microbiol., 33, 2643–2646. [DOI] [PMC free article] [PubMed] [Google Scholar]
- 6.Rossen L., Norskov,P., Holmstrom,K. and Rasmussen,O.F. (1992) Inhibition of PCR by components of food samples, microbial diagnostic assays and DNA-extraction solutions. Int. J. Food Microbiol., 17, 37–45. [DOI] [PubMed] [Google Scholar]
- 7.Chandler D.P., Wagnon,C.A. and Bolton,H.,Jr (1998) Reverse transcriptase (RT) inhibition of PCR at low concentrations of template and its implications for quantitative RT–PCR. Appl. Environ. Microbiol., 64, 669–677. [DOI] [PMC free article] [PubMed] [Google Scholar]
- 8.Liu W. and Saint,D.A. (2002) A new quantitative method of real time reverse transcription polymerase chain reaction assay based on simulation of polymerase chain reaction kinetics. Anal. Biochem., 302, 52–59. [DOI] [PubMed] [Google Scholar]
- 9.Stahlberg A., Aman,P., Ridell,B., Mostad,P. and Kubista,M. (2003) Quantitative real-time PCR method for detection of B-lymphocyte monoclonality by comparison of kappa and lambda immunoglobulin light chain expression. Clin. Chem., 49, 51–59. [DOI] [PubMed] [Google Scholar]
- 10.Meijerink J., Mandigers,C., van de Locht,L., Tonnissen,E., Goodsaid,F. and Raemaekers,J. (2001) A novel method to compensate for different amplification efficiencies between patient DNA samples in quantitative real-time PCR. J. Mol. Diagn., 3, 55–61. [DOI] [PMC free article] [PubMed] [Google Scholar]
- 11.Ramakers C., Ruijter,J.M., Deprez,R.H. and Moorman,A.F. (2003) Assumption-free analysis of quantitative real-time polymerase chain reaction (PCR) data. Neurosci. Lett., 339, 62–66. [DOI] [PubMed] [Google Scholar]
- 12.Wiesner R.J., Ruegg,J.C. and Morano,I. (1992) Counting target molecules by exponential polymerase chain reaction: copy number of mitochondrial DNA in rat tissues. Biochem. Biophys. Res. Commun., 183, 553–559. [DOI] [PubMed] [Google Scholar]
- 13.Schlereth W., Bassukas,I.D., Deubel,W., Lorenz,R. and Hempel,K. (1998) Use of the recursion formula of the Gompertz function for the quantitation of PCR-amplified templates. Int. J. Mol. Med., 1, 463–467. [DOI] [PubMed] [Google Scholar]
- 14.Liu W. and Saint,D.A. (2002) Validation of a quantitative method for real time PCR kinetics. Biochem. Biophys. Res. Commun., 294, 347–353. [DOI] [PubMed] [Google Scholar]
- 15.Tichopad A., Dzidic,A. and Pfaffl,M.W. (2002) Improving quantitative real-time RT–PCR reproducibility by boosting primer-linked amplification efficiency. Biotechnol. Lett., 24, 2053–2056. [Google Scholar]
- 16.Chomczynski P. and Sacchi,N. (1987) Single-step method of RNA isolation by acid guanidinium thiocyanate-phenol-chloroform extraction. Anal. Biochem., 162, 156–159. [DOI] [PubMed] [Google Scholar]
- 17.Kubista M., Ståhlberg,A. and Bar,T. (2001) Light-up probe based real-time Q-PCR. In Raghavachari,R. and Tan,W. (eds), Genomics and Proteomics Technologies. Proceedings of SPIE, Vol. 4264, pp. 53–58. [Google Scholar]
- 18.Wittwer C.T., Herrmann,M.G., Moss,A.A. and Rasmussen,R.P. (1997) Continuous fluorescence monitoring of rapid cycle DNA amplification. Biotechniques, 22, 130–131,–134–138.. [DOI] [PubMed] [Google Scholar]
- 19.Freeman W.M., Walker,S.J. and Vrana,K.E. (1999) Quantitative RT–PCR: pitfalls and potential. Biotechniques, 26, 112–125. [DOI] [PubMed] [Google Scholar]
- 20.Conover W.J. (1980) Practical Nonparametric Statistics. Wiley, New York, NY, USA. [Google Scholar]
- 21.Wilhelm J., Pingoud,A. and Hahn,M. (2003) SoFAR: software for fully automatic evaluation of real-time PCR data. Biotechniques, 34, 324–332. [DOI] [PubMed] [Google Scholar]
- 22.Rasmussen R. (2001) Quantification on the LightCycler. In Meuer,S., Wittwer,C. and Nakagawara,K. (eds), Rapid Cycle Real-Time PCR. Springer Press, Heidelberg, Germany, pp. 21–34. [Google Scholar]
- 23.Burkardt H.J. (2000) Standardization and quality control of PCR analyses. Clin. Chem. Lab. Med., 38, 87–91. [DOI] [PubMed] [Google Scholar]
- 24.Thellin O., Zorzi,W., Lakaye,B., De Borman,B., Coumans,B., Hennen,G., Grisar,T., Igout,A. and Heinen,E. (1999) Housekeeping genes as internal standards: use and limits. J. Biotechnol., 75, 291–295. [DOI] [PubMed] [Google Scholar]
- 25.Vandesompele J., De Preter,K., Pattyn,F., Poppe,B., Van Roy,N., De Paepe,A. and Speleman,F. (2002) Accurate normalization of real-time quantitative RT–PCR data by geometric averaging of multiple internal control genes. Genome Biol., 3, 0034.1–0034.11. [DOI] [PMC free article] [PubMed] [Google Scholar]
- 26.Lion T. (1996) Appropriate controls for RT–PCR. Leukemia, 10, 1843. [PubMed] [Google Scholar]
- 27.Sellner L.N. and Turbett,G.R. (1996) The presence of a pseudogene may affect the use of HPRT as an endogenous mRNA control in RT–PCR. Mol. Cell. Probes, 10, 481–483. [DOI] [PubMed] [Google Scholar]
- 28.Kidd V. and Lion,T. (1997) Debate round-table. Appropriate controls for RT–PCR. Leukemia, 11, 871–881. [DOI] [PubMed] [Google Scholar]
- 29.de Vries T.J., Fourkour,A., Punt,C.J., van de Locht,L.T., Wobbes,T., van den Bosch,S., de Rooij,M.J., Mensink,E.J., Ruiter,D.J. and van Muijen,G.N. (1999) Reproducibility of detection of tyrosinase and MART-1 transcripts in the peripheral blood of melanoma patients: a quality control study using real-time quantitative RT–PCR. Br. J. Cancer, 80, 883–891. [DOI] [PMC free article] [PubMed] [Google Scholar]
- 30.Keilholz U., Willhauck,M., Rimoldi,D., Brasseur,F., Dummer,W., Rass,K., de Vries,T., Blaheta,J., Voit,C., Lethe,B. et al. (1998) Reliability of reverse transcription-polymerase chain reaction (RT–PCR)-based assays for the detection of circulating tumour cells: a quality-assurance initiative of the EORTC Melanoma Cooperative Group. Eur. J. Cancer, 34, 750–753. [DOI] [PubMed] [Google Scholar]
- 31.Al-Soud W.A. and Radstrom,P. (2001) Purification and characterization of PCR-inhibitory components in blood cells. J. Clin. Microbiol., 39, 485–493. [DOI] [PMC free article] [PubMed] [Google Scholar]
- 32.Pfaffl M.W. and Hageleit,M. (2001) Validities of mRNA quantification using recombinant RNA and recombinant DNA external calibration curves in real-time RT–PCR. Biotechnol. Lett., 23, 275–282. [Google Scholar]
- 33.Bustin S.A. (2000) Absolute quantification of mRNA using real-time reverse transcription polymerase chain reaction assays. J. Mol. Endocrinol., 25, 169–193. [DOI] [PubMed] [Google Scholar]
- 34.Walker N.J. (2002) Tech.Sight. A technique whose time has come. Science, 296, 557–559. [DOI] [PubMed] [Google Scholar]
Associated Data
This section collects any data citations, data availability statements, or supplementary materials included in this article.
Supplementary Materials
[Supplementary Material]


