Spatial Organization of Large-Scale Chromatin Domains in the Nucleus: A Magnified View of Single Chromosome Territories (original) (raw)
Abstract
We have analyzed the spatial organization of large scale chromatin domains in chinese hamster fibroblast, human lymphoid (IM-9), and marsupial kidney epithelial (PtK) cells by labeling DNA at defined stages of S phase via pulsed incorporation of halogenated deoxynucleosides. Most, if not all, chromosomes contribute multiple chromatin domains to both peripheral and internal nucleoplasmic compartments. The peripheral compartment contains predominantly late replicating G/Q bands, whereas early replicating R bands preferentially localize to the internal nucleoplasmic compartment. During mitosis, the labeled chromatin domains that were separated in interphase form a pattern of intercalated bands along the length of each metaphase chromosome. The transition from a banded (mitotic) to a compartmentalized (interphasic) organization of chromatin domains occurs during the late telophase/early G1 stage and is independent of transcriptional activation of the genome. Interestingly, generation of micronuclei with a few chromosomes showed that the spatial separation of early and late replicating chromatin compartments is recapitulated independently of chromosome number, even in micronuclei containing only a single chromosome. Our data strongly support the notion that the compartmentalization of large-scale (band size) chromatin domains seen in the intact nucleus is a magnified image of a similar compartmentalization occurring in individual chromosome territories.
Although considerable information is available about the primary structure of genes and sequence elements controlling their regulation, much less is understood about the higher order organization of DNA in the interphase nucleus. An understanding of chromosome organization is likely to be crucial for models of nuclear structure and function. Most studies of chromosome structure have focused on condensed metaphase chromosomes that can be readily identified as discrete units.
Metaphase chromosomes usually appear as thick fibers in which centromeres, but few other structural features, can be recognized. A major advance in analyzing chromosome structure emerged when techniques that produced differential staining showed metaphase chromosomes to have a characteristic pattern of alternating transverse bands (for review see Sumner, 1982). For example, staining with Giemsa dye after protein denaturation showed intensely stained bands (Giemsa dark) to alternate with pale staining (Giemsa light) bands along the chromosome length. Interestingly, the banding patterns produced by different techniques are related to each other (Bickmore and Sumner, 1989; Sumner, 1990). The banding patterns have been widely used to detect translocations and other chromosomal abnormalities in clinical cytogenetics, although insight into the structural basis for the banding has only recently emerged (Saitoh and Laemmli, 1994). According to this model, the light and dark bands, which differ in their content of AT base pairs, are reported to result from a differential folding path of the AT rich scaffold associated regions (SARs)1 along the length of the chromosomes (Saitoh and Laemmli, 1994). Most widely expressed housekeeping genes in human cells map to the Giemsa light bands, suggesting that the banded structure is of functional significance (Holmquist, 1992; Craig and Bickmore, 1993). There is also a strong correlation between the presence of DNA in light or dark bands and the timing of its replication during S phase. Thus, most late replicating DNA occurs in dark bands, while most early replicating DNA occurs in light bands (for review see Bickmore and Sumner, 1989; Holmquist et al., 1982; Holmquist, 1992; Craig and Bickmore, 1993).
There is considerable evidence that a protein scaffold (Laemmli et al., 1977; Paulson and Laemmli, 1977) plays an important role in the organization of higher order chromosome structure (for review see Gasser and Laemmli, 1987; Saitoh et al., 1995; see also Bickmore and Oghene, 1996). In mammalian metaphase chromosomes, the scaffold defines the unit of higher order organization with chromatin arranged in tandem loops of ∼50–100-kb pairs attached at their base to the protein scaffold. The scaffold interacts with chromatin at SARs also referred to as matrix attachment regions, MARs (for review see Gasser et al., 1989; Laemmli et al., 1992). Recently, SARs were shown to play a critical role in shape determination and maintenance of metaphase chromosomes (Strick and Laemmli, 1995). MARs (SARs) were also shown to bind to the nuclear scaffold (Mirkovitch et al., 1984), a substructure of complex and poorly defined composition believed to organize the chromatin in looped domains during interphase (for review see Jackson, 1991). At least two scaffold proteins have been characterized, called ScI and ScII. ScI, the major scaffold protein (Lewis and Laemmli, 1982), was later identified as topoisomerase II (Earnshaw and Heck, 1985; Gasser et al., 1986). More recently, ScII was cloned and sequenced and both ScI and ScII were shown to colocalize with the scaffold along the chromosome axis (Saitoh et al., 1994). An important issue for future studies will be to determine how the scaffold organization seen in metaphase relates to chromosome organization in interphase nuclei. We note that alternative models of chromosome organization, where chromatin compaction is achieved through successive levels of helical coiling (helical coiling models) have also been proposed (for example see Sedat and Manuelidis, 1978; Belmont et al., 1987; for review see Earnshaw, 1988).
In most cells, the compact structure of metaphase chromosomes decondenses during telophase, and in interphase it becomes difficult to distinguish individual chromosomes. Much of the data on chromosome structure in the interphase nucleus has come from studies on insect cells, particularly the polytene nuclei of salivary gland cells. This has shown that the chromosomes are folded in the nucleoplasm with focal attachments to the nuclear periphery (Agard and Sedat, 1983; Mathog et al., 1984; Hochstrasser et al., 1986; Hochstrasser and Sedat, 1987_a_ , 1997_b_; for review see Hochstrasser et al., 1988). In some cases, chromosomes adopt a so-called Rabl configuration, with centromeres at one pole of the nucleus and telomeres at the other (Comings, 1980). A major advance in analyzing chromosome organization in mammalian cells has come with the recent development of fluorescence in situ hybridization methods, using both gene- and chromosome-specific probes (see for example Cremer et al., 1993; Lawrence et al., 1993). Using fluorescence in situ hybridization techniques, individual genes in the interphase nucleus are identified as foci with no obvious linkage between separate alleles. Analysis of entire chromosomes using chromosome-specific painting probes shows little or no overlap between separate chromosomes. Individual chromosomes appear to occupy defined territories but have irregular shapes and the homologues are not associated throughout interphase (for an overview, see Cremer et al., 1993 and references therein). It remains unclear whether the relative positions between different chromosomes is strictly specified or results from a more random assortment process (for example, Manuelidis, 1984, 1990; Nagele et al., 1995). It is also unclear whether all chromosomes in a given cell interact with the nuclear periphery or whether specific chromosomes selectively occupy defined positions in the nucleoplasm. Although it has been shown that certain chromosome regions, including telomeres and centromeres, can cluster at the nuclear periphery (for review see Spector, 1993 and references therein), it is not known whether other chromosome regions in mammalian nuclei specifically interact with the nuclear periphery. Another important question is to what extent the banded structure of mammalian metaphase chromosomes is reflected in their organization during interphase. The basic question of whether interphase chromosomes are ordered structures with specific sequences lying at particular sites (Cremer et al., 1993; Kurz et al., 1996), or conversely whether the folding of chromatin is a random event (Sachs et al., 1995), remains largely unanswered.
In this work, we have used a replication labeling method to follow the higher order organization of chromosomes in chinese hamster fibroblasts between metaphase and interphase. This approach has allowed us to follow the fate of specific collections of DNA sequences that replicate in a defined order during S phase. The data suggest a model for the organization of DNA in the mammalian cell nucleus based on the structure of interphase chromosomes.
Materials and Methods
Chemicals and Antibodies
Actinomycin D, 5,6-dichlorobenzimidazole riboside (DRB), emetine, a-amanitin, colcemid, nocodazole, 5-bromouridine-5′-triphosphate (BrUTP), 5-chloro-2′-deoxyuridine (CldU), 5-iodo-2′-deoxyuridine (IdU), and 1,4-diazabicyclo(2.2.2)octane (DABCO), were purchased from Sigma Chemical Co. (St. Louis, MO). 5-bromo-2′-deoxyuridine (BrdU) was obtained from Boehringer Mannheim (Mannheim, Germany). Three different commercially available monoclonal antibodies against BrdU were used in this study: mouse mAb (clone BMC 9318; Boehringer Mannheim); mouse mAb (clone B-44; Becton-Dickinson & Co., Mountain View, CA); rat mAb (clone BU 1/75, ICR 1; Harlan Sera-Lab, Ltd., Sussex, England). Rabbit polyclonal antiserum against lamin B (Drouin et al., 1991) was kindly given by S. Georgatos (European Molecular Biology Laboratory, Heidelberg, Germany); human anti–DNA (ref. L 70) and anti–kinetochore (refs. A76, A89 and A 188) autoimmune antisera were a kind gift of W. van Venrooij (Katholieke Universiteit, Nijmegen, The Netherlands); mouse mAb anti–hnRNP A1 protein (mAb 4B10) was a kind gift of G. Dreyfuss (University of Pennsylvania, Philadelphia, PA). FITC and Texas red-conjugated affinity purified secondary antibodies were purchased from Jackson ImmunoResearch Laboratories (West Grove, PA). Tissue culture reagents were supplied by GIBCO BRL (Gaithersburg, MD).
Cell Culture and Cell Synchronization
Diploid Chinese hamster fibroblasts (CHF; CCL-39 cells from American Type Culture Collection (ATCC), Rockville, MD, established from the lung of female Chinese hamster; chromosome number: 2n = 22) were cultured in DME supplemented with 2 mM glutamine, antibiotics (penicillin 100 μg/ml and streptomycin 100 μg/ml), and 10% FCS and maintained at 37°C with an atmosphere of 5% CO2. To obtain cells at defined stages of S phase, the culture medium was supplemented with 20 mM Hepes, pH 7.4. IM-9 cells (CCL-159 cells from ATCC, a human lymphoblastic cell line; chromosome number: 2n = 46) and PtK2 cells (CCL-56 cells from ATCC, a marsupial epithelial cell line; 2n = 13) were cultured in RPMI-1640 medium supplemented with glutamine, antibiotics, and FCS as above.
For the synchronization of CHF cells at the G1/S border of the cell cycle, we routinely used two protocols. When protocol 1 was followed, mitotic cells were obtained from logarithmically growing cultures by mechanical shakeoff. Controls showed that this method isolated at least 95% of mitotic cells as judged by both phase contrast microscopy and staining with Hoechst 33342 (0.5–1 mM). The mitotic cells were centrifuged (700 g, 5 min), resuspended in culture medium, and replated at ∼60% confluency. Hydroxyurea was then added to a final concentration of 1.5–2.0 mM. After 8–10 h of incubation, cells were released into fresh culture medium. Synchronization protocol 2 differs from protocol 1 only in that an enrichment in mitotic cells was achieved by adding nocodazole (100 ng/ml) to the cell cultures for 4 –5 h before mechanical shakeoff.
Synchronization of IM-9 cells was achieved using the double thymidine block as described (Johnson et al., 1993).
Incorporation of Halogenated Deoxynucleosides into Replicating DNA
Halogenated deoxynucleosides were added to exponentially growing cells to final concentrations of 5 or 10 μM for BrdU, 5 μM for CldU, and 2.5 μM for IdU. All manipulations were performed under minimal light.
Replication Pattern Progression.
CHF cells growing on glass coverslips were synchronized as described above (protocol 1). After hydroxyurea removal (time point zero), the cells were pulse labeled for 25–30 min with BrdU (5 μM) before collection at hourly intervals. As a control experiment, BrdU was added for 20 min just before hydroxyurea release. Analyses were only performed on cells where the controls showed zero BrdU incorporation.
Labeling of DNA Sequences Replicating at Defined Stages of S Phase.
To obtain CHF cell populations highly enriched for either replication patterns 1, 2, or 3, synchronized cells were pulse labeled with BrdU (10 μM final concentration, 15 min) beginning at 0–30 min (pattern 1), 80–90 min (pattern 2), or 150–160 min (pattern 3) after release from the hydroxyurea block. 7–8 h after entry into S phase, nocodazole was added for an additional 1–2 h to arrest cells in mitosis. To evaluate the percentage of cells labeled for a given pattern control, coverslips were removed at the end of the pulse and immediately fixed. Unsynchronized cell populations were used to specifically obtain cells that were labeled at either stages 4 or 5 of S phase. Stage 4 cells were obtained by pulse labeling the cultures with BrdU (10 μM, 15 min), followed by release in BrdU-free medium for 3.5–4 h. Nocodazole was then added for 40–60 min before harvesting mitotic cells. Cells at stage 5 were selected by adding BrdU (10 μM) to the cultures for 2.5 h. Without removing the BrdU-containing medium, nocodazole was added for an additional 40–60 min. Nocodazole-arrested mitotic cells were harvested by the mitotic “shake-off” method, as described. To control for the specificity of labeling of cells at either stage 4 or 5 (or 4 plus 5, see below), ∼50% of the mitotics were replated back into culture and analyzed at different time points for up to 10 h. Only experiments where controls showed at least 80% of a given replication pattern were considered for further analysis.
In some experiments, cells that accumulated replication patterns 4 and 5 were used. To achieve this, asynchronous cultures were grown in the presence of BrdU (10 μM) for 2–3 h. Nocodazole was then added to the BrdU-containing medium for an additional 90–120 min before harvesting.
Other Labeling Experiments.
To follow the spatial distribution of late replicating chromatin in CHF cells during telophase and early G1, asynchronous cell populations were pulse labeled with BrdU (5 μM) for 20 min. After release into fresh culture medium (time point zero), the cells were harvested at hourly intervals. Only the first telophase/early G1 cells to appear labeled (i.e., at 2 and 3 h after BrdU release) were used for this purpose.
A similar pulse-chase protocol was used to set up cell cycle curves from which the duration of G2 and S phase were determined in CHF and marsupial kidney epithelial (PtK) cells (Mitchison, 1971).
Quantitation of Labeling Patterns.
We analyzed 50 or more nuclei for each of the five replication patterns, randomly selected from an asynchronous cell population pulse labeled with BrdU (10 μM final concentration, 30 min). For each nucleus, two coplanar equitorial confocal sections were obtained under standardized conditions. One image was from whole DNA immunostaining (anti–DNA antiserum) and the other from BrdU-DNA immunolabeling. The former was used to automatically select the nuclear boundary and the latter to select BrdU signal threshold (National Institutes of Health [NIH] Image 1.55 software). The proportion between the area occupied by the signal in the inner 80% of the nuclear profile and the total area of the signal was calculated and averages for each group (i.e., for each replication pattern) were compared using analysis of variance (ANOVA) followed by Scheffe's multicomparison tests. For the purposes of the present study, the inner 80% of the area of an equatorial nuclear profile will correspond to the internal compartment, whereas the outer rim, comprising the remaining 20% of this area, which runs parallel to the nuclear boundary, will be referred to as the peripheral compartment. We note that the inner 80% of the nuclear profile area corresponds to a normalized radius of 89.44% and, in volumetric terms, to 71.55% of the nuclear volume. Student's t test was used to compare, for each replication pattern, the actual proportion of the BrdU signal found in the internal compartment with the proportion expected for an homogeneous distribution of the signal.
Drug Treatments
CHF cells labeled for peripheral (late replicating) chromatin (see above) were replated at ∼40–50% confluency in the presence of one of the following drugs: actinomycin D (10 μg/ml), DRB (150 μM), or emetine (40 μg/ml). Cells were then collected at 30 min and at 1, 3, and 6 h after replating. In control experiments, only drug solvents were added.
Immunolabeling Procedures
Cells growing on coverslips were fixed/extracted in 2.4% paraformaldehyde in HPEM buffer (30 mM Hepes, 65 mM Pipes, 10 mM EGTA, 2 mM MgCl2, pH 6.9) plus 0.5% Triton X-100 for 15 min at room temperature; the cells were then washed in PBS containing 0.05% Tween 20 (PBS-Tw) 3 × 10 min and either immediately used or kept at 4°C in the dark for a maximum of 3 d. In some experiments, the cells were fixed in 70% ethanol, 50 mM glycine, pH 2.0, for 20–30 min at −20°C or fixed in 2% formaldehyde in PBS, pH 7.4 for 15 min at room temperature and permeabilized with 0.2% Triton X-100 in PBS for 5 min at 4°C (O'Keefe et al., 1992).
BrdU-, CldU- or IdU-substituted DNA was denatured with 4 N HCl for 30 min at room temperature (O'Keefe et al., 1992) before immunolabeling. Less frequently, a nuclease-based detection sustem (cat. no. 1296736; Boehringer Mannheim) was used according to the instructions of the manufacturer. Chromosomes from metaphase spreads were denatured by incubation for 90 s in a mixture (2:5) of ethanol/0.1 M NaOH (Latos-Bielenska et al., 1987). Detection of substituted DNA was performed by indirect immunofluorescence. In double-labeling experiments with an anti– BrdU monoclonal antibody and antisera directed against other nuclear antigens (lamin B, DNA, or kinetochore antigens), detection of the halogenated deoxynucleoside preceded in general the labeling of the other antigen. Differential immunolabeling of CldU-DNA and IdU-DNA was performed essentially as described (Aten et al., 1994).
Where appropriate, total DNA was stained with either DAPI or YOYO as described (Saitoh and Laemmli, 1994). For microscopical analysis, the samples were mounted in PBS/glycerol (2:1) containing 10% DABCO as an antifading agent.
Microscopy and Image Analysis
For conventional microscopy, the samples were analyzed using 63 or 100× objectives on an Axiophot microscope (Carl Zeiss, Inc., Thornwood, NY) equipped with epifluorescence. Photographs were taken on Fujichrome 100 color film (Fuji Photo Film Co., Tokyo, Japan). Confocal microscopy was performed essentially as described (Ferreira et al., 1994) using the EMBL compact confocal microscope (Stelzer et al., 1991). Images were then transferred to a Macintosh personal computer and analyzed using standard software tools (NIH Image 1.5.4 and Adobe Photoshop 3.0). For three-dimensional (3D) reconstruction, serial optical sections were taken at 0.33–0.4-mm intervals. Series of confocal planes were analyzed using a new program, MacInsight, to optimize the processing of 3D information. 3D data sets were visualized and edited in the program (changes in levels were used to compensate for weak or unbalanced signals in the respective channels) and projected on the two-dimensional plane using a volume tracing algorithm. Lamin-stained voxels opacity was reduced to render the nuclear envelope semitransparent and allow visualization of internal nuclear structures.
Other Methods
Metaphase spreads were prepared as described (Earnshaw et al., 1989). To obtain nuclei with a small number of intact chromosomes, cells were induced to micronucleate with colcemid (0.5–1.0 μg/ml; Frackowiak et al., 1986; Geraud et al., 1989). To detect transcriptional activity in micronucleated cells, microinjection of Br-UTP, α-amanitin controls and detection of Br-RNA were performed essentially as described (Jackson et al., 1993; Wansink et al., 1993). Poly(A) RNA was detected by in situ hybridization as previously described (Ferreira et al., 1994) using a biotinylated 2′-_O_-methyl oligoribonucleotide probe (Sproat et al., 1989) containing 20 tandem uridine residues.
Results
Progression of Replication Patterns in Chinese Hamster Fibroblasts
A synchronized population of chinese hamster fibroblasts was prepared by collecting mitotic cells, which were then arrested at the G1/S transition by incubation in medium containing hydroxyurea (see Materials and Methods). To examine the patterns of replicating DNA at different stages of S phase, CHF cells were released from the hydroxyurea block and pulse labeled with bromodeoxyuridine (BrdU) at hourly intervals. Distinct replication patterns were observed that can be conveniently classified in five distinct stages (Fig. 1). During stages 1 and 2, predominantly internal DNA sequences are replicated forming a complex pattern comprising multiple nucleoplasmic foci. Stage 2 is distinguished from stage 1 by the more clumped appearance of the nucleoplasmic foci. At stage 3, fewer nucleoplasmic foci are observed, often located around the nucleolus, and extensive labeling of the nuclear periphery is evident. A striking feature of the late stages of replication (i.e., stages 4 and 5) is the predominant location of labeled DNA at the nuclear periphery (Fig. 1). Almost continuous labeling of the periphery is observed at stage 4, whereas at stage 5 the peripheral labeling is discontinuous.
Figure 1.

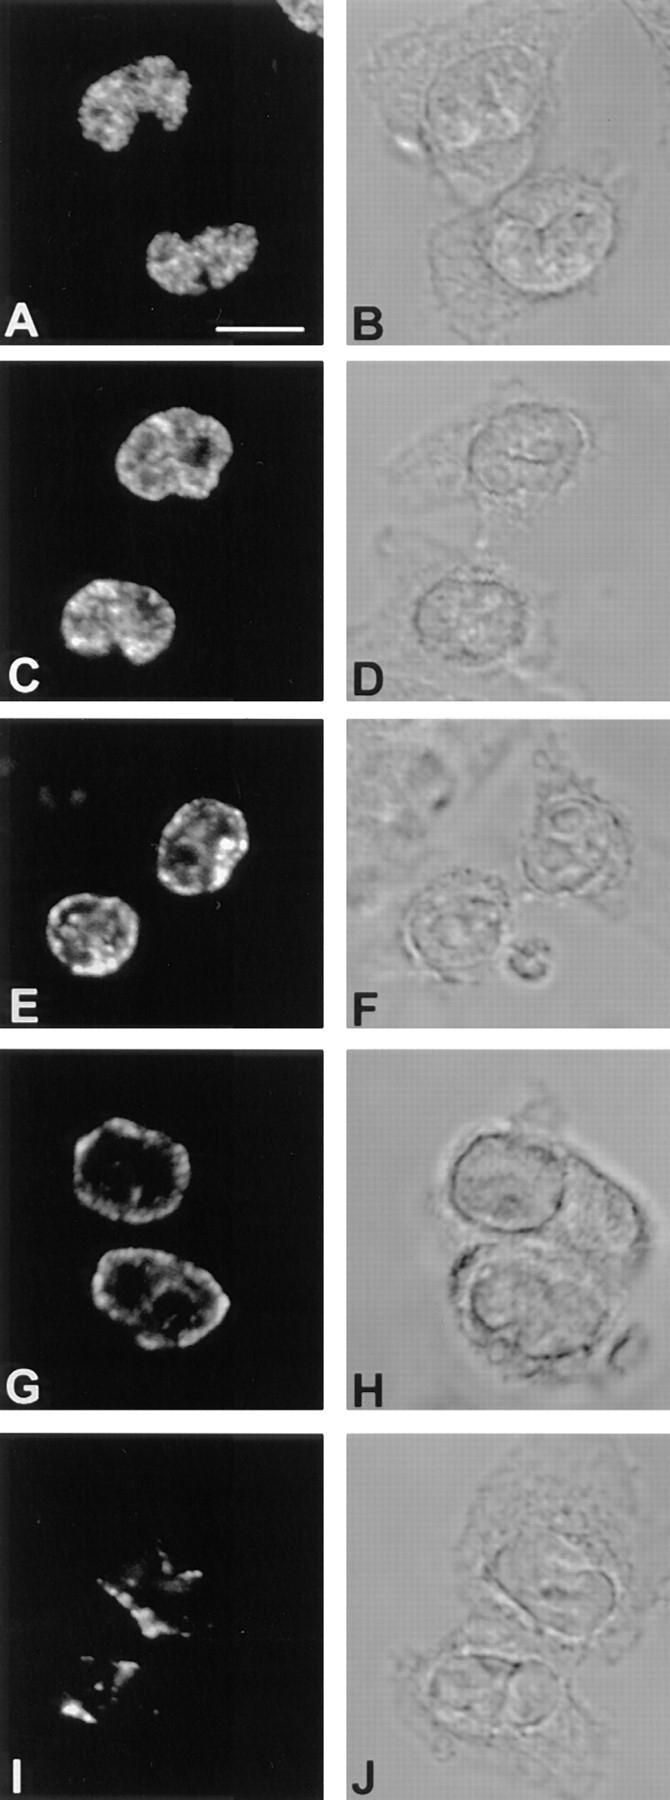
Early and late replicating chromatin distribute in distinct compartments in the nuclei of CCL-39 cells. After synchronous release into S phase, cells were pulse labelled with BrdU immediately before harvesting at hourly intervals. BrdU-DNA was visualized by indirect immunofluorescence. A–E show optical sections through nuclei considered representative of each of the five replication patterns detected (A, pattern 1–E, pattern 5). The corresponding DIC images are depicted in the right row (F–J). Bar, 1 μm.
The number of pulse-labeled cells displaying each of the five patterns was evaluated at each time point (Fig. 2 A). This shows a clear temporal separation between the early (stages 1 and 2) and late (stages 4 and 5) patterns. In contrast, the intermediate pattern (stage 3) overlaps extensively with both early and late stages and is consequently more difficult to characterize. Pulse labeling of asynchronously growing CHF cells with BrdU showed that ∼40% of the labeled cells had a late pattern, 40% an early pattern, and 20% an intermediate pattern.
Figure 2.
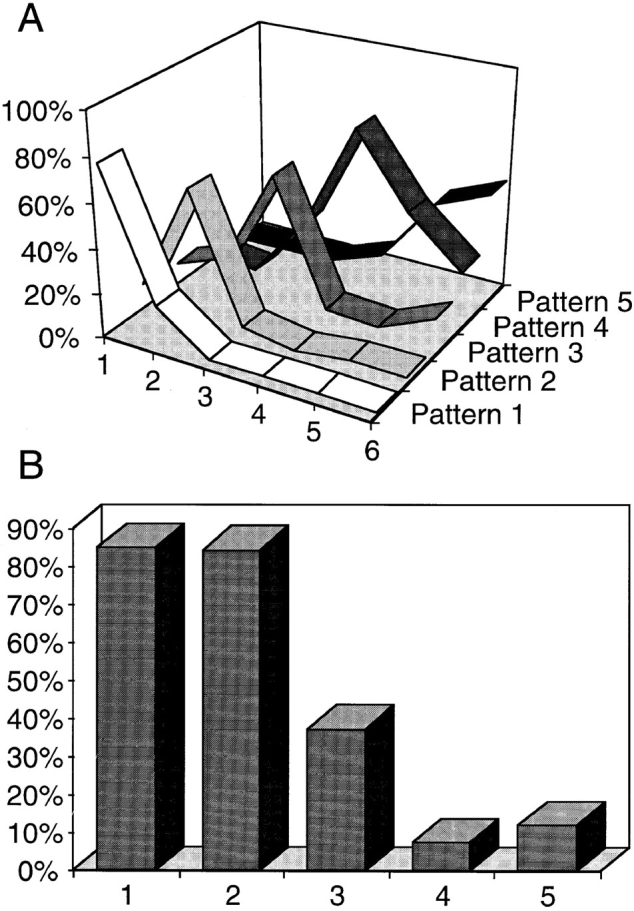
Replication patterns succeed in an ordered sequence throughout S phase. (A) Synchronized cells were released into S phase and pulse labelled with BrdU before harvesting at hourly intervals. Thus, time point 1 refers to cells harvested 1 h after hydroxyurea release. For each time point, a minimum of 200 cells were analyzed. The nuclei were sorted by pattern and the results quantified as percentages of the total number of BrdU- labelled cells. The graph demonstrates an ordered succession of replication patterns as cells progress through S phase with each pattern showing a distinct peak. It is also evident that the overlap between the earlier replication patterns (Patterns 1 and 2) and the later patterns (4 and 5) is minimal, i.e., always <6%. At later time points, no additional clearly defined peaks were observed (not shown). (B) We analyzed ∼50 nuclei per replication pattern randomly selected from an asynchronous cell population pulse labelled with BrdU (10 μM final concentration; 30 min). For each nucleus, the BrdU signal was quantified in equatorial confocal sections (refer to Materials and Methods). Although the internal compartment corresponds to 71.55% of the inner nuclear volume, in an equatorial section it is represented by the inner 80% of the nuclear profile area. Thus, the expected proportion of the BrdU signal in the internal compartment, if its distribution was homogeneous, would equal 0.8. The graph represents the average proportion between the area occupied by the BrdU signal in the inner 80% of the nuclear profile and the total area of the signal in each group. Using ANOVA followed by Scheffe's multicomparison tests, the only statistical identities occur for patterns 1 and 2 (P = 0.999) and for patterns 4 and 5 (P = 0.463). P values for other pairs are <0.0001. All the measured proportions are statistically different from expected for a homogeneous distribution as assessed by Student's t test (P < 0.0001). A significant reduction in the BrdU signal in the nuclear interior is seen as cells progress through S phase.
The proportion of the total fluorescence signal occupying the internal nucleoplasmic volume (i.e., the internal 71.55% of the nuclear volume; refer to Materials and Methods) was quantified from 50 or more nuclei at each of the five stages (Fig. 2 B). This shows that >80% of the signal is internal during stages 1 and 2, while only 7–12% is internal during stages 4 and 5. We conclude that there is a strong correlation between the localization of DNA and the timing of its replication within CHF nuclei.
Correlation between Replication Patterns and Chromosome Banding
We next examined which chromosome regions contributed DNA sequences to the subnuclear compartments revealed by the time-of replication experiments (Fig 3). CHF cells were pulse labeled with BrdU at defined time points during S phase, such that five populations were obtained, highly enriched, for each of the five separate replication patterns (refer to Materials and Methods for experimental details). Metaphase spreads were prepared from each population after nocodazole arrest of the cells in the subsequent mitosis (Fig. 3).
Figure 3.

Analysis of replication labelling patterns in metaphase chromosomes. Metaphase smears were obtained from cells pulsed with BrdU at Stages 1–5 of S phase. BrdU staining and DAPI staining of the same chromosomes is shown side by side. Stage 1 and 2: major R bands show intense BrdU signal (large arrowheads). Stage 3: BrdU signal concentrates in Q bands (large arrowheads). Stage 4: BrdU signal concentrates in Q bands (large arrowheads) that spread along the length of every chromosome as shown in the whole chromosome complement from a single cell (larger panels). Stage 5: BrdU staining is restricted to a few bands per chromosome. Note that a prominent R band from a stage 2 chromosome (small arrowhead) is devoid of BrdU signal and that, in a stage 4 chromosome, an R band region (small arrowhead) is BrdU positive. Bar, 3 μm.
Metaphase spreads from cells labeled at stages 1– 4 all showed a banded BrdU labeling pattern extending throughout each chromosome (Fig. 3, Stages 1– 4, and other data not shown). The BrdU banding pattern was also compared with DAPI labeling of the same chromosomes. For Stages 1 and 2, the most prominent BrdU bands correspond to R bands, which stain less strongly with DAPI (Fig. 3, Stages 1 and 2, large arrowheads). Some prominent R bands that incorporated BrdU during stage 1 may not appear labeled with BrdU during stage 2 (Fig. 3, Stage 2, small arrowheads and data not shown). We note that some bands stained strongly with DAPI (Q bands) were also labeled with BrdU in Stages 1 and 2. For Stages 3 and 4, the most prominent bands labeled with BrdU were the strongly DAPI stained Q bands (Fig. 3, Stages 3 and 4, large arrowheads). Stage 3 appears to mark a transition from having most BrdU label in DAPI pale bands (R bands) to having most BrdU label in DAPI bright bands (Q bands). At Stages 3 and 4, some BrdU incorporation was detected in the DAPI pale R bands. Since these chromosomes have a low resolution of banding obtained after nocodazole arrest, the finding of a subset of early replicating sequences (Stages 1 and 2) in Q band regions and a subset of late replicating sequences (Stage 4) in R band regions is not surprising and may arise through the progressive chromosome compaction that occurs between prophase and metaphase (Drouin et al., 1991). Chromosomes from cells labeled in Stage 5 show fewer BrdU bands than seen for Stages 1–4 and these bands are predominantly DAPI bright (Q) bands dispersed throughout the chromosomes (Fig. 3, Stage 5). The number of chromosomes labeled in each metaphase plate was highly variable for stage 5, consistent with the variable BrdU labeling intensity seen in interphase nuclei at stage 5, and likely due to the progressive shut-off of DNA replication at the end of S phase.
The previous results indicate that the peripheral compartment that replicates essentially (but not exclusively) during stages 4 and 5 is contributed by an extensive banded pattern present in every metaphase chromosome in CHF cells (Fig. 3 for Stage 4, larger panels). This finding is better demonstrated in metaphase spreads from cells that continuously incorporated BrdU during stages 4 and 5 of S phase (Fig. 4 C). In some of these stage 4 plus 5 experiments, while a fraction of the mitotics was used to obtain metaphase spreads, another fraction was replated into fresh BrdU-free culture medium. These cells progressed parasynchronously into the next cell cycle and harvesting at regular intervals showed that the BrdU-labeled chromatin remained peripheral during G1 and S phase (data not shown). Progression of these cells through G1 and reentry into S phase was judged in parallel immunostainings with an anti–PCNA antibody and checking for the emergence of replication-like patterns (Bravo and MacDonald-Bravo, 1987; Kill et al., 1991).
Figure 4.

Intercalated banding of early and late replicating DNA sequences in metaphase chromosomes. (A and B) Metaphase spreads were obtained from synchronized cells grown in the presence of iododeoxyuridine (2.5 μM) during the initial 90–100 min of S phase followed by a second pulse with chlorodeoxyuridine (5 μM) starting 4 h after release into S phase until mitosis was reached. Controls showed that ∼90% of the cells had accumulated replication patterns 1 and 2 during the first pulse and that ∼80% had accumulated patterns 4 and 5 during the second pulse. Confocal imaging after differential immunolabelling of IdU-DNA (green) and CldU-DNA (red) shows that the early and late replicating domains intercalate in a banded pattern. (C) Confocal imaging of a metaphase spread obtained from cells labelled with BrdU and that accumulated patterns 4 and 5. The whole chromosome set is shown. Immunostaining of BrdU-DNA was assigned a green pseudocolor that appears yellow in the merged image and total DNA was immunolabeled with an anti–DNA autoimmune antiserum (red). (D–F) To control the specificity of the differential immunolabelling of CldU-DNA- and IdU-DNA-synchronized CHF cells were grown for a full S phase in the presence of CldU (5 μM) and then for a second cell cycle in the presence of IdU (2.5 μM). Metaphase spreads show that IdU-DNA (E) is present in both chromatids of each chromosome, whereas CldU-DNA (D), as expected, is restricted to one chromatid. Red and green confocal images were merged (F) and areas of overlap appear yellow; some sister chromatid exchanges are clearly visible. Bar, 10 μm.
The difference in the banding pattern of early and late replicating DNA is illustrated by differential labeling of early (stages 1 plus 2) and late (stages 4 plus 5) replicating DNA using pulses of iododeoxyuridine (IdU) and chlorodeoxyuridine (CldU), respectively (Fig. 4, A and B). Parallel control experiments confirm the specificity of detecting incorporation of IdU and CldU (Fig. 4, D–F). These experiments show that early and late replicating DNA form distinct bands in an intercalated pattern extending along the metaphase chromosomes. At least for these sequences, accounting for ∼80% of the total DNA content, the separate metaphase bands predominantly congregate during interphase into separate subnuclear compartments.
The Peripheral Compartment Is a Major Compartment in Other Cell Types
Having established that in CHF cells the peripheral compartment is a major one contributed extensively by most (or all) chromosomes, we next addressed whether a similar situation was observed in other cell types. We found that PtK2 cells pulse labeled with BrdU displayed spatial configurations of DNA replication similar to those seen in CHF cells (Fig. 5). In particular, one of the patterns (pattern C) shows replicating DNA concentrated at the nuclear periphery resembling pattern 4 of CHF cells (compare Fig. 5 C with Fig. 1 D). Quantitative analysis of the total fluorescence signal occupying the internal nucleoplasmic volume was performed in 44 nuclei that had a stage C pattern. This showed that only 5.37% of the signal was internal (SD, 0.0516). In PtK cells, it proved difficult to synchronize the temporal order of the replication patterns. The order of patterns was thus established by pulse labeling asynchronous cultures of PtK cells with CldU followed 3, 4, or 5 h later by a second pulse with IdU (Fig. 5, E and F, and data not shown). Using this approach, we could assign pattern C the third position among the four replication patterns seen in PtK cells. Pulse labeling of asynchronously growing cells with BrdU showed that this pattern accounted for ∼30% of the labeled cells, indicating that stage C lasted for ∼3 h (total S phase duration ∼10 h as estimated from a standard cell cycle curve; Mitchison, 1971). To determine whether most chromosomes contributed to this long-lasting peripheral pattern, we pulse labeled asynchronously growing PtK cells with BrdU (10 μM; 30 min), and then estimated the proportion of stage C cells among the BrdU-labeled population at hourly intervals. This was done to delineate the time period during which stage C cells undergo mitosis. As these cells reach M phase and escape into the next cell cycle, their proportion will progressively decline in the premitotic group. We note that as the labelled cells emerge in the next cell cycle they appear as doublets with the two daughter cells displaying a similar, mirror-image-like BrdU labelling pattern. For the purposes of this analysis, we have only counted cells appearing as singlets, i.e., that are still in the premitotic group. The distinction between labeled singlets and doublets is easily established in PtK cells, since they have a very low mitotic index with few cells traversing S phase, and is further facilitated by replating the cells at low density (∼15–20% confluency). In parallel, we also carefully analyzed the mitotics at each time point to determine the proportion of BrdU labeled vs. unlabeled cells and whether the labelling was present in all chromosomes (“complete” labelling) or in only a fraction of the chromosomes (“partial” labeling). Since PtK cells have a small number of chromosomes (2n = 13) that can be readily visualized as distinct particles during prophase, this stage was chosen for all the observations made on mitotics. The data were used to set up a graph that shows simultaneously the proportions of mitotics with complete chromosome labelling among the total mitotic population and of stage C singlets in the BrdU-labeled premitotic population (Fig. 6). The main result from this approach was that during the time period when stage C cells were undergoing mitosis, as shown by the decline in their proportion, the corresponding chromosomes displayed labelling scattered along their length (Fig. 6, and data not shown).
Figure 5.

Chromatin replication patterns in PtK cells. PtK cells were pulse labelled with BrdU immediately before harvesting. BrdU incorporation sites were visualized by indirect immunofluorescence (A–D) and total DNA was stained with YOYO (A′– D′). Shown are optical sections through nuclei considered representative of each pattern. (A) Pattern A, (B) pattern B, (C) pattern C, (D) pattern D. The temporal order of replication patterns in PtK cells was established by pulse labelling asynchronous cultures with CldU (5 μM; 30 min) followed 3–5 h later by a second pulse with IdU (2:5 μM; 30 min). In the cell shown (E and F), the two pulses were administered 3 h apart, and a succession from pattern B (E) to pattern C (F) is observed. Bar, 10 μm.
Figure 6.

In PtK cells, peripheral chromatin that replicates in the second half of S phase (replication pattern C) is contributed by all chromosomes. Asynchronously growing PtK cells were pulse labelled with BrdU (10 mM; 30 min) and, after release into BrdU-free medium, the cells were harvested at hourly intervals. BrdU-DNA was revealed by indirect immunofluorescence and total DNA by staining with YOYO. For each time point, we scored the percentage of mitotics (prophases) showing “complete” labelling (i.e., BrdU labelling present in all chromosomes) and the percentage of BrdU-labelled interphase cells that displayed pattern C (see text for details). A minimum of 50 mitotic and of 120 interphase cells were analyzed for each time point. The graph shows that during the time period, stage C cells undergo mitosis, as evidenced by the decline in their percentage (thin line), the vast majority of the corresponding mitotic cells (89–100%; thick line) display complete labelling.
We have additionally addressed the same question using a different approach and human lymphoid cells growing in suspension (IM-9 cells). These cells were chosen because of their spherical nuclei, which should minimize geometrical constraints that might otherwise influence the spatial relationship between chromosome territories and the nuclear periphery in flat nuclei. After continuous BrdU labelling for a full S phase, the cells were released into BrdU-free medium and allowed to progress through several cell cycles before harvesting. This will produce cells with a progressively lower number of labelled chromosomes. After several days in culture (∼7 d), a fraction of exponentially growing cells was harvested for the analysis of interphase chromosomes. Immediately after harvesting, colchicine was added to the remaining cells and metaphase spreads were prepared 30 min later. These spreads were used to estimate the average number of BrdU-labelled particles per cell. Two independent experiments were performed and for each experiment 50 metaphase plates were examined. In experiment I 84% of the cells had between one and seven particles labeled (average: 5.3 particles per cell) and in experiment II, 78% of the cells had between one and seven particles labeled (average: 5.7 particles per cell). We note that ∼80% of the BrdU-labelled particles corresponded to fully labelled chromosomes and the remaining ∼20% to partially labelled chromosome segments generated by sister chromatid exchange. For the analysis of interphase chromosomes, 100 cells double immunolabelled for BrdU and lamin B were analyzed per experimental group (Fig. 7). This showed that between ∼97 (experiment I; 477 particles analyzed) and ∼96% (experiment II; 498 particles analyzed) of the BrdU-labelled particles were in close contact with the peripheral lamina in these human lymphoid cells.
Figure 7.

Association of chromosomes with the nuclear periphery. Human lymphoid cells (IM-9 cells) were labelled with BrdU (5 μM) for a full S phase, and then grown in BrdU-free medium for ∼7 d to generate a population with only a few particles labelled. Cells were double immunolabelled for BrdU (green) and lamin B (red) and serial optical sections were obtained by confocal microscopy at 0.4-μM intervals. Complete (A) and partial (B) confocal series are depicted. Note that all labelled particles reach the nuclear periphery. (C) Metaphase spreads were obtained from the same cell population after addition of colcemid to the cultures. Images from total DNA stained with DAPI (red) and BrdU-DNA (yellow) were acquired with a SIT camera and electronically superimposed. Only a few chromosomes show BrdU staining. Bars, 10 μm.
Compartmentalization of DNA in Interphase Is Independent of Chromosome Number
In the experiments described below, we made extensive use of micronucleated cells. Micronuclei originate from individual or small groups of chromosomes after induction of prolonged mitotic arrest (Frackowiak et al., 1986; Geraud et al., 1989). Before using this system in studies of chromatin compartmentalization, we asked whether micronuclei retain the functional characteristics of interphase chromatin. The results show that micronuclei are transcriptionally active as demonstrated by microinjection of bromo-UTP, concentrate an hnRNA binding protein (hnRNP A1) that is imported into the nucleus in a transcription-dependent fashion (Piñol-Roma and Dreyfuss, 1991), accumulate poly (A) RNA, which is known to accumulate in postmitotic nuclei depending on ongoing transcription (Moen et al., 1995) and replicate their DNA as assessed by pulse labelling with BrdU (Fig. 8).
Figure 8.

Micronuclei display features typical of active interphase nuclei. The results shown were obtained with CHF cells induced to micronucleate in the presence of colcemid. (A) Transcriptional activity in micronuclei as assessed by incorporation of Br-UTP (refer to Materials and Methods). The sites of transcription are visualized as multiple foci distributed throughout the nucleoplasm as previously shown for intact nuclei (see for example Wansink et al., 1993; Ferreira et al., 1994). The hnRNP A1 protein was immunolocalized in micronuclei with mAb 4B10 (D). Poly (A) RNA as detected by in situ hybridization with a Poly (U) oligoribonucleotide probe in intact nuclei (B) and in micronuclei (E). Micronuclei efficiently incorporate BrdU (10 μM; 30 min) and show replication patterns similar to those seen in whole nuclei (C, pattern 1 and F, pattern 4). Bar, 10 μm.
Is the compartmentalization of DNA during interphase acting at the single chromosome level, independent of the number of chromosomes present? To address this question, we examined micronuclei generated from separate populations of CHF cells, enriched for cells pulse labelled with BrdU at each of the five stages of replication (Fig. 9). Treatment of CHF cells with colcemid typically gave rise to daughter cells containing 10–20 micronuclei. Many of the micronuclei contained only one or two chromosomes, as assessed by staining with anticentromere antibodies (data not shown). In every case, all the micronuclei display the same staining pattern as seen in intact cells, regardless of the number of chromosomes present or whether early or late replicating DNA had been labelled (Fig. 9). Furthermore, no micronucleus showed a different segregation pattern to its siblings. This demonstrates that compartmentalization of DNA sequences is independent of chromosome number. We conclude that the information required for segregation is an inherent property of each chromosome.
Figure 9.

Compartmentalization of DNA is independent of chromosome number. CHF cells pulse labelled with BrdU at defined stages of S phase (stages 1–5) were induced to micronucleate. Each picture shows a single cell. (A and B) Stage 1 micronuclei displaying different extents of micronucleation. (C) Stage 2 micronuclei. (D) Stage 3 micronuclei; in addition to predominant peripheral labelling, there are internal ring-shaped chromatin assemblies in most micronuclei, the more prominent of which are depicted (arrows). (E) Stage 4 micronuclei. (F) Stage 5 micronuclei. Note the striking resemblance to replication patterns seen in intact nuclei. Bar, 10 μm.
Interphase Compartmentalization of DNA Is Established during Telophase
To determine at what stage in the cell cycle the interphase compartmentalization of DNA is established, an asynchronous population of CHF cells was labelled with BrdU and analyzed at hourly intervals, with particular attention given to telophase and early G1 cells (Fig. 10). The first labelled cells correspond to those undergoing late replication when BrdU was first added. Typically, the first labelled mitotic cells were seen 2–3 h after the BrdU pulse. At the beginning of telophase, DNA that had been labelled during the late stages of S phase (i.e., replication stages 4 and 5) was not confined to the periphery of the nucleus, although lamin staining could be detected associated with the DNA (Fig. 10 A, stereo pair). At later stages of telophase, specifically at the telophase/G1 transition, the typical late pattern of peripheral nuclear labelling was observed (Fig. 10 B, stereo pair). Similar results were obtained when metaphase cells with BrdU-labelled late replicating chromatin (i.e., stages 4 and 5) were replated and the emerging telophase cells analyzed (data not shown). Addition of either transcription (Actinomycin D or DRB) or protein synthesis inhibitors (emetine) did not prevent segregation of late replicating chromatin to the periphery (data not shown). This indicates that activation of gene expression after mitosis is not required for DNA compartmentalization. We obtained further evidence that the spatial organization of DNA sequences typical of interphase is established during late telophase/G1 in CHF cells also for sequences replicating at other times during S phase. A culture of asynchronously growing cells was pulse labelled with BrdU and the cells collected at hourly intervals. For each time point, we have analyzed late telophase/early G1 cells and checked for the presence of BrdU-labelling patterns. This showed that each of the five patterns typical of CHF cells peaked at defined time points after BrdU release in a temporal order that is the reverse of that seen during S phase (Figs. 11 and 12). Since cells labelled at different stages of S phase reach the next cell cycle in a reversed order (i.e., late stages first), these results indicate that sequences replicating at other times during S phase also compartmentalize during late telophase/early G1.
Figure 10.
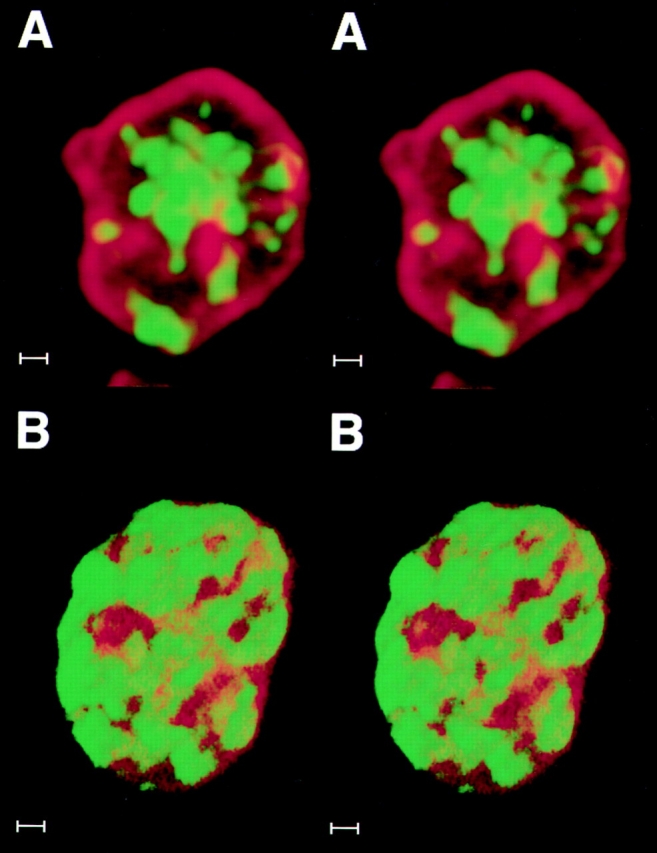
The differential compartmentalization typical of interphase is established during late telophase/G1. BrdU-labelled late replicating DNA was probed with an anti–BrdU mAb (green) and nuclear lamin B with an anti–lamin antiserum (red) during (A) early telophase and (B) late telophase/early G1. In both cases, serial optical sections were taken at 0.33–0.4-mm intervals, digitally converted into 3D images and are shown here as stereo pairs. During early telophase (A), most of the labelled chromatin (green) occupies the internal nucleoplasm; frequent connections are seen with internal projections of lamin staining. In late telophase/early G1 cells (B), most of the late replicating chromatin (green) has relocated to the nuclear periphery. Bar, 1 μm.
Figure 11.

Interphase compartmentalization of DNA is established during late telophase/early G1 in CHF cells. Asynchronous cultures were pulse labelled with BrdU (10 μM; 30 min) and after a 3-h period (similar to the duration of G2 phase), cells were harvested at hourly intervals. Late telophase/early G1 cells were checked for the presence of labelled patterns after immunodetection of BrdU-DNA. For each time point, a minimum of 60 cells were evaluated. The graph shows that each pattern peaks according to a temporal order that is the reverse of that seen during progression through S phase (see text).
Figure 12.
Late telophase/early G1 cells display spatial configurations of BrdU-DNA similar to the replication patterns seen during S phase. Confocal images are shown for cells harvested during the peak of each pattern (refer to Fig. 11). (A) Pattern 1; (C) pattern 2; (E) pattern 3; (G) pattern 4; (I) pattern 5. The corresponding phase contrast images are depicted in the right column (B, D, F, H and J). Bar, 10 μm.
Discussion
In this study, we have used a pulse-labelling protocol at defined stages of S phase to analyze the organization of large scale chromatin domains. In both CHF and PtK cells, we observe a similar close correlation between the spatial organization of chromatin domains and the timing of their replication during S phase. In mitosis, all metaphase chromosomes show a pattern of intercalated early and late replicating DNA bands extending along their entire length. During late telophase, most, if not all, of these DNA bands become compartmentalized, with multiple chromatin domains from each chromosome separating into two principal nuclear compartments; i.e., the peripheral and internal nucleoplasmic compartments. The peripheral compartment predominantly contains late replicating G/Q bands, whereas the internal compartment predominantly contains early replicating R bands. These data thus show a correlation between the G/Q banding pattern of metaphase chromosomes and the subsequent separation of these chromosome bands between distinct nuclear compartments during interphase.
The present analysis of chromatin organization involves experiments requiring nuclear permeabilization and DNA denaturation steps. Although we cannot formally exclude that the DNA denaturation or other experimental techniques used in our analyses have induced some rearrangement of chromatin, we consider it most unlikely that this has had any significant influence on the results presented. We observe similar results when alternative protocols were used to avoid acidic denaturation of DNA and when permeabilization followed fixation (for a detailed discussion of the effects of fixation and permeabilization procedures on higher order chromatin structure, see Belmont et al., 1989).
One of the main conclusions from this study is that DNA compartmentalization is a phenomenon acting at the level of individual chromosomes and is independent of the total number of chromosomes present in the nucleus. This conclusion stems largely from the analysis of micronucleated CHF cells, which exhibit many typical features of intact interphase cells, including transcriptional activity, replication, and progression through the cell cycle. Correct separation of late replicating DNA to the nuclear periphery and early replicating DNA to the internal nucleoplasm was always observed, regardless of chromosome number, even in micronuclei containing only a single chromosome. In every case, the micronuclei resembled Lilliputian replicas of the whole nuclei from which they were derived. Clearly, chromosomes in CHF cells are not organized like “marbles in a bag,” with some exclusively located at either the nuclear periphery or within the nucleoplasm, and they also do not show the Rabl orientation seen in insect nuclei (for example see Comings, 1980; Marshall et al., 1996). Instead, most chromosomes contribute multiple regions to both the peripheral and internal nucleoplasmic compartments. Our analyses here of marsupial kidney epithelial and human lymphoid cells also strongly support this notion.
We propose that the higher order organization of most DNA in CHF nuclei is best described by an autonomous chromosome compartment model. A key feature of the compartment model is that multiple regions from each chromosome reassort during interphase to cluster in a common subnuclear location. The CHF cells provide a particularly clear example of chromosome compartmentalization, with most DNA sequences partitioning between the two major compartments; i.e., peripheral and internal nucleoplasmic. PtK cells, although less extensively studied due to difficulties in obtaining finely synchronized populations, also have a prominent peripheral compartment contributed by most chromosomes. It should be noted, however, that at least one other minor chromatin region (i.e., nucleolar peripheral) is seen at stage 3 of replication, although in CHF cells this contains a small proportion of the total DNA. There is evidence that chromosomes that do not contain rDNA may also contribute to this chromatin region at least through their centromeres (Pluta et al., 1995; Carmo-Fonseca et al., 1996), but whether all chromosomes contribute DNA to the perinucleolar chromatin region remains to be determined. In other cell types, the number of compartments may vary, as may the proportion of total DNA in each. Previous labelling studies in other mammalian cell lines have shown a degree of separation of early and late replicating sequences during interphase, with clusters of late replicating sequences sometimes present in the nucleoplasm as well as at the nuclear periphery (Nakamura et al., 1986; Nakayasu and Berezney, 1989; Fox et al., 1991; Kill et al., 1991; O'Keefe et al., 1992; Hozák et al., 1994). Although less dramatic than in CHF cells, clear spatial separation between significant amounts of early and late replicating DNA is evident in these cell types. This is consistent with the chromosome compartment model, although it does not exclude that different modes of chromosome organization may also occur in other cell types. For example, in vitro studies using synchronously replicating Xenopus sperm nuclei showed that incorporation of labelled nucleotides occurred at several hundred evenly spaced foci and showed no preferential association with the nuclear membrane (Mills et al., 1989). Comparing the data from Diptera and CHF cells, it is clear that there can be differences in how cells organize chromatin in the nucleus. In the future, it will be interesting to extend these analyses to compare other cell types, including plant and insect cells as well as other mammalian cell types, which will help to determine the generality of the autonomous chromosome compartment model.
What is the mechanism that promotes the segregation of DNA into compartments? Since the pattern is established before G1, it is clear that the process of replication itself cannot be primarily responsible. The interphase pattern is not dependent upon activation of gene expression in daughter nuclei, since it is correctly established in the presence of transcription or translation inhibitors. Thus, it is not an indirect effect of differential DNA transcription, causing some sequences to be pushed out to the periphery. It is interesting that at early stages of telophase, when late replicating DNA sequences have not yet moved to the nuclear periphery, extensive lamin staining on the DNA is evident (see Fig. 10). Although most of these internal projections of lamin staining are resolved by late telophase/ early G1 (see Fig. 10), some may persist throughout interphase and remain associated with the minor fraction of internally located late replicating DNA during stages 4 and 5 (data not shown). These projections may correspond to tubular invaginations of the nuclear envelope that associate with lamins (Fricker et al., 1997, and references therein). The binding of lamins, or lamina-associated polypeptides (Gerace and Foisner, 1994), to specific chromosomal regions may play a role in establishing compartments. Consistent with this idea, B type lamin foci bind to late replicating DNA sequences in mouse 3T3 cells (Moir et al., 1994). In addition, there is also biochemical evidence for the binding of lamins and lamina-associated polypeptides to chromatin and associated proteins (Hoger et al., 1991; Yuan et al., 1991; Taniura et al., 1995; Pyrpasopoulou et al., 1996). The direct binding of lamin B1 to DNA, via SARs, was also reported (Luderus et al., 1992). There also appears to be a close structural association of the lamina with chromatin (see Belmont et al., 1993, and references therein) possibly involving discrete chromosomal regions (Hochstrasser and Sedat, 1987; Paddy et al., 1990; Belmont et al., 1993; Marshall et al., 1996). The binding of one of the lamina-associated polypeptides, termed LBR (lamin B receptor), to the heterochromatin-specific protein HP-1 (Ye and Worman, 1996) and to native chromatin fragments (Pyrpasopoulou et al., 1996) was recently reported. Importantly, the binding of purified LBR to intact chromosomes is not homogeneous, but rather follows a distinctive banding pattern present throughout the chromosomes that is reminiscent of Q banding (Pyrpasopoulou et al., 1996). These results are in good agreement with our finding that the peripheral/lamina-facing compartment is extensively represented in the Q bands of most chromosomes. Clearly, more experiments are needed to resolve whether this binding has implications in the compartmentalization of large scale chromatin domains during interphase. Our results show that the interphase compartmentalization of chromatin may occur in single chromosomes independently of physical interactions with other chromosomes (micronucleation experiments) and in the absence of ongoing transcriptional activity. The autonomous feature of the model does not, however, exclude that chromosomes may influence the chromatin organization of each other through their gene products, e.g., long-lived proteins that can withstand short-term protein synthesis inhibition. The nuclear lamins and lamina-associated polypeptides are well positioned to play this role since these molecules are recycled in subsequent cell cycles (for review see Georgatos et al., 1994; Marshall and Wilson, 1997).
We note that an important role for the nuclear periphery, involving either the nuclear lamina, the nuclear pores, or both, in the 3D organization of the genome has previously been discussed (Blobel, 1985; Gerace, 1985).
CHF cells segregate most of their DNA into two major compartments during interphase. It will be important now to analyze exactly which DNA sequences are present in each compartment and to understand what significance this may have for the organization of genes and relevant nongene sequences. For example, preferential assortment of specific genes within the nucleus (see for example Lawrence et al., 1993), of centromeric sequences to the nuclear or nucleolar periphery (Pluta et al., 1995), of telomeric repeats to the close proximity of the nuclear envelope in some cell types (Rawlins et al., 1991), or to the internal nucleoplasm in human cells (where telomeres correspond mostly to R bands; Ludérus et al., 1996) and the recent finding that some genes occupy a preferential position in their chromosome territory (Kurz et al., 1996) might reflect the compartmental organization of chromosomes.
Another important question is whether the compartments might be to some extent functionally distinct. The fact that they contain DNA sequences that are replicated at different times during S phase is consistent with the idea that DNA binding factors are differentially distributed between them. Future studies will therefore address the possible relation between gene expression and DNA compartments.
Acknowledgments
The authors are grateful to R. Saffrich for help with the microinjection experiments. We also thank our colleagues M. Carmo-Fonseca, I. Mattaj, F. Stewart, K. Weis, K. Bohmann, E. Izaurralde, J. Lewis, and C. Lyon for helpful comments on the manuscript. T. Cremer and P. Lichter are also thanked for helpful suggestions. We also thank the following laboratories for generously providing antibodies used in this study: W. van Venrooij for human autoimmune antibodies against kinetochore antigens and DNA, G. Dreyfuss for the 4B10 monoclonal antibody, and S. Georgatos for the rabbit polyclonal antibody against lamin B.
Abbreviations used in this paper
3D; three-dimensional CHF
chinese hamster fibroblast
PtK
marsupial kidney epithelial
SAR
scaffold associated region
Footnotes
J. Ferreira was supported by a Calouste Gulbenkian Foundation fellowship.
Address all correspondence to Dr. Angus I. Lamond, Department of Biochemistry, University of Dundee, Dundee DD14HN, Scotland, UK. Tel: 1-382-345-473. Fax: 1-382-345-695. E-mail: a.i.lamond@dundee.ac.uk
References
- Agard DA, Sedat JW. Three-dimensional architecture of a polytene nucleus. Nature. 1983;302:676–681. doi: 10.1038/302676a0. [DOI] [PubMed] [Google Scholar]
- Aten JA, Stap J, Hoebe R, Bakker PJM. Application and detection of IdUrd and CldUrd as two independent cell-cycle markers. Methods Cell Biol. 1994;41:317–326. [PubMed] [Google Scholar]
- Belmont AS, Sedat JW, Agard DA. A three-dimensional approach to mitotic chromosome structure: evidence for a complex hierarchical organization. J Cell Biol. 1987;105:77–92. doi: 10.1083/jcb.105.1.77. [DOI] [PMC free article] [PubMed] [Google Scholar]
- Belmont AS, Braunfeld MB, Sedat JW, Agard DA. Large-scale chromatin structural domains within mitotic and interphase chromosomes in vivo and in vitro. Chromosoma. 1989;98:129–143. doi: 10.1007/BF00291049. [DOI] [PubMed] [Google Scholar]
- Belmont AS, Zhai Y, Thilenius A. Lamin B distribution and association with peripheral chromatin revealed by optical sectioning and electron microscopy tomography. J Cell Biol. 1993;123:1671–1685. doi: 10.1083/jcb.123.6.1671. [DOI] [PMC free article] [PubMed] [Google Scholar]
- Bickmore WA, Sumner AT. Mammalian chromosome banding— an expression of genome organization. TIG (Trends Genet) 1989;5:144–148. doi: 10.1016/0168-9525(89)90055-3. [DOI] [PubMed] [Google Scholar]
- Bickmore WA, Oghene K. Visualizing the spatial relationships between defined DNA sequences and the axial region of extracted metaphase chromosomes. Cell. 1996;84:95–104. doi: 10.1016/s0092-8674(00)80996-4. [DOI] [PubMed] [Google Scholar]
- Blobel G. Gene gating: a hypothesis. Proc Natl Acad Sci USA. 1985;82:8527–8529. doi: 10.1073/pnas.82.24.8527. [DOI] [PMC free article] [PubMed] [Google Scholar]
- Bravo R, MacDonald-Bravo H. Existence of two populations of cyclin/PCNA during the cell cycle: association with DNA replication sites. J Cell Biol. 1987;105:1549–1554. doi: 10.1083/jcb.105.4.1549. [DOI] [PMC free article] [PubMed] [Google Scholar]
- Carmo-Fonseca M, Cunha C, Custodio N, Carvalho C, Jordan P, Ferreira J, Parreira L. The topography of chromosomes and genes in the nucleus. Exp Cell Res. 1996;229:247–252. doi: 10.1006/excr.1996.0367. [DOI] [PubMed] [Google Scholar]
- Comings DE. Arrangement of chromatin in the nucleus. Hum Genet. 1980;53:131–143. doi: 10.1007/BF00273484. [DOI] [PubMed] [Google Scholar]
- Craig JM, Bickmore WA. Chromosome bands: flavors to savor. Bioessays. 1993;15:349–354. doi: 10.1002/bies.950150510. [DOI] [PubMed] [Google Scholar]
- Cremer T, Kurz A, Zirbel R, Dietzel S, Rinke B, Schrok E, Speicher MR, Mathieu U, Jauch A, Emmerich P, et al. Role of chromosome territories in the functional compartmentalization of the cell nucleus. Cold Spring Harbor Symp Quant Bio. 1993;58:777–792. doi: 10.1101/sqb.1993.058.01.085. [DOI] [PubMed] [Google Scholar]
- Drouin R, Lemieux N, Richer C-L. Chromosome condensation from prophase to late metaphase: relationship to chromosome bands and their replication time. Cytogenet Cell Genet. 1991;57:91–99. doi: 10.1159/000133121. [DOI] [PubMed] [Google Scholar]
- Earnshaw WC. Mitotic chromosome structure. Bioessays. 1988;9:147–150. doi: 10.1002/bies.950090502. [DOI] [PubMed] [Google Scholar]
- Earnshaw WC, Ratrie H, Stetten G. Visualization of centromere proteins CENP-B and CENP-C on a stable dicentric chromosome in cytological spreads. Chromosoma. 1989;98:1–12. doi: 10.1007/BF00293329. [DOI] [PubMed] [Google Scholar]
- Earnshaw WC, Heck MMS. Localization of topoisomerase II in mitotic chromosomes. J Cell Biol. 1985;100:1716–1725. doi: 10.1083/jcb.100.5.1716. [DOI] [PMC free article] [PubMed] [Google Scholar]
- Ferreira JA, Carmo-Fonseca M, Lamond AI. Differential interaction of splicing snRNPs with coiled bodies and interchromatin granules during mitosis and assembly of daughter cell nuclei. J Cell Biol. 1994;126:11–23. doi: 10.1083/jcb.126.1.11. [DOI] [PMC free article] [PubMed] [Google Scholar]
- Fox MH, Arndt-Jovin DJ, Jovin TM, Baumann PH, Robert-Nicoud M. Spatial and temporal distribution of DNA replication sites localized by immunofluorescence and confocal microscopy in mouse fibroblasts. J Cell Sci. 1991;99:247–253. doi: 10.1242/jcs.99.2.247. [DOI] [PubMed] [Google Scholar]
- Frackowiak S, Labidi B, Hernandez-Verdun D, Bouteille M. Preservation of chromosome integrity during micronucleation induced by colchicine in PtK1 cells. Chromosoma. 1986;94:468–474. doi: 10.1007/BF00292756. [DOI] [PubMed] [Google Scholar]
- Fricker M, Hollinshead M, White N, Vaux D. Interphase nuclei of many mammalian cell types contain deep, dynamic, tubular membrane-bound invaginations of the nuclear envelope. J Cell Biol. 1997;136:531–544. doi: 10.1083/jcb.136.3.531. [DOI] [PMC free article] [PubMed] [Google Scholar]
- Gasser SM, Laemmli UK. A glimpse at chromosomal order. TIG (Trends Genet) 1987;3:16–22. [Google Scholar]
- Gasser SM, Laroche T, Falquet J, Boy de la Tour E, Laemmli UK. Metaphase chromosome structure. Involvement of topoisomerase II. J Mol Biol. 1986;188:613–629. doi: 10.1016/s0022-2836(86)80010-9. [DOI] [PubMed] [Google Scholar]
- Gasser SM, Amati BB, Cardenas ME, Hofmann JF-X. Studies on scaffold attachment sites and their relation to genome function. Int Rev Cytol. 1989;119:57–96. doi: 10.1016/s0074-7696(08)60649-x. [DOI] [PubMed] [Google Scholar]
- Georgatos SD, Meier J, Simos G. Lamins and lamin-associated proteins. Curr Opin Cell Biol. 1994;6:347–353. doi: 10.1016/0955-0674(94)90025-6. [DOI] [PubMed] [Google Scholar]
- Gerace L. Traffic control and structural proteins in the eukaryotic nucleus. Nature. 1985;318:508–509. doi: 10.1038/318508a0. [DOI] [PubMed] [Google Scholar]
- Gerace L, Foisner R. Integral membrane proteins and dynamic organization of the nuclear envelope. Trends Cell Biol. 1994;4:127–131. doi: 10.1016/0962-8924(94)90067-1. [DOI] [PubMed] [Google Scholar]
- Geraud G, Laquerriere F, Masson C, Arnoult J, Labidi B, Hernandez-Verdun D. Three-dimensional organization of micronuclei induced by colchicine in PtK1 cells. Exp Cell Res. 1989;181:27–39. doi: 10.1016/0014-4827(89)90179-1. [DOI] [PubMed] [Google Scholar]
- Hochstrasser M, Mathog D, Gruenbaum Y, Saumweber H, Sedat JW. Spatial organization of chromosomes in the salivary gland nuclei of Drosophila melanogaster. J Cell Biol. 1986;102:112–123. doi: 10.1083/jcb.102.1.112. [DOI] [PMC free article] [PubMed] [Google Scholar]
- Hochstrasser M, Sedat JW. Three-dimensional organization of Drosophila melanogaster interphase nuclei. I. Tissue-specific aspects of polytene nuclear architecture. J Cell Biol. 1987a;104:1455–1470. doi: 10.1083/jcb.104.6.1455. [DOI] [PMC free article] [PubMed] [Google Scholar]
- Hochstrasser M, Sedat JW. Three-dimensional organization of Drosophila melanogaster interphase nuclei. II. Chromosome spatial organization and gene regulation. J Cell Biol. 1987b;104:1471–1483. doi: 10.1083/jcb.104.6.1471. [DOI] [PMC free article] [PubMed] [Google Scholar]
- Hochstrasser, M., D. Mathog, Y. Gruenbaum, H. Saumweber, and J.W. Sedat. 1988. Three-dimensional organization of interphase chromosomes in polytene nuclei of Drosophila melanogaster. In Architecture of Eukaryotic Genes. G. Kahl, editor. VCH, Weinheim, Germany. 473– 487.
- Hoger TH, Krohne G, Kleinschmidt JA. Interaction of Xenopus lamins A and LII with chromatin in vitro mediated by a sequence element in the carboxy terminal domain. Exp Cell Res. 1991;197:280–289. doi: 10.1016/0014-4827(91)90434-v. [DOI] [PubMed] [Google Scholar]
- Holmquist G, Gray M, Porter T, Jordan J. Characterization of Giemsa dark- and light-band DNA. Cell. 1982;31:121–129. doi: 10.1016/0092-8674(82)90411-1. [DOI] [PubMed] [Google Scholar]
- Holmquist GP. Chromosome bands: their chromatin flavors and their functional features. Am J Hum Genet. 1992;51:17–37. [PMC free article] [PubMed] [Google Scholar]
- Hozák P, Jackson DA, Cook PR. Replication factories and nuclear bodies: the ultrastructural characterization of replication sites during the cell cycle. J Cell Sci. 1994;107:2191–2202. doi: 10.1242/jcs.107.8.2191. [DOI] [PubMed] [Google Scholar]
- Jackson DA. Structure-function relationships in eukaryotic nuclei. Bioessays. 1991;13:1–10. doi: 10.1002/bies.950130102. [DOI] [PubMed] [Google Scholar]
- Jackson DA, Hassan AB, Errington RJ, Cook PR. Visualization of focal sites of transcription within human nuclei. EMBO (Eur Mol Biol Organ) J. 1993;12:1059–1065. doi: 10.1002/j.1460-2075.1993.tb05747.x. [DOI] [PMC free article] [PubMed] [Google Scholar]
- Johnson, R.T., C.S. Downes, and R.E. Meyn. 1993. The synchronization of mammalian cell lines. In The Cell Cycle, The Practical Approach Series. P. Fantes and R. Brooks, editors. IRL Press, Oxford, UK. pp. 6.
- Kill IR, Bridger JM, Campbell KHS, Maldona-Codina G, Hutchison CJ. The timing of the formation and usage of replicase clusters in S-phase nuclei of human diploid fibroblasts. J Cell Sci. 1991;100:869–876. doi: 10.1242/jcs.100.4.869. [DOI] [PubMed] [Google Scholar]
- Kurz A, Lampel S, Nicholenko JE, Bradl J, Benner A, Zirbel RM, Cremer T, Lichter P. Active and inactive genes localize preferentially in the periphery of chromosome territories. J Cell Biol. 1996;135:1195–1205. doi: 10.1083/jcb.135.5.1195. [DOI] [PMC free article] [PubMed] [Google Scholar]
- Laemmli UK, Cheng SM, Adolph KW, Paulson JR, Brown JA, Baumbach WR. Metaphase chromosome structure: the role of nonhistone proteins. Cold Spring Harbor Symp Quant Biol. 1977;42:351–360. doi: 10.1101/sqb.1978.042.01.036. [DOI] [PubMed] [Google Scholar]
- Laemmli UK, Käs E, Poljak L, Adachi Y. Scaffold associated regions: cis-acting determinants of chromatin structural loops and functional domains. Curr Opin Genet Dev. 1992;2:275–285. doi: 10.1016/s0959-437x(05)80285-0. [DOI] [PubMed] [Google Scholar]
- Latos-Bielenska A, Hameister H, Vogel W. Detection of BrdUrd incorporation in mammalian chromosomes by a BrdUrd antibody. III. Demonstration of replication patterns in highly resolved chromosomes. Hum Genet. 1987;76:293–295. doi: 10.1007/BF00283627. [DOI] [PubMed] [Google Scholar]
- Lawrence JB, Carter KC, Xing X. Probing functional organization within the nucleus: is genome structure integrated with RNA metabolism? . Cold Spring Harbor Symp Quant Biol. 1993;58:807–818. doi: 10.1101/sqb.1993.058.01.088. [DOI] [PubMed] [Google Scholar]
- Lewis CD, Laemmli UK. Higher order metaphase chromosome structure: evidence for metalloprotein interactions. Cell. 1982;29:171–181. doi: 10.1016/0092-8674(82)90101-5. [DOI] [PubMed] [Google Scholar]
- Ludérus MEE, de Graaf A, Mattia E, den Blaauwen JL, Grande MA, de Jong L, van Driel R. Binding of matrix attachment regions to lamin B1. Cell. 1992;70:949–959. doi: 10.1016/0092-8674(92)90245-8. [DOI] [PubMed] [Google Scholar]
- Ludérus MEE, van Steensel B, Chong L, Sibon CM, Cremers FFM, de Lange T. Structure, subnuclear distribution, and nuclear matrix association of the mammalian telomeric complex. J Cell Biol. 1996;135:867–881. doi: 10.1083/jcb.135.4.867. [DOI] [PMC free article] [PubMed] [Google Scholar]
- Manuelidis L. Different central nervous system cell types display distinct and non-random arrangements of satellite DNA sequences. Proc Natl Acad Sci USA. 1984;81:3123–3127. doi: 10.1073/pnas.81.10.3123. [DOI] [PMC free article] [PubMed] [Google Scholar]
- Manuelidis L. A view of interphase chromosomes. Science. 1990;250:1533–1540. doi: 10.1126/science.2274784. [DOI] [PubMed] [Google Scholar]
- Marshall ICB, Wilson KL. Nuclear envelope assembly after mitosis. Trends Cell Biol. 1997;7:69–74. doi: 10.1016/S0962-8924(96)10047-7. [DOI] [PubMed] [Google Scholar]
- Marshall WF, Dernburg AF, Harmon B, Agard DA, Sedat JW. Specific interactions of chromatin with the nuclear envelope: positional determination within the nucleus in Drosophila melanogaster. Mol Biol Cell. 1996;7:825–842. doi: 10.1091/mbc.7.5.825. [DOI] [PMC free article] [PubMed] [Google Scholar]
- Mathog D, Hochstrasser M, Gruenbaum Y, Saumweber H, Sedat J. Characteristic folding pattern of the polytene chromosomes in Drosophila salivary gland nuclei. Nature. 1984;308:414–421. doi: 10.1038/308414a0. [DOI] [PubMed] [Google Scholar]
- Mills AD, Blow JJ, White JG, Amos WB, Wilcock D, Laskey RA. Replication occurs at discrete foci spaced throughout nuclei replicating in vitro. J Cell Sci. 1989;94:471–477. doi: 10.1242/jcs.94.3.471. [DOI] [PubMed] [Google Scholar]
- Mirkovitch J, Mirault M-E, Laemmli UK. Organization of the higher-order chromatin loop: specific DNA attachment sites on nuclear scaffold. Cell. 1984;39:223–232. doi: 10.1016/0092-8674(84)90208-3. [DOI] [PubMed] [Google Scholar]
- Mitchison, J.M. 1971. The biology of the cell cycle. Cambridge University Press; Cambridge.
- Moen PT, Smith KP, Lawrence JB. Compartmentalization of specific pre-mRNA metabolism: an emerging view. Hum Mol Genet. 1995;4:1779–1789. doi: 10.1093/hmg/4.suppl_1.1779. [DOI] [PubMed] [Google Scholar]
- Moir RD, Montag-Lowy M, Goldman RD. Dynamic properties of nuclear lamins: lamin B is associated with sites of DNA replication. J Cell Biol. 1994;125:1201–1212. doi: 10.1083/jcb.125.6.1201. [DOI] [PMC free article] [PubMed] [Google Scholar]
- Nagele R, Freeman T, McMorrow L, Lee H-Y. Precise spatial positioning of chromosomes during prometaphase: evidence for chromosomal order. Science. 1995;270:1831–1834. doi: 10.1126/science.270.5243.1831. [DOI] [PubMed] [Google Scholar]
- Nakamura H, Morita T, Sato C. Structural organisation of replicon domains during DNA synthetic phase in the mammalian nucleus. Exp Cell Res. 1986;165:291–297. doi: 10.1016/0014-4827(86)90583-5. [DOI] [PubMed] [Google Scholar]
- Nakayasu H, Berezney R. Mapping replication sites in the eukaryotic cell nucleus. J Cell Biol. 1989;108:1–11. doi: 10.1083/jcb.108.1.1. [DOI] [PMC free article] [PubMed] [Google Scholar]
- O'Keefe RT, Henderson SC, Spector DL. Dynamic organization of DNA replication in mammalian cell nuclei: spatially and temporally defined replication of chromosome-specific a-satellite sequences. J Cell Biol. 1992;116:1095–1110. doi: 10.1083/jcb.116.5.1095. [DOI] [PMC free article] [PubMed] [Google Scholar]
- Paulson JR, Laemmli UK. The structure of histone depleted metaphase chromosomes. Cell. 1977;12:817–828. doi: 10.1016/0092-8674(77)90280-x. [DOI] [PubMed] [Google Scholar]
- Paddy MR, Belmont AS, Saumweber H, Agard DA, Sedat JW. Interphase nuclear envelope lamins form a discontinuous network that interacts with only a fraction of the chromatin in the nuclear periphery. Cell. 1990;62:89–106. doi: 10.1016/0092-8674(90)90243-8. [DOI] [PubMed] [Google Scholar]
- Piñol-Roma S, Dreyfuss G. Transcription-dependent and transcription-independent nuclear transport of hnRNP proteins. Science. 1991;253:312–314. doi: 10.1126/science.1857966. [DOI] [PubMed] [Google Scholar]
- Pluta AF, Mackay AM, Ainsztein AM, Goldberg IG, Earnshaw WC. The centromere: hub of chromosomal activities. Science. 1995;270:1591–1594. doi: 10.1126/science.270.5242.1591. [DOI] [PubMed] [Google Scholar]
- Pyrpasopoulou A, Meier J, Maison C, Simos G, Georgatos SD. The lamin B receptor (LBR) provides essential chromatin docking sites at the nuclear envelope. EMBO (Eur Mol Biol Organ) J. 1996;15:7108–7119. [PMC free article] [PubMed] [Google Scholar]
- Rawlins DJ, Highett MI, Shaw PJ. Localization of telomeres in plant interphase nuclei by in situ hybridization and 3D confocal microscopy. Chromosoma. 1991;100:424–431. [Google Scholar]
- Saitoh Y, Laemmli UK. Metaphase chromosome structure: bands arise from a differential folding path of the highly AT-rich scaffold. Cell. 1994;76:609–622. doi: 10.1016/0092-8674(94)90502-9. [DOI] [PubMed] [Google Scholar]
- Saitoh N, Goldberg IG, Wood ER, Earnshaw WC. Sc II: an abundant chromosome scaffold protein is a member of a family of putative ATPases with an unusual predicted tertiary structure. J Cell Biol. 1994;127:303–318. doi: 10.1083/jcb.127.2.303. [DOI] [PMC free article] [PubMed] [Google Scholar]
- Saitoh N, Goldberg I, Earnshaw WC. The SMC proteins and the coming of age of the chromosome scaffold hypothesis. Bioessays. 1995;17:759–766. doi: 10.1002/bies.950170905. [DOI] [PubMed] [Google Scholar]
- Sachs RK, van den Engh G, Trask B, Yokota H, Hearst JE. A random-walk/giant-loop model for interphase chromosomes. Proc Natl Acad Sci USA. 1995;92:2710–2714. doi: 10.1073/pnas.92.7.2710. [DOI] [PMC free article] [PubMed] [Google Scholar]
- Sedat J, Manuelidis L. A direct approach to the structure of eukaryotic chromosomes. Cold Spring Harbor Symp Quant Biol. 1978;42:331–350. doi: 10.1101/sqb.1978.042.01.035. [DOI] [PubMed] [Google Scholar]
- Spector DL. Macromolecular domains within the cell nucleus. Annu Rev Cell Biol. 1993;9:265–315. doi: 10.1146/annurev.cb.09.110193.001405. [DOI] [PubMed] [Google Scholar]
- Sproat BS, Lamond AI, Beijer B, Neuner P, Ryder U. Highly efficient chemical synthesis of 2′-O-methyl oligo ribonucleotides ant tetrabiotinylated derivatives: novel probes that are resistent to degradation by RNA or DNA specific nucleases. Nucleic Acids Res. 1989;17:3372–3386. doi: 10.1093/nar/17.9.3373. [DOI] [PMC free article] [PubMed] [Google Scholar]
- Stelzer EH, Wacker I, De May J. Confocal fluorescence microscopy in modern cell biology. Semin Cell Biol. 1991;2:145–152. [PubMed] [Google Scholar]
- Strick R, Laemmli UK. SARs are cisDNA elements of chromosome dynamics: synthesis of a SAR repressor protein. Cell. 1995;83:1137–1148. doi: 10.1016/0092-8674(95)90140-x. [DOI] [PubMed] [Google Scholar]
- Sumner AT. The nature and mechanisms of chromosome banding. Cancer Genet Cytogenet. 1982;6:59–87. doi: 10.1016/0165-4608(82)90022-x. [DOI] [PubMed] [Google Scholar]
- Sumner, A.T. 1990. Chromosome Banding. Unwin Hyman Limited, London, UK.
- Taniura H, Glass C, Gerace L. A chromatin binding site in the tail domain of nuclear lamins that interacts with core histones. J Cell Biol. 1995;131:33–44. doi: 10.1083/jcb.131.1.33. [DOI] [PMC free article] [PubMed] [Google Scholar]
- Wansink DG, Schul W, van der Kraan I, van Steensel B, van Driel R, de Jong L. Fluorescent labeling of nascent RNA reveals transcription by RNA polymerase II in domains scattered throughout the nucleus. J Cell Biol. 1993;122:283–293. doi: 10.1083/jcb.122.2.283. [DOI] [PMC free article] [PubMed] [Google Scholar]
- Ye Q, Worman JH. Interaction between an integral protein of the nuclear envelope inner membrane and human chromodomain proteins homologous to Drosophila HP1. J Biol Chem. 1996;271:14653–14656. doi: 10.1074/jbc.271.25.14653. [DOI] [PubMed] [Google Scholar]
- Yuan J, Simons G, Blobel G, Georgatos SD. Binding of lamin A to polynucleosomes. J Biol Chem. 1991;266:9211–9215. [PubMed] [Google Scholar]