Ultrastructural Organization of Bovine Chromaffin Cell Cortex—Analysis by Cryofixation and Morphometry of Aspects Pertinent to Exocytosis (original) (raw)
Abstract
We have analyzed ultrathin sections from isolated bovine chromaffin cells grown on plastic support, after fast freezing, by quantitative electron microscopy. We determined the size and intracellular distribution of dense core vesicles (DVs or chromaffin granules) and of clear vesicles (CVs). The average diameter of DVs is 356 nm, and that of CVs varies between 35–195 nm (average 90 nm). DVs appear randomly packed inside cells. When the distance of the center of DVs to the cell membrane (CM) is analyzed, DV density is found to decrease as the CM is approached. According to Monte Carlo simulations performed on the basis of the measured size distribution of DVs, this decay can be assigned to a “wall effect.” Any cortical barrier, regardless of its function, seems to not impose a restriction to a random cortical DV packing pattern. The number of DVs closely approaching the CM (docked DVs) is estimated to be between 364 and 629 (average 496), i.e., 0.45 to 0.78 DVs/μm2 CM. Deprivation of Ca2+, priming by increasing [Ca2+]i, or depolarization by high [K+]e for 10 s (the effect of which was controlled electrophysiologically and predicted to change the number of readily releasable granules [RRGs]) does not significantly change the number of peripheral DVs. The reason may be that (a) structural docking implies only in part functional docking (capability of immediate release), and (b) exocytosis is rapidly followed by endocytosis and replenishment of the pool of docked DVs. Whereas the potential contribution of DVs to CM area increase by immediate release can be estimated at 19–33%, that of CVs is expected to be in the range of 5.6–8.0%.
Once attached at the cell membrane (CM),1 a secretory vesicle may acquire the capability to immediately release upon stimulation. Yet, structural docking does not suffice unless accompanied or followed by assembly of the molecular machinery of a docking and fusion complex (Burgoyne and Morgan, 1995; Südhof, 1995).
Various types of electrophysiological experiments indicate that in adrenal medullary chromaffin cells, a relatively small proportion (∼1%) of chromaffin granules (dense core vesicles or DVs) of a given cell are in a more readily releasable state than the vast majority (von Rueden and Neher, 1993; Horrigan and Bookman, 1994; Henkel and Almers, 1996). Quite often the question has been asked whether this pool of readily releasable granules (RRGs) represents granules docked to the CM and whether this can be discerned morphologically. In recent publications, Parsons et al. (1995) as well as Steyer et al. (1997) did morphometric analyses on melanotrophs and chromaffin cells. Both studies concluded that a pool of docked granules can be identified, and that this pool is larger than the functionally defined pool of RRGs.
Heinemann et al. (1993) and von Rueden and Neher (1993) obtained evidence that the functionally defined pool of RRGs depends in a characteristic way on the recent history of the cells. They found that strong stimulation of the cells leads to depletion of the pool of RRGs, and that slight elevation of [Ca2+] leads to an acceleration in refilling the pool of RRGs. Particularly, their data implied that elevating [Ca2+] to ∼300 nM for 30–60 s should enlarge the pool of RRGs by approximately a factor of two. Similarly, Bittner and Holz (1992) found a time- dependent priming effect of Ca2+ in permeabilized chromaffin cells. Therefore, we asked the question whether such changes in the pool size could be observed in a morphometric analysis. We performed quick-freeze electron microscopy after appropriately designed preconditioning procedures. We found that more than sufficient granules are at positions that qualify them as members of the pool of RRGs. However, we could not find indications of specific interactions between DV and CM, and in particular, no changes of such were observed depending on the conditioning protocols. Rather, Monte Carlo simulations, based on the experimental DV size distribution, indicate that the overall statistics of granule placement in the vicinity of the CM is dominated by the constraints of an almost densely packed space, such that specific interactions, through which only a small fraction of the granule population undergo, cannot be discerned.
In detail, using chromaffin cells, we addressed the following questions: (a) Does the DV population have random access to the CM? (b) How many DVs may be docked at the CM? (c) Can we recognize any ultrastructural change under conditions of priming or stimulation? and (d) What might be the potential contribution of peripheral clear vesicles (CVs) to CM area increase?
Materials and Methods
Cell Preparation and Solutions
Chromaffin cells from bovine adrenal medullae were prepared as previously described (Zhou and Neher, 1993) and used 1 d after plating on thermanox disks (Science Services, Munich, Germany) or glass coverslips. The cells were cultured in Ham's F12 medium at 37°C in a humidified atmosphere of 95% air and 5% CO2. Before use in either functional or ultrastructural experiments, the cells were transferred to a Ringer solution of the following composition: NaCl, 140 mM; KCl, 2.8 mM; MgCl2, 2 mM; Hepes, 10 mM; glucose, 10 mM; pH adjusted to 7.2 with NaOH (0 Ca2+−Ringer solution). All reagents were from Sigma Chemical Co. (St. Louis, MO) except as otherwise noted.
Determination of the Size of Chromaffin Cells
The size of chromaffin cells was estimated from measurements of diameters of the cells in culture. Cell diameter was measured in millimeters on a video monitor screen coupled to a microscope (model IM35; Carl Zeiss, Inc., Thornwood, NY) through a video camera (Hitachi, Ltd., Tokyo, Japan), and converted into micrometers by calibration with both a platinum wire with a 100-μm diam and fluorescent beads with a 4.8-μm mean diam (fluoresbrite; Polysciences Ltd., Warrington, PA). In 40 isolated chromaffin cells (CCs) 1 d after plating, the measurement of two orthogonal diameters gave values (mean ± SD) of 16.3 ± 1.45 and 15.63 ± 1.55 μm, respectively. Considering a CC as a sphere with mean diameter of 16 μm, a CM area of 804 μm2 could be derived.
Free Intracellular Ca2+ Concentration Measurements
Intracellular Ca2+ concentration ([Ca2+]i) was estimated by fura-2 microfluorometry of single chromaffin cells (Grynkiewicz et al., 1985; Neher, 1989). Intact chromaffin cells plated on either thermanox or glass coverslips were incubated with 2 μM fura-2-acetoxymethylester (fura-2-AM; Molecular Probes, Leiden, The Netherlands) for 30 min before being washed three times with 0 Ca2+–Ringer solution. The cells were then transferred to the stage of a microscope (model IM35; Carl Zeiss, Inc.) equipped with an epifluorescence system. Fluorescence was excited alternately with light at 360 and 390 nm and then detected with a photomultiplier (model R928; Hamamatsu Photonics, Hamamatsu City, Japan). Fluorescence values were sampled by a laboratory computer and converted into [Ca2+]i as previously described (Neher, 1989). To modify the [Ca2+]i of CCs, we stimulated the cells by varying the K+ and/or Ca2+ concentration of the Ringer solution as follows.
Experimental Manipulation of Cells
Four different experimental conditions (see Results) were suitable for serving as controls or else as a means to condition the secretory capability of chromaffin cells: (a) cells bathed in Ringer solution with 1 mM Ca2+ (control + Ca2+); (b) cells exposed to 20 mM K+, 10 μM tetrodotoxin (TTX), and 1 mM Ca2+–Ringer solution for 2 min (priming conditions); (c) cells treated by application of 70 mM K+ and 1 mM Ca2+–Ringer solution for 10 s (depleting conditions); and (d) in a second control, cells were exposed for 2 min to 0 Ca2+–Ringer solution (control − Ca2+). Stimuli were administered either by local application from a puffer pipette on a selected cell, or by replacing the bathing medium with a bolus application from a syringe connected to the cell chamber.
Preparation for Electron Microscopy
Cells grown on thermanox disks still contained in the respective medium of any of the four conditions described above, were covered with a thin copper disk (Bal-Tec, Balzers, Liechtenstein), and quickly exposed to a one-sided propane jet (Pscheid et al., 1981; Plattner and Knoll, 1984). Frozen sandwich samples were split under liquid N2 or in the freeze-substitution medium (see below) at −80°C. Both fracture halves were processed, one with thermanox and the other adhering to the copper disk from which cells were removed after cryofixation, and then centrifuged to form a pellet. Adherent and pelletted samples were freeze substituted as described previously (Knoll et al., 1991). Briefly, cells were kept for 48 h at −80°C in methanol containing 3% vol/vol glutaraldehyde, 0.5% wt/vol (UO2)2+ acetate, and 1% wt/vol OsO4. The temperature was then raised continuously by 5°C/h. At +5°C, cells were washed in methanol, impregnated with commercial Spurr's epoxide resin at 22°C, and polymerized at 70°C.
Electron Microscopy
Ultrathin sections of silver interference color, stained with aqueous (UO2)2+ acetate and lead citrate, pH 12.0, were analyzed in an electron microscope (80 kV, 30 μm objective aperture, zero energy loss; model Leo EM912 Omega; Carl Zeiss, Inc.). Micrographs were randomly taken from two different cryofixation samples per experiment at 104× magnification. Calibration with latex (diameter 0.822 ± 0.0034 μm; Serva, Heidelberg, Germany) showed reliability within 1.5%. Thickness of individual sections was determined on occasional folds.
Quantitation of Electron Micrographs
Prints of 22,000× magnification were used. First, the size distribution of DVs cut precisely in median position, i.e., with sharp membrane contours, was determined. DVs were taken randomly from different cells and pooled in a size histogram.
Second, in regions with precisely vertically cut CM, i.e., with a clear-cut CM profile, we determined the distance of the center of cortical DVs, identified by electron dense contents to the CM, regardless how DVs were cut in median to tangential position. DV center to CM distances were recorded ⩽1,360 nm (30 mm on prints). Cytoplasmic regions not as wide as this limit, ocurring at cell extensions or over peripherally located nuclei, had to be excluded. CVs, all with diameters of 35–195 nm, registered in a similar way when located at distances ⩽10 nm from the CM.
We referred the number of vesicles to the actual length of the CM analyzed. This was determined by random superposition of a square lattice with a spacing of d = 10.0 mm. The number of hit points was 1,194, 1,000, 1,480, and 1,620, respectively, for the four types of experiments indicated above in which we analyzed 25, 22, 34, and 28 cells, respectively. From the number of hits h on a micrograph the length l of the CM results in l = d·h·π/4 (Plattner, 1973). In conjunction with the second approach, including randomly cut DVs of a size contained in the size distribution histogram of DVs, this allows for calculation of the frequency of docked DVs per unit membrane length (see below and Discussion).
Finally, we determined the relative volume fraction (volume percentage) of DVs in the cytoplasm (excluding cortical areas defined above) of random cells by superposition of a square lattice. The volume fraction in the cytoplasm was calculated from the ratio of hit points (on DVs) to non-hit points (Plattner and Zingsheim, 1983). We applied a 30% correction for the Holmes effect, i.e., for overestimation because of noninfinite section thickness (Plattner and Zingsheim, 1983). Since no differences were recognized between DV volume fractions in the different experiments, all these data were pooled.
Number of Vesicles Docked at the CM
DVs whose center to CM distance falls within the DV size histogram were counted and this number (n) was referred to CM length. If these DVs are considered as docked, their number per μm2 CM area (n a) can be calculated from the mean DV radius (r ves) and the number of DVs per μm length (n l) on electron micrographs from ultrathin sections of mean thickness d (Weibel et al., 1966) as n a = n l/(2_r_ ves + d). From an average cell diameter of 16 μm ± 1.5 μm (n = 40), a cell membrane area of ∼804 μm2 is derived. The total number of docked DVs, then, is the above number multiplied by 804. In another approach the number of docked DVs was calculated from the DV density distribution profile (see Discussion).
Theoretical Predictions and Model Calculations
To relate the measured granule distributions to simple models, some expectations regarding the distribution of DVs in the vicinity of a cell boundary were calculated.
Assume that the centers of granules are distributed randomly and uniformly over the cell volume, except for those regions in which steric hindrance does not allow the presence of a granule larger than a certain diameter because of overlap with the cell boundary. Then the probability Pρ(d) to find the center of a granule of radius r ρ at a distance d from the boundary of a cell with radius r ρ is given by
 |
1 |
|---|
where 4π(r 0 − d)2 dr is the volume of a shell of width dr at distance (r 0 − d) from the center of the cell.
If we have a distribution of granule radii f(ρ), then the probability p(d) of finding a granule of any radius at distance d from the cell boundary will be
 |
2 |
|---|
 |
3 |
|---|
Here, const is a constant (not dependent on granule diameter) that is chosen so that the overall granule density in the interior of the cell is correct. The integral in the above expression is the cumulative distribution of granule radii which approaches the value of 1 for d > r max. For small distances from the wall, when r 0 − d is approximately constant, p(d) rises with the cumulative radius distribution. For larger values it drops back to zero with the square of (r 0 − d), because the volume fraction of loci at large distances (closer to the center of the cell) is small. For calculation of the theoretical curves in Fig. 7, the granule diameter distribution of Fig. 4 was integrated, multiplied by (r 0 − d)2, and scaled to match the respective experimental curve for d ⩾300 nm.
Figure 7.

Relative frequency of DVs in cortical regions of chromaffin cells, evaluated by DV center to CM distance. 100% = plateau value inside cell that corresponds on average to a granule density of 6.4 granules/μm3, if related to the evaluated membrane length and converted to density according to Weibel et al. (1966). It should be pointed out that this value is lower than the one obtained from volume fraction (see text). (A) control + Ca2+, (B) primed state, (C) stimulation by depolarization, and (D) control − Ca2+ (see Materials and Methods). Superimposed on all graphs (continuous curve) is the expected distribution, calculated from the cumulative distribution of granule radii according to Eq. 3.
Figure 4.

Size distribution histogram of DVs (n = 219).
To test the model predictions, Monte Carlo simulations were performed (Fig. 1). A sphere with a radius of 8 μm was filled with 26,000 granules of the measured radius distribution. Placement of granules was performed by obtaining three random numbers in the range ± 8 μm. These were interpreted as coordinates of the granule center. The granule was placed if it was found to be completely inside the cell and not overlap with any granule that had already been placed. Granules with the largest radii were placed first, followed by progessively smaller granules according to the size distribution. The coordinates of successfully placed granules were entered into a table together with their radii. The table was subsequently used to construct histograms of distances from the cell wall and to create artificial cross-sections through the cell.
Figure 1.
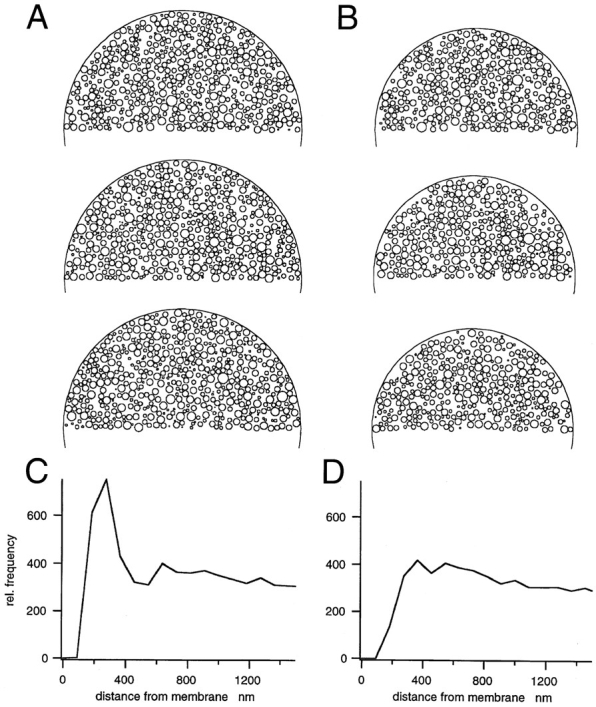
Results from Monte Carlo simulations. Top panels show simulated cross-sections. (A) Three cross-sections through a cell, one half of which was filled with granules, as described in the text. (C) Histogram for the number of granule centers found at a certain distance from the membrane. (B) The same for a smaller cell that was carved out of the cell in A as described in the text. (D) Corresponding distance histogram.
It should be noted that placing 26,000 granules of the given distribution into a sphere with a 16-μm diam results in rather close packing, so that many attempts are necessary for a successful placement according to the rule given above. As a consequence, the distribution of center distances from the wall does not follow the predictions of Eq. 3. Rather, it was found to peak strongly at values ∼300 nm (see Fig. 1 C). This is because density of granule centers at distances <200 nm is low due to exclusion by wall interactions. Consequently, there is an increased chance of being able to place granules at 200–400 nm distance, because chances of overlap with other granules are smaller than further inside the sphere, where competing granules are located isotropically at constant density. The resulting cross-sections through such model cells appear to be uniformly filled with granules up to the wall (Fig. 1, left), despite the peaked distribution of granule centers. In conclusion, the simple Monte Carlo procedure used here does not generate a uniform distribution, but rather a distribution which is peaked at the wall. Nevertheless, it appears to uniformly fill the cell.
For distances >500 nm from the wall, the density of granule centers is quite uniform in the model cell, as demonstrated in Fig. 1 C. This was exploited to create a cell with uniform granule density by excising a sphere with a 7.5-μm radius out of the larger sphere with an 8-μm radius. To do so, all granules were eliminated, which cut the surface of the new sphere, or fell outside. The cell with reduced size, then, had a distribution of vesicle distances from the wall very close to the prediction of Eq. 3. When cross-sections are made through this model, cell images are obtained as displayed in the right column of Fig. 1. They show regions without granules close to the wall, quite similar to what is seen in actual electron micrographs. This apparent exclusion zone is merely a consequence of the lack of granules, which, if present, would intersect the cell boundary.
It should be pointed out that these simulations are not presented to argue for the applicability of the simple placing rules used. Rather, they are intended to demonstrate that the specific rules of how granules meet the constraints of close packing in the vicinity of a wall influence the outcome more strongly than any of the procedures that we applied to manipulate real cells (see above). Also, the simulations show that exclusion zones close to the membrane do not necessarily justify the postulate of a specific barrier for granules.
Results
Changes in [Ca2+]i Elicited by the Different Experimental Conditions
Capacitance measurements of patch-clamped chromaffin cells have revealed a Ca2+-dependent augmentation of the secretory response after a sustained, yet moderate, increase in [Ca2+]i. This augmentation was interpreted as an enlargement of a pool of RRGs (von Rueden and Neher, 1993). Likewise, intense or repetitive stimulation leads to a depression of the capacitance increase, probably because of the exhaustion of a RRG pool (Heinemann et al., 1993). In both cases, a good correlation between the secretory response and the [Ca2+]i estimated by fura-2 microfluorometry could be obtained. In the present experiments, we loaded cells with fura-2 ester to define incubation protocols that would lead either to an enlarged or a depressed pool of readily releasable granules. We found that stimulation for 2 min with Ringer solution containing 20 mM K+, 1 mM Ca2+, and 10 μM TTX gave rise to a sustained increase in [Ca2+]i ⩽311 ± 94 nM (mean ± SD; n = 36) without any initial overshoot. These values were similar to those reported to cause augmentation of secretion (von Rueden and Neher, 1993). Cells plated on thermanox disks (as used for ultrastructural analysis) or on glass coverslips gave very similar results (data not shown). No differences in single-cell [Ca2+]i signals were observed when the cells were stimulated by either replacing the bathing medium completely or by local application of the depolarizing solution onto individual cells, thus suggesting that this type of stimulus does not cause any paracrine effect because of the release of mediators from neighboring cells. Therefore, we adopted these conditions as a protocol for increasing the pool of RRGs.
To cause depletion of the RRG pool, we challenged the cells for 10 s with 70 mM K+, and 1 mM Ca2+-containing Ringer solution so that a rapid [Ca2+]i rise, peaking at 2.7 ± 0.6 μM (n = 6), was evoked. Although the [Ca2+]i elevation induced by 70 mM K+ was transient because of inactivation of voltage-dependent Ca2+ channels (Calvo et al., 1995), it consistently remained >2 μM during the stimulation period (data not shown). The profile of the Ca2+ signal evoked by 70 mM K+ mimicked the one obtained by trains of five voltage-depolarizing pulses (200 ms duration, 1 Hz) known to cause depression of the chromaffin cell secretory response (von Rueden and Neher, 1993). It should be noted that the Ca2+ elevation observed upon exposure to high K+, 1 mM Ca2+-containing solutions is primarily because of voltage-activated Ca2+ entry, since Ca2+ reintroduction in the bathing medium after a period of Ca2+ deprivation caused a [Ca2+]i increase of only 35 ± 15 nM (n = 7) in the absence of high K+.
Electron Micrographs
Figs. 2 and 3 show examples of chromaffin cells after the cryofixation/freeze substitution was applied. DVs identified by their electron-dense contents appear homogenously distributed in the cell interior, whereas other organelles are very rare. One can also recognize the occurrence of some small CVs at the cell cortical region, coinciding with a decreasing apparent density of DVs close to the CM. Two methodical problems become evident: it is difficult to both (a) clearly define DVs in precisely median section, and (b) differentiate unambiguously between docked DVs and some other DVs when they closely approach the CM. The reason is that section thickness (52 ± 23 nm, n = 20) cannot be neglected considering the size of DVs (356 nm; see below). Tapering of the CM, with occasional formation of ∼0.1-μm-wide and ∼0.05-μm-deep funnels (Fig. 3), may cause problems in quantifying docked DVs whose countours are not always well defined. This may be even more serious with CVs, because of their smaller size of 35– 195 nm (average 90 nm). Therefore, we performed evaluations as described in the following sections.
Figure 2.
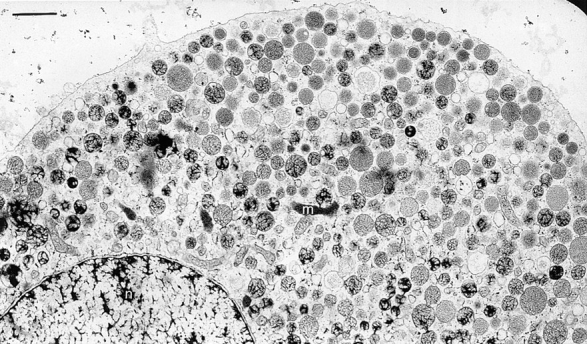
Survey of a nonstimulated chromaffin cell (control + Ca2+) after the preparation was applied (see Materials and Methods). Note (a) abundance of DVs with compact or spongy contents depending on individual cryofixation, (b) homogenous distribution of DVs in cell interior, (c) decay of apparent DV packing density close to CM, (d) occurrence of small CVs in the cortex, and (e) rare occurrence of some other organelles, such as a mitochondrion (m) in the cytoplasm; n indicates the nucleus. Bar, 1 μm.
Figure 3.
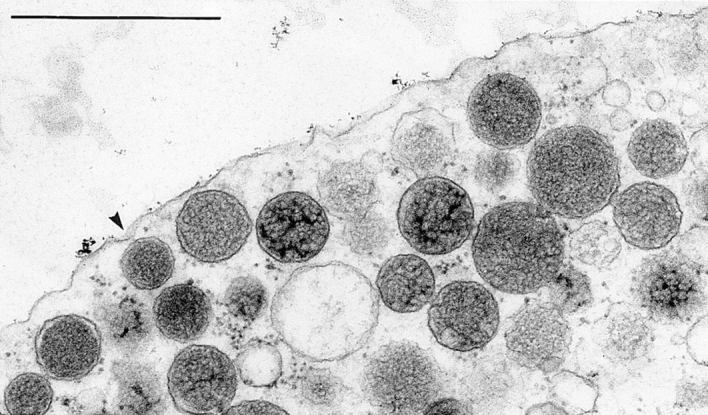
Magnification from top right portion of Fig. 2. Note tapering of CM, occasionally with a funnel-like depression towards an approaching DV (arrowhead), and decreasing apparent density of DVs close to CM. Bar, 1 μm.
Size Distribution of Vesicles
On electron micrographs we determined the size distribution of DVs cut in median position (refer to Materials and Methods). DVs were taken randomly from different cells and pooled in a size histogram. It is worth noting that size distribution was rather similar in all experiments (control − Ca2+, Ca2+-deprivation, priming, or understimulation of secretion) and, thus, all data were accumulated in a single histogram (Fig. 4). The DV medium diameter was calculated as 356 nm (mean SD ± 91 nm, n = 219, from 12 cells). The whole population of DVs analyzed followed rather closely, though not strictly, a Gaussian distribution. Smaller or irregularly shaped DVs, such as those occurring in norepinephrine-containing cells (rare in bovine adrenal medullae) were extremely rare (generally <3%) and were not included in our analysis.
Analysis of DV Distribution in Cells
According to the outlines presented in Materials and Methods, the entire cell circumference was included in our random morphometric analysis, i.e., we included random cell regions attached to the thermanox support (Fig. 5) and any opposite regions (Fig. 6). This was important to account for the wide variability of DV packing (compare Figs. 2, 5, and 6). Our statistical analysis of DV distribution is based on a total of 109 cells; 4,766 DVs and 5,294 CM reference points were evaluated alone for this aspect, with similar sample size for each of the experiments, (a–d). Results showed the same tendency when data were processed as subpools for each experiment. Since our values are averaged over a large cell population for each experiment, this should completely compensate for individual and/or local variations in DV distribution.
Figure 5.

Cell region attached to the thermanox support. Note occurrence of a filamentous cortical region with apparent DV exclusion. Bar, 1 μm.
Figure 6.

Cell region containing exceptionally few DVs as an example of heterogenous DV distribution (compare with Figs. 2 and 5). Note centriole (c), nucleus (n), and Golgi areas (g). Bar, 1 μm.
We determined histograms of cortical DV packing density on the basis of DV center to CM distance, as shown in Fig. 7 for the different experiments. DV density measured this way is zero (by definition) for center to CM distances smaller than the minimum radius of DVs. It increases with larger distances from the CM, reaches a plateau level, and then slightly decreases when increasing distance becomes comparable to cell radius. The histograms in Fig. 7 can be mimicked by model calculations assuming random packing of DVs (refer to Materials and Methods). Such a histogram, derived from the experimental granule size distribution, is superimposed on the experimental ones in Fig. 7 for ease of comparison. Agreement between the curves suggests that the most simple explanation for the observed decay at short distances is a wall effect (refer to Materials and Methods and see Discussion), without requirement of any additional barrier.
Surprisingly, no quantitative difference of DV distribution in the cell cortex can be ascertained when controls (with and without Ca2+, Figs. 7, A and D) are compared with primed (20 mM K+, 1 mM Ca2+, and 10 μM TTX for 2 min; Fig. 7 B), or even with stimulated (70 mM K+, 1 mM Ca2+ for 10 s; Fig. 7 C) cells (see Discussion).
Estimation of the Number of Docked Vesicles
Docked vesicles can be readily observed in electron micrographs of many types of nerve terminals at active zones. These vesicles seem to touch the presynaptic membrane and are believed to be tethered to it by the so-called _N_-ethylmaleimide-sensitive factor/attachment protein receptor (SNARE) complex, a macromolecular complex formed by interaction between vesicular proteins and proteins of the plasma membrane (for review see Südhof, 1995). We asked how many similarly docked granules can be seen in chromaffin cells. Docked DVs should form a peak in histograms as shown in Fig. 1. No such peak was apparent, and, as detailed above, all our histograms were compatible with a uniform distribution. We preferred this mode of analysis over the alternative to measure minimum separation between granules and CM, because it eliminates the serious problem of identifying DVs that are centrally cut. Rather, in our method, all visible DVs can be analyzed and the numbers can be converted, by well-established methods (refer to Materials and Methods), to DV densities per unit surface area. On the other hand, the information on the separation between DV wall and CM is blurred by the radius distribution of DVs. Therefore, we applied two additional types of analysis to estimate the number of those DVs that could possibly touch the CM and thus be considered to be docked. First, we counted the number of DVs, the centers of which were closer to the membrane than the largest granule radius. From that, we calculated the number per unit surface area and the total number of such DVs per cell, as detailed in the Materials and Methods and the legend to Table I. For the four types of experiments, numbers vary between 364–629 docked DVs. According to Table I, DVs occur with a density of 0.45–0.78 DV/μm2. Considering the average projection area of a DV of 0.10 μm2, only 4–8% of the CM area would “see” a DV in close apposition. Although the number of docked DVs per cell is highest for the primed state, this does not mean that the proportion of docked granules is highest in this case. Rather, the overall granule density was highest in this sample and the relative number of near-membrane DVs was lower than for controls, as shown by the distance histogram of Fig. 7 B.
Table I.
Number of DVs* and CVs‡ in Close Apposition§ to the CM
| Experiment | DVs | CVs |
|---|---|---|
| Control + Ca2+ | ||
| Per cell | 439 | |
| Per μm2 CM | 0.55 | 1.35 |
| Primed state | ||
| Per cell | 629 | |
| Per μm2 CM | 0.78 | 1.92 |
| Triggered | ||
| Per cell | 597 | |
| Per μm2 CM | 0.74 | 1.62 |
| Control − Ca2+ | ||
| Per cell | 364 | |
| Per μm2 CM | 0.45 | 1.88 |
In a second kind of analysis we counted for comparison, with the data of Parsons et al. (1995) and Steyer et al. (1997), those DVs that appear to be centrally cut and almost touch the membrane. We counted separately DVs that approached the CM to within 45 nm, and granules that were in the distance range 45–90 nm. Contrary to the findings of Parsons et al. (1995) and Steyer et al. (1997), we did not find a pronounced excess of the former over the latter (91 vs. 88 on a total length of the CM profile of 1,890 μm). As in the case of the histograms of Fig. 7, there was no systematic difference among the four kinds of pretreatment. Conversion of these numbers to densities or total numbers per cell is problematic (see Discussion). We can, however, obtain an estimate for the number of docked DVs by taking the number of DVs of the <45-nm class and assuming that all docked DVs, the docking point of which is not ⩽20 nm away from the section, fall into this class. Applying Weibel's rule (Weibel et al., 1966), and assuming a cell surface area of 804 μm2, we then arrive at 421 docked DVs per cell. In conclusion, we found that the density of granules is high enough that, within the limits of experimental resolution, a relatively large number of granules may be docked, but we found little positive evidence (unlike in the case of Steyer et al., 1997) that vesicles are actually specifically docked.
We also determined the number of CVs, with diameters of 35–195 nm, at the CM (Table I). In this case, as in the case of the second method above, close proximity to the CM (∼10 nm) was taken as criterion for docking. This resulted in estimated values also contained in Table I.
Considering the large size distribution for these vesicle types, we calculated their average membrane surface area and, from their frequency on the CM (Table I), their potential contribution to CM area increase after fusion (Table II). Membrane area potentially provided by DVs by far outnumbers that possibly recruited from CVs. When related to the potential contribution of DVs (100%), CVs could contribute only an additional 24 (control + Ca2+), 24 (primed), 22 (triggered) or 41% (control − Ca2+). Although statistical differences could not be ascertained for the individual experiments, CVs clearly could not contribute a major area to the CM unless they would selectively fuse.
Table II.
Potential Contribution (%) of DVs or CVs to CM Area*
| Experiment | DVs | CVs |
|---|---|---|
| Control + Ca2+ | 23 | 5.6 |
| Primed | 33 | 8.0 |
| Triggered | 31 | 6.7 |
| Control − Ca2+ | 19 | 7.8 |
Relative Volume (Volume Fraction) of DVs Inside Cells
Area fraction of DVs was determined for 12 cells, excluding the outermost cortical layer. Data obtained (uncorrected value = 43.8% ± 9.0) had to be corrected for finite section thickness (refer to Holmes effect in Materials and Methods) by an estimated 30%. Thus, the volume fraction of DVs in chromaffin cells can be assumed as 30.7% ± 6.3.
From this value, DV density (DVs/μm3) was calculated by dividing the average volume occupied by DVs in a cube of 1 μm length by the mean volume of a DV. The latter was calculated, assuming Gaussian size distribution, to be 0.028 μm3. (This is 20% larger than the volume of a DV of mean radius.) Thus, a density of 10.84 DVs/μm3 outside the cortical region was obtained. These data, in conjunction with DV distribution profiles, could also be used to compute DVs attached at the CM (see Discussion).
Discussion
With the type of cryofixation we used (sandwich freezing), cells remain permanently surrounded by their culture or trigger medium, and impairment of viability during handling can be minimized (Pscheid et al., 1981). The propane jet applied onto the thin copper cover provides very rapid cooling, i.e., up to 40,000°C·s−1 (Knoll et al., 1982; Plattner and Knoll, 1984). The freeze-substitution medium used includes OsO4 and, thus, precludes osmotic changes during warming (Van Harreveld et al., 1965; Morel et al., 1971; Wollweber et al., 1981), and the epoxide embedding chosen involves little shrinkage (Plattner and Zingsheim, 1983). In other studies, open samples were used for freezing on cold metal surfaces or injection into cold media (Ornberg et al., 1995; Parsons et al., 1995). This requires removal of the culture/trigger medium since cryopreservation is restricted to ∼20 μm (Plattner and Bachmann, 1982). The fluid film that may remain on the sample is very thin and ionic conditions are difficult to control because of evaporation. Concomitantly, X-ray microanalysis has shown improved reliability of ion distributions after freezing in closed sandwiches (Zierold et al., 1984; Zierold, 1988). Any influence of these important methodical aspects or shrinkage of the methacrylate embedding (Plattner and Zingsheim, 1983) occasionally used has not been analyzed and may explain differences between our study and some previous work.
We determined DV diameter in bovine chromaffin cells as 356 nm ± 91 with a carefully calibrated electron microscope. After cold metal freezing, freeze substitution in (UO2)2+ acetate in methanol and methacrylate embedding 326 nm were reported (Parsons et al., 1995). Ornberg et al. (1995) found 234 nm (untriggered) or 274–277 nm (depolarization triggered), also after cold metal freezing. For comparison, standard chemical fixation resulted in a DV diameter of 177 ± 7 nm (Vitale et al., 1995). Thus, a wide range of values for DV diameters can be found in the literature. We consider a DV diameter of 356 nm reliable because of the reasons given above.
From the relative volume fraction of DVs and sizes of CCs and DVs, after subtraction of a 5-μm diam nucleus, the number of DVs per cell can be estimated as 21,600 ± 4,400. This is based on DV density as calculated above (it would be 26,000 DVs if tentatively calculated from mean DV radius). This number is somewhat less than the 30,000 DVs estimated previously (Burgoyne, 1991).
We found that the distribution of DV centers close to the CM is indistinguishable from what would be expected if DVs were distributed uniformly throughout the cytoplasm, except where they are excluded by the wall interactions. To reach this conclusion, we compared experimental histograms of DV density versus distance (Fig. 7) to histograms generated by a computer model (Fig. 1 D). In that model it was assumed that the density of granule centers is uniform throughout those regions of a spherical cell, where placement of granules would not be prohibited by wall interactions (refer to Materials and Methods for details). When artificial cross-sections were calculated from such model cells (Fig. 1 B), exclusion zones quite reminiscent of those seen in real micrographs (Figs. 2, 3, and freeze-fracture images by Schmidt et al., 1983) were apparent. This demonstrates that observation of such an exclusion zone does not necessarily lead to the postulate of a barrier function of cellular constituents, such as an F-actin network. Rather, it appears that such a network may fill the gaps that are dictated by unspecific granule–wall interactions. Nevertheless, such a network, once established, may impede access of DVs to the membrane (see below). In our micrographs, cortical microfilaments are difficult to recognize since OsO4-fixation causes fragmentation of F-actin (Maupin-Szamier and Pollard, 1978), though it can well maintain organelles in their original shape and location (see above).
The finding that the observed distribution of DV centers is indistinguishable from the predictions of a model, which assumes uniform distribution, does not answer the question how many DVs are actually docked. In fact, the model in its extreme (with ideal uniformity and completely rigid spherical walls and granules) would hardly allow any docked granules. In reality, deformations of both granules and cell membranes, as well as unresolvable deviations from uniformity of the density of DV centers, will allow docking. Parsons et al. (1995) analyzed distances between DV boundaries and membranes directly and concluded that 840 DVs are docked. In a more recent study from the same laboratory (Steyer et al., 1997), this number was found to be 1,010. We found it impossible to precisely determine this parameter because of uncertainties in identifying DVs that are medially cut and in determining the boundary of peripherally cut DVs. Nevertheless, we applied several kinds of analysis to discuss the limits which our findings impose on the number of DVs which possibly might be docked.
If we simply count all DVs, the centers of which are within one DV radius of the cell membrane, and convert the values into DVs per cell, we obtain numbers as given in Table II. Values range between 364–629 for the various pretreatments of cells, with an average of 496. These numbers most likely are overestimates since we assumed a granule radius of 270 nm that was chosen so that 97% of all granules would have smaller radii. This means that if all these granules were docked, the membrane would have to dimple for the majority of them. Such dimples can be seen occasionally, (Fig. 3; Parsons et al., 1995), but they are usually smaller than 50–100 nm. This observation provides the basis for another estimate of the number of docked DVs. If we assume that all DVs approaching the CM as closely actually create such a dimple, the number of such DVs should be determined by the product of DV density and the volume of a shell of 50–100 nm width. With a granule density of 10.84 DVs/μm3 and a cell surface area of 804 μm2, we arrive at a mean number of docked DVs between 635–870. Finally, we analyzed distances between CM and DV boundaries in a way similar to that of Parsons et al. (1995) and Steyer at al. (1997). They describe a distinct preponderance of vesicles approaching the CM <10 nm. We did not see such an effect in agreement with inferences from the histograms of Fig. 7. When we count all DVs approaching the CM <45 nm (a criterion more relaxed than that of Parsons et al. [1995] or Steyer et al. [1997]), we estimate that the number of such DVs per cell cannot be much more than 421.
Thus, our maximum numbers of possibly docked DVs are well between the ∼800 reported by Almers (Parsons et al., 1995) and the ∼450 previously given by Burgoyne (Burgoyne, 1991; Burgoyne et al., 1982). They still, however, exceed values for the immediately releasable vesicle pool derived from surface capacitance increase. Assuming reported vesicle sizes, estimates for the latter varied between 220 (Granja et al., 1996), 270 (Heinemann et al., 1993), or 92 (von Rueden and Neher, 1993; see Gillis and Chow [1997] for a detailed discussion of functional pool sizes). If all of the rapid capacitance increase produced by caged Ca2+ activation were because of DVs, similar numbers would be estimated (Parsons et al., 1995; Oberhauser et al., 1996; yet, see below). These numbers are smaller by a factor of 2–8 than the number of morphologically docked DVs (Parsons et al., 1995; results reported here).
Recently, Steyer et al. (1997) have compared in chromaffin cells the number of docked DVs in electron microscopy micrographs (using similar methods as in the work by Parsons et al. [1995]) with that in viable cells using evanescent wave light microscopy (LM) after acridine orange labeling. In LM analyses they found 0.8 docked DVs per μm2 on that region of the CM which adheres to the support, whereas they calculated 1.7 DVs/μm2 from electron microscopy analyses that, moreover, showed enrichment of DVs in proximity to the CM. Although their electron microscopy data show much larger numbers of docked DVs as compared to our micrographs, our data are fully compatible with their LM analyses in living cells. Another difference between their and our work is the time used for depolarization, i.e., 2 min vs. 10 s, respectively. This may explain the changes in cortical DV density they see after stimulation (Steyer et al., 1997). Another difference is that we have evaluated the whole cell circumference in experiments (a) to (d), rather than selective substrate-attached regions, although these also show cortical exclusion of DVs in our micrographs (Fig. 5).
Despite these differences, all studies thus far conclude that the number of DVs in a possibly release-ready morphological state exceeds that observed as functionally release-ready in electrophysiological experiments. Most probably the latter ones constitute a subset of the former, which is distinct in molecular terms, but not on the level of electron microscopy. This would explain why we do not observe morphological differences for vesicles in different functional states with any of our analysis methods used. Furthermore, we conclude that, given the tight packing of DVs in chromaffin cells, it is much harder to recognize morphological docking as compared to some synaptic terminals, where aggregates lining the membrane at active zones can be clearly discerned (Bommert et al., 1997). In our experience it is not possible to assign reliable numbers to the pool of docked granules in chromaffin cells except for upper bounds. This situation may unfortunately preclude a correlation between morphological changes and functional changes upon interference with components of the SNARE complex, an approach that was very successful in the analysis of synaptic transmission at the squid giant synapse (Augustine et al., 1996).
Would the wall effect, i.e., decreasing DV density at the cell periphery, be compatible with the concept of a peripheral F-actin barrier (Aunis and Bader, 1988; Burgoyne, 1991)? This may hold true for the following reasons: (a) such a barrier would not affect immediate release; (b) increased secretory activity upon F-actin disruption (Vitale et al., 1991; Miyamoto et al., 1993; Roth and Burgoyne, 1995; Zhang et al., 1995) may make accessible additional docking/release sites; and (c) Figs. 1 and 7 could entail the novel implication, however, that F-actin can occupy only the sites not occupied by peripheral DVs.
Such pinholes in the cell cortex might preclude docking of additional DVs under priming conditions, as we found. Instead, priming may cause that, among already docked DVs, additional ones acquire fusion capability. Upon stimulation, ghosts derived from the immediately releasable DV pool would be rapidly removed (Artalejo et al., 1995; Henkel and Almers, 1996) and, according to our findings, rapidly replaced by new DVs. All this would be compatible with data contained in Table I.
Could small vesicles contained in the cell cortex (Unsicker and Chamley, 1987; Thomas-Reetz and DeCamilli, 1994) contribute to any substantial surface area increase if they would fuse upon stimulation (Llona, 1995)? According to Table II, peripheral CVs could add only 3–5% to total surface area, whereas docked DVs could add 18–31% to the CM area, if they would all fuse. This potential contribution by CVs is less than recently suggested (Oberhauser et al., 1996) for the case of flash photolysis of caged Ca, even if all CVs would be released in such an experiment.
Acknowledgments
We thank C. Braun, S. Kolassa, and C. Wolf (Konstanz) as well as F. Frauke and M. Pilot (Göttingen) for skillful technical assistance, J. Hentschel for help with some analyses, and R. Neher for writing simulation programs.
This work was supported by a grant from the Deutsche Forschungsgemeinschaft, (SFB156) to H. Plattner and by a European Union network grant (ERBCHRXCT940500).
Abbreviations used in this paper
[Ca2+]i
intracellular Ca2+ concentration
CC
chromaffin cell
CM
cell membrane
CV
clear vesicle
DV
dense core vesicle or chromaffin granule
LM
light microscopy
RRG
readily releasable granule
TTX
tetrodoxin
Footnotes
A.R. Artalejo's present address is Department of Pharmacology, Universidad Autonoma de Madrid, E-28029 Madrid, Spain.
Address all correspondence to Helmut Plattner, Faculty of Biology, University of Konstanz, D-78434 Konstanz, Germany. Tel.: (49) 7531.88.2228. Fax: (49) 7531.88.2245.
References
- Artalejo CR, Henley JR, McNiven MA, Palfrey HC. Rapid endocytosis coupled to exocytosis in adrenal chromaffin cells involves Ca2+, GTP, and dynamin but not clathrin. Proc Natl Acad Sci USA. 1995;92:8328–8332. doi: 10.1073/pnas.92.18.8328. [DOI] [PMC free article] [PubMed] [Google Scholar]
- Augustine GJ, Burns ME, DeBello WM, Pettit DL, Schweizer FE. Exocytosis: proteins and perturbations. Annu Rev Pharmacol Toxicol. 1996;36:659–701. doi: 10.1146/annurev.pa.36.040196.003303. [DOI] [PubMed] [Google Scholar]
- Aunis D, Bader MF. The cytoskeleton as a barrier to exocytosis in secretory cells. J Exp Biol. 1988;139:253–266. doi: 10.1242/jeb.139.1.253. [DOI] [PubMed] [Google Scholar]
- Bittner MA, Holz RW. Kinetic analysis of secretion from permeabilized adrenal chromaffin cells reveals distinct components. J Biol Chem. 1992;267:16219–16225. [PubMed] [Google Scholar]
- Bommert K, Charlton MP, DeBello WM, Chin GJ, Betz H, Augustine GJ. Inhibition of neurotransmitter release by C2-domain peptides implicates synaptotagmin in exocytosis. Nature. 1997;363:163–165. doi: 10.1038/363163a0. [DOI] [PubMed] [Google Scholar]
- Burgoyne RD. Control of exocytosis in adrenal chromaffin cells. Biochim Biophys Acta. 1991;1071:174–202. doi: 10.1016/0304-4157(91)90024-q. [DOI] [PubMed] [Google Scholar]
- Burgoyne RD, Morgan A. Ca2+and secretory-vesicle dynamics. Trends Neurosci. 1995;18:191–196. doi: 10.1016/0166-2236(95)93900-i. [DOI] [PubMed] [Google Scholar]
- Burgoyne RD, Geisow MJ, Barron J. Dissection of stages in exocytosis in the adrenal chromaffin cells with use of trifluoperazine. Proc R Soc Lond B Biol Sci. 1982;216:111–115. doi: 10.1098/rspb.1982.0064. [DOI] [PubMed] [Google Scholar]
- Calvo S, Granja R, González C, García, Cena V. Catecholamine secretion, calcium levels and calcium influx in response to membrane depolarization in bovine chromaffin cells. Neuroscience. 1995;68:265–272. doi: 10.1016/0306-4522(95)00132-3. [DOI] [PubMed] [Google Scholar]
- Gillis KD, Chow RH. Kinetics of exocytosis in adrenal chromaffin cells. Semin Cell Dev Biol. 1997;8:133–140. doi: 10.1006/scdb.1996.0132. [DOI] [PubMed] [Google Scholar]
- Granja R, Izaguirre V, Calvo S, González-García C, Cena V. Extracellular calcium has distinct effects on fast and slow components of the depolarization-induced secretory response from chromaffin cells. J Neurochem. 1996;67:1056–1062. doi: 10.1046/j.1471-4159.1996.67031056.x. [DOI] [PubMed] [Google Scholar]
- Grynkiewicz G, Poenie M, Tsien RY. A new generation of Ca2+indicators with greatly improved fluorescence properties. J Biol Chem. 1985;260:3440–3450. [PubMed] [Google Scholar]
- Heinemann C, Rueden LV, Chow RH, Neher E. A two-step model of secretion control in neuroendocrine cells. Pflüeg Arch Eur J Physiol. 1993;424:105–113. doi: 10.1007/BF00374600. [DOI] [PubMed] [Google Scholar]
- Henkel AW, Almers W. Fast steps in exocytosis and endocytosis studied by capacitance measurements in endocrine cells. Curr Opin Neurobiol. 1996;6:350–357. doi: 10.1016/s0959-4388(96)80119-x. [DOI] [PubMed] [Google Scholar]
- Horrigan FT, Bookman RJ. Releasable pools and the kinetics of exocytosis in adrenal chromaffin cells. Neuron. 1994;13:1119–1129. doi: 10.1016/0896-6273(94)90050-7. [DOI] [PubMed] [Google Scholar]
- Knoll G, Oebel G, Plattner H. A simple sandwich-cryogen-jet procedure with high cooling rates for cryofixation of biological materials in the native state. Protoplasma. 1982;111:161–176. [Google Scholar]
- Knoll G, Braun C, Plattner H. Quenched flow analysis of exocytosis in Parameciumcells: time course, changes in membrane structure, and calcium requirements revealed after rapid mixing and rapid freezing of intact cells. J Cell Biol. 1991;113:1295–1304. doi: 10.1083/jcb.113.6.1295. [DOI] [PMC free article] [PubMed] [Google Scholar]
- Llona I. Synaptic like microvesicles: do they participate in regulated exocytosis? . Neurochem Int. 1995;27:219–226. doi: 10.1016/0197-0186(95)00005-s. [DOI] [PubMed] [Google Scholar]
- Maupin-Szamier P, Pollard TP. Actin filament destruction by osmium tetroxide. J Cell Biol. 1978;77:837–852. doi: 10.1083/jcb.77.3.837. [DOI] [PMC free article] [PubMed] [Google Scholar]
- Miyamoto S, Funatsu T, Ishiwata S, Fujime S. Changes in mobility of chromaffin granules in actin network with its assembly and Ca2+-dependent disassembly by gelsolin. Biophys J. 1993;64:1139–1149. doi: 10.1016/S0006-3495(93)81480-2. [DOI] [PMC free article] [PubMed] [Google Scholar]
- Morel FMM, Baker RF, Wayland H. Quantitation of human red blood cell fixation by glutaraldehyde. J Cell Biol. 1971;48:91–100. doi: 10.1083/jcb.48.1.91. [DOI] [PMC free article] [PubMed] [Google Scholar]
- Neher, E. 1989. Combined fura-2 and patch-clamp measurements in rat peritoneal mast cells. In Neuromuscular Junction. L.C. Sellin, R. Libelius, and S. Thesleff, editors. Elsevier Publ. Comp., Amsterdam, The Netherlands. pp. 65–76.
- Oberhauser AF, Robinson IM, Fernandez JM. Simultaneous capacitance and amperometric measurements of exocytosis: a comparison. Biophys J. 1996;71:1131–1139. doi: 10.1016/S0006-3495(96)79315-3. [DOI] [PMC free article] [PubMed] [Google Scholar]
- Ornberg RL, Furuya S, Goping G, Kuijpers GAJ. Granule swelling in stimulated bovine adrenal chromaffin cells: regulation by internal granule pH . Cell Tissue Res. 1995;279:85–92. doi: 10.1007/BF00300694. [DOI] [PubMed] [Google Scholar]
- Parsons TD, Coorssen JR, Horstmann H, Almers W. Docked granules, the exocytic burst, and the need for ATP hydrolysis in endocrine cells. Neuron. 1995;15:1085–1096. doi: 10.1016/0896-6273(95)90097-7. [DOI] [PubMed] [Google Scholar]
- Plattner H. Quantitative correlation of structure and function on biomembranes. Prog Histochem Cytochem. 1973;5:1–37. [PubMed] [Google Scholar]
- Plattner H, Bachmann L. Cryofixation: a tool in biological ultrastructural research. Int Rev Cytol. 1982;79:237–304. doi: 10.1016/s0074-7696(08)61676-9. [DOI] [PubMed] [Google Scholar]
- Plattner, H., and H.P. Zingsheim. 1983. Electron microscopic methods in cellular and molecular biology. In Subcellular Biochemistry. Vol. IX. D.B. Roodyn, editor. Plenum Press, New York. pp. 1–236. [DOI] [PubMed]
- Plattner, H., and G. Knoll. 1984. Cryofixation of biological materials for electron microscopy by the methods of spray-, sandwich-, cryogen-jet and sandwich-croygen-jet-freezing: a comparison of techniques. In The Science of Biological Specimen Preparation for Microscopy and Microanalysis. J.P. Revel, T. Barnard, and G.H. Haggis, editors. Scanning Electron Microscopy Inc., AMF O'Hare, IL. pp. 139–146.
- Pscheid P, Schudt C, Plattner H. Cryofixation of monolayer cell cultures for freeze-fracturing without chemical pre-treatments. J Microscopy (Oxford) 1981;121:149–167. doi: 10.1111/j.1365-2818.1981.tb01208.x. [DOI] [PubMed] [Google Scholar]
- Roth D, Burgoyne RD. Stimulation of catecholamine secretion from adrenal chromaffin cells by 14-3-3 proteins is due to reorganisation of the cortical actin network. FEBS (Fed Eur Biochem Soc) Lett. 1995;374:77–81. doi: 10.1016/0014-5793(95)01080-x. [DOI] [PubMed] [Google Scholar]
- Schmidt W, Patzak A, Lingg G, Winkler H, Plattner H. Membrane events in adrenal chromaffin cells during exocytosis: A freeze-etching analysis after rapid cryofixation. Eur J Cell Biol. 1983;32:31–37. [PubMed] [Google Scholar]
- Steyer JA, Horstmann H, Almers W. Transport, docking and exocytosis of single secretory granules in live chromaffin cells. Nature. 1997;388:474–478. doi: 10.1038/41329. [DOI] [PubMed] [Google Scholar]
- Südhof TC. The synaptic vesicle cycle: a cascade of protein-protein interactions. Nature. 1995;375:645–653. doi: 10.1038/375645a0. [DOI] [PubMed] [Google Scholar]
- Thomas-Reetz AC, DeCamilli P. A role for synaptic vesicles in non-neuronal cells: clues from pancreatic β cells and from chromaffin cells. FASEB J. 1994;8:209–216. doi: 10.1096/fasebj.8.2.7907072. [DOI] [PubMed] [Google Scholar]
- Unsicker K, Chamley JH. Growth characteristics of postnatal rat adrenal medulla in culture. Cell Tissue Res. 1987;177:247–268. doi: 10.1007/BF00221086. [DOI] [PubMed] [Google Scholar]
- Van Harreveld A, Crowell J, Malhotra KS. A study of extracellular space in central nervous tissue by freeze-substitution. J Cell Biol. 1965;25:117–137. doi: 10.1083/jcb.25.1.117. [DOI] [PMC free article] [PubMed] [Google Scholar]
- Vitale ML, Rodríguez del Castillo A, Tchakarov L, Trifaró JM. Cortical filamentous actin disassembly and scinderin redistribution during chromaffin cell stimulation precede exocytosis, a phenomenon not exhibited by gelsolin. J Cell Biol. 1991;113:1057–1067. doi: 10.1083/jcb.113.5.1057. [DOI] [PMC free article] [PubMed] [Google Scholar]
- Vitale ML, Seward EP, Trifaró JM. Chromaffin cell cortical actin network dynamics control the size of the release-ready vesicle pool and the initial rate of exocytosis. Neuron. 1995;14:353–363. doi: 10.1016/0896-6273(95)90291-0. [DOI] [PubMed] [Google Scholar]
- von Rueden L, Neher E. A Ca-dependent early step in the release of catecholamines from adrenal chromaffin cells. Science. 1993;262:1061–1065. doi: 10.1126/science.8235626. [DOI] [PubMed] [Google Scholar]
- Weibel ER, Gonzague SK, Scherle WF. Practical stereological methods for morphometric cytology. J Cell Biol. 1966;30:23–38. doi: 10.1083/jcb.30.1.23. [DOI] [PMC free article] [PubMed] [Google Scholar]
- Wollweber L, Stracke R, Gothe U. The use of a simple method to avoid cell shrinkage during SEM preparation. J Microscopy. 1981;121:185–189. doi: 10.1111/j.1365-2818.1981.tb01211.x. [DOI] [PubMed] [Google Scholar]
- Zhang L, Rodríguez del Castillo A, Trifaró JM. Histamine-evoked chromaffin cell scinderin redistribution, F-actin disassembly and secretion: in the absence of cortical F-actin disassembly, an increase in intracellular Ca2+fails to trigger exocytosis. J Neurochem. 1995;65:1297–1308. doi: 10.1046/j.1471-4159.1995.65031297.x. [DOI] [PubMed] [Google Scholar]
- Zhou Z, Neher E. Mobile and immobile calcium buffers in bovine adrenal chromaffin cells. J Physiol (Lond) 1993;469:245–273. doi: 10.1113/jphysiol.1993.sp019813. [DOI] [PMC free article] [PubMed] [Google Scholar]
- Zierold K. Electron probe microanalysis of cryosections from cell suspensions. Methods Microbiol. 1988;20:91–111. [Google Scholar]
- Zierold K, Schäfer D, Pietruschka F. The element distribution in ultrathin cryosections of cultivated fibroblast cells. Histochemistry. 1984;80:333–337. doi: 10.1007/BF00495413. [DOI] [PubMed] [Google Scholar]