Processing of Endogenous Pre-mRNAs in Association with SC-35 Domains Is Gene Specific (original) (raw)
Abstract
Analysis of six endogenous pre-mRNAs demonstrates that localization at the periphery or within splicing factor-rich (SC-35) domains is not restricted to a few unusually abundant pre-mRNAs, but is apparently a more common paradigm of many protein-coding genes. Different genes are preferentially transcribed and their RNAs processed in different compartments relative to SC-35 domains. These differences do not simply correlate with the complexity, nuclear abundance, or position within overall nuclear space. The distribution of spliceosome assembly factor SC-35 did not simply mirror the distribution of individual pre-mRNAs, but rather suggested that individual domains contain both specific pre-mRNA(s) as well as excess splicing factors. This is consistent with a multifunctional compartment, to which some gene loci and their RNAs have access and others do not. Despite similar molar abundance in muscle fiber nuclei, nascent transcript “trees” of highly complex dystrophin RNA are cotranscriptionally spliced outside of SC-35 domains, whereas posttranscriptional “tracks” of more mature myosin heavy chain transcripts overlap domains. Further analyses supported that endogenous pre-mRNAs exhibit distinct structural organization that may reflect not only the expression and complexity of the gene, but also constraints of its chromosomal context and kinetics of its RNA metabolism.
Keywords: cultured cells, cell nucleus, RNA splicing, muscle, fluorescence in situ hybridization
Analysis of spatial relationships between specific genes, their nuclear RNAs, and defined intranuclear compartments may reveal new principles governing the integration of the genome and RNA metabolism with nuclear structure. In its functional state the genome is not a linear entity, but a major component of three-dimensional nuclear structure, the complexities and dynamics of which we are just beginning to understand. It has long been speculated that the nucleus may exhibit a higher level organization in keeping with the structure– function relationships of cellular organelles and cytological observations of differences in chromatin distribution in specific cell types (Comings, 1968; Manuelidis, 1984; Blobel, 1985; Hochstrasser et al., 1986; Marshall et al., 1997). However, the distribution of individual genes, and in particular the relationship to pre-mRNA metabolism, remains a largely unresolved subject of long-standing interest and debate.
Here we use the postmitotic multinucleated skeletal muscle fiber as a model system to address whether nuclear RNAs transcribed from two coordinately regulated genes spatially associate or occupy fixed positions within overall nuclear space. However, distribution within total nuclear volume is only one potential parameter of nuclear architecture; recent results lead to a more fundamental question concerning the spatial arrangement of sequences relative to defined intranuclear compartments.
As discussed previously (Carter et al., 1991; Lawrence et al., 1993), the clustering of rRNA genes in the nucleolus (for review see Scheer et al., 1993) establishes the precedent that loci from 10 human chromosomes can spatially associate to form a distinct structure devoted to metabolism of that RNA. It is now recognized that at least several other nonnucleolar compartments exist, characterized by marked enrichment for different sets of RNA metabolic factors (for review see Moen et al., 1995). A key to understanding the function(s) of such compartments is determining the extent to which different genes/RNAs associate with them.
Of particular interest is a compartment enriched in pre-mRNA metabolic components and poly A RNA, identified here using fluorescence antibodies raised against spliceosome assembly factor SC-35 (Fu and Maniatis, 1990). The term SC-35 domains is used to indicate the 20–40 large (0.5–3.0 μ) domains, as distinct from smaller entities and coiled bodies which are also part of the small nuclear ribonucleoprotein (snRNP)1 speckled pattern. SC-35 domains are also highly enriched with numerous splicing factors (Nyman et al., 1986; Spector et al., 1991; Blencowe et al., 1994), poly A RNA (Carter et al., 1991; Visa et al., 1993), a subset of poly (A) polymerase (Schul et al., 1998), a putative RNA helicase (Gee et al., 1997), and a hyperphosphorylated form of RNA polymerase II (Bregman et al., 1995). Despite the concentration of these factors, uridine labeling is generally not detected in these regions. This has contributed to the impression that SC-35 domains are storage sites from which pre-mRNA is excluded and that RNA metabolism is dispersed randomly through the remainder of the nucleoplasm (for reviews see Fakan and Puvion, 1980; Jackson et al., 1993; Wansink et al., 1993).
A hypothesis investigated here is that specific gene transcription and splicing are not randomly distributed in the interdomain compartment, and that a substantial amount of specific pre-mRNA metabolism is associated with these factor-rich domains. Although poly A RNA and splicing factors are clearly present throughout the nucleoplasm (Carter et al., 1991), statistical analysis of several loci in the same cell type has demonstrated the precedent for nonrandom distribution of DNA sequences relative to these domains (Xing et al., 1993, 1995). Three inactive loci showed low level association (∼10–20%) in keeping with a random distribution, whereas the three active genes/ pre-mRNAs showed a high preferential association (∼70– 99%), suggesting a functional interaction between some expressed genes and these domains. Similarly, nuclear transcripts for c-fos were observed proximal to Sm speckles (Huang et al., 1991). These observations make the important point that gene distributions are not random, and that specific pre-mRNAs can indeed be associated with the splicing factor/poly A RNA–rich domains (Xing et al., 1993, 1995). Although the expressed genes studied all showed high levels of association, only three active genes representing abundant structural proteins were quantitatively examined and compared in this way. Based on various considerations, we suggested that association with splicing factor-rich domains was not a property of all spliced pre-mRNAs, but may involve a major subset representing a substantial amount of the cell's mRNA metabolism (Xing et al., 1993, 1995; Lawrence et al., 1993; Clemson et al., 1996). Data supporting these hypotheses are presented for the first time here.
Two studies that have introduced exogenous RNAs into the nucleus either by microinjection (Wang et al., 1991) or transfection (Huang and Spector, 1996) have reported that the presence of a single intron is both necessary and sufficient for complete colocalization of exogenous RNAs and splicing factor speckles. The simplest interpretation, consistent with the colocalization of snRNPs and poly A RNA, is that the distribution of splicing factors reflects that of individual pre-mRNA splicing, with no spatial organization of genes, factors, or pre-mRNA metabolism. However, results presented here indicate that the distribution of factors does not simply mirror that of individual pre-mRNAs, in agreement with uridine labeling studies.
One way to reconcile the disparate findings of specific pre-mRNA or transfectant RNA in domains with their apparent lack of newly synthesized RNA is to propose that there are two different types of factor-rich domains: most are purely storage (electron microscopic interchromatin granule clusters), but some are purely splicing, formed by factors actively engaged on nascent transcripts (large masses of perichromatin fibrils). In this view, inert factors are actively recruited from storage domains to distant sites of transcription (Huang and Spector, 1996), which may have no specific spatial relationship to the storage site. An alternative hypothesis is that individual domains contain both specific pre-mRNAs and a disproportionately large accumulation of splicing factors, beyond those actively engaged in splicing transcripts of a single gene (Xing et al., 1993, 1995; Clemson and Lawrence, 1996). Several observations led to the hypothesis that individual domains are subcompartmentalized, with transcription and splicing of specific RNAs at the periphery and other processes related to splicing complex assembly and RNA transport in the interior of the domain (Lawrence et al., 1993; Xing et al., 1993, 1995). Consistent with this, staining for the assembly factor SC-35 was found to define a slightly smaller domain within the larger snRNP/poly A RNA–rich speckle (Carter et al., 1993; Xing et al., 1993, 1995).
Irrespective of whether RNAs enter domains after transcription, a key question concerns whether active genes are differentially localized, with differential access to putative reservoirs of RNA metabolic factors. This question cannot be addressed by studies of exogenous sequences, because transfected or viral sequences are free of long-range chromosomal context, and are often present and expressed at levels far beyond physiological expression of even a highly active single gene. Because gene expression normally occurs within the constraints of chromosome structure, it is essential to investigate directly endogenous sequences that retain their native chromosomal context with all the incumbent complexities that influence their spatial arrangement, and potentially their expression. Through analysis of six active genes/pre-mRNAs (genes and their RNA foci), this work provides evidence that preferential localization with domains is a common, locus-specific feature of active protein coding genes, not restricted to genes for a few highly abundant structural proteins. Importantly, results demonstrate that this association with factor-rich domains is not a property of all active genes producing substantial accumulations of spliced pre-mRNA. We demonstrate for the first time that pre-mRNAs are localized in a gene specific manner in one of two nuclear compartments that differ markedly in their immediate proximity to these concentrations of metabolic factors.
This work emphasizes analysis of the intranuclear distribution of the muscle-specific RNAs β-cardiac myosin heavy chain (MyHC) and dystrophin, which were found to exhibit a marked difference in their compartmentalization relative to SC-35–defined domains. In situ analysis of the dystrophin gene and its pre-mRNA were of particular interest for several reasons. To date, studies demonstrating detection of specific nuclear RNAs from endogenous genes have been for highly abundant cytoplasmic transcripts. Although human dystrophin mRNA has been estimated to represent less than 0.01% of cytoplasmic mRNA present in adult skeletal muscle (Hoffman et al., 1987; Chelly et al., 1990), it remained to be determined if cytoplasmic abundance would closely correlate with abundance at the transcription site. We show here that the precursor of an extremely low abundance cytoplasmic mRNA such as dystrophin can be much more readily detected in the nucleus by fluorescence in situ hybridization, due to a substantial molar accumulation of transcripts at the site of transcription and processing. Further analyses with probes from different parts of the dystrophin gene demonstrate that an exceptionally high-resolution visualization of processing events along this gene is possible by fluorescence hybridization. Since the dystrophin gene is over 50-fold larger than the MyHC gene, a comparison of their nuclear RNAs helps address whether the localized accumulation of a nuclear RNA simply represents a tree of nascent transcripts on the gene, or a vectorial track of full-length transcripts in transit from the gene (Lawrence et al., 1989) as has been shown for collagen and fibronectin RNAs (Xing et al., 1993, 1995). Furthermore, we demonstrate that nuclear RNA accumulations for different genes cannot be assumed to represent equivalent functional entities, but may instead reflect different rate-limiting steps in nuclear RNA metabolism for different genes. The differences in rate-limiting steps that result in dystrophin RNA trees and MyHC RNA tracks may contribute to their differential compartmentalization relative to SC-35 domains.
Materials and Methods
Cells and Cell Culture
Two strains of normal human diploid myoblasts, both of satellite cell origin, were used in these studies. The strain designated 077 was a gift from R. Brown (Massachusetts General Hospital, Charlestown, MA) and was derived from skeletal muscle tissue from a 43-yr-old female with no known muscle pathologies. Myoblast strain 50Mb-1 denotes myoblast preparations flow-sorted to substantially remove contaminating fibroblasts (Webster et al., 1988). They were obtained from the vastus lateralis muscle of a 10-yr-old male. 50Mb-1 myoblasts were kindly provided by H. Blau (Stanford University, Palo Alto, CA). For both myoblast preparations, cells were seeded onto coverslips that had been treated by boiling in 0.1 N HCl, rinsed, and then autoclaved in 0.5% gelatin (Sigma). For propagation, cells were cultured at subconfluent density in serum-rich medium (see below), with medium changes every other day. To induce muscle differentiation, cultures were grown to near confluence and then maintained in low-serum medium (see below) without further medium changes until the appearance of myotubes. For 077 cells, serum-rich growth medium was low-glucose Dulbecco's modified Eagle's medium (DME-low) containing 20% fetal bovine serum (FBS; Hyclone). Low-serum differentiation medium was DME-low with 10% FBS or horse serum (HS; Hyclone Labs). Both contained 10 mg/ml gentamycin. For strain 50Mb-1, propagation medium was Ham's F-10 supplemented with 20% FCS and 1% vol/ vol chick embryo extract (60 Å ultrafiltrate, GIBCO-BRL), whereas differentiation medium contained DME-low, 2% HS, 1 mM insulin, and 1 mM dexamethasone (Sigma). Both contained 100 U/ml penicillin and 100 μg/ml streptomycin. The human diploid fibroblasts WI-38 (American Type Culture Collection) were grown in high-glucose DME supplemented with 10% FBS and gentamycin.
Probes and Antibody Reagents
Cardiac Myosin Heavy Chain Probes.
Detection of RNA from the β-cardiac myosin heavy chain gene (cMyHC), was performed using clone p8-1A, obtained from L. Leinwand, (University of Colorado, Boulder, CO) or HM-1, a ∼32 kb β-cMyHC specific genomic probe obtained from C.-C. Liew (University of Toronto, Ontario, Canada) (Yamauchi-Takihara et al., 1989). p8-1A contains a 12.3-kb insert corresponding to a region of the cluster beginning in the intergenic spacer and continuing into the 5′ region of the α-cMyHC gene (Leinwand et al., 1983). The linked α-cMyHC and β-cMyHC genes are highly homologous (Saez et al., 1987), but only the β-cMyHC gene is active in cultured skeletal muscle (Hughes et al., 1993). Signals detected with the HM-1 and p8-1A probes completely colocalized in DNA and RNA detection protocols, indicating that both probes were detecting the β-cMyHC RNA.
Dystrophin Probes.
The approximate positions of the dystrophin probes are presented in Fig. 5 A. The designations and probe descriptions are as follows: (a) mid-genomic, a probe specific for the portion of the dystrophin gene surrounding exon 44, (15lDMD), obtained from C.T. Caskey (Baylor College of Medicine, Houston, TX). It contains a 16-kb insert corresponding to a portions of intron 43, exon 44 (147 bp), and intron 44. This probe is >99% intron sequences. (b) 5′ Genomic, dystrophin clone 24A2, contains a 10-kb genomic sequence from the 5′ region of the gene. (c) 5′ cDNA, DMD13 (exons 1–11, ∼1.67 kb). (d) mid-cDNA, DMD10 (exons 17–27, ∼2.8 kb), the 5′ genomic and cDNA probes were provided by L. Kunkel (Harvard School of Medicine, Boston, MA).
Figure 5.
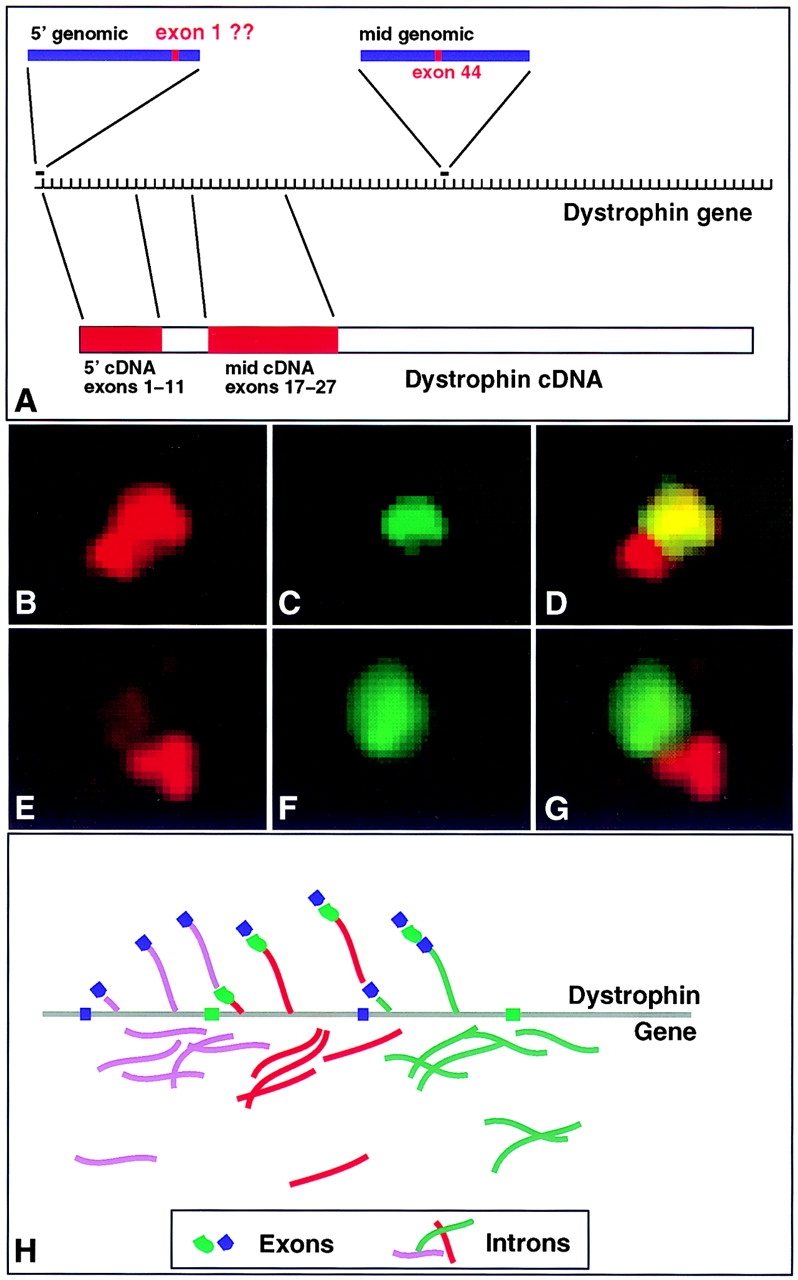
Structure of the dystrophin RNA track. (A) Map of relative positions of dystrophin probes. All distances are approximations due to the lack of a detailed map of the entire dystrophin gene locus. The dystrophin gene is represented by equally spaced hash marks that represent exons. The variability of intron sizes is not represented here. Positions of the two genomic and two cDNA probes relative to the dystrophin gene and mRNA are shown. (B–D) 5′ cDNA sequences overlap more 3′ sequences. 5′ cDNA signal (B, red) runs into and overlaps the mid cDNA signal (C, green) as seen in the combined photo (D), indicating that 5′ sequences are transcribed first and carried along as midgene exons are transcribed. (E–G) RNA sequences seen with 5′ intron sequences do not overlap more 3′ intron sequences. 5′ genomic sequences (E, red) do not overlap midgene genomic sequences (F, green) as shown in the combined photo (G). Both probes are almost entirely intron sequences. Only minute amounts of 5′ sequences can be seen overlapping the midgene RNA signal. Separation suggests that the intron sequences are cleaved out of the transcribing RNA. (H) Model of cotranscriptional processing of dystrophin RNA. As RNA is transcribed along the gene, introns are spliced out, whereas the spliced exons move down the gene. So the intron foci would appear spatially separate and the 5′ and midgene exon tracks would overlap.
Genomic clones (16–20 kb) of lamin A/C (LA6), lamin B1 (LMB-B), and lamin B receptor (LBR) were provided by H. Worman (Columbia University, New York, NY). The genomic clone of E2F4 (λ10-1, 15 kb) was obtained from D. Livingston (Harvard School of Medicine, Boston, MA).
Antibody.
A mouse monoclonal antibody reactive against the arg-ser spliceosome assembly protein SC-35 (Fu and Maniatis, 1990) was generously supplied by X.-D. Fu (University of California, San Diego, CA).
In Situ Hybridization
To be successful in detecting nuclear sequences within the relatively dense structure of the myotube, it was necessary to develop a protocol that both reduced background resulting from the thick cytoplasm and increased penetrability of the nucleus. Hence, the methods for detecting nuclear RNA within the myotube are distinct from those optimized for the detection of cytoplasmic RNA. The methods used here, including procedures for nonisotopic probe preparation and fluorescence in situ hybridization, have been published in detail (Carter et al., 1991; Johnson et al., 1991). Two-color detection of RNA and genes simultaneously was done by sequential hybridization and detection of RNA, followed by fixation, RNase incubation, and DNA hybridization (Xing et al., 1995). In some experiments, after hybridization samples were reacted with monoclonal antibodies raised against the spliceosome assembly factor SC-35 (Fu and Maniatis, 1990), as described previously (Xing et al., 1993, 1995).
Microscopy and Analysis
A Zeiss Axioplan microscope equipped with a multiband-pass epifluorescence filter (Chroma) was used for analysis. Images were analyzed by direct analysis of cells through the microscope and by representative images captured with a Photometrics series 200 charge-coupled device camera using a high-resolution, low depth of field objective (100×, NA = 1.4) (Zeiss). For two-color samples, image shifts were avoided by the use of a filter wheel in conjunction with multiband pass filters. All scoring was done by at least two investigators.
Results
As illustrated in Fig. 1 (top), MyHC and dystrophin nuclear RNAs were simultaneously visualized in postmitotic nuclei of cultured skeletal myofibers using fluorescence hybridization techniques optimized for detection of nuclear RNA. Initial experiments used genomic probes that targeted sequences of similar size, thereby facilitating comparison of the signals. Although in situ hybridization does not provide information on the rate of transcript production, it can provide reliable comparisons of the relative amounts of RNA present at a given time. Most often there were two striking accumulations of MyHC RNA and one for dystrophin, as expected for expression of both alleles of the autosomal MyHC gene and one allele of the X-linked dystrophin gene in female cells. Perhaps less anticipated was that both the dimensions and intensity of the dystrophin and MyHC nuclear RNA accumulations were comparable, as illustrated in Fig. 1 (right). Although dystrophin RNA is a less abundant cytoplasmic mRNA than MyHC (Hoffman et al., 1987; Chelly et al., 1990), and the probes used detect <1% of the dystrophin sequence versus ∼80% of MyHC, dystrophin nuclear RNA signal was similar to the MyHC RNA signal. This was seen in multiple experiments irrespective of the detection method used and even when the MyHC probe targeted a somewhat larger sequence than the dystrophin probe (32 versus 16 kb). Hence, the apparent nuclear abundance of the dystrophin RNA signal does not result from the extremely large size of the full dystrophin RNA. Rather, these results indicate a roughly comparable number of transcripts associated with each MyHC and dystrophin allele.
Figure 1.

Detection of MyHC and dystrophin RNA foci in myotube nuclei (left). Nuclei of a myotube show variable positions of MyHC and dystrophin RNA foci. Most nuclei have two MyHC signals (green) and a single dystrophin signal (red). The image illustrates the developmental stage-specific expression of MyHC and dystrophin. A single myoblast nucleus (left, bottom left) outside of the myotube has neither MyHC nor dystrophin RNA foci. The myotube cytoplasm is visualized by the presence of cytoplasmic MyHC mRNA (green). (Right) Two myotube nuclei demonstrate that the RNA foci detected by a MyHC genomic probe (32 kb, green) and a dystrophin midgene genomic probe (16 kb, red) are of comparable size and intensity. This suggests that there is roughly similar molar abundance of each RNA in these foci.
These results show that cytoplasmic abundance does not necessarily correlate with nuclear abundance, as many factors will influence the number of transcripts associated with a gene. Since the dystrophin gene is over 50-fold larger than the MyHC gene, ∼50-fold more dystrophin transcripts would have to be in production at any given moment to achieve a given rate of completion. Other factors that will affect the amount of RNA accumulated in the nucleus are the RNA stability, transcription initiation rate, and potentially other rate-limiting steps in processing and transport. For most genes, immature nuclear transcripts comprise a small, often undetectable fraction of total cellular levels. The conclusion of in situ results presented here, that the molar accumulation of dystrophin nuclear pre-mRNA is large relative to its cytoplasmic abundance, is supported by the work of Tennyson et al. (1996), who reported that nascent nuclear dystrophin transcripts are more abundant than mature transcripts in the whole cell, in a molar ratio of ∼2.5:1.
If MyHC and dystrophin nuclear RNA accumulations exclusively reflect nascent transcripts on their genes, then it would be difficult to explain why the enormous difference in gene length did not result in a significant difference in the dimensions of their nuclear RNA accumulations. As addressed further below, localized concentrations of a specific RNA may also reflect other rate-limiting steps in the progression of transcripts from the gene to the cytoplasm.
Association of RNA Foci with SC-35–defined Domains
To determine the distribution of MyHC and dystrophin nuclear RNA foci relative to SC-35 domains, cultures containing myotubes were probed for either MyHC or dystrophin nuclear transcripts and subsequently stained with antibodies against the spliceosome assembly factor SC-35 (Fig. 2, A–F). Using a very narrow depth of field objective (NA = 1.4) and focusing through the RNA and SC-35 signals, it was apparent if these signals occupied the same space. In essentially all of the 50 cells analyzed, the MyHC RNA foci colocalized with a prominent SC-35 domain (Fig. 2, A–C and Fig. 3). Most commonly, the MyHC RNA accumulation detected with the genomic probe did not fill the entire ∼1–3-μ domain and had a different contour. Unlike nuclear accumulations of fibronectin and actin mRNAs which localized to the domain periphery (Xing et al., 1993, 1995), the MyHC RNA was also clearly detected within the inner region of the domain, as previously shown for collagen 1α1 RNA. The accumulation of MyHC RNA within SC-35 domains provides further evidence for the presence of pre-mRNA in these regions, contrary to the expectation that large factor-rich domains are storage sites, but consistent with the uniform presence of poly A RNA in them (Carter et al., 1991). These results also suggest that MyHC transcription and splicing is associated with the SC-35 domain, as directly demonstrated for fibronectin (Xing et al., 1993) and collagen 1α1 RNA (Xing et al., 1995). In contrast to the similarity in size and appearance of their nuclear RNA accumulations, MyHC and dystrophin RNA showed completely different distributions relative to the SC-35 domains. The dystrophin RNA accumulations were never within the domains, whereas the MyHC RNA foci consistently were. In fact, as illustrated in Fig. 2, D–F, with the exception of a small fraction of cells, there was no discernible increase in SC-35 concentration coincident with the large, bright dystrophin RNA accumulation. Since the linear dimensions of this enormous gene can extend 1–2 μ or more at interphase (Lawrence et al., 1990), this analysis was repeated with cDNA and genomic probes to different regions of the primary transcript. These results confirmed that no part of the dystrophin RNA focus was preferentially associated with SC-35 domains (Fig. 3). At most, the edge of the dystrophin RNA accumulation occasionally appeared to touch an SC-35 domain, but the body of the RNA accumulation did not ever closely associate with domains (Fig. 2, D–F and Fig. 3).
Figure 2.

Compartmentaliza- tion of MyHC and dystrophin RNAs. (A–C) MyHC RNA localizes within SC-35 domains. (A) Nuclei showing MyHC RNA foci (red, overlap appears yellow, marked by arrows) and domains enriched in the splicing assembly factor SC-35 (green). (B) Enlargement of a region showing only the SC-35 domains (green). (C) Combined red and green shows MyHC RNA in SC-35 domains. Overlaps appear yellow. (D–F) Dystrophin RNA does not localize to SC-35 domains. (D) Nuclei showing dystrophin RNA foci detected with a 5′ cDNA probe (red, marked by arrows) and domains enriched in the splicing assembly factor SC-35 (green). (E) Enlargement of a region showing only the SC-35 domains (green). (F) Double-label image indicates no overlap of dystrophin RNA (red) and SC-35 domains. (G–I) Dystrophin and MyHC RNAs do not overlap. (G) MyHC RNA focus (green). (H) Dystrophin RNA detected with a 5′ cDNA probe (red). (I) Combined red and green shows that two RNA foci in proximity to each other do not overlap.
Figure 3.

Frequency of association of muscle-specific RNAs with SC-35 defined domains. MyHC and dystrophin RNA signals were scored as coincident with, or completely separate from SC-35 domains. Three different dystrophin probes, midgenomic, mid-cDNA, and 5′ cDNA were used. At least two investigators scored each experiment. N = number of signals scored.
The diametrically opposed relationship of MyHC and dystrophin RNAs to SC-35 demonstrates for the first time that the association between RNA polymerase II (pol II) gene transcripts and SC-35 domains is specific to some, but not all, active intron containing genes. Dystrophin now provides a precedent for RNA from an actively transcribed and spliced protein-coding gene that consistently is excluded from SC-35 domains. Association does not appear to correlate simply with the complexity or concentration of transcripts. Although dystrophin is an extremely complex gene associated with a relatively large accumulation of nuclear transcripts of similar molar abundance to MyHC, unlike MyHC dystrophin shows no association with discrete accumulations of SC-35. These results suggest the possibility that dystrophin and MyHC RNA accumulations reside in different structural compartments of the nucleus.
Overall Spatial Relationship of Dystrophin and MyHC RNAs
The demonstration of distinct gene distributions relative to SC-35 domains (Xing et al., 1995 and this article), coupled with the specific three-dimensional topography of the domains themselves (Carter et al., 1993), raises the question of whether patterns of overall nuclear position exist. In human fibroblasts and myoblasts, SC-35 domains are excluded from the nuclear periphery rich in heterochromatin and are further confined to a plane in the ventral half of the nuclear volume (Carter et al., 1991, 1993). If a given gene or chromosome is constrained to a subregion within nuclear space, as has been recently reported in Drosophila (Marshall et al., 1997), the distribution relative to SC-35 domains could be a coincidental result of the gross overall positioning rather than a specific relationship to SC-35.
The relative positions of MyHC and dystrophin RNA foci were examined to determine whether any association or pattern of spatial arrangement was apparent for these coordinately expressed sequences within reiterated myofiber nuclei. Cultured myofibers most often do not have well-aligned nuclei, hence, for part of our analysis we attempted to focus on nuclei arrayed in single file and apparently aligned relative to the linear axis of the myotube. Cells were probed for MyHC and dystrophin RNA simultaneously, and the relative positions of signals in 51 nuclei from 15 different 077 myotubes were recorded on drawings as represented in Fig. 4. The three nuclear RNA accumulations (two MyHC and one dystrophin) showed highly variable locations relative to one another. Since sometimes only one MyHC RNA focus was detected, we cannot rule out the possibility that the two MyHC alleles associate in a minority of cells. Within the limits of our analysis, neither nuclear RNA accumulation showed precise coordinates or had a clearly preferred pattern of distribution. Although the dystrophin RNA focus tended to be slightly more peripheral than MyHC (data not shown), neither RNA showed the marked peripheral location commonly seen for inactive neurotensin and albumin genes (Xing et al., 1995). Dystrophin RNA was clearly not confined to the peripheral region, from which SC-35 domains are excluded in these cells (Carter et al., 1993).
Figure 4.

Dystrophin and MyHC RNA signal positions in reiterated myotube nuclei. Three examples of the diagrams used to analyze 51 nuclei in 15 separate myotubes are shown. Myotubes were from female 077 myoblasts. M, MyHC RNA; D, dystrophin RNA. Only one dystrophin RNA track is seen in each nucleus due to inactivation of one X chromosome. Relative positions of the RNA signals were found to be quite different among nuclei of a common myotube.
An interesting aspect of the spatial arrangement of dystrophin RNA is most apparent in considering its distribution relative to SC-35 domains (Fig. 2, D–F). As viewed in two dimensions, the dystrophin RNA accumulation was positioned between the SC-35 domains, in the interdomain compartment, rather than in the upper half of nuclear volume largely devoid of SC-35 domains (Carter et al., 1993). Dystrophin RNA was not observed above or below any of the 20–40 prominent SC-35 domains, but rather appeared to distribute within the same Z-axis plane as the domains (Carter et al., 1993). Hence, dystrophin and MyHC are distributed in the same nuclear plane, and in a small fraction of nuclei (∼6%) could even be found adjacent to one another. However, even when they were abutting, the two RNA accumulations remained as separate entities and did not intermingle (Fig. 2, G–I). In contrast, we have observed other RNAs which do intermingle (Shopland, L., and C. Johnson et al., unpublished data). Similarly, even when dystrophin RNA was adjacent to an SC-35 domain, the concentration of factors did not extend over the dystrophin RNA. These observations show that dystrophin and MyHC RNA accumulations behave as separate structural entities, consistent with their residing in distinct nuclear compartments.
Our results show that the difference in distribution relative to SC-35 domains is not a coincidental result of a fixed position within a narrow nuclear region. These results also indicate that these coordinately expressed genes are not specifically positioned relative to one another, but do not rule out positional differences at a more refined level. Finally, we note that cultured muscle fibers remain physiologically immature, thus it remains possible that within the more structured architecture of in vivo tissues a greater topographic organization of individual active genes exists. However, such organization is clearly not necessary for either viability or differentiation in vitro.
Visualization of Cotranscriptional Splicing within the Dystrophin RNA Accumulation
The finding that the large dystrophin RNA accumulation exists outside of SC-35 domains suggests that sufficient splicing factors are present in the interdomain space for processing of a substantial accumulation of transcripts from a gene containing 79 exons. To evaluate directly whether the RNA accumulation detected was indeed undergoing splicing, we used simultaneous hybridization of probes for different sequences within the gene. As previously indicated (Xing et al., 1993), for typical genes the size of actin (6 kb) or even fibronectin (70 kb) it has not been possible by fluorescence microscopy to demonstrate cotranscriptional splicing, since either co- or posttranscriptional events would generally occur below the limits of resolution (0.2 μ). However, the enormous size of the dystrophin gene allowed a level of resolution of splicing events not previously possible by light microscopy. Simultaneous hybridization with genomic and cDNA probes (mapped in Fig. 5 A) was performed to evaluate the relative distribution of transcripts with and without introns, as shown previously (Xing et al., 1993, 1995). Because of the size of the gene, the analysis included different combinations of probes from the 5′ and midgene regions.
From the examination of different combinations of probes in numerous cells, key patterns emerged. Results from hybridization of cDNA probes suggested that the 5′and 3′ ends of the RNA accumulation could be discriminated. For example, using 5′ cDNA (exons 1–11) and mid-cDNA (exons 17–27) probes, reproducible structural features of the dystrophin RNA focus were visualized. The 5′ probe detected an elongated focus of RNA which was larger than and completely overlapped the mid cDNA focus (Fig. 5, B–D). Signals from the more 3′ cDNA probe consistently overlapped one end of the RNA accumulation detected by the 5′ probe, consistent with the 5′ sequences being transcribed first and carried down the length of the gene to where the 3′ sequences were transcribed. This pattern was independent of the labeling method used.
Using a 5′ intron probe (genomic probe which detects 99% intron sequence encompassing exon 1) and a midgene intron probe (genomic probe encompassing introns 43 and 44) RNA foci were detected in a pattern consistently distinct from that revealed by the cDNA probes. Double-label experiments using both of these genomic probes produced nonoverlapping foci (at most only a trace of 5′ sequences was seen with the more 3′ foci) (Fig. 5, E–G). This strongly suggests that these two introns, from distant parts of the gene, did not simultaneously exist within the same RNA molecules. The most plausible explanation of these results is that the more 5′ introns are spliced out of nascent RNA molecules before the 3′ end of the RNA is transcribed. This indicates cotranscriptional splicing of the primary transcript along this unusually large gene as represented in Fig. 5 H, consistent with results of previously reported PCR analyses (Tennyson et al., 1995). Hence, these results demonstrate that fluorescence hybridization is capable of resolving cotranscriptional splicing events along the dystrophin gene, and directly demonstrate that the large RNA accumulation localized in interdomain compartment is undergoing splicing.
Tracks and Trees
For several reasons it is of interest to understand whether nuclear RNA accumulations represent nascent transcripts or transcripts that have already dissociated from their respective genes and are in a subsequent step in the progression to nuclear export. Dystrophin and MyHC nuclear RNA accumulations may not represent the same structural and functional entities, i.e., they do not necessarily comprise transcripts at equivalent stages of maturation. Despite the enormous difference in gene lengths, the RNA accumulations associated with each gene are quite similar in size. As would be expected for a tree of nascent transcripts on the gene, the approximate length of the dystrophin RNA signal with the 5′ cDNA probe (∼2 μm) is very consistent with earlier measurements of the gene length in fibroblast interphase nuclei (Lawrence et al., 1990). However, the fact that the 35-kb MyHC gene sequence is much smaller than the 2,300-kb dystrophin gene suggests that the relatively large size of the MyHC RNA accumulation may constitute more than a tree of nascent transcripts on the gene. Hence, we postulate that MyHC and dystrophin RNA formations might be structurally distinct with respect to their genes.
To address this directly, we investigated the spatial configuration of the MyHC and dystrophin genes relative to their respective RNA accumulations using a sequential RNA and DNA hybridization strategy (Xing et al., 1995). MyHC RNA and gene were visualized in two different colors using a 32-kb β-cMyHC–specific genomic probe (see Materials and Methods and Fig. 6, A and B). Dystrophin RNA was visualized by using the 5′ cDNA probe while different segments of the dystrophin gene (∼10–15 kb each) were delineated using the 5′ and midgenomic probes (see Materials and Methods and Fig. 6, C and D).
Figure 6.

Tracks versus trees. (A and B) MyHC RNA forms a track that moves away from the gene. (A) MyHC RNA foci (red) form a track with the MyHC gene signal (green, appear yellow in overlap) at the border. (B) Model showing posttranscriptional MyHC RNA molecules (red) moving away from the gene (dark blue). Although gene position relative to SC-35 (light blue) domains is directly demonstrated elsewhere (Moen et al., in preparation) the relationship of the track relative to the domain is consistent with published results for collagen (Xing et al., 1995) and fits with results presented here. (C and D) Dystrophin RNA forms a tree around the gene. (C) Dystrophin RNA (green) appears to surround the two foci corresponding to the 5′ and midgene regions of the dystrophin gene (red, appear yellow in overlap). (D) Model indicating the tree of nascent dystrophin transcripts (green) attached to the dystrophin gene (red and blue). Dark blue segments refer to the portions of the gene detected with the two different genomic probes.
The dystrophin RNA was examined in one color in the same nucleus with the two DNA sequences marking distant gene segments (1 Mb apart) in another color. The 50MB-1 cells used are male, so only 1 X-linked dystrophin gene is present. The pattern observed most often is shown in Fig. 6 C. Here we show that the dystrophin RNA accumulation generally surrounds the two point signals produced by DNA hybridization with the two genomic probes, and often the longer axis of the RNA signal lies parallel to the axis connecting the two gene segments. This overlap is in keeping with a tree of nascent transcripts around the gene locus, as represented in the model in Fig. 6 D. These and the above results collectively demonstrate that the dystrophin RNA accumulation represents a Christmas tree of nascent transcripts undergoing cotranscriptional splicing, with introns removed from the nascent pre-mRNA as transcription and splicing move in a 3′ direction across the gene (Fig. 5 H). This process consistently occurs in a nuclear compartment that is comparatively low in splicing factors.
Results of the DNA/RNA analysis were clearly different for MyHC. The DNA hybridization signal from a 32-kb MyHC probe was a small (0.1–0.2 μ) round spot, indistinguishable from that observed above for hybridization to either of the 10–15-kb dystrophin sequences (Fig. 6 A). This is consistent with studies of the packaging of interphase chromatin which have shown sequences of this length to be at or below the resolution of light microscopy (0.2 μ) (Lawrence et al., 1988, 1990; Trask et al., 1989). When gene and RNA were examined simultaneously in two colors it was clear that the MyHC RNA signal was not only much larger than the DNA signal, but was consistently displaced to one side of it (Fig. 6, A and B). Rather than being positioned amid the RNA accumulation, as were dystrophin DNA signals, the MyHC gene signals were usually at the edge of the MyHC RNA accumulation. The fact that this polar configuration of DNA and RNA was not typically seen for dystrophin supports the interpretation that the apparent track of MyHC RNA emanating to one side of the gene reflects a bona fide biological distribution and not an artifact of the visualization technique.
These results indicate that nuclear accumulations of dystrophin and MyHC RNA do not constitute equivalent functional entities. The results with dystrophin are essentially as one would predict for nascent molecules amassed on the enormous gene. However, the MyHC results do not fit the tree model, but rather are indicative of a track comprised largely of a posttranscriptional RNA accumulation to one side of the gene. We interpret these results to suggest that transcription is likely the rate-limiting step in RNA export for the dystrophin locus, whereas for MyHC posttranscriptional events may not keep pace with the rapid transcription of MyHC, resulting in an accumulation of RNA at a step subsequent to transcription. Although we believe the track is comprised of intact transcripts that enter the SC-35 domain, we do not suggest that MyHC splicing is posttranscriptional (see Discussion).
Association of Transcribed Genes with SC-35 Domains Is Locus Specific
The above results conclusively demonstrate a differential localization of MyHC and dystrophin RNAs relative to large accumulations of splicing factors in muscle cell nuclei. If this reflects different structural relationships relative to a nuclear compartment rich in RNA metabolic factors, rather than merely different amounts of splicing factors bound to these two pre-mRNAs, then differences in the structural association of other active genes/pre-mRNAs would be expected. Although a variety of observations favor the former (see Discussion), the extreme difference in size and potential transcription rates of dystrophin and MyHC may be considered to complicate the interpretation. For this reason, we examined four other active genes/RNAs whose size and expression levels are not as disparate as MyHC and dystrophin. These included the genes for transcription factor E2F4 (Ginsberg et al., 1994), the nuclear envelope protein lamin A/C (LMNA) (Lin and Worman, 1993), lamin B receptor (LBR) (Schuler et al., 1994), and lamin B1 (LMNB1) (Lin and Worman, 1995). Although not muscle specific, these four commonly expressed genes are roughly similar in size and complexity. Furthermore, their expression levels are more moderate, in between the highly expressed MyHC gene and dystrophin. Thus, they are good candidates for addressing whether SC-35 domain association is contingent upon these factors.
For all four of these genes, the nuclear RNA accumulations generally produced small spot-like signals, smaller than either the dystrophin or MyHC nuclear RNA signals. This suggests that the signals largely comprise nascent transcripts on the gene (although there was sometimes a suggestion of RNA tracks for LMNA). Analysis of these genes/RNAs relative to SC-35 in fibroblasts demonstrated striking differences in levels of association with the prominent SC-35 domains, as seen in Figs. 7 and 8. In the vast majority of cells, LMNA and E2F4 were not visibly separate from the SC-35 domains, whereas the LMNB1 and LBR genes/RNAs remained spatially separate, even when they were in the vicinity of a domain. The low levels of apparent association of these two sequences are similar to that previously seen for inactive genes and are consistent with random expectations within the limits of microscopic resolution (Xing et al., 1995). As viewed by light microscopy, LMNA and E2F4 contacted SC-35 domains four- to fivefold more often than LMNB1 and LBR (Fig. 8). This represents a significant level of association for genes that are not nearly as highly expressed as MyHC in muscle cells, and is higher than the level of association reported for fibronectin with SC-35 (Xing et al., 1993). It should be noted that these sequences were studied in a cycling fibroblast population, which may introduce some variability between cells; e.g., E2F4 expression varies during the cell cycle (Sardet et al., 1995). The nonrandom association of a regulatory gene such as E2F4 establishes that the spatial association with domains is not restricted to genes for the most abundant structural proteins. Collectively, our results provide strong evidence that such organization is common and involves a substantial subset of protein coding genes. These results lead us to conclude that association with SC-35 domains is locus specific and not solely dependent upon gene size, complexity or expression level. They further indicate that within the constraints of nuclear structure, active loci have differential access to the immediate and copious supply of RNA metabolic factors in the interchromatin domains, visualized here by immunofluorescence to assembly factor SC-35. Further implications of these results are considered in the Discussion.
Figure 7.
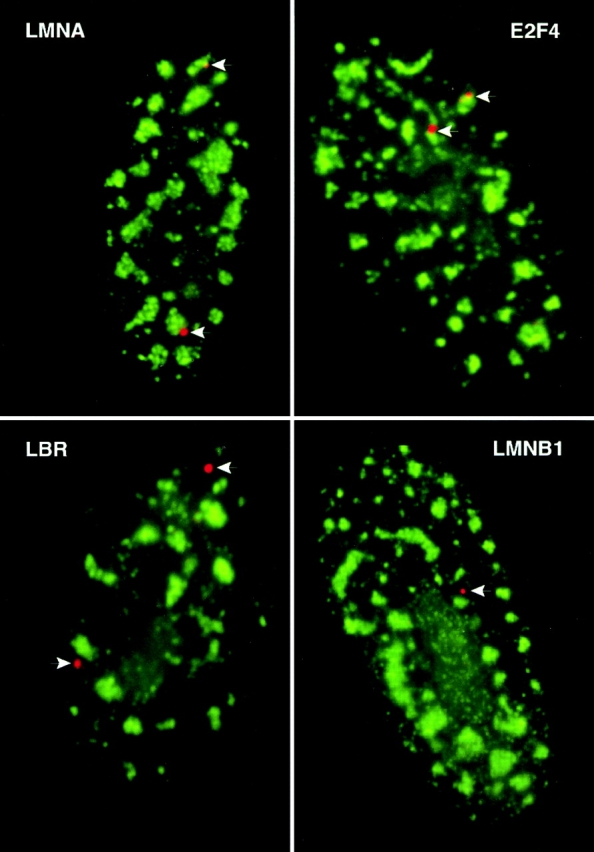
Distributions of E2F4, LMNA, LMNB1, and LBR gene/RNA signals relative to SC-35 domains. Fibroblasts (WI-38) were hybridized with genomic probes to LMNA, E2F4, LBR, and LMNB1 (red). All of the genes are active in fibroblasts. Hybridizations were done using heat denaturation (detects both RNA and gene) for E2F4, LBR, and LMNB1, and under nondenaturing conditions (detects only RNA) for LMNA. LMNA and E2F4 associate with the periphery of SC-35 domains (green), whereas LBR and LMNB1 signals are spatially separate. Only one gene/RNA signal is evident in the LMNB1 image.
Figure 8.

Frequency of LMNA, E2F4, LBR, and LMNB1 gene/RNA associations with SC-35 domains. Nuclei were scored for association of each of the four gene/RNAs with SC-35 domains. Signals were scored as associated if they either overlapped SC-35 rich regions or if no space was visible between the focus and the domain. At least two investigators scored each experiment. N = number of signals scored.
Discussion
This study demonstrates that endogenous genes/pre-mRNAs are preferentially expressed in a locus-specific manner in one of two distinct nuclear compartments, as defined by immediate proximity to regions highly enriched in splicing factors. In addition, results provide further evidence that newly synthesized RNAs are commonly associated with fluorescent SC-35 domains or prominent speckles. In the vast majority of cells, genes for MyHC, E2F4, and LMNA are expressed directly at the periphery of SC-35–defined domains, whereas dystrophin, LMNB1, and LBR are not. Results indicate that the difference is not a coincidence of fixed positions within overall nuclear topography or a result of the abundance of pre-mRNA transcripts present. Results support that splicing factor distribution does not simply reflect factors binding to pre-mRNAs from randomly distributed genes, consistent with earlier studies showing that interchromatin granule cluster and SC-35 domains are structurally and functionally specialized regions of the nucleoplasm. Although initially debated, there is increasing acceptance that transcription and splicing can occur in the periphery of fluorescent domains. Whether or not one views the interior region of the speckle as strictly a storage site devoid of pre-mRNA, results shown here demonstrate a previously unknown paradigm of nuclear architecture involving locus-specific differences in the immediate access of active genes to these supplies of splicing factors. As discussed below, whether or not a gene associates with these regions likely depends not only upon its expression and complexity, but also upon constraints of its chromosomal context.
As suggested here for MyHC (see Fig. 9 B), other results directly demonstrate that, for genes that associate with domains, association is linked to cell type–specific expression (Moen et al., manuscript in preparation). For MyHC and dystrophin, the simplest interpretation might a priori be that the difference in SC-35 association merely reflects the amount of splicing factors bound to each of their pre-mRNAs. However, results show that it is not that simple, and that the domain associated with MyHC is not formed merely by splicing factors bound to unspliced MyHC transcripts. Although the RNA foci for MyHC and dystrophin are comparable in size and intensity when probes of similar size are used, suggesting similar numbers of transcripts, the difference in localization with SC-35 is striking. Clearly, the lower level factors throughout the nucleoplasm are sufficient to splice the large nuclear accumulation of dystrophin RNA with its 74 introns. The abundant accumulation of splicing factors associated with MyHC lies primarily adjacent to the gene, rather than on it, indicating the domain behaves more as a structure than as a diffuse accumulation of splicing factors on nascent or dispersed RNA. Further, the MyHC RNA track, as detected with a genomic probe, frequently does not occupy the whole SC-35 domain. The absence of overlap of dystrophin RNA and SC-35 foci gives the strong impression that this RNA is excluded from splicing factor domains; even when dystrophin and MyHC accumulations are extremely close they do not overlap, suggesting that structural constraints may separate them.
Figure 9.
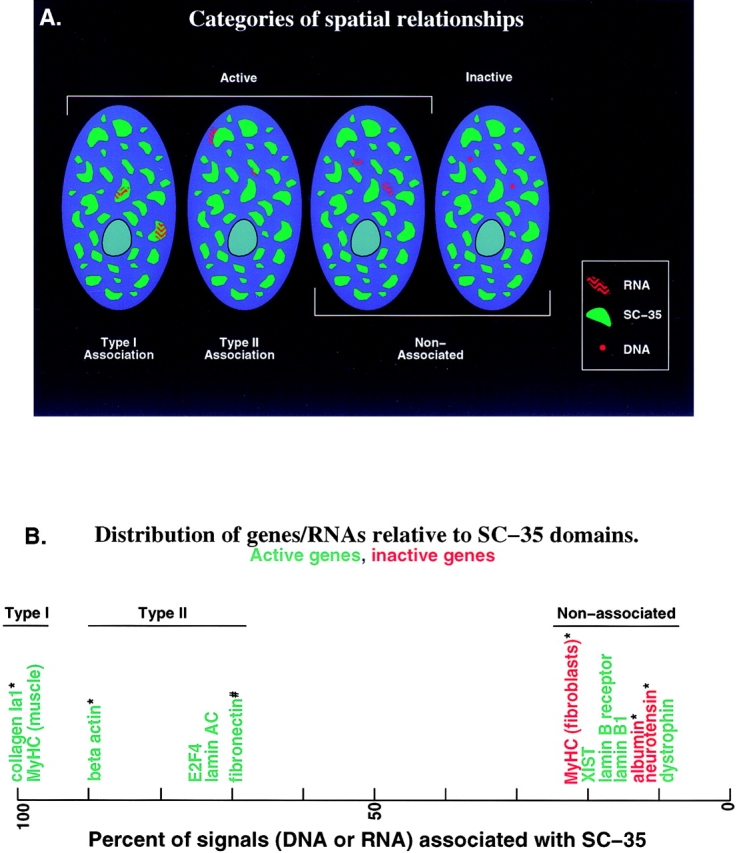
Types and frequencies of RNA and gene associations with SC-35 domains. (A) RNA foci of genes examined to date exhibit three distributions relative to SC-35 domains. Type I associations are defined by an RNA that overlaps the SC-35 domain. This type of association is evident in MyHC and collagen RNAs. In Type II associations demonstrated by LMNA and E2F4, the RNA signal is seen at the periphery of the SC-35 domain. Nonassociated RNA signals such as dystrophin, LMNB1, and LBR are visibly separate from the SC-35–rich domains. Inactive genes are also not associated with SC-35 domains. (B) Frequency of association with SC-35 of genes and RNAs studied to date. The five known associated genes/RNAs (all active, green) contact SC-35 domains at least 70% of the time with the two Type I genes collagen and MyHC approaching 100%. The four active (green) nonassociated genes/RNAs are seen with SC-35 domains less than 20% of the time, at a level comparable to inactive genes (red). Association refers to overlap or contact with SC-35 domain. XIST is an intron-containing gene that does not code for a protein (Clemson et al., 1996). #, from Xing et al. (1993); *, from Xing et al. (1995).
The exclusion of dystrophin, LMB1, and LBR from SC-35 domains contrasts with other results on microinjected sequences (Wang et al., 1991) or transfected sequences (Huang et al., 1996), which indicated that the presence of a single intron was sufficient to cause an association with snRNP or SC-35 speckles. Although the presence of intron sequences may be necessary for this association, results presented here clearly show it is not sufficient for endogenous genes/RNAs. However, the behavior of extrachromosomal sequences may not accurately reflect the structural relationships of endogenous genes. Unlike viruses, plasmids, or microinjected sequences (which have been more commonly examined), our results indicate that for endogenous genes organizational/structural differences in their chromosomal context can impact their proximity and access to factor-rich regions.
Tracks Versus Trees: Different Rate-limiting Steps in RNA Metabolism for Different Genes
These results provide further evidence for the existence of RNA tracks (Lawrence et al., 1989; Xing et al., 1993), and demonstrate that nuclear RNA accumulations from different genes do not necessarily represent the same structural or functional entities. Results show the dystrophin RNA accumulation represents primarily a tree of nascent transcripts on an unusually long gene, for which transcription is logically rate limiting. This contrasts with a track of transcripts extending vectorially beyond the much smaller, but also complex, MyHC gene. These results counter the argument that localized RNA accumulations logically represent nascent transcripts and not posttranscriptional accumulations or RNA tracks (Zachar et al., 1993). Such interpretations may be based on two presumptions: (a) that the rate-limiting step in nuclear RNA metabolism and export for all pre-mRNAs is transcription, and (b) that Drosophila polytene chromosomes accurately reflect the structure of mammalian interphase nuclei.
Despite our conclusion that the dystrophin accumulation is largely cotranscriptional and the MyHC RNA accumulation largely posttranscriptional, we do not interpret this to show that MyHC splicing itself is largely posttranscriptional, even though the RNA overlaps the SC-35 domain. As previously suggested and further addressed elsewhere for the similar case of collagen (col) 1α1 RNA, results favor that splicing is largely cotranscriptional and at the periphery of the SC-35 domain (Xing et al., 1995) (Johnson et al., manuscript in preparation). If so, then the posttranscriptional track of MyHC RNA that accumulates in the domain is already largely spliced. This further supports that the domain may contain both specific mRNAs as well as an abundance of RNA metabolic factors, beyond those immediately engaged on transcripts of that gene. As discussed elsewhere (Lawrence et al., 1993; Xing et al., 1995), we hypothesize that at each SC-35 domain, multiple functions related to RNA metabolism occur including metabolism of some specific pre-mRNAs, preassembly and disassembly of splicing factors, and potential transport of mRNA. The possibility of a role in RNA export will be addressed more directly elsewhere (Johnson et al., manuscript in preparation).
Categories of Spatial Relationships
These results triple the number of endogenous active genes that have been examined relative to this subnuclear compartment, allowing us to begin to categorize the different spatial distributions observed, as shown in Fig. 9 A. Of genes that associate with SC-35 domains, all localize at the domain periphery, however there is a clear difference in the distribution of their nuclear RNAs. MyHC RNA extends from the domain periphery into the central region, similar to collagen RNA. As indicated in Fig. 9 A, we term this a Type I association, as distinct from the Type II associations exhibited by RNAs such as E2F4 and LMNA. Type II RNAs are visible only at the periphery of a domain, and are associated with high frequency (70–95%), but not as consistently as Type I RNAs which overlap SC-35 domains essentially 100% of the time (Fig. 9 B). We speculate that the difference in whether the RNA is observed within the domain may be a function of different relative rates of transcription versus posttranscriptional steps, e.g., whether the RNA forms a track or a tree.
The different categories of association observed contribute to a more detailed hypothesis for domain formation. Previously we showed that after mitosis, the clustering of poly A RNA in domains preceded the clustering of snRNPs, leading us to suggest that domain formation may be linked to gene expression in a manner roughly analogous to formation of the nucleolus (Carter et al., 1991). In this model, domains would be nucleated at sites of highest pre-mRNA transcription and splicing such as the highly expressed and complex Type I RNAs for MyHC and col 1α1. As a smaller accumulation of factors begins to associate with a site of one or more highly active Type I gene/ RNA(s), the tendency will be for that accumulation to grow into a large globular domain, reflecting an inherent tendency for splicing factors to cluster (Wu and Maniatis, 1993). Perhaps due to an affinity of their pre-mRNAs for those same factors, other active genes will, within the constraints of their interphase chromosome structure, tend to cluster at or around these regions where access to metabolic factors is great. This secondary clustering of other active genes/pre-mRNAs (Type II RNAs) will tend to draw more factors, contributing further to the growth of the domain in a dynamic process. But because protein-coding genes reside within chromosomal structure that imposes constraints, not all genes can have equal access to these regions. If Type I genes do have a dominant influence on where domains form, then a locus which resides in the neighborhood of such a gene may be in a favorable position to associate with the domain. In contrast, some active genes not residing in these neighborhoods would not associate with SC-35 domains at a frequency any different from that of inactive sequences (Fig. 9 B). As previously suggested (Lawrence et al., 1993), these observations raise implications for locus-specific influences on levels of gene expression since association with domains could facilitate efficient gene expression. This might eventually even provide some rationale for the clustering distribution of genes in metaphase chromosome bands.
Results presented here point to a nucleus that is functionally organized, but which resists attempts to reduce that organization to any single paradigm. We suggest that the spatial arrangement of endogenous genes or RNAs must be considered in terms of the combined effect of multiple structural and biochemical factors, including the expression and complexity of the sequence, the structural context within the chromosome, and the dynamics of different steps in RNA metabolism. As will be addressed elsewhere, disruptions of these structural relationships may be key to the cellular pathogenesis of specific diseases.
Acknowledgments
We would like to thank M. Gerdes and M. Byron for their excellent technical assistance and appreciate the expertise of J. McNeil in digital imaging microscopy. We are grateful to H. Blau for generously supplying cells and H. Worman and L. Leinwand for DNA clones.
Abbreviations used in this paper
DME-low
low-glucose DME
LBR
lamin B receptor
LMNA
lamin A/C
LMNB1
lamin B1
MyHC
myosin heavy chain
snRNP
small nuclear ribonucleoprotein
polII
RNA polymerase II
Footnotes
This publication was made possible by grants from the National Institutes of Health (NIH) (GM 49254) and the Muscular Dystrophy Association (MDA) to J.B. Lawrence. K.L. Wydner was supported by a postdoctoral fellowship from the NIH. P.T. Moen was a fellow of the MDA. The comments of this manuscript are solely the responsibility of the authors and do not necessarily represent the official views of the NIH or MDA.
K.P. Smith and P.T. Moen contributed equally to this work.
P.T. Moen's current address is NEN Life Science Products, 549 Albany St., Boston, MA 02118.
K.L.Wydner's current address is Department of Diagnostic Genetics, Robert Wood Johnson Medical School, NE Robert Wood Johnson Place, New Brunswick, NJ 08901.
References
- Blencowe BJ, Nickerson JA, Issner R, Penman S, Sharp PA. Association of nuclear matrix antigens with exon-containing splicing complexes. J Cell Biol. 1994;127:593–607. doi: 10.1083/jcb.127.3.593. [DOI] [PMC free article] [PubMed] [Google Scholar]
- Blobel G. Gene gating: a hypothesis. Proc Natl Acad Sci USA. 1985;82:8527–8529. doi: 10.1073/pnas.82.24.8527. [DOI] [PMC free article] [PubMed] [Google Scholar]
- Bregman DB, Du L, van der Zee S, Warren SL. Transcription-dependent redistribution of the large subunit of RNA polymerase II to discrete nuclear domains. J Cell Biol. 1995;129:287–298. doi: 10.1083/jcb.129.2.287. [DOI] [PMC free article] [PubMed] [Google Scholar]
- Carter KC, Taneja KL, Lawrence JB. Discrete nuclear domains of poly(A). RNA and their relationship to the functional organization of the nucleus. J Cell Biol. 1991;115:1191–1202. doi: 10.1083/jcb.115.5.1191. [DOI] [PMC free article] [PubMed] [Google Scholar]
- Carter KC, Bowman D, Carrington W, Fogarty K, McNeil JA, Fay FS, Lawrence JB. A three-dimensional view of precursor messenger RNA metabolism within the mammalian nucleus. Science. 1993;259:1330–1335. doi: 10.1126/science.8446902. [DOI] [PubMed] [Google Scholar]
- Chelly J, Montarras D, Pinset C, Berwald-Netter Y, Kaplan JC. Quantitative estimation of minor mRNAs by cDNA polymerase chain reaction: application to dystrophin mRNA in cultured myogenic and brain cells. Eur J Biochem. 1990;187:691–698. doi: 10.1111/j.1432-1033.1990.tb15355.x. [DOI] [PubMed] [Google Scholar]
- Clemson CM, Lawrence JB. Multifunctional compartments in the nucleus: insights from DNA and RNA localization. J Cell Biochem. 1996;62:181–190. doi: 10.1002/(SICI)1097-4644(199608)62:2%3C181::AID-JCB6%3E3.0.CO;2-O. [DOI] [PubMed] [Google Scholar]
- Clemson CM, McNeil JA, Willard HF, Lawrence JB. XIST RNA paints the inactive X chromosome at interphase: evidence for a structural association. J Cell Biol. 1996;132:259–275. doi: 10.1083/jcb.132.3.259. [DOI] [PMC free article] [PubMed] [Google Scholar]
- Comings D. The rationale for an ordered arrangement of chromatin in the interphase nucleus. Am J Hum Genet. 1968;20:440–457. [PMC free article] [PubMed] [Google Scholar]
- Fakan S, Puvion E. The ultrastructural visualization of nuclear and extranucleolar RNA synthesis and distribution. Int Rev Cytol. 1980;65:255–299. doi: 10.1016/s0074-7696(08)61962-2. [DOI] [PubMed] [Google Scholar]
- Fu X-D, Maniatis T. Factor required for mammalian spliceosome assembly is localized to discrete regions in the nucleus. Nature. 1990;343:437–444. doi: 10.1038/343437a0. [DOI] [PubMed] [Google Scholar]
- Gee S, Krauss SW, Miller E, Aoyagi K, Arenas J, Conboy JG. Cloning of mDEAH9, a putative RNA helicase and mammalian homologue of Saccharomyces cerevisiaesplicing factor Prp 43. Proc Natl Acad Sci USA. 1997;94:11803–11807. doi: 10.1073/pnas.94.22.11803. [DOI] [PMC free article] [PubMed] [Google Scholar]
- Ginsberg D, Vairo G, Chittenden T, Xiao ZX, Xu G, Wydner KL, DeCaprio JA, Lawrence JB, Livingston DM. E2F-4, a new member of the E2F transcription factor family, interacts with p107. Genes Dev. 1994;8:2665–2679. doi: 10.1101/gad.8.22.2665. [DOI] [PubMed] [Google Scholar]
- Hochstrasser M, Mathoy D, Gruenbaum Y, Saumweber H, Sedat JW. Spatial organization of chromosomes in the salivary gland nuclei of Drosophila melanogaster. . J Cell Biol. 1986;102:112–123. doi: 10.1083/jcb.102.1.112. [DOI] [PMC free article] [PubMed] [Google Scholar]
- Hoffman EH, Monaco AP, Feener CA, Kunkel LM. Conservation of the Duchennemuscular dystrophy gene in mice and humans. Science. 1987;238:347–350. doi: 10.1126/science.3659917. [DOI] [PubMed] [Google Scholar]
- Huang S, Spector DL. Nascent pre-mRNA transcripts are associated with nuclear regions enriched in splicing factors. Genes Dev. 1991;5:2288–2302. doi: 10.1101/gad.5.12a.2288. [DOI] [PubMed] [Google Scholar]
- Huang S, Spector DL. Intron-dependent recruitment of pre-mRNA splicing factors to sites of transcription. J Cell Biol. 1996;133:719–732. doi: 10.1083/jcb.133.4.719. [DOI] [PMC free article] [PubMed] [Google Scholar]
- Hughes SM, Cho M, Karsch-Mizrachi I, Travis M, Silberstein L, Leinwand LA, Blau H. Three slow myosin heavy chains sequentially expressed in developing mammalian skeletal muscle. Dev Biol. 1993;158:183–199. doi: 10.1006/dbio.1993.1178. [DOI] [PubMed] [Google Scholar]
- Jackson DA, Hassan AB, Errington RJ, Cook PR. Visualization of focal sites of transcription within human nuclei. EMBO (Eur Mol Biol Organ) J. 1993;12:1059–1065. doi: 10.1002/j.1460-2075.1993.tb05747.x. [DOI] [PMC free article] [PubMed] [Google Scholar]
- Johnson CV, Singer RH, Lawrence JB. Fluorescent detection of nuclear RNA and DNA: implication for genome organization. Methods Cell Biol. 1991;35:73–99. [PubMed] [Google Scholar]
- Lawrence JB, Villnave CA, Singer RH. Sensitive high-resolution chromatin and chromosome mapping in situ: presence and orientation of two closely integrated copies of EBV in a lymphoma line. Cell. 1988;52:51–61. doi: 10.1016/0092-8674(88)90530-2. [DOI] [PubMed] [Google Scholar]
- Lawrence JB, Taneja K, Singer RH. Temporal resolution and sequential expression of muscle-specific genes revealed by in situ hybridization. Dev Biol. 1989;133:235–246. doi: 10.1016/0012-1606(89)90314-x. [DOI] [PubMed] [Google Scholar]
- Lawrence JB, Singer RH, McNeil JA. Interphase and metaphase resolution of different distances within the human dystrophin gene. Science. 1990;249:928–932. doi: 10.1126/science.2203143. [DOI] [PubMed] [Google Scholar]
- Lawrence JB, Carter KC, Xing Y. Probing functional organization within the nucleus: is genome structure integrated with RNA metabolism? . Cold Spring Harbor Symp Quant Biol. 1993;58:807–818. doi: 10.1101/sqb.1993.058.01.088. [DOI] [PubMed] [Google Scholar]
- Leinwand LA, Saez L, McNalley E, Nadal-Ginard B. Isolation and characterization of human myosin heavy chain genes. Proc Natl Acad Sci USA. 1983;80:3716–3720. doi: 10.1073/pnas.80.12.3716. [DOI] [PMC free article] [PubMed] [Google Scholar]
- Lin F, Worman HJ. Structural organization of the human gene encoding nuclear lamin A and nuclear lamin C. J Biol Chem. 1993;268:16321–16326. [PubMed] [Google Scholar]
- Lin F, Worman HJ. Structural organization of the human gene (LMNB1) encoding nuclear lamin B1. Genomics. 1995;27:230–236. doi: 10.1006/geno.1995.1036. [DOI] [PubMed] [Google Scholar]
- Manuelidis L. Active nucleolus organizers are precisely positioned in adult central nervous system cells but not in neuroectodermal tumor cells. J Neuropath Exp Neuro. 1984;43:225–241. doi: 10.1097/00005072-198405000-00002. [DOI] [PubMed] [Google Scholar]
- Marshall WF, Straight A, Marko JF, Swedlow J, Dernburg A, Belmont A, Murray AW, Agard DA, Sedat JW. Interphase chromosomes undergo constrained diffusional motion in living cells. Curr Biol. 1997;7:930–939. doi: 10.1016/s0960-9822(06)00412-x. [DOI] [PubMed] [Google Scholar]
- Moen PT, Jr, Smith KP, Lawrence JB. Compartmentalization of specific pre-mRNA metabolism: an emerging view. Human Molec Genet. 1995;4:1779–1789. doi: 10.1093/hmg/4.suppl_1.1779. [DOI] [PubMed] [Google Scholar]
- Nyman U, Hallman H, Hadlaczky G, Pettersson I, Sharp G, Ringertz NR. Intranuclear localization of snRNP antigens. J Cell Biol. 1986;102:137–144. doi: 10.1083/jcb.102.1.137. [DOI] [PMC free article] [PubMed] [Google Scholar]
- Saez LJ, Gianola KM, McNally EM, Feghali R, Eddy R, Shows TB, Leinwand LA. Human cardiac myosin heavy chain genes and their linkage in the genome. Nucleic Acids Res. 1987;15:5443–5459. doi: 10.1093/nar/15.13.5443. [DOI] [PMC free article] [PubMed] [Google Scholar]
- Sardet C, Vidal M, Cobrinik D, Geng T, Onufryk C, Chen A, Weinberg RA. E2F-4 and E2F-5, two members of the E2F family, are expressed in the early phases of the cell cycle. Proc Natl Acad Sci USA. 1995;92:2403–2407. doi: 10.1073/pnas.92.6.2403. [DOI] [PMC free article] [PubMed] [Google Scholar]
- Scheer U, Thiry M, Goessens G. Structure, function and assembly of the nucleolus. Trends Cell Biol. 1993;3:237–241. doi: 10.1016/0962-8924(93)90123-i. [DOI] [PubMed] [Google Scholar]
- Schul W, van Driel R, de Jong L. A subset of poly(A) polymerase is concentrated at sites of RNA synthesis and is associated with domains enriched in splicing factors and poly(A) RNA. Exp Cell Res. 1998;238:1–12. doi: 10.1006/excr.1997.3808. [DOI] [PubMed] [Google Scholar]
- Schuler E, Lin F, Worman HJ. Characterization of the human gene encoding LBR, an integral protein of the nuclear envelope inner membrane. J Biol Chem. 1994;269:11312–11317. [PubMed] [Google Scholar]
- Spector DL, Fu X-D, Maniatis T. Associations between distinct pre-mRNA splicing components and the cell nucleus. EMBO (Eur Mol Biol Organ) J. 1991;10:3467–3481. doi: 10.1002/j.1460-2075.1991.tb04911.x. [DOI] [PMC free article] [PubMed] [Google Scholar]
- Tennyson CN, Klamut HJ, Worton RG. The human dystrophin gene requires 16 hours to be transcribed and is cotranscriptionally spliced. Nature Genetics. 1995;9:184–190. doi: 10.1038/ng0295-184. [DOI] [PubMed] [Google Scholar]
- Tennyson CN, Shi Q, Worton RG. Stability of the human dystrophin transcript in muscle. Nucleic Acids Res. 1996;24:3059–3064. doi: 10.1093/nar/24.15.3059. [DOI] [PMC free article] [PubMed] [Google Scholar]
- Trask B, Pinkel D, Van den Engh G. The proximity of DNA sequences in interphase cell nuclei is correlated to genomic distance and permits ordering of cosmids spanning 250 kilobase pairs. Genomics. 1989;5:710–717. doi: 10.1016/0888-7543(89)90112-2. [DOI] [PubMed] [Google Scholar]
- Visa N, Puvion-Dutilleul F, Harper F, Bachellerie J-P, Puvion E. Intranuclear distribution of poly(A) RNA determined by electron microscope in situ hybridization. Exp Cell Res. 1993;208:19–34. doi: 10.1006/excr.1993.1218. [DOI] [PubMed] [Google Scholar]
- Wang J, Cao L, Wang Y, Pederson T. Localization of pre-messenger RNA at discrete nuclear sites. Proc Natl Acad Sci USA. 1991;88:7391–7395. doi: 10.1073/pnas.88.16.7391. [DOI] [PMC free article] [PubMed] [Google Scholar]
- Wansink DG, Schul W, van der Kraan I, van Steensel B, van Driel R, de Jong L. Fluorescent labeling of nascent RNA reveals transcription by RNA polymerase II in domains scattered throughout the nucleus. J Cell Biol. 1993;122:283–293. doi: 10.1083/jcb.122.2.283. [DOI] [PMC free article] [PubMed] [Google Scholar]
- Webster C, Pavlath GK, Parks DR, Walsh FS, Blau HM. Isolation of human myoblasts with the fluorescence-activated cell sorter. Exp Cell Res. 1988;174:252–265. doi: 10.1016/0014-4827(88)90159-0. [DOI] [PubMed] [Google Scholar]
- Wu JY, Maniatis T. Specific interactions between proteins implicated in splice site selection and regulated alternative splicing. Cell. 1993;75:1061–1070. doi: 10.1016/0092-8674(93)90316-i. [DOI] [PubMed] [Google Scholar]
- Xing Y, Johnson CV, Dobner PR, Lawrence JB. Higher level organization of individual gene transcription and RNA splicing. Science. 1993;259:1326–1330. doi: 10.1126/science.8446901. [DOI] [PubMed] [Google Scholar]
- Xing Y, Johnson CV, Moen PT, McNeil JA, Lawrence JB. Non-random gene organization: structural arrangements of specific pre-mRNA transcription and splicing with SC-35 domains. J Cell Biol. 1995;131:1635–1647. doi: 10.1083/jcb.131.6.1635. [DOI] [PMC free article] [PubMed] [Google Scholar]
- Yamauchi-Takihara K, Sole MJ, Liew J, Ing D, Liew C-C. Characterization of human cardiac myosin heavy chain genes. Proc Natl Acad Sci USA. 1989;86:3504–3508. doi: 10.1073/pnas.86.10.3504. [DOI] [PMC free article] [PubMed] [Google Scholar]
- Zachar Z, Kramer J, Mims IP, Bingham PM. Evidence for channeled diffusion of pre-mRNAs during nuclear RNA transport in metazoans. J Cell Biol. 1993;121:729–742. doi: 10.1083/jcb.121.4.729. [DOI] [PMC free article] [PubMed] [Google Scholar]