Localization of Mad2 to Kinetochores Depends on Microtubule Attachment, Not Tension (original) (raw)
Abstract
A single unattached kinetochore can delay anaphase onset in mitotic tissue culture cells (Rieder, C.L., A. Schultz, R. Cole, G. Sluder. 1994. J. Cell Biol. 127:1301–1310). Kinetochores in vertebrate cells contain multiple binding sites, and tension is generated at kinetochores after attachment to the plus ends of spindle microtubules. Checkpoint component Mad2 localizes selectively to unattached kinetochores (Chen, R.-H., J.C. Waters, E.D. Salmon, and A.W. Murray. 1996. Science. 274:242–246; Li, Y., and R. Benezra. Science. 274: 246–248) and disappears from kinetochores by late metaphase, when chromosomes are properly attached to the spindle. Here we show that Mad2 is lost from PtK1 cell kinetochores as they accumulate microtubules and re-binds previously attached kinetochores after microtubules are depolymerized with nocodazole. We also show that when kinetochore microtubules in metaphase cells are stabilized with taxol, tension at kinetochores is lost. The phosphoepitope 3f3/2, which has been shown to become dephosphorylated in response to tension at the kinetochore (Nicklas, R.B., S.C. Ward, and G.J. Gorbsky. 1995. J. Cell Biol. 130:929–939), is phosphorylated on all 22 kinetochores after tension is reduced with taxol. In contrast, Mad2 only localized to an average of 2.6 out of the 22 kinetochores in taxol-treated PtK1 cells. Therefore, loss of tension at kinetochores occupied by microtubules is insufficient to induce Mad2 to accumulate on kinetochores, whereas unattached kinetochores consistently bind Mad2. We also found that microinjecting antibodies against Mad2 caused cells arrested with taxol to exit mitosis after ∼12 min, while uninjected cells remained in mitosis for at least 6 h, demonstrating that Mad2 is necessary for maintenance of the taxol-induced mitotic arrest. We conclude that kinetochore microtubule attachment stops the Mad2 interactions at kinetochores which are important for inhibiting anaphase onset.
Kinetochore attachment to microtubules provides the essential link between chromosomes and the spindle upon which they are segregated (Rieder and Salmon, 1994). During the initial stages of chromosome attachment to the spindle in vertebrate tissue culture cells, a kinetochore on a chromosome captures microtubules from one spindle pole. When the opposing sister kinetochore captures microtubules from the other spindle pole, the chromosome congresses to the spindle equator. In anaphase, forces generated at kinetochores and along kinetochore microtubules (i.e., microtubules attached to the kinetochore) move the attached chromatids poleward (Mitchison and Salmon, 1992). Therefore, accurate chromosome segregation requires the proper attachment of kinetochores to the spindle before anaphase begins.
To ensure that chromosomes properly attach to the spindle before anaphase onset, unattached kinetochores in mitotic vertebrate tissue culture cells release an inhibitory signal that delays anaphase until they properly attach to the spindle (Rieder et al., 1994, 1995; for review see Nicklas, 1997). Microtubule depolymerization (Brues and Cohen, 1936) or detachment of chromosomes from the spindle with a microneedle (Li and Nicklas, 1995) also arrests cells before anaphase, allowing time for the problem to be corrected. This mitotic cell cycle checkpoint has been given a number of names including “spindle assembly” (Rudner and Murray, 1996), “kinetochore attachment” (Rieder et al., 1994), “chromosome distribution” (Nicklas, 1997), and simply “mitotic” (Li and Benezra, 1996). We use the term “spindle checkpoint” because it is clear and avoids assumptions about which elements are being monitored. It is an important checkpoint because it prevents cells from entering anaphase under conditions that are likely to result in missegregation and aneuploidy.
Genes that encode proteins involved in signaling of the spindle checkpoint were first isolated from the budding yeast, Saccharomyces cerevisiae. Mutations in Mad1, Mad2, Mad3 (mitotic arrest deficient; Li and Murray, 1991), Bub1, Bub2, and Bub3 (budding uninhibited by benomyl; Hoyt et al., 1991) all result in failure of cells to arrest in mitosis after treatment with the microtubule-depolymerizing drug benomyl.
Several studies suggest that the yeast Mad and Bub proteins monitor kinetochore attachment to the spindle, as opposed to spindle integrity. Cells with mutations in the kinetochore component Ctf13 arrest in mitosis. This arrest is dependent on the MAD1, MAD2, MAD3, BUB1, and BUB3 gene products; the mitotic arrest induced by mutations in CTF13 is eluded by mutations in these genes (Wang and Burke, 1995). Therefore, defects in kinetochore components can delay anaphase onset via the spindle checkpoint pathway. Another set of experiments implicates kinetochore involvement in the yeast spindle checkpoint. Yeast cells with multiple copies of short linear or circular mini-chromosomes show pronounced mitotic delays. These delays are abolished by mutations in the spindle checkpoint genes or removal of the centromere from the mini-chromosomes, demonstrating that the delay is both checkpoint- and kinetochore-dependent (Wells and Murray, 1996). In addition, the presence of partially functional mutant centromeres (Spencer and Hieter, 1992) has been shown to induce mitotic delays in yeast.
Genes encoding proteins homologous to Mad2 and Bub1 have been cloned from vertebrates. The Xenopus (Chen et al., 1996) and human (Li and Benezra, 1996) homologues of Mad2 (Xmad2 and hsMad2, respectively) and the murine homologue of Bub1 (Taylor and McKeon, 1997) have all been shown to be critical for cell cycle arrest in response to microtubule-depolymerizing drugs. Consistent with the idea that these proteins monitor kinetochore attachment to the spindle, each of the vertebrate homologues localize to unattached kinetochores. Immunolocalization to kinetochores is lost after chromosomes become properly attached to the spindle at metaphase. Overexpression of the kinetochore-binding domain of the murine homologue of Bub1 results in premature anaphase onset, presumably by competing endogenous Bub1 off of kinetochores (Taylor and McKeon, 1997). These data suggest that interaction of the spindle checkpoint components with unattached kinetochores may signal inhibition of anaphase onset.
How does the cell know if a kinetochore is properly attached to the spindle? It is not understood which aspect of kinetochore attachment to the mitotic spindle is monitored by the spindle checkpoint. One possibility is that the checkpoint components monitor microtubule binding to kinetochores (Rieder et al., 1995). Alternatively, some evidence suggests that the checkpoint monitors tension at kinetochores, as first proposed by McIntosh (1991). Attached kinetochores are subject to net poleward pulling forces that place them under tension (Waters et al., 1996_a_ ). Experimentally introduced tension at kinetochores has been shown abolish the delay that normally occurs in the presence of mal-oriented chromosomes (Li and Nicklas, 1995). In addition, phosphorylation of a protein recognized by the antibody 3f3/2 has been shown to be involved in the spindle checkpoint (Campbell and Gorbsky, 1995) and is regulated by tension (Nicklas et al., 1995).
We are interested in whether the spindle checkpoint monitors tension at kinetochores, microtubule attachment to kinetochores, or both. To attempt to differentiate between these possibilities, we used the localization of Mad2 to kinetochores as a marker for those kinetochores that have not yet satisfied the checkpoint. Specifically, we asked if Mad2 binds to kinetochores that are attached to microtubules, but not under tension. McEwen et al. (1997) have shown that treatment with the anti-cancer drug taxol does not significantly decrease the average number of microtubules bound to kinetochores in metaphase PtK1 cells. We show that taxol treatment did, however, reduce tension at kinetochores in metaphase PtK1 cells. We also used immunofluorescence and digital imaging techniques to show that decreasing tension at kinetochores, without detaching them from the spindle, was not sufficient to induce Mad2 binding to kinetochores. In addition, we are interested in the mechanism by which taxol inhibits cell proliferation. We microinjected antibodies to Mad2 into taxol-treated tissue culture cells and found that Mad2 was necessary for maintenance of the taxol-induced mitotic arrest.
Materials and Methods
Cell Culture and Drug Treatment
PtK1 cells (American Type Culture Collection, Rockville, MD) were maintained in MEM (Sigma Chemical Co., St. Louis, MO) containing 10% FBS, antibiotics, and antimycotics in a 37°C, 5% CO2 incubator. For experiments in which cells were treated with taxol, 10 mM taxol in DMSO stock (Sigma Chemical Co.) was diluted into media for a final concentration of 10 μM. For experiments in which cells were treated with nocodazole, 10 mg/ml nocodazole in DMSO stock (Sigma Chemical Co.) was diluted into media for a final concentration of 20 μg/ml. Standard media was then replaced with media containing the drug of choice.
Antibody Production and Purification
Full-length XMad2 tagged with six histidines at the NH2 terminus (Chen et al., 1996) was expressed in Escherichia coli with Qiaexpress vector pQE10 (Qiagen Inc., Chatsworth, CA). The expressed protein was purified according to Qiagen's instructions for soluble proteins. Purified recombinant XMad2 dialyzed against PBS was used to immunize rabbits (BAbCo, Richmond, CA). Polyclonal antibodies were purified on an XMad2 affinity column prepared by binding the recombinant protein to CH-activated Sepharose 4B (Pharmacia Biotech Inc., Piscataway, NJ; Waterman-Storer and Holzbaur, 1996). Antibodies were eluted from the column with 100 mM triethylamine, and quickly transferred into injection buffer (IB; 50 mM K-glutamate, 0.5 mM MgCl2) by gel filtration over a NAP-10 column. Antibodies were concentrated using Microcon 10 microconcentrators (Amicon Corp., Danvers, MA). Affinity-purified antibodies were used for all experiments described. Antibodies for microinjection were stored in IB at a concentration of 0.4 mg/ml at 4°C. Antibodies used for immunofluorescence and Western blots were stored at a concentration of 0.2 mg/ml in IB containing 50% glycerol, 0.05% sodium azide, and 1% BSA at −20°C.
To analyze the immunoreactivity of the affinity-purified antibodies, total PtK1 cells were homogenized into SDS sample buffer, run on an SDS 12% polyacrylamide gel, and then electroblotted onto Immobilon-P (Millipore Corp., Bedford, MA) for Western blot analysis. Blots were first stained with Coomassie to visualize total protein, then destained and blocked with 5% dry milk in TBS with 0.05% Tween 20 for at least 1 h. Blots were incubated in primary antibodies diluted 1:1000–1:10,000 for 1 h at room temperature, rinsed, and then probed with donkey anti–rabbit secondary antibodies conjugated to alkaline phosphatase (Jackson ImmunoResearch, West Grove, PA). Blots were developed using Nitroblue tetrazolium chloride and BCIP AP Color Development Reagents, according to the manufacturer's directions (Bio-Rad Laboratories, Hercules, CA).
Immunofluorescence and Microtubule Depolymerization in Lysed Cells
For immunofluorescence labeling, cells were first lysed in 0.5% Triton X-100 in PHEM (60 mM Pipes, 25 mM Hepes, 10 mM EGTA, and 4 mM MgSO4) for 5 min. When preservation of the 3f3/2 phosphoepitope was desired, 100 nM microcystin (Sigma Chemical Co.) was added to the lysis buffer. Cells were then fixed in 1% formaldehyde (prepared fresh daily from paraformaldehyde) for 20 min. For microtubule labeling, 0.1% glutaraldehyde was added to the 1% formaldehyde. Next, cells were rinsed in PBST (PBS with 0.05% Tween 20) and subsequently blocked in 5% donkey serum in PBS for at least 1 h. Cells were incubated for 45 min in primary antibodies diluted 1:50 into 5% donkey serum in PBS, rinsed, and then incubated for 30–45 min in secondary donkey anti–rabbit, anti– mouse, or anti–human antibodies, conjugated to either FITC or LSRC (Jackson ImmunoResearch), diluted 1:50 in 5% donkey serum in PBS. For double antibody labeling, cells were treated in the following order: (1) block, (2) anti-XMad2 antibodies, (3) anti–rabbit secondary antibodies, (4) block, (5) primary No. 2, and (6) secondary No. 2. For chromosome labeling, cells were treated with 20 μg/ml Hoechst 33342 in PBS for 30 s. All incubations were performed at room temperature. CREST serum was a gift from Drs. A. Desai and T.J. Mitchison (Harvard Medical School, Cambridge, MA). 3f3/2 mAbs were a gift from Dr. G.J. Gorbsky (University of Virginia, Charlottesville, VA). DMA-1 mAbs to α-tubulin were purchased from Sigma Chemical Co. Cells were mounted for viewing in 50% glycerol, 50% PBS with _N_-propyl gallate.
For experiments in which microtubules were depolymerized after cell lysis, cells were first lysed with 5% Triton X-100 in PHEM containing 2 mM ATP. Cells were then rinsed for 15 min in PHEM, replacing the buffer every 5 min. To induce microtubule depolymerization, lysed cells were incubated in buffer containing a high concentration of calcium (60 mM Pipes, 25 mM Hepes, 4 mM MgCl2, 4 mM CaCl2) for 2 h at 4°C. Cells were then fixed and immunolabeled as described above.
Z-series optical sections of immunofluorescently labeled cells were obtained using a multi-mode digital imaging system as previously described (Waters et al., 1996_a_ ).
Microinjection
Cells grown on coverslips were mounted in modified Rose chambers, in which a layer of mineral oil was used instead of a top coverslip. For both microinjection and filming, cells were sustained with Hepes-buffered L-15 media containing antibiotics, antimycotics, and 10% FBS. Affinity-purified anti-XMad2 antibodies at a concentration of 0.4 mg/ml in IB were microinjected into mitotic PtK1 cells, as described by Mitchison and Salmon (1992). Images were captured with a Hamamatsu C2400 CCD camera and Argus 20 image processor (Hamamatsu Photonics, Bridgewater, NJ) and recorded with a Panasonic S-VHS video recorder. A Sage air curtain incubator was used to maintain the cells at 32°–34°C during microinjection and filming. The following control injections were performed: (a) buffer that flowed through the Microcon during antibody concentration, (b) antibodies incubated with recombinant XMad2 (1:2 molar ratio) for 1 h at room temperature, and (c) antibodies diluted with buffer, instead of recombinant XMad2, and incubated for 1 h at room temperature.
Image Processing and Figure Production
12-bit digital images collected using Metamorph imaging software were converted to 8-bit (Universal Imaging Corp., Westchester, PA). Images were then transferred into Photoshop 3.0 (Adobe Microsystems, Mountain View, CA), where they were sized, contrast-enhanced, pseudocolored, and/or overlaid. Final images were montaged and labeled using Claris Draw (Claris Corp., Santa Clara, CA).
Results
Affinity-purified Polyclonal Antibodies to Mad2 Recognize One 24-kD Band
To determine the immunoreactivity of our polyclonal affinity-purified antibody, which was generated to recombinant XMad2, we performed Western blot analysis of whole PtK1 cells (Fig. 1, left lane). We found that the antibody recognized one band of similar molecular weight to XMad2 (24 kD; Fig. 1, middle lane). Antibody that was incubated with the recombinant XMad2 protein before use showed no detectable immunoreactivity (Fig. 1, right lane).
Figure 1.
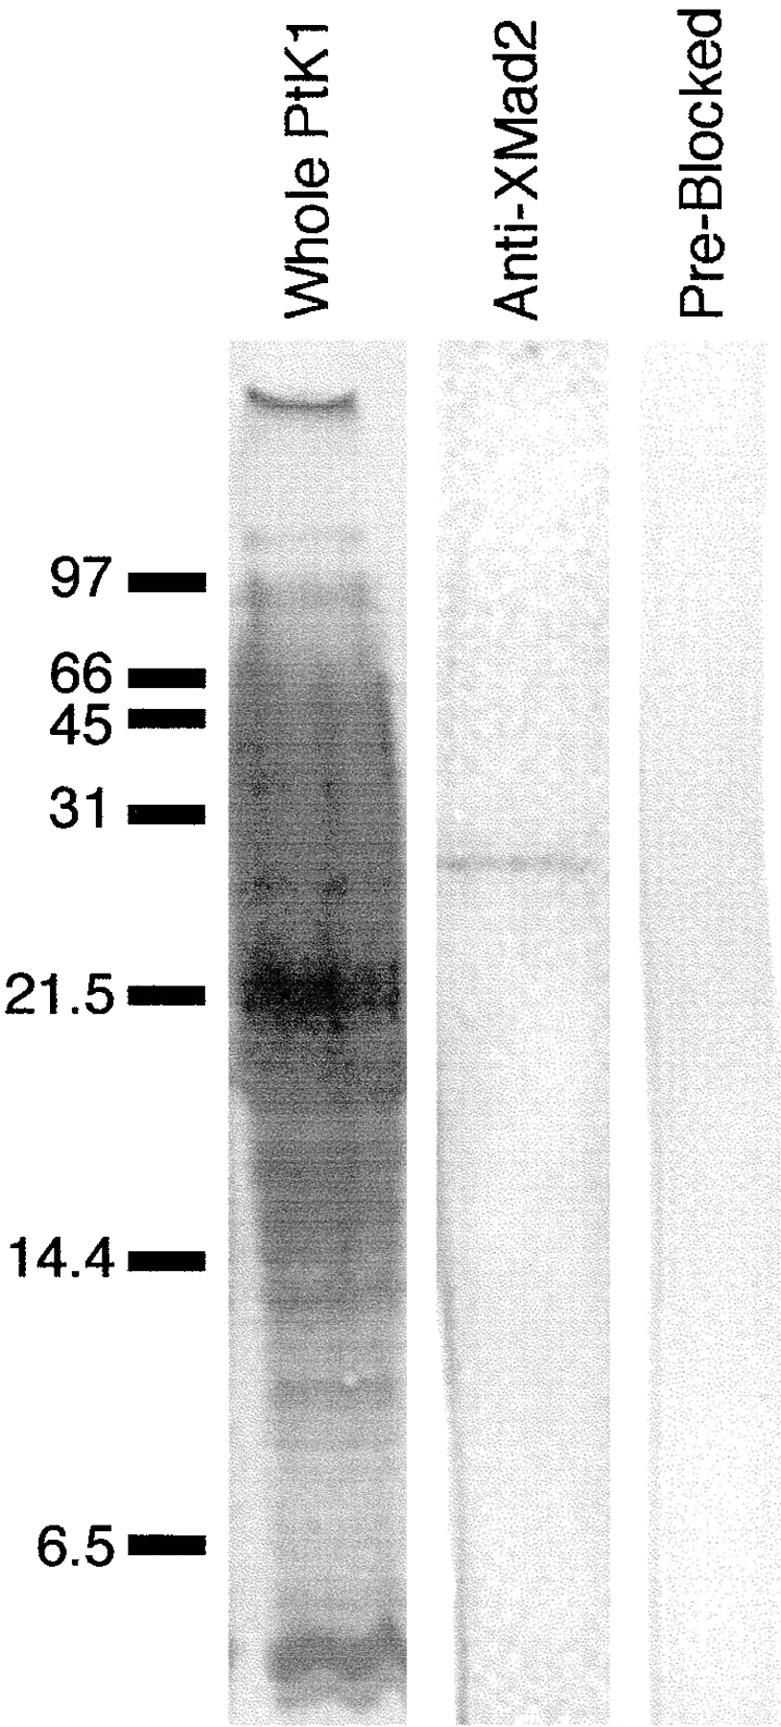
Affinity-purified anti-XMad2 antibodies recognize one 24-kD band in PtK1 cells. Immunoblot analysis with the affinity-purified anti-XMad2 polyclonal antibodies. Left, middle, right lanes, whole PtK1 cell; left lane, Coomassie blue–stained Immobilon; middle lane, immunoblot with anti-XMad2 antibodies; right lane, immunoblot with anti-XMad2 antibodies that were pre-incubated with recombinant XMad2. Position of molecular weight markers are indicated on left.
Mad2 Is Depleted from Attached Kinetochores
Antibodies to Mad2 localize to unattached kinetochores in Xenopus, newt (Chen et al., 1996), human (Li and Benezra, 1996), and PtK1 cells (Fig. 2; and see Fig. 4, A–D). Mad2 does not immunolocalize to attached kinetochores in late metaphase and anaphase cells (see Fig. 4, E and F; Chen et al., 1996; Li and Benezra, 1996). Consistent with observations in Xenopus, newt, (Chen et al., 1996), and human cells (Li and Benezra, 1996), we have found that treatment with the microtubule–depolymerizing drug nocodazole at concentrations that depolymerize all kinetochore microtubules (Cassimeris et al., 1990) results in Mad2 localization to each of the 22 kinetochores in mitotic PtK1 cells (n = 20; Fig. 2). These observations could mean that either (a) Mad2 leaves kinetochores after microtubule attachment and re-binds to kinetochores after microtubule depolymerization, or (b) the epitope recognized by the antibody is blocked when microtubules are bound to kinetochores, and then re-exposed after microtubule depolymerization. We reasoned that we could differentiate between these two possible explanations by removing the cytoplasmic Mad2 before microtubule depolymerization, so that Mad2 would be unavailable to re-bind to the kinetochores after microtubule depolymerization. We first lysed and rinsed PtK1 cells to remove soluble Mad2 from the cytoplasm. We then incubated the lysed cells in a buffer containing 4 mM calcium at 4°C for 2 h. Cells labeled for anti-tubulin immunofluorescence revealed that this treatment resulted in depolymerization of all microtubules (data not shown). Cells were also immunolabeled with antibodies to Mad2 (Fig. 3 C) and with CREST serum to visualize kinetochores (Fig. 3 B). We found that Mad2 was present on kinetochores that were unattached before treatment, demonstrating that this procedure does not remove insoluble Mad2 from kinetochores (Fig. 3 C, bottom arrow). However, we found no detectable Mad2 at previously attached kinetochores after this procedure (Fig. 3 C, top arrow), demonstrating that Mad2 is substantially depleted from attached kinetochores. We found the same to be true for cells treated with 10 μM taxol for 45 min before cell lysis and microtubule depolymerization (data not shown).
Figure 2.
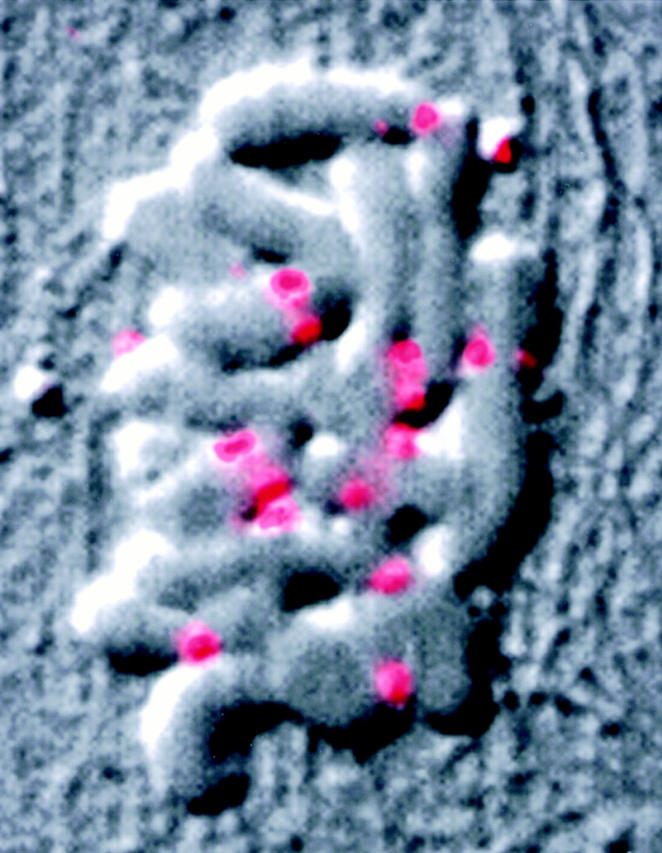
Mad2 rebinds PtK1 kinetochores after microtubule depolymerization. This metaphase cell was treated with 20 μg/ml nocodazole for 20 min at 37°C before being fixed and processed for immunofluorescence. Coverslips were scribed before drug treatment to aid in subsequent identification of cells. Digital DIC (black and white) and Mad2 (pink/red) images were pseudocolored and overlaid. The majority of the 22 kinetochores are visible in this optical section.
Figure 4.
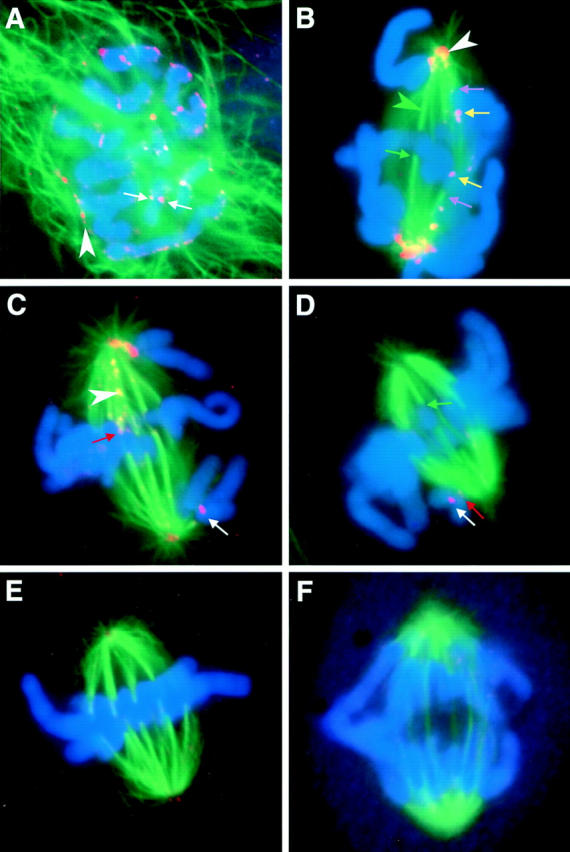
Mad2 leaves kinetochores as they accumulate kinetochore microtubules. Mitotic PtK1 cells were labeled with antibodies to Mad2 (orange/pink), antibodies to α-tubulin (green), and the DNA stain Hoechst 33342 (blue). (A) Just after nuclear envelope breakdown. White arrows, Mad2 accumulating on kinetochores; white arrowhead, Mad2 on residual nuclear envelope. (B) Early prometaphase. Green arrowhead, kinetochore fibers are visible as bright dense bundles of green microtubules that end abruptly on a chromosome; white arrowhead, spindle pole. (C) Mid-prometaphase. White arrowhead, Mad2 on kinetochore microtubules. (D) Late prometaphase. (E) Metaphase. (F) Anaphase. Yellow arrows, newly attached leading kinetochores on congressing chromosomes label brightly for Mad2; purple arrows, trailing kinetochores on attached kinetochores label less brightly; green arrows, attached kinetochores that lack Mad2; and red arrows, attached kinetochores on which some Mad2 is still visible.
Figure 3.

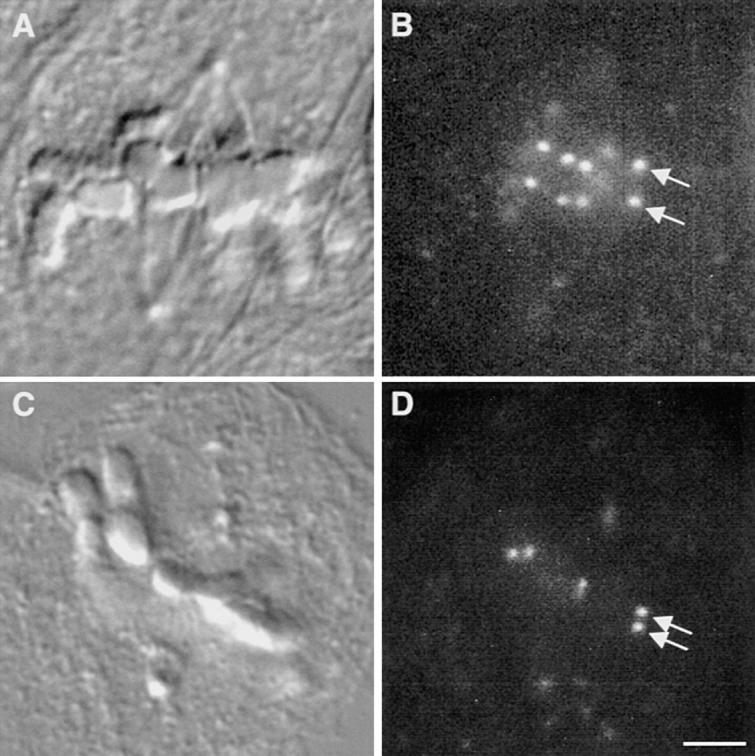
Mad2 leaves attached kinetochores. (A–C) Micrograph of a late prometaphase PtK1 cell with one mono-oriented chromosome. This cell was first lysed and extracted to rinse away cytoplasmic Mad2, and then microtubules were depolymerized. The cell was fixed and immunolabeled with CREST serum (B) and antibodies to Mad2 (C). (A) DIC image. (B) An immunofluorescence micrograph showing that kinetochores labeled normally with CREST serum after the treatment used to depolymerized microtubules after cell lysis. (C) An immunofluorescence micrograph showing Mad2 localization. Mad2 is found at the kinetochore that was unattached before treatment (bottom arrow), but is not present on previously attached kinetochores (top arrow). This demonstrates that Mad2 is not simply masked by microtubules bound to the kinetochore, but is lost after microtubule attachment. Bar, 5 μm.
Mad2 Leaves Attached Kinetochores As They Accumulate Microtubules
The kinetochores in mitotic PtK1 cells contain multiple microtubule binding sites (Brinkley and Cartwright, 1971). After their initial attachment to the spindle, kinetochores accumulate microtubules that form a bundle of microtubules known as a kinetochore fiber (McEwen et al., 1997). To better understand the relationship of Mad2 loss from kinetochores to kinetochore fiber formation, we triple-labeled mitotic PtK1 cells with antibodies to Mad2, antibodies to α-tubulin, and the DNA intercalating dye Hoechst 33342. Digital images were collected for each label, then overlaid and pseudocolored (Fig. 4).
Mad2 localizes to the nuclear envelope, but not kinetochores, during interphase and prophase (data not shown; Chen et al., 1996; Li and Benezra, 1996). We found that Mad2 began accumulating on PtK1 cell kinetochores (Fig. 4 A, white arrows) immediately after nuclear envelope breakdown, even while some residual nuclear envelope– associated Mad2 was still detectable along the chromosome arms (Fig. 4 A, white arrowhead). In prometaphase, Mad2 antibodies labeled unattached kinetochores brightly (Fig. 4, C and D, white arrows). The attached kinetochore on a mono-oriented chromosome was labeled weakly or not at all (Fig. 4 D, red arrow), whereas the unattached kinetochore that faced away from the spindle pole was brightly labeled (Fig. 4, C and D, white arrows). On chromosomes that had become bi-oriented and were congressing to the spindle equator, the newly attached leading kinetochores (Fig. 4 B, yellow arrows) labeled with Mad2 more brightly than the trailing kinetochores (Fig. 4 B, purple arrows). Leading kinetochores also had less-pronounced kinetochore fibers than trailing kinetochores (Fig. 4 B). Attached kinetochores on bi-oriented chromosomes at the metaphase plate had bright kinetochore fibers and little (Fig. 4 C, red arrow) or no (Fig. 4, B and D, green arrow) Mad2 labeling. In addition to kinetochore labeling, Mad2 was sometimes seen associated with spindle poles (Fig. 4 B, white arrowhead) and kinetochore microtubules (Fig. 4 C, white arrowhead). By late metaphase, Mad2 was not detectable on kinetochores (Fig. 4 E), and Mad2 was never seen on anaphase kinetochores (Fig. 4 F).
PtK1 Kinetochores at the Metaphase Plate Are Under Tension
We have previously shown that kinetochores attached to the spindle in mitotic newt lung cells are under tension (Waters et al., 1996_a_ ). That is, the centromere chromatin is stretched and the distance between sister kinetochores increases as microtubules interact with the kinetochores and poleward pulling forces are generated. To determine if this is also true for PtK1 cells, we fixed and processed cells for immunofluorescent labeling of kinetochores using CREST serum. We then collected Z-series optical sections of prophase and late metaphase cells, and measured interkinetochore distances as previously described (Waters et al., 1996_a_ ). During prophase, the nuclear envelope inhibits microtubules from interacting with kinetochores. Therefore, there are no poleward forces acting on prophase kinetochores and the distance between sister kinetochores on late prophase chromosomes can be considered the “rest length” (Waters et al., 1996_a_ ). In contrast, sister kinetochores on bi-oriented chromosomes are subject to opposing net poleward forces that could produce tension at the kinetochores and stretch the centromeric chromatin, increasing the distance between kinetochores. We found that the average interkinetochore distance in metaphase PtK1 cells was 3.6 μm (range = 2.4–4.7 μm; Fig. 5 E), whereas the interkinetochore rest length was 1.4 μm (range = 1.2–1.7 μm; Fig. 5 A and B; Table I). In fact, the interkinetochore distance was well above the range of the rest length for each of the 40 chromosomes we examined in 5 PtK1 metaphase cells (Fig. 5 E). Therefore, all kinetochores in PtK1 metaphase cells are under net tension.
Figure 5.

Tension at PtK1 metaphase cell kinetochores is reduced after treatment with 10 μM taxol. (A) A DIC micrograph of a control metaphase PtK1 cell. (B) A fluorescence micrograph of the same cell shown in A, showing kinetochores labeled with CREST serum. A pair of sister kinetochores are labeled with arrows. (C) A DIC micrograph of a metaphase PtK1 cell that was incubated in 10 μM taxol for 45 min before fixation. (D) A fluorescence micrograph of the same cell shown in C, showing kinetochores labeled with CREST serum. A pair of sister kinetochores are labeled with arrows. The distance between sister kinetochores in taxol-treated metaphase cells is shorter than in control cells. (E) A histogram depicting the distribution of distances between sister kinetochores in prophase, control metaphase, and taxol-treated metaphase cells. Sister kinetochores in prophase cells are “resting” (white). After sister kinetochores become properly attached to the spindle, net poleward forces stretch the centromere and generate tension on kinetochores (black). Taxol relieves this tension, decreasing the distance between sister kinetochores (gray). Stars over black bars indicate the distances measured between those sister kinetochore pairs in which Mad2 localized to one or both of the sisters (see Fig. 6; average = 1.7; n = 10). Bar, 10 μm.
Table I.
Interkinetochore Distances
| Average ± SD | Range | n | |
|---|---|---|---|
| μm | chromosomes/cells | ||
| Control prophase | 1.4 ± 0.1 | 1.2–1.7 | 33/5 |
| Control metaphase | 3.6 ± 0.5 | 2.4–4.7 | 40/5 |
| Taxol-treated metaphase | 1.7 ± 0.2 | 1.2–1.9 | 36/6 |
Taxol Treatment Decreases Tension at Kinetochores
We have previously shown that treatment of metaphase newt lung cells with 10 μM taxol for 45 min reduces centromere stretch to the rest length whereas kinetochores retain their kinetochore fibers (Waters et al., 1996_b_ ). To determine if taxol effects the amount of tension at the kinetochores in PtK1 cells, we treated cells with 10 μM taxol in media for 45 min at 37°C. We then fixed the cells and measured the distance between sister kinetochores in metaphase cells (36 chromosomes in 6 cells) as described above and in Waters et al_._ (1996_a_). We found that the average interkinetochore distance in taxol-treated metaphase cells was only 1.7 μm (range = 1.2–1.9 μm; Fig. 5, C–E; Table I), close to the rest length of 1.4 μm (range 1.2–1.7 μm). In fact, for each of the chromosomes we examined in taxol-treated cells, the interkinetochore distance was below the range of the interkinetochore distances in metaphase cells (Fig. 5 E). Therefore, treatment with taxol substantially reduces tension at all kinetochores in PtK1 cells.
Taxol-treated Metaphase Cells Have Mad2 Bound to at Least One but Not All Kinetochores
To see if Mad2 localizes to kinetochores in taxol-treated metaphase cells, we treated PtK1 cells with 10 μM taxol for 45 min at 37°C, and then fixed and immunofluorescently labeled the cells with antibodies to Mad2 and CREST serum. We then collected Z-series 0.5-μm optical sections (Waters et al., 1996_b_ ) of 35 metaphase cells. We identified metaphase cells as cells with all chromosomes tightly aligned at the spindle equator. By optically sectioning the cells in the Z direction, we were able to visualize all of the 22 kinetochores in each PtK1 cell (Fig. 6). We found that in metaphase cells treated with taxol for 45 min, Mad2 localized to at least one and up to six kinetochores, with an average of 2.6 kinetochores labeled in each cell (Fig. 6, E–H; Table II). Results for longer incubations in taxol were similar to 45-min treatments; even after cells had been arrested in taxol for 3 h, we found that Mad2 localized to at least one but not all kinetochores in each cell we examined (n = 15; Fig. 6 K). In fact, we never found a taxol-treated metaphase cell that did not have Mad2 on any kinetochores (Fig. 6 J). This result differs from untreated control cells processed for immunofluorescence and examined in the same manner. 42% of untreated metaphase cells did not have Mad2 on any kinetochores (see Fig. 4 E), with an average of 0.9 kinetochores labeled in each cell (range = 0–5; Table II).
Figure 6.

A comparison of 3f3/2 phosphorylation and Mad2 localization at kinetochores after taxol treatment. (A–H) Metaphase PtK1 cells treated with 10 μM taxol for 45 min before fixation. (A–D) A cell that was immunolabeled with CREST serum (B) and antibodies to the 3F3/2 phosphoepitope (C). (E-H) Cells that were immunolabeled with CREST serum (F) and antibodies to Mad2 (G). DIC images are shown in A and E, and digital color overlays of CREST (red) and Mad2 (H; green) or 3f3/2 (D; green) are shown. After taxol treatment, the 3F3/2 epitope is phosphorylated on all metaphase kinetochores (C and D), while Mad2 is found on some but not all kinetochores (G and H). (I) A histogram comparing the number of kinetochores under tension with 3f3/2 phosphorylation and Mad2 localization to kinetochores in untreated (white, U) and taxol-treated (10 μM for 45 min; black, T) metaphase cells. In untreated cells, all 22 kinetochores were under tension. Taxol treatment reduced tension at all kinetochores. Consistent with this, 3f3/2 was not phosphorylated on any kinetochores in untreated metaphase cells, but became rephosphorylated after tension was reduced with taxol. If Mad2 also responds to differences in tension at kinetochores, we would expect Mad2 to localize to all kinetochores after tension is reduced at all kinetochores with taxol. However, Mad2 only localized to an average of 2.6 kinetochores per metaphase cell after taxol treatment. (J) A histogram comparing the percentages of untreated and taxol-treated (10 μM for 45 min) metaphase cells that have no Mad2 on any kinetochores and that have Mad2 on at least one kinetochore. 42% of untreated metaphase cells had no detectable Mad2 labeling on any kinetochores. Presumably, these cells were close to anaphase onset. In the remaining 58%, Mad2 localized to at least one kinetochore. In contrast, Mad2 localized to at least one kinetochore in every taxol-treated cell we examined. This not only explains the slight increase in average number of kinetochores labeled with Mad2 after taxol-treatment, but it also demonstrates that there is a strong correlation between Mad2 localization to at least one kinetochore and the mitotic arrest. (K) A DIC (black and white) and Mad2 (red) overlay showing a metaphase PtK1 cell treated with 10 μM taxol for 3 h before fixation. Even after 3 h in taxol, Mad2 still localizes to at least one kinetochore.
Table II.
Mad2 Kinetochore Localization After Taxol Treatment
| Kinetochores undertension | Kinetochores labled with Mad2 | Kinetochores labeled with 3f3/2 | |
|---|---|---|---|
| Control metaphase | 100%* | 4% | 0%‡ |
| (22 per cell) | (0.9 per cell; n = 33) | ||
| Taxol-treated metaphase | 0%* | 12% | 100% |
| (2.6 per cell; n = 35) | (n = 8‡) |
We also treated PtK1 cells with 10 μM taxol for 45 min at 37°C, and then fixed and immunofluorescently labeled the cells for the phosphoepitope 3f3/2. Consistent with previous reports by Gorbsky and Ricketts (1993), we found that 3f3/2 was phosphorylated on all kinetochores in the 8 taxol-treated metaphase cells we examined (Fig. 6, A–D; Table II).
To maintain 3f3/2 phosphorylation during cell lysis, the phosphatase inhibitor microcystin must be added to the lysis buffer (Gorbsky and Ricketts, 1993). We do not use microcystin in our standard protocol for fixation of Mad2. Therefore, the 3f3/2 epitope becomes dephosphorylated during cell lysis when we process cells for Mad2 immunofluorescence. We worried that Mad2 localization to kinetochores after taxol treatment may depend on the phosphorylation state of the kinetochore, so we lysed cells in lysis buffer containing 100 nM microcystin and processed them for immunolabeling of Mad2 or 3f3/2. The addition of microcystin to the lysis buffer resulted in preservation of 3f3/2 phosphorylation at the kinetochore, but had no effect on Mad2 localization in control or taxol-treated cells (data not shown).
Mad2 Is Necessary for Maintenance of the Taxol-induced Mitotic Arrest
To confirm that 10 μM taxol arrests PtK1 cells in mitosis, we time-lapse recorded five taxol-treated metaphase cells. Consistent with previous reports (DeBrabander et al., 1986; Jordan et al., 1993; Rieder et al., 1994), we found that each of the cells remained in mitosis (as was determined by the presence of condensed chromosomes and a spindle, and the absence of a nuclear envelope) for at least 6 h.
Li and Benezra (1996) have shown that electroporation of antibodies to hsMad2 into tissue culture cells inhibits the mitotic arrest normally induced by nocodazole. Gorbsky et al. (1998) has shown that microinjection of the anti-Mad2 polyclonal antibodies described by Chen et al . (1996) into prometaphase PtK1 cells also results in premature anaphase onset (i.e., anaphase occurred before all kinetochores were attached to the spindle and aligned at the metaphase plate). To determine if our antibody had the same effect, we microinjected 14 prometaphase cells with 0.4 mg/ml affinity-purified polyclonal antibodies to Mad2. Microinjections with antibodies to Mad2 consistently caused premature anaphase onset (14 of 14 cells) in prometaphase cells (data not shown). Cells entered anaphase, as was determined by sister chromatid separation and movement poleward, an average of 12 min after microinjection with antibodies to Mad2 (range = 7–15 min) at 32°–34°C. The chromosomes in microinjected cells subsequently decondensed, the nuclear envelope reformed, and the cells attempted or finished cytokinesis.
To determine if Mad2 is necessary to maintain the taxol-induced mitotic arrest, we microinjected affinity-purified antibodies to XMad2 into seven prometaphase (Fig. 7, A–C) and seven metaphase (Fig. 7, D–F) PtK1 cells that had been incubated in 10 μM taxol for at least 45 min. Microinjection of antibodies to Mad2 consistently resulted in exit from mitosis (14 out of 14 cells; Fig. 7, A–F). Both taxol-treated prometaphase (range = 7–20 min) and metaphase (range = 11–13 min) cells exited mitosis an average of 12 min after microinjection at 32°–34°C. Taxol stabilizes spindle microtubules, blocks the assembly and disassembly of microtubules at the kinetochore, and prevents the majority of anaphase A and B (Waters et al., 1996_b_ ). Therefore, microinjection of antibodies to Mad2 into taxol-treated prometaphase or metaphase cells resulted in little to no chromosome movement. However, sister chromatid separation was still visible (see Fig. 7, B and E) and was used to determine when a cell exited mitosis. In addition, chromosomes always decondensed and the cells often began or completed cytokinesis (see Fig. 7, C and F). These events were never seen to occur in nearby taxol-arrested mitotic cells on the same coverslip (data not shown) or in control microinjected cells (Fig. 7, G–I), demonstrating that the cells injected with antibodies to Mad2 overcame the taxol-induced arrest and exited mitosis.
Figure 7.
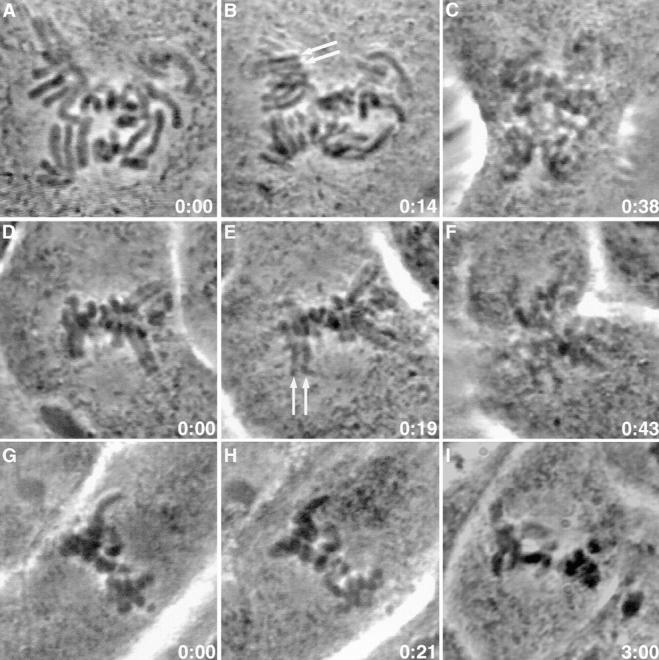
Microinjection of Mad2 antibodies overcomes taxol-induced mitotic arrest. (A–I) Phase micrographs of PtK1 cells treated with 10 μM taxol for at least 45 min before microinjection. Time is shown in h:min after microinjection. (A) A taxol-treated prometaphase cell seconds before microinjection with antibodies to Mad2. (B) 14 min later, sister chromatids have visibly separated (arrows). (C) By 38 min, chromosomes are decondensing and cytokinesis has begun. (D) A taxol-treated metaphase cell seconds before microinjection with antibodies to Mad2. (E) 19 min later, sister chromatids have visibly separated (arrows). (F) By 43 min, chromosomes are decondensing and cytokinesis has begun. (G) A taxol-treated metaphase cell seconds before microinjection with antibodies to Mad2 that had been pre-blocked with antigen. (H and I) Even after 3 h, the cell is still arrested in mitosis.
We performed several control microinjections. We microinjected three untreated prometaphase and three taxol-arrested metaphase PtK1 cells with buffer that had flowed through the Microcon filter during antibody concentration. We also microinjected three untreated prometaphase (data not shown) and five taxol-arrested metaphase (Fig. 7, G–I) cells with antibodies to Mad2 that had been pre-blocked with Mad2 antigen for 1 h at room temperature. None of these control microinjections had any visible effect (i.e., untreated cells finished mitosis normally and taxol-treated cells remained arrested in mitosis for at least 2 h). To be sure that room temperature incubation or dilution was not decreasing the reactivity of the antibody, we mixed the same volume ratio of buffer without antigen to antibody and then incubated for 1 h at room temperature. Each of the three prometaphase cells we microinjected with incubated antibody entered anaphase prematurely (data not shown).
Microinjected Antibodies to XMad2 Localize to All Kinetochores
To determine where the microinjected antibodies to XMad2 localized, we filmed both control (data not shown) and taxol-treated (Fig. 8 B) cells that were microinjected with antibodies to XMad2 until premature anaphase onset occurred (12–18 min after injection). We then quickly removed the coverslip from the viewing chamber and processed the cells for immunofluorescence. The cells were labeled with an anti–rabbit secondary antibody (no additional primary antibody was used) to visualize the distribution of the microinjected Mad2 antibodies (Fig. 8 C). The kinetochores were also labeled with CREST serum (Fig. 8 D). We collected 0.5-μm Z-series optical sections, which allowed us to identify all of the kinetochores in each cell. We found that, after 12–18 min, the microinjected Mad2 antibodies had accumulated on all kinetochores of each of the control prometaphase and metaphase cells, (n = 3; data not shown) and taxol-treated metaphase cells (n = 5; Fig. 8, C and D) that we examined. Antibodies against Mad2 added to Xenopus M-phase egg extracts also accumulate on kinetochores (Chen, R.H., and A.W. Murray, unpublished results).
Figure 8.
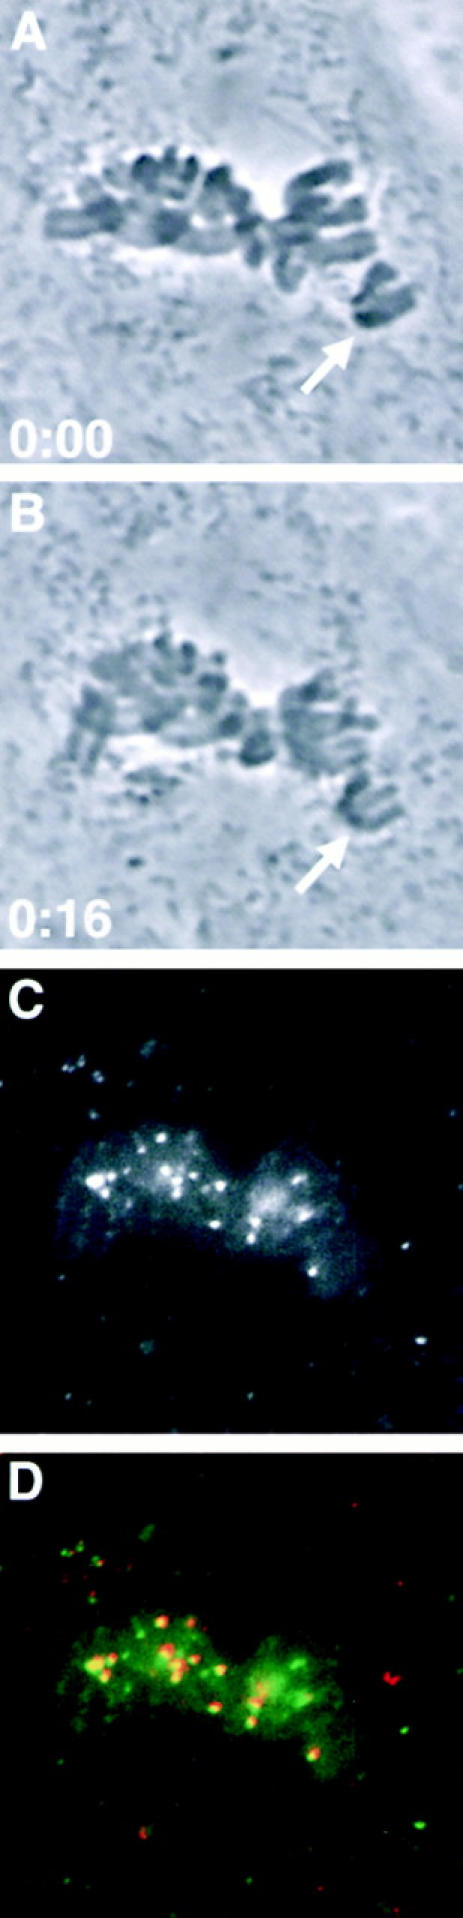
Microinjected Mad2 antibodies localize to both attached and unattached kinetochores. Phase images of a prometaphase PtK1 cell treated with 10 μM taxol for 45 min before microinjection. Time is shown in h:min. (A) Seconds before microinjection with antibodies to Mad2. (B) 16 min later, sister chromatids have visibly separated (arrows in A and B). (C) Localization of microinjected antibodies to Mad2. (D) Microinjected antibodies to Mad2 (green) colocalize with kinetochores labeled with CREST serum (red).
The approximate intracellular concentration of Mad2 antibodies after microinjection is 20–40 μg/ml (5–10% the concentration of antibodies in the injection needle), whereas we generally use ∼4 μg/ml Mad2 antibodies for immunofluorescence. Therefore, a possible explanation for the above results is that at higher concentrations, Mad2 antibodies localize to attached kinetochores. We lysed and fixed PtK1 cells, and processed them for immunofluorescence using ∼40 μg/ml Mad2 antibodies. We found that whereas the background fluorescence in the cytoplasm increased, Mad2 localized to unattached but not attached kinetochores (data not shown). It should be also noted that whereas cells at 32°–34°C were injected with antibodies and fixed only ∼12–18 min after microinjection, the cells processed for immunofluorescence were treated with antibodies for 45 min at 34°C.
Discussion
Mad2 Loss from Kinetochores Correlates with Accumulation of Kinetochore Microtubules
We wanted to carefully document the relationship between Mad2 loss from kinetochores and kinetochore fiber formation (Fig. 4). McEwen et al. (1997) used same cell video light microscopy/serial sectioning EM to meticulously count the numbers of microtubules bound to the kinetochore at different stages of chromosome attachment to the mitotic PtK1 spindle. Their results show that during congression to the spindle equator, the trailing kinetochore always has at least twice as many kinetochore microtubules as the newly attached, leading sister kinetochore. Our immunofluorescence images of kinetochore microtubules in prometaphase cells are consistent with these results; we found that trailing kinetochores were usually bound to a brighter, denser kinetochore fiber than their leading sister kinetochore (Fig. 4 B). Images of cells labeled with antibodies to both Mad2 and tubulin show that kinetochores with little or no Mad2 labeling are bound to bright, dense kinetochore fibers, and vice versa. McEwen and colleagues (1997) also found that some metaphase kinetochores have not acquired their full complement of microtubules. We found that 4% of kinetochores showed Mad2 labeling in control metaphase cells (Table II). In addition, McEwen et al. (1997) reported that the average number of kinetochore microtubules increases in anaphase, and we found that Mad2 is never present on anaphase kinetochores in control cells (Fig. 4 F). These data suggest that Mad2 localization to kinetochores decreases as the number of microtubules bound to the kinetochore increases.
Mad2 Does Not Accumulate at Attached Kinetochores After Loss of Tension
Chromatin is elastic (Nicklas, 1988; Alexander and Rieder, 1991; Houchmandzadeh et al., 1997). Therefore, a stretch across the centromeric chromatin, measured as an increase in the distance between bi-oriented sister kinetochores, indicates that the kinetochores are under tension. In this report we show metaphase kinetochores in PtK1 cells are under tension, and that treatment with taxol relieves that tension.
We exploited the fact that taxol treatment reduces tension at kinetochores, without dramatically decreasing the average number of kinetochores microtubules (McEwen et al., 1997), to determine the structural cue recognized when Mad2 selectively binds kinetochores. After taxol treatment, none of the kinetochores are under tension (Table II; Fig. 5 E). Therefore, if Mad2 binds to kinetochores that are not under tension, one would expect to see Mad2 bound to all kinetochores after taxol treatment. However, if Mad2 binds to kinetochores that lack microtubules, one would expect to see little Mad2 bound to kinetochores after taxol treatment. Consistent with this logic, 3f3/2, which has been shown to become dephosphorylated after tension is applied to kinetochores, becomes rephosphorylated on all kinetochores after tension is relieved by taxol treatment (Figs. 6 D, and 8; Gorbsky and Ricketts, 1993). However, Mad2 only binds to a very small fraction of kinetochores after tension at kinetochores is reduced with taxol treatment (Fig. 6, I and J). These data demonstrate that reduced tension at kinetochores is not sufficient to induce Mad2 to bind to kinetochores.
Mad2 Localizes to at Least One Kinetochore in All Taxol-arrested Cells
Taylor and McKeon (1997) overexpressed the kinetochore-binding domain of the murine homologue of Bub1 in tissue culture cells. This peptide localized to kinetochores, and presumably inhibited endogenous Bub1 from binding to kinetochores. These data strongly suggest that Bub1 must interact with kinetochores to get normal activation of the spindle checkpoint. These experiments have not yet been done for Mad2, but our findings predict a similar result. We found that 42% of untreated metaphase cells do not have Mad2 on any kinetochores (Fig. 6, I and J). Presumably, these cells were close to anaphase onset at the time of fixation. However, each of the taxol-treated metaphase cells we examined had Mad2 on at least one kinetochore (Fig. 6, I and J). These data show that there is a strong correlation between Mad2 localization to kinetochores and mitotic arrest.
Why does Mad2 bind to a few kinetochores after taxol treatment? We offer two possible explanations. McEwen et al. (1997) found that taxol increases the range of numbers of microtubules bound to the kinetochore without dramatically changing the average number. This means that whereas some kinetochores have more kinetochore microtubules after taxol treatment, others have less. Therefore, after taxol treatment, Mad2 may bind to those kinetochores that have lost microtubules. Alternatively, taxol may arrest only those cells that never acquired a complete complement of microtubules and therefore have Mad2 on at least one kinetochore.
Mad2 Is Necessary for Maintenance of the Taxol-induced Cell Cycle Arrest
The drug taxol is routinely and effectively used to treat breast, ovarian, lung, and other cancers. However, the molecular mechanisms by which taxol prevents cell proliferation are not understood. Jordan et al_._ (1993) proposed that the taxol-induced mitotic arrest occurs concurrent with a decrease in microtubule dynamics. We have previously shown that, initially taxol preferentially inhibits kinetochore microtubule plus end assembly and disassembly without affecting minus end dynamics (Waters et al., 1996_b_ ). As the drug accumulates in the cell over time, dynamics at the minus end are also suppressed. It is only after dynamics at both kinetochore microtubule ends are suppressed that tension at the kinetochore is relieved (Waters et al., 1996_b_ ). Therefore, the taxol-induced decrease in tension at the kinetochore is likely to be a consequence of the decrease in microtubule dynamics.
The stabilizing effect of taxol on microtubules probably also leads to the increase in the range of numbers of microtubules bound to the kinetochore (McEwen et al., 1997). Kinetochore microtubules in untreated PtK1 cells turnover with a t 1/2 ≈ 5–7 min (Cassimeris et al., 1990; Zhai et al., 1995). Under normal conditions of kinetochore microtubule turnover, lost kinetochore microtubules are replaced when the kinetochore captures a dynamic polar microtubule. As the concentration of taxol in the cell increases and the microtubules become stabilized, kinetochore microtubules that are lost are probably less likely to be replaced. Therefore, we propose that taxol treatment signals a mitotic arrest because (a) tension at the kinetochore is lost, causing 3f3/2 phosphorylation, and (b) microtubules are lost or not acquired by some kinetochores, causing Mad2 to accumulate at those kinetochores.
3f3/2 and Mad2
Consistent with data that 3f3/2 becomes dephosphorylated when kinetochores are placed under tension (Nicklas et al., 1995), our results show that 3f3/2 becomes rephosphorylated after tension is relieved with taxol (Figs. 5 and 7). Microinjection of antibodies against 3f3/2 has been shown to block dephosphorylation and result in a metaphase arrest (Campbell and Gorbsky, 1995). This suggests that removal of the 3f3/2 epitope is required to progress to anaphase, or that binding of the 3f3/2 antibody sterically inhibits some step required to promote anaphase. The effect of 3f3/2 antibody injection on Mad2 is not known; Mad2 may localize to kinetochores when 3f3/2 dephosphorylation is prevented by antibody injection. This would place 3f3/2 phosphorylation upstream of Mad2 binding, and the spindle checkpoint would thereby monitor both tension and attachment in the same pathway.
Mad2 Binds Transiently to Attached Kinetochores
The accumulation of microinjected antibodies to Mad2 on attached kinetochores (Fig. 8) is in striking contrast to observations that Mad2 is not found on the majority of attached kinetochores when localized with standard immunofluorescence (Fig. 4). This suggests that Mad2 interacts transiently with attached kinetochores, and that microinjected antibodies prevent dissociation of Mad2 from kinetochores. Mad2 may transiently bind to attached kinetochores as microtubule-binding sites are exposed during kinetochore microtubule turnover (Zhai et al., 1995). In addition, because each antibody binds two Mad2 proteins, antibody bound to one Mad2 at the kinetochore may recruit another Mad2 from the cytoplasmic pool.
These results also show that Mad2 does not have to physically leave the kinetochore for anaphase onset to occur. Instead, our microinjected antibodies probably block interaction of Mad2 with other molecules necessary for signaling inhibition of anaphase, such as homologues of Cdc20 (Hwang et al., 1998) or components of the Anaphase Promoting Complex (He et al., 1997; Li et al., 1997).
Acknowledgments
We thank Dr. G. Gorbsky (UVA, Charlottesville, VA) for sharing unpublished results and for antibodies to 3f3/2, and Drs. A. Desai and T. Mitchison (Harvard) for CREST serum. J.C. Waters (UNC) thanks C. Waterman-Storer (UNC) for expert advice on expression and purification of recombinant proteins, and antibody affinity purification. We also thank Drs. K. Bloom (University of North Carolina, Chapel Hill, NC), A. Desai, G. Gorbsky, B. Nicklas (Duke University, Durham, NC), C. Rieder (Wadsworth Center, Albany, NY), A. Straight (Harvard Medical School, Cambridge, MA), and C. Waterman-Storer for stimulating discussions and helpful suggestions.
Footnotes
This work was supported, in part, by National Institutes of Health (NIH) grant GM-24364 to E.D. Salmon and grants from NIH and the Packard Foundation to A.W. Murray.
Address all correspondence to J.C. Waters, Biology Department, University of North Carolina, Chapel Hill, NC 27599-3280. Tel.: (919) 962-2354. Fax: (919) 962-1625. E-mail: jwaters@email.unc.edu
R.-H. Chen's present address is Biochemistry Molecular and Cell Biology Department, Cornell University, Ithaca, NY 14850.
References
- Alexander SP, Rieder CL. Chromosome motion during attachment to the vertebrate spindle: Initial saltatory-like behavior of chromosomes and quantitative analysis of force production by nascent kinetochore fibers. J Cell Biol. 1991;113:805–815. doi: 10.1083/jcb.113.4.805. [DOI] [PMC free article] [PubMed] [Google Scholar]
- Brinkley BR, Cartwright J. Ultrastructural analysis of mitotic spindle elongation in mammalian cells in vitro: Direct microtubule counts. J Cell Biol. 1971;93:33–48. doi: 10.1083/jcb.50.2.416. [DOI] [PMC free article] [PubMed] [Google Scholar]
- Brues AM, Cohen A. Effects of colchicine and related substances on cell division. Biochem J. 1936;30:1363–1368. doi: 10.1042/bj0301363. [DOI] [PMC free article] [PubMed] [Google Scholar]
- Cassimeris L, Rieder CL, Rupp G, Salmon ED. Stability of microtubule attachment to metaphase kinetochores in PtK1 cells. J Cell Sci. 1990;96:9–15. doi: 10.1242/jcs.96.1.9. [DOI] [PubMed] [Google Scholar]
- Campbell MS, Gorbsky GJ. Microinjection of mitotic cells with the 3F3/2 anti-phosphoepitope antibody delays the onset of anaphase. J Cell Biol. 1995;129:1195–1204. doi: 10.1083/jcb.129.5.1195. [DOI] [PMC free article] [PubMed] [Google Scholar]
- Chen R-H, Waters JC, Salmon ED, Murray AW. Association of spindle assembly checkpoint component XMad2 with unattached kinetochores. Science. 1996;274:242–246. doi: 10.1126/science.274.5285.242. [DOI] [PubMed] [Google Scholar]
- DeBrabander M, Geuens G, Nuydens R, Willenbrords R, Aerts F, DeMey J. Microtubule dynamics during the cell cycle: effects of taxol and nocodazole on the microtubule system of PtK2 cells at different stages on the mitotic cycle. Int Rev Cytol. 1986;101:215–274. doi: 10.1016/s0074-7696(08)60250-8. [DOI] [PubMed] [Google Scholar]
- Gorbsky GJ, Ricketts WA. Differential expression of a phosphoepitope at the kinetochores of moving chromosomes. J Cell Biol. 1993;122:1311–1321. doi: 10.1083/jcb.122.6.1311. [DOI] [PMC free article] [PubMed] [Google Scholar]
- Gorbsky, G.J., R.-H. Chen, and A.W. Murray. 1998. Microinjection of antibody to Mad2 protein into normal mammalian cells in mitosis induces premature anaphase. 141:1193–1205. [DOI] [PMC free article] [PubMed]
- He X, Patterson TE, Sazer S. The Schizosaccharomyces pombespindle checkpoint protein mad2p blocks anaphase and genetically interacts with the anaphase-promoting complex. Proc Nat Acad Sci USA. 1997;94:7965–7970. doi: 10.1073/pnas.94.15.7965. [DOI] [PMC free article] [PubMed] [Google Scholar]
- Houchmandzadeh B, Marko JF, Chatenay D, Libchaber A. Elasticity and structure of eukaryote chromosomes studied by micromanipulation and micropipette aspiration. J Cell Biol. 1997;139:1–12. doi: 10.1083/jcb.139.1.1. [DOI] [PMC free article] [PubMed] [Google Scholar]
- Hoyt MA, Trotis L, Roberts BT. S. cerevisiaegenes required for cell cycle arrest in response to loss of microtubule function. Cell. 1991;66:507–517. doi: 10.1016/0092-8674(81)90014-3. [DOI] [PubMed] [Google Scholar]
- Hwang LH, Lau LF, Smith DL, Mistrot CA, Hardwick KG, Hwang ES, Amon A, Murray AW. Budding yeast Cdc20: a target of the spindle checkpoint. Science. 1998;279:1041–1044. doi: 10.1126/science.279.5353.1041. [DOI] [PubMed] [Google Scholar]
- Jordan MA, Toso RJ, Thrower D, Wilson L. Mechanism of mitotic block and inhibition of cell proliferation by taxol at low concentrations. Proc Natl Acad Sci USA. 1993;90:9552–9556. doi: 10.1073/pnas.90.20.9552. [DOI] [PMC free article] [PubMed] [Google Scholar]
- Li R, Murray AW. Feedback control of mitosis in budding yeast. Cell. 1991;66:519–531. doi: 10.1016/0092-8674(81)90015-5. [DOI] [PubMed] [Google Scholar]
- Li X, Nicklas RB. Mitotic forces control a cell-cycle checkpoint. Nature. 1995;373:630–632. doi: 10.1038/373630a0. [DOI] [PubMed] [Google Scholar]
- Li Y, Benezra R. Identification of a human mitotic checkpoint gene: hsMad2. Science. 1996;274:246–248. doi: 10.1126/science.274.5285.246. [DOI] [PubMed] [Google Scholar]
- Li Y, Gorbea C, Mahaffey D, Rechsteiner M, Benezra R. MAD2 associates with the cyclosome/anaphase-promoting complex and inhibits its activity. Proc Natl Acad Sci USA. 1997;94:12431–12436. doi: 10.1073/pnas.94.23.12431. [DOI] [PMC free article] [PubMed] [Google Scholar]
- McEwen BF, Heagle AH, Cassels GO, Buttle KF, Rieder CL. Kinetochore fiber maturation in PtK1cells and its implication for the mechanisms of chromosome congression and anaphase onset. J Cell Biol. 1997;137:1567–1580. doi: 10.1083/jcb.137.7.1567. [DOI] [PMC free article] [PubMed] [Google Scholar]
- McIntosh, J.R. 1991. Structural and mechanical control of mitotic progression. Cold Spring Harbor Symp. Quant. Biol. 56_:_613–619. [DOI] [PubMed]
- Mitchison TJ, Salmon ED. Poleward kinetochore fiber movement occurs during both metaphase and anaphase-A in newt lung cell mitosis. J Cell Biol. 1992;119:569–582. doi: 10.1083/jcb.119.3.569. [DOI] [PMC free article] [PubMed] [Google Scholar]
- Nicklas RB. The forces that move chromosomes in mitosis. Annu Rev Biophys Biophys Chem. 1988;17:431–449. doi: 10.1146/annurev.bb.17.060188.002243. [DOI] [PubMed] [Google Scholar]
- Nicklas RB. How cells get the right chromosomes. Science. 1997;275:632–637. doi: 10.1126/science.275.5300.632. [DOI] [PubMed] [Google Scholar]
- Nicklas RB, Ward SC, Gorbsky GJ. Kinetochore chemistry is sensitive to tension and may link mitotic forces to a cell cycle checkpoint. J Cell Biol. 1995;130:929–939. doi: 10.1083/jcb.130.4.929. [DOI] [PMC free article] [PubMed] [Google Scholar]
- Rieder CL, Salmon ED. Motile kinetochores and polar ejection forces dictate chromosome position on the vertebrate mitotic spindle. J Cell Biol. 1994;124:223–233. doi: 10.1083/jcb.124.3.223. [DOI] [PMC free article] [PubMed] [Google Scholar]
- Rieder CL, Schultz A, Cole R, Sluder G. Anaphase onset in vertebrate somatic cells is controlled by a checkpoint that monitors sister kinetochore attachment to the spindle. J Cell Biol. 1994;127:1301–1310. doi: 10.1083/jcb.127.5.1301. [DOI] [PMC free article] [PubMed] [Google Scholar]
- Rieder CL, Cole RW, Khodjakov A, Sluder G. The checkpoint delaying anaphase in response to chromosome monoorientation is mediated by an inhibitory signal produced by unattached kinetochores. J Cell Biol. 1995;130:941–948. doi: 10.1083/jcb.130.4.941. [DOI] [PMC free article] [PubMed] [Google Scholar]
- Rudner AD, Murray AW. The spindle assembly checkpoint. Curr Opin Cell Biol. 1996;8:773–780. doi: 10.1016/s0955-0674(96)80077-9. [DOI] [PubMed] [Google Scholar]
- Spencer F, Hieter P. Centromere DNA mutations induce a mitotic delay in Saccharomyces cerevisiae. . Proc Natl Acad Sci USA. 1992;89:8909–8912. doi: 10.1073/pnas.89.19.8908. [DOI] [PMC free article] [PubMed] [Google Scholar]
- Taylor SS, McKeon F. Kinetochore localization of murine Bub1 is required for normal mitotic timing and checkpoint response to unattached kinetochores. Cell. 1997;89:727–735. doi: 10.1016/s0092-8674(00)80255-x. [DOI] [PubMed] [Google Scholar]
- Wang Y, Burke DJ. Checkpoint genes required to delay cell division in response to nocodazole respond to impaired kinetochore function in yeast Saccharomyces cerevisiae. . Mol Cell Biol. 1995;15:6834–6844. doi: 10.1128/mcb.15.12.6838. [DOI] [PMC free article] [PubMed] [Google Scholar]
- Waterman-Storer CM, Holzbaur ELF. The product of the Drosophila Gene, Glued, is the functional homologue of the p150glued component of the vertebrate dynactin complex. J Biol Chem. 1996;271:1153–1159. doi: 10.1074/jbc.271.2.1153. [DOI] [PubMed] [Google Scholar]
- Waters JC, Skibbens RV, Salmon ED. Oscillating mitotic newt lung cell kinetochores are, on average, under tension and rarely push. J Cell Sci. 1996a;109:2823–2831. doi: 10.1242/jcs.109.12.2823. [DOI] [PubMed] [Google Scholar]
- Waters JC, Mitchison TJ, Rieder CL, Salmon ED. Kinetochore microtubule poleward flux produces a force that can do work. Mol Biol Cell. 1996b;7:1547–1558. doi: 10.1091/mbc.7.10.1547. [DOI] [PMC free article] [PubMed] [Google Scholar]
- Wells WAE, Murray AW. Aberrantly segregating centromeres activate the spindle assembly checkpoint in budding yeast. J Cell Biol. 1996;133:75–84. doi: 10.1083/jcb.133.1.75. [DOI] [PMC free article] [PubMed] [Google Scholar]
- Zhai Y, Kronebusch PJ, Borisy GG. Kinetochore microtubule dynamics and the metaphase-anaphase transition. J Cell Biol. 1995;131:721–734. doi: 10.1083/jcb.131.3.721. [DOI] [PMC free article] [PubMed] [Google Scholar]