Translational Diffusion of Macromolecule-sized Solutes in Cytoplasm and Nucleus (original) (raw)
Abstract
Fluorescence recovery after photobleaching (FRAP) was used to quantify the translational diffusion of microinjected FITC-dextrans and Ficolls in the cytoplasm and nucleus of MDCK epithelial cells and Swiss 3T3 fibroblasts. Absolute diffusion coefficients (D) were measured using a microsecond-resolution FRAP apparatus and solution standards. In aqueous media (viscosity 1 cP), D for the FITC-dextrans decreased from 75 to 8.4 × 10⁻⁷ cm2/s with increasing dextran size (4–2,000 kD). D in cytoplasm relative to that in water (D/Do) was 0.26 ± 0.01 (MDCK) and 0.27 ± 0.01 (fibroblasts), and independent of FITC-dextran and Ficoll size (gyration radii [RG] 40–300 Å). The fraction of mobile FITC-dextran molecules (fmob), determined by the extent of fluorescence recovery after spot photobleaching, was >0.75 for RG < 200 Å, but decreased to <0.5 for RG > 300 Å. The independence of D/Do on FITC-dextran and Ficoll size does not support the concept of solute “sieving” (size-dependent diffusion) in cytoplasm. Photobleaching measurements using different spot diameters (1.5–4 μm) gave similar D/Do, indicating that microcompartments, if present, are of submicron size. Measurements of D/Do and fmob in concentrated dextran solutions, as well as in swollen and shrunken cells, suggested that the low fmob for very large macromolecules might be related to restrictions imposed by immobile obstacles (such as microcompartments) or to anomalous diffusion (such as percolation). In nucleus, D/Do was 0.25 ± 0.02 (MDCK) and 0.27 ± 0.03 (fibroblasts), and independent of solute size (RG 40–300 Å). Our results indicate relatively free and rapid diffusion of macromolecule-sized solutes up to approximately 500 kD in cytoplasm and nucleus.
The physical structure of cell cytoplasm has been a topic of long-standing interest (for review see Clegg, 1984; Mastro and Keith, 1984; Porter, 1984; Luby-Phelps, 1994). The initial descriptions of cytoplasm were in terms of a viscous gelatinous mass without internal structure. However, it has become clear that cytoplasm contains dissolved solutes and macromolecules in a complex array of microtubules, actin, and intermediate filaments organized into a lattice-like mesh. Popular pictorial representations of the aqueous environment within cells (as those by Goodsell based on measured solute concentrations; Goodsell, 1991) suggest that the crowding might seriously hinder solute diffusion (Fulton, 1982)—a major determinant of metabolism (Welch and Easterby, 1994), transport phenomena, signaling, and cell motility.
As more advanced biophysical techniques have been applied to study the physical state of cytoplasm, the notion is emerging that the cytoplasm is more like a bag of slightly viscous water than a complex gelatinous mass, at least with respect to solute diffusion. One parameter that describes cytoplasmic rheology is “fluid-phase viscosity,” defined as the microviscosity sensed by a small solute in the absence of interactions with macromolecules and organelles (Fushimi and Verkman, 1991). Although initial estimates of this parameter suggested relatively high values (4–100 cP, 1 cP is viscosity of water; for review see Verkman, 1991), more recent measurements of the rotation of small solutes by time-resolved fluorescence anisotropy (Fushimi and Verkman, 1991) indicated that cytoplasmic fluid-phase viscosity in a variety of mammalian cell types (1.1–1.4 cP) is similar to that of water. The same conclusion was reached by an independent approach involving ratio imaging of a viscosity-sensitive fluorescent probe (Luby-Phelps et al., 1993). Low fluid-phase viscosity was also found in the aqueous compartment of the nucleus (Fushimi and Verkman, 1991) and in the thin layer of cytoplasm adjacent to the cell plasma membrane (Bicknese et al., 1993).
For transport of small solutes such as metabolites and nucleic acids, a more important parameter describing cytoplasmic rheology is the translational diffusion coefficient. Kao et al. (1993) measured the translational mobility of a small fluorescent probe (BCECF) in the cytoplasm of Swiss 3T3 fibroblasts using fluorescence recovery after photobleaching (FRAP).1 Instrumentation and calibration procedures were developed for accurate measurement of intracellular solute diffusion coefficient. BCECF translational diffusion in cytoplasm was approximately four times slower than in water. Three independently acting factors were identified that accounted quantitatively for the fourfold slowed diffusion: (a) slowed diffusion in fluid-phase cytoplasm, (b) probe binding to intracellular components, and (c) probe collisions with intracellular components. The latter factor, probe collisions, was determined to be the principal diffusive barrier that slowed the translational diffusion of small solutes. The resistance to diffusion because of cytoplasmic solids was determined from BCECF diffusion coefficients measured as a function of cell volume. The exponentially increasing resistance to BCECF diffusion with decreasing cell volume was modeled to give the cytoplasmic content of cell solids and the resistance to diffusion imposed by the solids. Recently, BCECF translational diffusion in membrane-adjacent cytoplasm was measured by total internal reflection-FRAP to be about twofold lower than that in bulk cytoplasm (Swaminathan et al., 1996), suggesting slowed diffusion resulting from the high density of proteins near the cell membrane.
In earlier studies (Luby-Phelps et al., 1986, 1987), spot photobleaching was used to measure the translational diffusion of larger solutes: microinjected, fluorescently labeled dextrans and Ficolls. As dextran or Ficoll molecular size was increased, diffusion in cytoplasm progressively decreased relative to that in water, suggesting a cytoplasmic “sieving” mechanism that was proposed to involve the skeletal mesh. The possibility of solute sieving was supported by diffusion measurements in concentrated artificial solutions containing F-actin and albumin (Hou et al., 1990). If correct, such a sieving mechanism would have important implications concerning the restricted movement of macromolecule-sized solutes in the cytoplasm.
The original purpose of the study here was to use the quantitative approach developed by Kao et al. (1993) to define the determinants of mobility of macromolecule-sized solutes in cell cytoplasm. Based on the prior work by Luby-Phelps and colleagues mentioned above, it was anticipated that size-dependent sieving of FITC-dextrans would be found. Our plan was to confirm and extend these observations by: (a) comparing the sieving properties of epithelial cells vs fibroblasts, (b) determining whether cytoplasmic sieving required an intact actin cytoskeleton, (c) testing whether solute sieving occurred in nucleoplasm, and (d) developing a quantitative model of sieving from data on the cell volume dependence of solute diffusion. Contrary to expectations, sieving was not found in fibroblasts or epithelial cells for solutes of apparent molecular size to at least 500 kD. An important result was that the translational diffusion of large solutes in cytoplasm and nucleus was slowed three- to fourfold relative to their diffusion in water, similar to results for diffusion of a small (∼0.5 kD), metabolite-sized solute (Kao et al., 1993). Taken together with our previous studies of the mobility of small solutes (Fushimi and Verkman, 1991; Kao et al., 1993; Bicknese et al., 1993; Swaminathan et al., 1996), the results here do not support the view that cytoplasm and nucleus are so crowded that solute motion is seriously impeded.
Materials and Methods
Chemicals
FITC-dextrans (average molecular sizes 4, 10, 20, 40, 70, 150, 580, and 2,000 kD) were purchased from Sigma Chemical Co. (St. Louis, MO) or Molecular Probes (Eugene, OR). Nonfluorescent dextrans (T4, T70, T500, and T2000) and Ficolls (T70 and T400), as well as Sepharose CL-6B, were purchased from Pharmacia Fine Chemicals (Piscataway, NJ). All other chemicals were from Sigma Chemical Co.
Fluorescent Labeling of Ficolls
Ficolls T70 and T400 were activated and labeled with FITC by a modification of the method of Inman (1975). 650 mg of Ficoll was dissolved in 9 ml of freshly prepared 1.35 M sodium chloroacetate (pH 7). After addition of 2.5 ml of 10 N NaOH, the reaction mixture was incubated at 25°C for 3 h. The reaction was terminated by addition of 0.1 ml of 2 M NaH2PO4 and titration to pH 7 with 6 N HCl. The product was dialyzed against water, lyophilized, and resuspended in 25 ml water. 3.3 g of ethylenediamine dihydrochloride followed by 650 mg of 1-ethyl-3-(3-dimethylaminopropyl) carbodiimide hydrochloride was added and the mixture was stirred at 25°C while maintaining a pH of 4.7. The resultant amino-Ficoll was dialyzed extensively and lyophilized. 500 mg of amino-Ficoll was dissolved in 10 ml of cold 100 mM NaHCO3 buffer, pH 8.2, 78 mg of FITC was added, and the mixture was warmed to 20°C and stirred for 3 h. The FITC-Ficoll was dialyzed extensively and lyophilized.
Size Fractionation of FITC-dextrans and FITC-Ficolls
70 mg of FITC-Ficoll (17.5 mg/ml) was loaded on a 3 × 100 cm column of Sepharose CL-6B equilibrated in 20 mM Tris, pH 8.0, 50 mM KCl, and 0.02% NaN3 (buffer A). The column was eluted with buffer A and 5-ml fractions were collected. Two fractions from the T70 Ficoll (fractions a and b) and two from the T400 Ficoll (fractions c and d) were dialyzed three times against water and lyophilized. FITC-dextrans (17.5 mg/ml) were loaded on a 3 × 50-cm column of Sepharose CL-6B equilibrated with buffer A. The column was eluted with buffer A, 5-ml fractions were collected, and the peak fractions corresponding to ∼30% of the starting material were pooled, dialyzed against water, and lyophilized. The size-fractionated FITC-dextrans and FITC-Ficolls were then subjected to a second round of size fractionation on a 3 × 50-cm column as described above.
Cell Culture
MDCK cells (ATCC CCL 34, passages 52–58; American Type Culture Collection, Rockville, MD) and Swiss 3T3 fibroblasts (ATCC CL-101, passages 60–80; American Type Culture Collection) were cultured on 18-mm-diam round glass coverslips in DME-H21 medium supplemented with 5% FCS, penicillin (100 U/ml), and streptomycin (100 μg/ml). Cells were grown at 37°C in 95% air/5% CO2 and used 1–2 d after plating at which time they were ∼80% confluent. After microinjection and incubation, coverglasses containing cell layers were mounted in a perfusion chamber that was positioned on the microscope stage.
Cell Microinjection
Solutions for microinjection consisted of calcium-free PBS containing 20– 40 mg/ml FITC-dextran or FITC-Ficoll. Solutions were centrifuged (10,000 g for 10 min) to remove particulate matter. Microinjection was performed using an Eppendorf 5170 micromanipulator and 5242 microinjector (Eppendorf North America, Inc., Madison, WI). Glass needles were drawn from thin-walled filament capillaries (FHC, Brunswick, ME) with a vertical needle puller (Kopf, Tujunga, CA). Cells (generally ∼250 cells injected on each coverglass, ∼50% injections intranuclear) were microinjected with ∼4 fL of solution at an injection pressure of 120 kilopascals over 0.5 s. Slight bulging of the cell membrane was generally observed during the injection by phase-contrast microscopy.
Fluorescence Recovery after Photobleaching
The output of an argon ion laser (488 nm, Innova 70-4; Coherent Inc., Palo Alto, CA) was modulated by serial acoustooptic modulators and directed by coated mirrors (99.2% reflectivity at 488 nm) onto the stage of an inverted epifluorescence microscope (Diaphot; Nikon Inc., Garden City, NY) (Fig. 1). The microscope was also equipped for full-field epiillumination (halogen light source, 470 ± 20-nm interference filter) to visualize all cells to target the focused laser beam. The full-field and laser beams were reflected by a dichroic mirror (510 nm) onto the sample by an objective lens (Nikon ×20 dry, NA 0.75, unless otherwise specified). Laser beam intensity was modulated by two acoustooptic modulators (rise time ∼1.5 μs) in series using 2-mm-diam pinholes to isolate first order beams (Kao and Verkman, 1996). For most experiments, the laser beam power was set to 50–100 mW (488 nm) and the attenuation ratio (the ratio of bleach to probe beam intensity) was set to 5,000–15,000.
Figure 1.

Schematic of the photobleaching apparatus. The laser beam is modulated by acoustooptic modulators (AOM 1 and AOM 2) and fluorescence is recorded from a focused spot using a photomultiplier that is gated off during the photobleaching pulse. See Materials and Methods for details.
Sample fluorescence was filtered by serial barrier (glass OG 515; Schott Corp., Yonkers, NY) and interference (530 ± 15 nm) filters and detected by a photomultiplier (9828A; Thorn EMI Electron Tubes, Inc., Rockaway, NJ) contained in a cooled housing (FACT50; Thorn EMI Electron Tubes, Inc.). Photomultiplier signals were amplified by a transimpedance amplifier and digitized at 1 MHz using a 14-bit analog-to-digital converter. A gating circuit that controlled the voltage of the second dynode was used to decrease photomultiplier gain during the photobleaching pulse. The instrument response time was <50 μs. Beam modulation, photomultiplier gating, and data collection were software controlled. Signals were sampled before the bleach (generally 103 data points in 100 ms) and over three different time intervals after the bleach: high resolution data (1 MHz sampling rate) over 10–100 ms, low resolution data (generally 104 points) over 0.1–10 s, and “final signal” data (103 points) at a specified late time. High and low resolution data were binned into 200 points each for storage and analysis. Generally, in solution studies, data from five individual FRAP experiments were averaged for each stored recovery curve; in cell studies, each recovery curve was obtained from a different spot.
Photobleaching Recovery Measurements
For measurements in aqueous solutions, specified microliter solution volumes were “sandwiched” between two coverslips to produce aqueous layers of known uniform thickness. For cell measurements, the lower coverglass contained the cultured cells (facing upward). FRAP measurements were performed 4–6 h after microinjection to permit cell recovery. Beam intensity and attenuation ratio were adjusted to produce <30% bleaching and to avoid photobleaching by the probe beam. For experiments in which cell volume was changed, cell were exposed to hypoosmolar (150 mosM, 1:1 PBS/water) or hyperosmolar (450 mosM, PBS containing 150 mM sucrose) buffer for 10 min; total internal reflection fluorescence measurements (Farinas et al., 1995) showed sustained cell swelling (150 mosM) and shrinking (450 mosM) under these conditions. In some experiments, the cell bathing solution was saturated with oxygen by bubbling with 100% oxygen for 15 min and maintaining the cell chamber in an oxygen atmosphere (Swaminathan et al., 1996). Unless otherwise specified, measurements were done at 23°C in a temperature-controlled darkroom; studies at 37°C were done with a heated stage with feedback temperature control.
Analysis of FRAP Data
As described by Kao et al. (1993), fluorophore diffusion coefficients (D) were determined from recovery t1/2 using standards consisting of thin (2–10 μm) layers of 1 mM fluorescein in water-glycerol solutions of specified viscosity (glycerol concentration measured by refractometry). The t1/2 value was determined as the time after the bleach pulse when the fluorescence was equal to the mean of the fluorescence just after the bleach and when essentially all recovery occurred (postbleach). The fluorescence just after the bleach was determined operationally as the average fluorescence at 50–75 μs after the end of the bleach. The postbleach fluorescence was generally determined as the average fluorescence at a time equal to 25– 100 t1/2 intervals; as discussed below, the postbleach signal remained essentially constant beyond ∼25 t1/2 intervals. The percentage recovery was computed from pre- and postbleach fluorescence and the percentage bleaching. t1/2 was computed using a quadratic polynomial fitted to a small interval of the recovery curve surrounding an estimated half-time that was computed from an initial exponential regression of the full recovery curve.
Confocal Microscopy
Microinjected cells were visualized using a Nipkow wheel confocal microscope (Leitz with coaxial-confocal attachment [Technical Instruments, San Francisco, CA]) and cooled CCD camera detector (Photometrics Ltd., Tucson, AZ) as described previously (Seksek et al., 1995). Cells were viewed using a ×60 oil immersion objective (NA 1.4) with a z-resolution of ∼1 μm.
Results
Characterization of FITC-labeled Dextrans and Ficolls
Photobleaching measurements were first carried out in aqueous solutions containing unconjugated fluorescein and the FITC-dextrans and FITC-Ficolls used for subsequent measurements in cells. The representative photobleaching curves in Fig. 2 A show nearly complete recovery of fluorescence back to the initial signal level (range for percentage recovery 98–101%), as expected for photobleaching in homogeneous aqueous solutions. The recovery time course was slowed with increasing fluorophore molecular size. As described previously (Kao et al., 1993), the recovery t1/2 was taken as a quantitative measure of fluorophore translational diffusion. The use of a single parameter t1/2 to describe the recovery curve formally requires that the curve shape be the same for each compound. Fig. 2 B shows that, after scaling each curve in the time direction (to account for different diffusion rates), recovery curve shapes were essentially the same as that for fluorescein. These results also indicate that the size-fractionated FITC-dextrans and FITC-Ficolls are fairly homogeneous in size. Experiments done with singly size-fractionated FITC-dextrans and FITC-Ficolls also showed essentially identical curve shapes and t1/2 values; however, curve shapes were different for large unfractionated FITC-dextrans (not shown) because of contamination by smaller dextrans.
Figure 2.

Photobleaching recovery measurements on aqueous solutions of FITC-dextrans and Ficolls. (A) Recovery curves for fluorescein (0.1 mM) and indicated FITC-dextrans and Ficolls (4 mg/ml) in PBS at 23°C. Bleach time was 0.5 ms, solution layer thickness was 5 μm, and the ×20 objective lens was used. Final fluorescence (at 10 s) was 98–101% of initial (prebleach) fluorescence. (B) Curves shown in A were scaled in time and amplitude to compare shape. Identical dashed curves are shown overlying each data curve to facilitate visual comparison. (C) Averaged recovery half-times (t1/2, mean ± SEM, n = 15–25) for FITC-dextrans and Ficolls. Purchased FITC-dextrans (molecular sizes indicated) and synthesized FITC-Ficolls were size fractionated twice (see Materials and Methods). Gyration radii (RG) were computed according to Luby-Phelps et al. (1986) and a measured fluorescein diffusion coefficient of 2.6 × 10⁻⁶ cm2/s from the relation, RG (in Å) = 2.74 t1/2 (in ms).
Fig. 2 C shows the t1/2 values for each of the FITC-labeled dextrans and Ficolls. Diffusion coefficients and gyration radii (righthand axis) were computed from t1/2 values for each of the compounds as was done by Luby-Phelps et al. (1986) (see figure legend). The gyration radius (RG) provides a measure of effective solute size, recognizing that complexities of nonspherical solute shape are lost with a single parameter description. For this reason studies were done with the two available types of noninteracting molecules: dextrans, which have some asymmetry, and the more spherical Ficolls. Subsequent plots will use RG to denote macromolecule size, with different symbols denoting data obtained with FITC-dextrans and FITC-Ficolls.
Macromolecule Diffusion in Cytoplasm
The procedures used to measure fluorophore diffusion in aqueous solutions were applied to study FITC-dextran and FITC-Ficoll diffusion in MDCK cells. Cells were microinjected with FITC-dextran solutions and incubated for 4–6 h at 37°C before photobleaching measurements. As seen by confocal microscopy in Fig. 3 A, only the cytoplasm or nucleus was stained in cells microinjected with FITC-dextrans of >70 kD. For smaller FITC-dextrans that pass through nuclear pores, both the cytoplasm and nucleus were labeled (Fig. 3 B). The confocal micrographs showed mild heterogeneity in FITC-dextran labeling throughout the cytoplasm and nucleus at the ∼0.5-μm x,y-resolution obtainable by light microscopy. Some dye-excluding compartments were observed for the larger FITC-dextrans as found previously in fibroblasts (Luby-Phelps et al., 1986; Provance et al., 1993), but no vesicular staining was seen. The inset in Fig. 3 A shows a wide-field epifluorescence micrograph of a cell at lower magnification as visualized in the photobleaching measurements. The laser probe beam (bright dot indicated by arrow) was directed to a spot in the cytoplasm. For these photobleaching studies, the bleached volume was generally <2% of the cytoplasmic or nuclear volume, and little fluorophore diffusion occurred during the brief bleach pulse.
Figure 3.


Micrographs of labeled MDCK cells. (A) Cell cytoplasm or nucleus was microinjected with 580-kD FITC-dextran as described in Materials and Methods. Confocal micrographs (z-resolution ∼1 μm) were obtained using a ×60 oil objective (N.A. 1.4) and cooled CCD camera detector. (Inset) Low magnification (×20) wide-field micrograph showing laser spot (arrow). (B) Confocal micrograph of MDCK cells microinjected with 20-kD FITC-dextran. (C) Size-exclusion chromatograms of FITC-dextran (70 kD) and FITC-Ficoll (fraction c) before (filled circles) vs after (open circles, dashed lines) remaining in cytoplasm for 6 h. No change in size distribution was found. Bars, 20 μm.
To determine whether degradation or metabolism of FITC-dextrans or FITC-Ficolls occurred under the conditions of our experiments, size-exclusion chromatography was done on fresh vs cytoplasm-exposed dye. Cytoplasm was loaded by a 5-min incubation with 10 mg/ml FITC-dextran (70 kD) or FITC-Ficoll (fraction c) while gently rocking in the presence of 425–600-nm-diam glass beads (McNeil and Warder, 1987). Cells were homogenized after 6 h and the soluble fraction was subject to size-exclusion chromatography on Sepharose CL-6B. Representative chromatograms in Fig. 3 C show no change in FITC-dextran or FITC-Ficoll size after a 6-h exposure to cytoplasm.
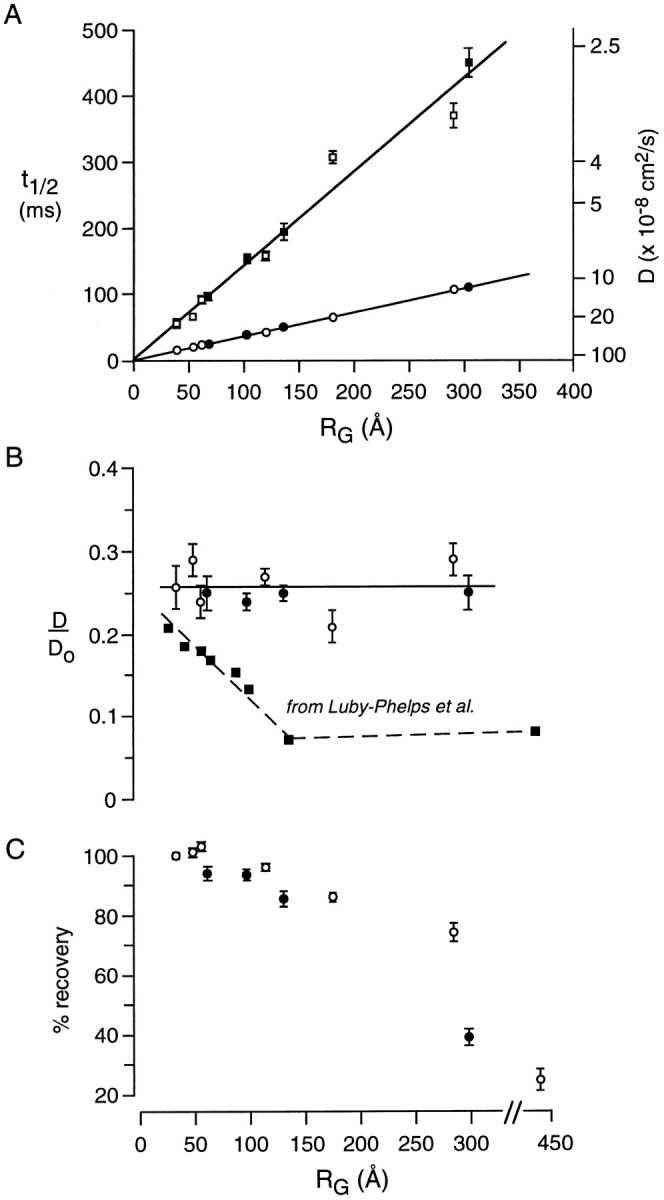
Fig. 4 A shows representative photobleaching recovery curves for FITC-dextrans and FITC-Ficolls in cytoplasm of MDCK cells. Compared with the photobleaching data obtained in aqueous solutions (Fig. 2 A), the recoveries were slower and incomplete, particularly for the 2,000-kD FITC-dextran. Fig. 4 B shows that the shape of recovery curves (shown for small and large macromolecules) was essentially the same as that for fluorescein (same dashed curve as in Fig. 2 B). Data from a large set of measurements are summarized in Fig. 4 C as t1/2 (D, mobile dye; righthand axis) vs gyration radius, RG. The recovery half-times increased approximately linearly; however, the slope of the t1/2 vs RG plot was increased about fourfold for FITC-dextran and FITC-Ficoll diffusion in cytoplasm compared with that in aqueous solution (shown for comparison). Fig. 4 D shows the ratio of solute diffusion in cells vs aqueous solutions (D/Do) as a function of solute size. Although FITC-dextran and FITC-Ficoll diffusion in MDCK cell cytoplasm was significantly slower than that in aqueous solutions, D/Do did not depend on dextran size: there was no evidence of size-dependent solute sieving. This result does not agree with the findings of Luby-Phelps et al. (1986, 1987) for FITC-labeled dextrans and Ficolls in cytoplasm of Swiss 3T3 fibroblasts, where D/Do decreased continuously by a factor of 5 for increasing molecular size. Fig. 4 E shows that fluorescence recovery was >75% complete for dextrans and Ficolls of RG <300 Å. The little recovery found for the 2,000-kD FITC-dextran and FITC-Ficoll fractions with RG >400 Å (not shown) did not permit accurate determination of the diffusion coefficients of the mobile fraction. The phenomenon of incomplete photobleaching recovery is investigated further below.
Figure 4.

Photobleaching recovery measurements of FITC-dextran and Ficoll diffusion in MDCK cell cytoplasm. (A) Representative spot photobleaching recovery data (0.5 ms bleach time, ×20 objective) for cells microinjected with indicated FITC-dextrans and Ficolls. Cells were incubated for 4–6 h at 37°C before measurements done at 23°C. (B) Curves shown in A were scaled in time and amplitude to compare shape. Identical dashed curves over each experimental curve are the same as in Fig. 2 B. (C) Dependence of recovery half-time (t1/2) and deduced diffusion coefficient (D) on gyration radius. Each point is the mean ± SEM for 30–45 independent measurements done with FITC-dextrans (open circles) and FITC-Ficolls (filled circles). For comparison, the t1/2 vs RG data are shown for diffusion in aqueous solutions (from Fig. 2 C). (D) Ratio of the relative FITC-dextran diffusion coefficient in cells to that in aqueous solution (D/ Do) as a function of RG. (E) Percentage fluorescence recovery as a function of RG.
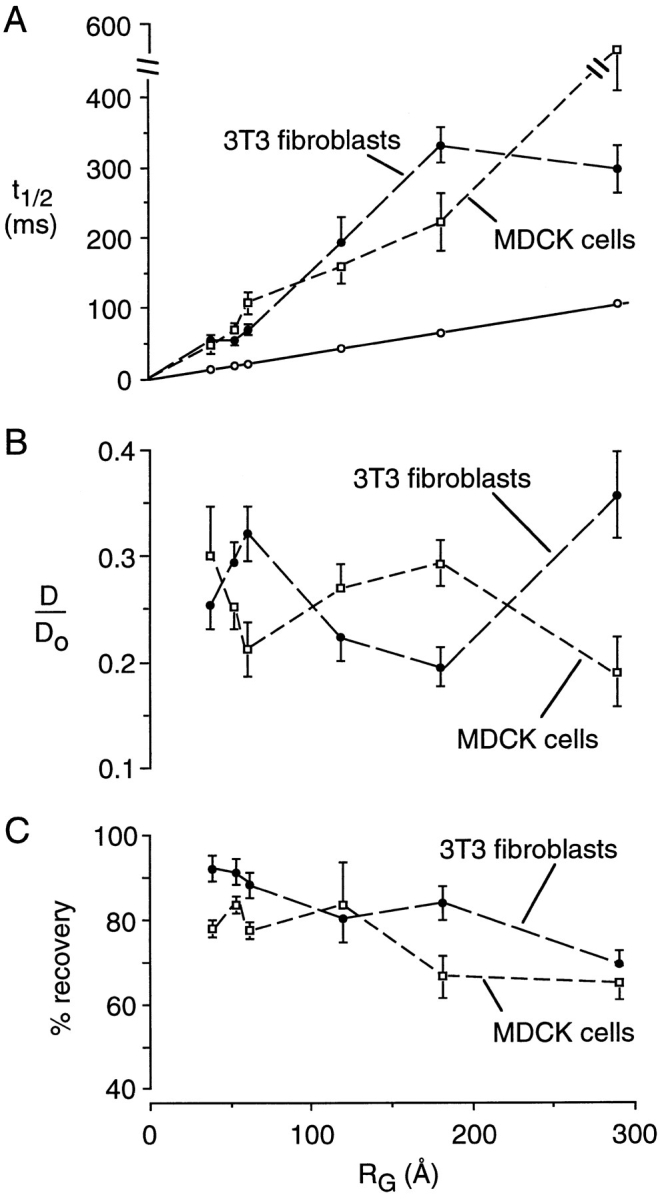
To determine whether the absence of size-dependent solute sieving is a cell-specific finding, similar measurements were carried out in Swiss 3T3 fibroblasts, the same cell type studied by Luby-Phelps et al. (1986, 1987). In general, we found that microinjection was technically easier for the fibroblasts and the data had less variability. Fig. 5 A shows a nearly linear dependence of t1/2 on RG for FITC-dextran and FITC-Ficoll diffusion in cytoplasm. The relative FITC-dextran diffusion coefficient in cytoplasm vs aqueous solutions (D/Do) was similar to that in MDCK cells and again independent of solute molecular size (Fig. 5 B). For comparison, the data reported by Luby-Phelps et al. (1986) for FITC-dextran diffusion in the cytoplasm of Swiss 3T3 fibroblasts are shown (see Discussion). Fig. 5 C shows that the percentage fluorescence recovery is decreased for very large solutes as was found in Fig. 4 E for MDCK cells. In the Luby-Phelps et al. (1986, 1987) studies, the reported percentage recovery values were ∼100% for FITC-dextrans and FITC-Ficolls of RG <200 Å, decreasing to 84 and 64% for FITC-Ficolls of 227 and 248 Å, respectively. In Fig. 5 C, the decreased recovery of the FITC-Ficoll compared with the FITC-dextran at RG ∼280 Å may be related to the more spherical shape of the Ficoll.
Figure 5.
Photobleaching recovery measurements of FITC-dextran and Ficoll diffusion in cytoplasm of Swiss 3T3 fibroblasts. Measurements were carried out as in Fig. 4. (A) Dependence of recovery half time (t1/2) and deduced diffusion coefficient (D) on RG. Each point is the mean ± SEM for 30–45 independent measurements done with FITC-dextrans (open circles) and FITC-Ficolls (filled circles). For comparison, the t1/2 vs RG line data are shown for diffusion in aqueous solutions. (B) Ratio of the relative FITC-dextran diffusion coefficient in cells to that in aqueous solution (D/Do) as a function of RG. For comparison, data from Luby-Phelps et al. (1986) are plotted on the same scale. (C) Percentage fluorescence recovery as a function of RG.
Reversible FITC-dextran Photobleaching at 37°C
The measurements in Figs. 2, 4, and 5 were carried out at 23°C in cells incubated for 4–6 h at 37°C after microinjection. To determine whether the temperature at the time of measurement could account for the differences between the data here and the results of Luby-Phelps et al. (1986, 1987), experiments were done at 37°C. Fig. 6 shows recovery curves for 3T3 fibroblasts microinjected with the 580-kD FITC-dextran. The recovery curve at 23°C (top curve) is similar to that shown for MDCK cells in Fig. 4 A. However, after warming the same cells to 37°C, the same bleach pulse produced more photobleaching and a remarkably faster recovery (second curve), with a t1/2 many times less than that for the same FITC-dextran in aqueous solution. To determine whether the recovery was related to FITC-dextran translational diffusion, photobleaching was carried out on the same cells using a ×40 objective in place of the ×20 objective lens. It was predicted that if the fluorescence recovery was related to translational diffusion, then t1/2 would be 3–4 smaller with the ×40 objective because of the smaller spot size (see Fig. 8 A below). However the t1/2 was unchanged (Fig. 6, third curve from top). The fast recovery at 37°C, the independence of t1/2 on spot size, and the increased bleach depth suggested reversible photobleaching, a process that we characterized recently for fluorescein photobleaching in air-saturated viscous solutions and cells (Periasamy et al., 1996; Swaminathan et al., 1996) and for photobleaching of the green fluorescent protein (Swaminathan et al., 1997). If triplet state relaxation is responsible for the fast recovery at 37°C, then it was predicted that 100% oxygen should accelerate triplet state relaxation so that it would be unobservably fast and only the irreversible bleach process would be observable (Periasamy et al., 1996). Fig. 6 (bottom curve) shows that 100% oxygen remarkably slowed recovery, giving a t1/2 only ∼30% less than that at 23°C. The recovery after 100% oxygen was strongly dependent on spot size (not shown). A reversible photobleaching process was also observed for the 20-kD FITC-dextran in cytoplasm at 37°C. There was no effect of 100% oxygen on the fluorescence recovery kinetics for the 20- and 580-kD FITC-dextrans in cytoplasm at 23°C. These results indicate the existence of a reversible photobleaching process for FITC-dextrans in cytoplasm at 37°C in which fluorescence recovery is rapid and unrelated to solute translational diffusion; an unrecognized reversible photobleaching process could have influenced the interpretation of previous similar studies (see Discussion). The reversible bleach process was not observed at 23°C so that subsequent measurements were done only at 23°C.
Figure 6.

Reversible photobleaching of FITC-dextran in cytoplasm of Swiss 3T3 fibroblasts at 37°C. Spot photobleaching experiments were done in cells microinjected with 580-kD FITC-dextran (RG 291 nm). Measurements were made as indicated at 23°C vs 37°C, in solutions equilibrated with air vs 100% O2, and with the ×20 vs ×40 objectives.
Figure 8.
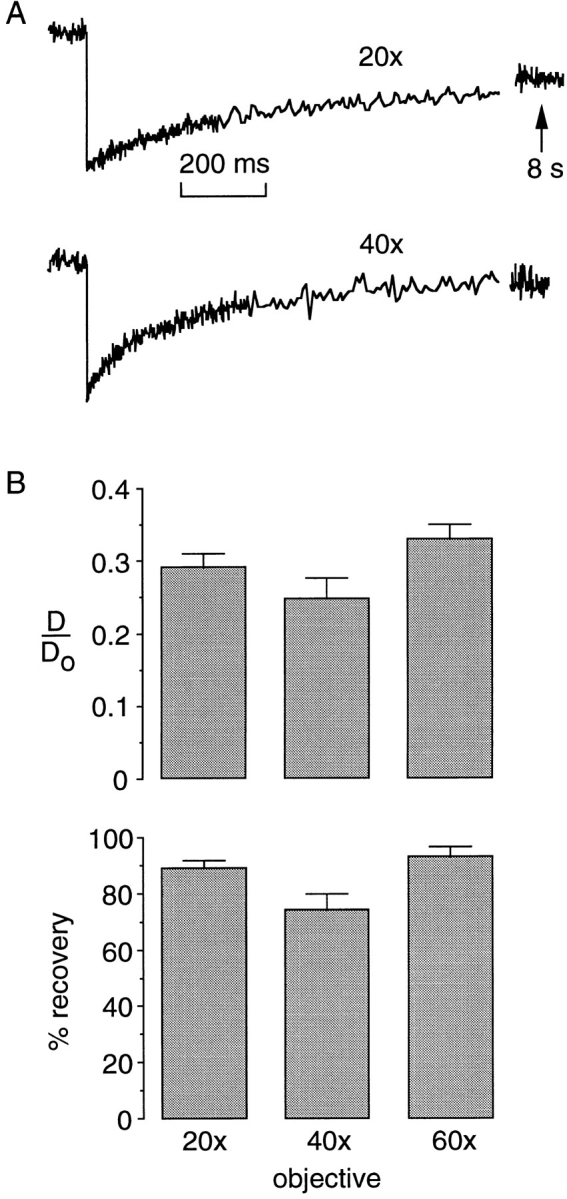
Effect of spot size on apparent solute diffusion. (A) Representative photobleaching recovery curves for MDCK cells microinjected in the cytoplasm with 580-kD FITC-dextran. (B) Relative diffusion in cytoplasm vs water (D/Do) and percentage recoveries shown (n = 4). Objective lenses were: ×20 (dry, N.A. 0.75), ×40 (dry, N.A. 0.55), and ×60 (oil, N.A. 1.4). Bleach times were 1 (×20), 0.5 (×40), and 0.2 ms (×60).
Characterization of Partial Fluorescence Recovery
The incomplete recovery in photobleaching experiments has been attributed to a lack of mobility of a fraction of dye molecules because of microcompartmentation or irreversible immobilization. Recently, for photobleaching studies of membrane proteins, an alternative explanation for incomplete recovery has been proposed based on anomalous subdiffusion (Feder et al., 1996). We conducted several types of experiments to investigate the low percentage recovery for the largest solutes, including measurements in concentrated dextran solutions, in swollen and shrunken cells, and in cells using different bleach beam intensities, beam spot sizes, and recovery time acquisitions.
To determine whether mobile macromolecular solutes could affect the percentage recovery, the translational diffusion of various FITC-dextrans was measured in solutions containing (unlabeled) dextrans of different sizes (40, 70, 500, 2,000 kD), each at a concentration of 15% vol. Kao et al. (1993) reported that diffusion of fluorescein in 15% vol dextran was slowed about threefold compared with that in water, and that the magnitude of slowing did not depend on dextran size. The percentage recovery for photobleaching of FITC-dextrans in the dextran solutions was consistently >97%, suggesting that simple mobile obstacles in the concentration range studied here cannot account for the incomplete fluorescence recovery in cells. Fig. 7 A shows the dependence of FITC-dextran diffusion coefficient on the size of unlabeled dextran. Diffusion of the smallest FITC-dextran (4 kD) did not depend on the size of the larger unlabeled dextrans, in agreement with the paradigm that it is the concentration but not the size of large obstacles that determines the diffusion coefficient of a smaller fluorescent probe (Phillies, 1987, 1989; Furakawa et al., 1991). Diffusion of the larger FITC-dextrans was slowed with increased size of the unlabeled dextrans; the dependence showed a saturation phenomenon in which diffusion became independent of dextran size when the size of the unlabeled dextran was large relative to the FITC-dextran. In cells (Figs. 4 D and 5 B), it was found that D/Do for the FITC-dextrans was ∼0.26 and independent of dextran size. From the results in artificial dextran solutions in Fig. 7 A, it is concluded that the effective concentration of “obstacles” in cytoplasm is just under 15%, and that the effective size of the obstacles is >∼70 kD.
Figure 7.

Influence of cell volume on diffusion of FITC-dextrans in MDCK cell cytoplasm. (A) Photobleaching of FITC-dextrans in 5-μm solution films containing 15% vol unlabeled dextran (10 mg/ ml). Recovery t1/2 as a function of the size of the nonfluorescent dextran. (B) MDCK cells were microinjected with FITC-dextrans, incubated for 4–6 h, and then subjected to photobleaching measurements after a 5–20-min incubation in PBS (300 mosM), PBS diluted 1:1 with water (150 mosM), and PBS containing 150 mM sucrose (450 mosM). Bleach time was 1 ms and the ×20 objective lens was used. Representative recovery curves for 580- and 2,000-kD FITC-dextran and indicated solution osmolalities. (C) Dependence of percentage recovery on RG. (D) Dependence of D/Do on RG.
Another possible explanation for the incomplete fluorescence recovery is light-induced covalent interaction of the FITC-dextrans with immobile intracellular components. We think that this explanation is unlikely because of the high percentage recovery for the smaller FITC-dextrans and FITC-Ficolls, and because a covalent complex should not exclude unbleached FITC-dextran molecules from entering the bleached zone. Photobleaching measurements were carried out on MDCK cells at 6 h after microinjection with the fraction d FITC-Ficoll. For bleach depths of 16 and 44%, the percentage recoveries were 56 and 59% (each ±3%). The results did not depend upon whether the bleach depth was varied by changing bleach beam intensity or bleach time (0.1–1 ms), suggesting that the incomplete recovery is not due to photochemical reaction(s) and/or light-induced alterations of various intracellular components.
In our prior photobleaching study of BCECF diffusion in cell cytoplasm (Kao et al., 1993), analysis of recovery kinetics as a function of cell volume provided quantitative information about the characteristics of the diffusive barrier imposed by cell solids. Similar experiments were carried out for diffusion of FITC-dextran in the cytoplasm of MDCK cells. After microinjection and incubation for 6 h, photobleaching measurements were made on cells bathed in PBS (300 mosM), PBS diluted 1:1 with water (150 mosM), and PBS containing excess 150 mM sucrose (450 mosM). If incomplete fluorescence recovery is due to a percolation phenomena (Almeida and Vaz, 1995) or to the presence of apparent “submicroscopic compartments” in which solute diffusion is restricted, then it is predicted that the percentage recovery would increase with cell swelling and decrease with cell shrinkage. If diffusion of the mobile fraction of FITC-dextran is restricted by cell solids (as was the case for BCECF), then it is predicted that FITC-dextran diffusion (D/Do) would increase with cell swelling because of the decreased concentration of solids, and would correspondingly decrease with cell shrinkage. Quantitative values for percentage recovery and D/Do permit the testing of various models as described below.
Fig. 7 B shows representative recovery curves for the 580- and 2,000-kD FITC-dextrans in MDCK cell cytoplasm. Interestingly, cell shrinking (450 mosM) was associated with a remarkable decrease in percentage recovery for the 580-kD dextran. Cell swelling (150 mosM) was associated with an increase in percentage recovery for the 2,000-kD dextran, where little recovery was found under isosmolar conditions. The results of a series of measurements are summarized in Fig. 7, C and D. Averaged D/Do values for FITC-dextran diffusion were 0.66 (150 mosM), 0.26 (300 mosM), and 0.20 (450 mosM), and independent of FITC-dextran size. The 2.5-fold increase in D/Do for the swollen cells and the 0.77-fold decrease in shrunken cells are similar to corresponding values of 4 and 0.6 reported for BCECF diffusion in 3T3 fibroblasts that were swollen and shrunken to the same extent (Kao et al., 1993). The dependence of D/Do on cell volume supports the view that the change in FITC-dextran diffusion results from a change in the concentration of dissolved cytoplasmic solids.
The data above suggest that the aqueous phase of cytoplasm does not sieve solutes with sizes up to at least 500 kD, but might contain microcompartments that restrict solute diffusion. A potentially more plausible explanation that does not require the presence of distinct microcompartments is anomalous subdiffusion (Saxton, 1994), where the diffusion coefficient of a particular solute molecule is time dependent because of diffusion into regions of differing viscous properties. Anomalous subdiffusion has been proposed to account for some photobleaching results for membrane components (Feder et al., 1996), where lateral diffusion is orders of magnitude slower than that predicted for simple lipid membranes. Because anomalous diffusion models do not involve distinct subcompartments that restrict solute diffusion, it is predicted that fluorescence recovery will continue to occur, albeit slowly, even over a time scale of 10–10,000 (or more) t1/2. For MDCK cells containing fraction d FITC-Ficoll in the cytosol, t1/2 was ∼450 ms and the fraction recovery (at 10 s, ∼22 t1/2 intervals) was 0.58 (Fig. 4 E). Measurements were done to determine whether the percentage recovery changed over the interval 10–240 after bleaching. Averaged percentage recovery values were: 0.59 (10 s), 0.56 (60 s), and 0.56 (240 s) (n = 3). Similar studies for the 2,000-kD FITC-dextran also showed no significant fluorescence recovery between 10 and 240 s. In these studies the probe beam was turned off after the bleach pulse until the late measurement time to ensure no photobleaching by the probe beam. The absence of further recovery at late times does not provide evidence for an anomalous subdiffusion model for solute translational movement in cells; however, recovery over very long times (up to 105 t1/2) could not be studied because of mechanical instrument drift and laser beam drift/ fluctuations. Although extremely slow recovery could formally be described in terms of anomalous subdiffusion or percolation, such recovery has also been classified as “long-tail” kinetics (Nagle, 1992).
If FITC-dextran residence in fixed microcompartments is responsible for the incomplete recovery, and if the sizes of the putative diffusion-restricting compartments are as large as ∼1 μm, then the percentage recovery might depend upon laser beam spot size. Spot size was varied from ∼4 to ∼1.5 μm by using different objective lenses from ×20 to ×60 magnification. Experiments were carried out with MDCK cells containing the 580-kD FITC-dextran. Fig. 8 A shows representative recovery curves. With decreasing spot size, the recovery became faster (decreased t1/2) as expected (Fig. 8 A). However, neither D/Do nor the percentage fluorescence recovery was affected significantly by spot size. These findings indicate that solute diffusion is relatively rapid and unrestricted over regions of the cell at least on the order of ∼4 μm. The independence of apparent diffusion on spot size is in marked contrast with photobleaching results in biological membranes, where microcompartmentation, corralling, and anomalous diffusion effects have been postulated.
Macromolecule Diffusion in Nucleus
Fig. 9 summarizes spot photobleaching measurements of 3T3 fibroblasts and MDCK cells in which the nucleus was microinjected (or cytoplasm microinjected for the smaller dextrans that diffuse across nuclear pores). Although more variability in the data was found than in that for cytoplasm, the results indicate that macromolecule diffusion in the nucleus is about fourfold slower than in aqueous solutions. There was no systematic dependence of D/Do on solute size and the percentage of fluorescence recovery decreased slightly with increasing solute size.
Figure 9.
Photobleaching recovery measurements of FITC-dextran diffusion in nuclei of MDCK cells and Swiss 3T3 fibroblasts. Experiments were done as in Figs. 4 and 5 after intranuclear injection of FITC-dextrans. (A) Dependence of t1/2 on FITC-dextran RG. For comparison, the t1/2 vs RG data are shown for diffusion in aqueous solutions. (B) Dependence of D/Do on RG. (C) Dependence of percentage recovery on RG.
Discussion
Photobleaching studies were conducted to measure the translational diffusion of macromolecule-sized solutes in the cytoplasm and nucleus of fibroblasts and MDCK cells. As described in the introduction, this work followed from our previous measurements of the rotational and translational mobility of small, metabolite-sized solutes in bulk and membrane-adjacent cytoplasm and nucleus. The results here indicate that the translational diffusion of FITC-dextrans and FITC-Ficolls is slowed three- to fourfold in cytoplasm and nucleus compared with water. The degree of slowing did not depend on molecular size up to at least a 300-Å gyration radius. A large macromolecule of ∼500 kD size would have a diffusion coefficient of ∼2.5 × 10⁻⁸ cm2/s in cytoplasm. If significant binding of the macromolecule to slowly diffusing cytoplasmic components does not occur, then the diffusive transit time to move across a 10-μm cell would be only ∼7 s. Our results indicate that this transit time would be dramatically slower for larger macromolecules or in shrunken cells, such as tubular epithelial cells exposed to strong osmotic gradients in the renal medulla.
The results in Swiss 3T3 fibroblasts were different from previous work by Luby-Phelps et al. (1986). Both studies used the same cell type, and similar microinjection procedures and incubation times after microinjection. Our microinjections involved high pressure and very thin glass capillary needles as used previously to microinject 70-nm-diam liposomes into cells and to maintain cell viability (Seksek et al., 1995). Differences in the studies involved primarily the instrumentation, analytical procedures, and measurement temperature. Our experiments were carried out with a microsecond-resolution FRAP apparatus using acoustooptic modulators that ensured precise overlap of probe and bleach beams without alignment. Each data point generally represented the average of >30 sets of measurements, each consisting of averaged recovery curves from greater than five different spots, using at least three different cell preparations studied on different days. Direct comparison of signal-to-noise ratios and recovery curve shapes of the data here with the previous studies on fibroblasts could not be made because original recovery curves were not reported in the Luby-Phelps et al. (1986, 1987) papers. The determination of the diffusion coefficient here used standards measured on the same day using the same bleach time and objective lens, as well as similar bleach depths and sample geometries. As discussed previously (Kao et al., 1993), we believe that this empirical approach is superior to the use of analytical approximations developed for photobleaching in two dimensions (Axelrod et al., 1976; Lopez et al., 1988); the bleached zone in studies of aqueous-phase dyes is a complex three-dimensional profile in which recovery occurs by translational motions in three dimensions.
A reversible photobleaching process involving triplet state relaxation was identified for FITC-dextrans in cytoplasm at 37°C. Fluorescence recovery did not depend upon solute translational diffusion because the fluorescence increase results from repopulation of the So ground state from the T1 triplet state that became populated during the bleach pulse. As was found for BCECF diffusion in cytoplasm (Swaminathan et al., 1996), the reversible photobleaching process was eliminated by exposing the cells to oxygen-saturated solutions. The measurements in this paper were done at 23°C to avoid the complexities associated with reversible photobleaching. Because of the relatively long bleach times and limited time resolution in the Luby-Phelps studies (1986), it is possible that unrecognized reversible photobleaching (the extent of which depends on FITC-dextran size) may have influenced the data interpretation as related to size-dependent sieving.
An interesting observation was that little fluorescence recovery occurred after photobleaching of the largest FITC-dextrans and FITC-Ficolls in the cytoplasm. Measurements in concentrated dextran solutions suggested that the incomplete recovery was not due to simple cytoplasmic crowding with mobile macromolecular obstacles. Measurements with different beam intensities and bleach times suggested that the photochemical reaction was not responsible for incomplete recovery. Apparent solute diffusion coefficients and recovery extents did not depend on spot size, suggesting that microcompartments, if present, were much smaller than ∼1 μm. The lack of further fluorescence recovery over long periods of time did not provide evidence for anomalous diffusion or long-tail phenomena, although recoveries over very long periods of time could not be studied because of technical limitations. The experiments in swollen and shrunken cells showed a strong effect of cell volume on the extent of fluorescence recovery, such that an essentially immobile 2,000-kD FITC-dextran in normovolemic cells became mobile after twofold cell swelling. Taken together, these findings are consistent with the possibilities that the incomplete recovery is related to the presence of immobile microcompartments of submicroscopic dimensions, or to anomalous diffusion such as percolation. For several reasons we believe that percolation is most likely. First, it is unclear which cellular components could comprise the putative microcompartments. More importantly, the percolation threshold is expected to be very sensitive to the size of the diffusing particle (Saxton, 1993), as was found here, and to the cell volume. In contrast, relatively small effects of cell volume on the percentage recovery vs solute size relation are predicted for a sieving mechanism in which solute diffusion is restricted by a meshlike skeletal network. The next important steps in the analysis will be the construction of instrumentation to measure recoveries over many minutes/ hours, as well as the development of a theoretical model of anomalous diffusion and percolation phenomena in three dimensions.
The photobleaching data indicated similar rates of FITC-dextran diffusion in the cytoplasm and nucleus. The nucleus is spatially organized into several distinct domains bounded by the nuclear envelope, which consists of two membranes bridged in places by nuclear pores. Within the nucleus are the nucleoli (for ribosome production), nuclear lamina, and possibly specialized domains for the localization of replication, transcription, and splicing. The existence of a “nuclear matrix,” consisting of a scaffolding structure seen in electron micrographs of detergent-extracted nuclei (Capco et al., 1982; Fey et al., 1986; He et al., 1990; Raska et al., 1992), has been controversial. The nuclear matrix has been proposed to act as an anchoring site for biochemical and molecular events and would provide a structural basis for nuclear organization (Berezney, 1991; Cook, 1991; Jacobson, 1995). Information on diffusion in the nucleus is available only for relatively small and very large objects. Based on photobleaching experiments on fluorescently labeled dextrans (3–150 kD), Lang et al. (1986) reported that diffusion in the nucleus is about fivefold slower than in dilute buffer, with no evidence of sieving. Although these studies were performed on large polyethylene glycol–fused, multinucleated cells, the results are in agreement with the conclusions here. In contrast, from analysis of the trajectories of much larger, naturally occurring cytoplasmic inclusions, Alexander and Rieder (1991) reported that diffusion in the matrix was several hundredfold slower than in dilute solution. The results here indicate the absence of solute sieving of FITC-dextrans up to an apparent gyration radius of 300 Å, which does not support the existence of a scaffolding structure with characteristic dimensions of under ∼250 Å. The existence of a functional nuclear substructure of greater dimensions will require the measurement of single particle trajectories in three dimensions (Kao and Verkman, 1994).
Several potential concerns should be noted in evaluating the strength of our conclusions. As in previous studies of this type, the introduction of FITC-dextrans required an invasive microinjection procedure. To minimize effects of cell trauma, cells were incubated for 4–6 h after microinjections, during which time severely damaged cells would be released and minor damage to microinjected cells would likely be repaired. In control studies, rhodamine-phalloidin staining patterns of microinjected and control cells were similar at 4–6 h after FITC-dextran microinjection (not shown). Another issue is the analysis of photobleaching recovery data based on t1/2 values and comparison with solution standards of known viscosity. This approach was chosen to permit quantitative determination of diffusion coefficients without the need to develop complex models of solute diffusion in three dimensions. The use of t1/2 values was justified here on the basis of the nearly identical appearance of recovery curve shapes, which also indicated relative size homogeneity in the size-fractionated FITC-dextrans and FITC-Ficolls. Therefore, although we believe that the principal conclusions about solute diffusion are valid, diffusion coefficients must be viewed as representing averaged physical properties of the cytoplasm or nucleus. Finally, because the shapes of FITC-dextran and FITC-Ficoll molecules are nonspherical, the data must formally be interpreted in terms of effective hydrodynamic radii or, as used here, gyration radii. It is noted that this caveat does not affect the principal conclusion that macromolecule diffusion in cells relative to that in water is independent of macromolecule size.
Acknowledgments
We thank Drs. H. Pin Kao, N. Periasamy, and M. Saxton for helpful discussions; Dr. R. Swaminathan for the analysis software; and Katherine Chen for cell culture.
This work was supported by grants DK43840, DK35124, and HL42368 from the National Institutes of Health. O. Seksek was supported in part by a fellowship from the California Lung Association.
Abbreviations used in this paper
D
diffusion coefficient
FRAP
fluorescence recovery after photobleaching
RG
gyration radius
Footnotes
Please address all correspondence to Alan S. Verkman, Departments of Medicine and Physiology, 1246 Health Sciences East Tower, Cardiovascular Research Institute, University of California at San Francisco, San Francisco, CA 94143-0521. Tel.: (415) 476-8530. Fax: (415) 665-3847. e-mail: verkman@itsa.ucsf.edu
O. Seksek's current address is L.P.B.C. C.N.R.S. U.A. 2056, Université P. et M. Curie, 4 Place Jussieu, 75252 Paris Cedex 05, France.
References
- Almeida, P.F.F., and W.L.C. Vaz. 1995. Lateral diffusion in membranes. In Handbook of Biological Physics. R. Lipowsky and E. Sackmann, editors. Elsevier Science Publishing Co., Inc., New York. 305–345.
- Alexander SP, Rieder CL. Chromosome motion during attachment to the vertebrate spindle: initial saltatory-like behavior of chromosomes and quantitative analysis of force production by nascent kinetochore fibers. J Cell Biol. 1991;113:805–815. doi: 10.1083/jcb.113.4.805. [DOI] [PMC free article] [PubMed] [Google Scholar]
- Axelrod D, Koppel DE, Schlessinger J, Elson E, Webb WW. Mobility measurement by analysis of fluorescence photobleaching recovery kinetics. Biophys J. 1976;16:1055–1069. doi: 10.1016/S0006-3495(76)85755-4. [DOI] [PMC free article] [PubMed] [Google Scholar]
- Berezney R. The nuclear matrix: a heuristic model for investigating genomic organization and function in the cell nucleus. J Cell Biochem. 1991;47:109–123. doi: 10.1002/jcb.240470204. [DOI] [PubMed] [Google Scholar]
- Bicknese S, Periasamy N, Shohet SB, Verkman AS. Cytoplasmic viscosity near the cell plasma membrane: measurement by evanescent field frequency-domain microfluorimetry. Biophys J. 1993;165:1272–1282. doi: 10.1016/S0006-3495(93)81179-2. [DOI] [PMC free article] [PubMed] [Google Scholar]
- Capco DG, Wan KM, Penman S. The nuclear matrix: three-dimensional architecture and protein composition. Cell. 1982;29:847–858. doi: 10.1016/0092-8674(82)90446-9. [DOI] [PubMed] [Google Scholar]
- Clegg JS. Properties and metabolism of the aqueous cytoplasm and its boundaries. Am J Physiol. 1984;246:R133–R151. doi: 10.1152/ajpregu.1984.246.2.R133. [DOI] [PubMed] [Google Scholar]
- Cook PR. The nucleoskeleton and the topology of replication. Cell. 1991;66:627–635. doi: 10.1016/0092-8674(91)90109-c. [DOI] [PubMed] [Google Scholar]
- Farinas J, Simenak V, Verkman AS. Cell volume measured in adherent cells by total internal reflection microfluorimetry: application to permeability in cells transfected with water channel homologs. Biophys J. 1995;68:1613–1620. doi: 10.1016/S0006-3495(95)80335-8. [DOI] [PMC free article] [PubMed] [Google Scholar]
- Feder TJ, Brust-Mascher I, Slattery JP, Baird B, Webb WW. Constrained diffusion or immobile fraction on cell surfaces: a new interpretation. Biophys J. 1996;70:2367–2373. doi: 10.1016/S0006-3495(96)79846-6. [DOI] [PMC free article] [PubMed] [Google Scholar]
- Fey EG, Krochmalnic G, Penman S. The nonchromatin substructures of the nucleus: the ribonucleoprotein (RNP)-containing and RNP-depleted matrices analyzed by sequential fractionation and resinless section electron microscopy. J Cell Biol. 1986;102:1654–1665. doi: 10.1083/jcb.102.5.1654. [DOI] [PMC free article] [PubMed] [Google Scholar]
- Fulton AB. How crowded is the cytoplasm? . Cell. 1982;30:345–347. doi: 10.1016/0092-8674(82)90231-8. [DOI] [PubMed] [Google Scholar]
- Furakawa R, Arauz-Lara JL, Ware BR. Self-diffusion and probe diffusion in dilute and semidilute aqueous solutions of dextran. Macromolecules. 1991;24:599–605. [Google Scholar]
- Fushimi K, Verkman AS. Low viscosity in the aqueous domain of cytoplasm measured by picosecond polarization microscopy. J Cell Biol. 1991;112:719–725. doi: 10.1083/jcb.112.4.719. [DOI] [PMC free article] [PubMed] [Google Scholar]
- Goodsell DS. Inside a living cell. TIBS. 1991;16:203–206. doi: 10.1016/0968-0004(91)90083-8. [DOI] [PubMed] [Google Scholar]
- He DC, Nickerson JA, Penman S. Core filaments of the nuclear matrix. J Cell Biol. 1990;110:569–580. doi: 10.1083/jcb.110.3.569. [DOI] [PMC free article] [PubMed] [Google Scholar]
- Hou L, Lanni F, Luby-Phelps K. Tracer diffusion of F-actin and Ficoll mixtures: toward a model for cytoplasm. Biophys J. 1990;58:31–43. doi: 10.1016/S0006-3495(90)82351-1. [DOI] [PMC free article] [PubMed] [Google Scholar]
- Inman JK. Thymus-independent antigens: the preparation of covalent, hapten-Ficoll conjugates. J Immunol. 1975;114:704–709. [PubMed] [Google Scholar]
- Jacobson DA. Nuclear organization: uniting replication foci, chromatin domains and chromosome structure. Bioessays. 1995;17:587–591. doi: 10.1002/bies.950170704. [DOI] [PubMed] [Google Scholar]
- Kao HP, Verkman AS. Tracking of single fluorescent particles in three dimensions: use of cylindrical optics to encode particle position. Biophys J. 1994;67:1291–1300. doi: 10.1016/S0006-3495(94)80601-0. [DOI] [PMC free article] [PubMed] [Google Scholar]
- Kao HP, Verkman AS. Construction and performance of a FRAP instrument with microsecond time resolution. Biophys Chem. 1996;59:203–210. doi: 10.1016/0301-4622(95)00139-5. [DOI] [PubMed] [Google Scholar]
- Kao HP, Abney JR, Verkman AS. Determinants of the translational diffusion of a small solute in cytoplasm. J Cell Biol. 1993;120:175–184. doi: 10.1083/jcb.120.1.175. [DOI] [PMC free article] [PubMed] [Google Scholar]
- Lang I, Scholz M, Peters R. Molecular mobility and nucleocytoplasmic flux in hepatoma cells. J Cell Biol. 1986;102:1183–1190. doi: 10.1083/jcb.102.4.1183. [DOI] [PMC free article] [PubMed] [Google Scholar]
- Lopez A, Dupou L, Altibelli A, Trotard J, Tocanne JF. Fluorescence recovery after photobleaching (FRAP) experiments under conditions of uniform disk illumination. Biophys J. 1988;53:963–970. doi: 10.1016/S0006-3495(88)83177-1. [DOI] [PMC free article] [PubMed] [Google Scholar]
- Luby-Phelps K. Physical properties of cytoplasm. Curr Opin Cell Biol. 1994;6:3–9. doi: 10.1016/0955-0674(94)90109-0. [DOI] [PubMed] [Google Scholar]
- Luby-Phelps K, Taylor DL, Lanni F. Probing the structure of cytoplasm. J Cell Biol. 1986;102:2015–2022. doi: 10.1083/jcb.102.6.2015. [DOI] [PMC free article] [PubMed] [Google Scholar]
- Luby-Phelps K, Castle PE, Taylor DL, Lanni F. Hindered diffusion of inert tracer particles in the cytoplasm of mouse 3T3 fibroblasts. Proc Natl Acad Sci USA. 1987;84:4910–4913. doi: 10.1073/pnas.84.14.4910. [DOI] [PMC free article] [PubMed] [Google Scholar]
- Luby-Phelps K, Mujundar S, Mujundar R, Ernst L, Galbraith W, Waggoner A. A novel fluorescence ratiometric method confirms the low solvent viscosity of the cytoplasm. Biophys J. 1993;65:236–242. doi: 10.1016/S0006-3495(93)81075-0. [DOI] [PMC free article] [PubMed] [Google Scholar]
- Mastro AM, Keith AD. Diffusion in the aqueous compartment. J Cell Biol. 1984;99:180s–187s. doi: 10.1083/jcb.99.1.180s. [DOI] [PMC free article] [PubMed] [Google Scholar]
- McNeil PL, Warder E. Glass beads load macromolecules into living cells. J Cell Sci. 1987;88:669–678. doi: 10.1242/jcs.88.5.669. [DOI] [PubMed] [Google Scholar]
- Nagle JF. Long tail kinetics in biophysics? . Biophys J. 1992;63:366–370. doi: 10.1016/S0006-3495(92)81602-8. [DOI] [PMC free article] [PubMed] [Google Scholar]
- Periasamy N, Bicknese S, Verkman AS. Reversible photobleaching of fluorescein conjugates in air-saturated viscous solutions: molecular tryptophan as a triplet state quencher. Photochem Photobiol. 1996;63:265–271. doi: 10.1111/j.1751-1097.1996.tb03023.x. [DOI] [PubMed] [Google Scholar]
- Phillies GDJ. Dynamics of polymers in concentrated solutions: the universal scaling equation derived. Macromolecules. 1987;20:558–564. [Google Scholar]
- Phillies GDJ. The hydrodynamic scaling method for polymer self-diffusion. J Phys Chem. 1989;93:5029–5039. [Google Scholar]
- Porter KR. The cytomatrix: a short history of its study. J Cell Biol. 1984;99:3s–12s. doi: 10.1083/jcb.99.1.3s. [DOI] [PMC free article] [PubMed] [Google Scholar]
- Provance DW, McDowall A, Marko M, Luby-Phelps K. Cytoarchitecture of size-excluding compartments in living cells. J Cell Sci. 1993;106:565–577. doi: 10.1242/jcs.106.2.565. [DOI] [PubMed] [Google Scholar]
- Raska I, Dundr M, Koberna K. Structure-function subcompartments of the mammalian cell nucleus as revealed by the electron microscopy affinity cytochemistry. Cell Biol Int Rep. 1992;16:771–789. doi: 10.1016/s0309-1651(05)80021-9. [DOI] [PubMed] [Google Scholar]
- Saxton MJ. Lateral diffusion in an archipelago. Dependence on tracer size. Biophys J. 1993;64:1053–1062. doi: 10.1016/S0006-3495(93)81471-1. [DOI] [PMC free article] [PubMed] [Google Scholar]
- Saxton MJ. Anomalous diffusion due to obstacles: a Monte Carlo study. Biophys J. 1994;66:394–401. doi: 10.1016/s0006-3495(94)80789-1. [DOI] [PMC free article] [PubMed] [Google Scholar]
- Seksek O, Biwersi J, Verkman AS. Direct measurement of trans-Golgi pH in living cells and regulation by second messengers. J Biol Chem. 1995;270:4967–4970. doi: 10.1074/jbc.270.10.4967. [DOI] [PubMed] [Google Scholar]
- Swaminathan R, Bicknese S, Periasamy N, Verkman AS. Cytoplasmic viscosity near the cell plasma membrane: translation of BCECF measured by total internal reflection-fluorescence photobleaching recovery. Biophys J. 1996;71:1140–1151. doi: 10.1016/S0006-3495(96)79316-5. [DOI] [PMC free article] [PubMed] [Google Scholar]
- Swaminathan R, Hoang CP, Verkman AS. Photochemical properties of green fluorescent protein GFP-S65T in solution and transfected CHO cells: analysis of cytoplasmic viscosity by GFP translational and rotational diffusion. Biophys J. 1997;72:1900–1907. doi: 10.1016/S0006-3495(97)78835-0. [DOI] [PMC free article] [PubMed] [Google Scholar]
- Verkman AS. New microfluorimetry approaches to examine cell dynamics. Comments Mol Cell Biophys. 1991;7:173–187. [Google Scholar]
- Welch GR, Easterby JS. Metabolic channeling versus free diffusion: transition-time analysis. TIBS. 1994;19:193–197. doi: 10.1016/0968-0004(94)90019-1. [DOI] [PubMed] [Google Scholar]