Evidence for a Relatively Random Array of Human Chromosomes on the Mitotic Ring (original) (raw)
Abstract
We used fluorescence in situ hybridization (FISH) to study the positions of human chromosomes on the mitotic rings of cultured human lymphocytes, MRC-5 fibroblasts, and CCD-34Lu fibroblasts. The homologous chromosomes of all three cell types had relatively random positions with respect to each other on the mitotic rings of prometaphase rosettes and anaphase cells. Also, the positions of the X and Y chromosomes, colocalized with the somatic homologues in male cells, were highly variable from one mitotic ring to another. Although random chromosomal positions were found in different pairs of CCD-34Lu and MRC-5 late-anaphases, the separations between the same homologous chromosomes in paired late-anaphase and telophase chromosomal masses were highly correlated. Thus, although some loose spatial associations of chromosomes secondary to interphase positioning may exist on the mitotic rings of some cells, a fixed order of human chromosomes and/or a rigorous separation of homologous chromosomes on the mitotic ring are not necessary for normal mitosis. Furthermore, the relative chromosomal positions on each individual metaphase plate are most likely carried through anaphase into telophase.
Keywords: chromosomal positions, mitotic ring, fluorescence in situ hybridization
It is still not known whether the positions of the chromosomes relative to each other, when the mitotic ring of the metaphase plate is viewed head-on as a flat disc, are rigorously fixed, have loose preferences for associating with favored neighbors, or are entirely random. Early studies of this question gave widely differing results. The chromosomes of Dipteran insects showed pairing of homologous chromosomes during prophase and on the mitotic ring (Metz, 1916). However, the chromosomal order on the metaphase rings of grasshopper (Melanoplus femorrubrum) spermatocytes was found to be random (Nur, 1976). In hexaploid wheat, Triticum aestivum, the homologous chromosomes were close to each other and possibly adjacent on the mitotic ring (Feldman et al., 1966). A study of the grasses Hordeum vulgaris and Hordeum bullosum suggested that chromosomal arms of similar lengths were adjacent, and possibly in a fixed order, on the mitotic ring (Heslop-Harrison and Bennett, 1984). One study of the plant Crepis capillaris showed homologue association on the mitotic rings (Ferrer and Lacadena, 1977), whereas another study of this plant showed a random chromosome order except for clustering of the two chromosomes involved in nucleolus formation (Tanaka, 1981).
Early studies of mammalian cells also showed adjacent homologous chromosomes on the mitotic rings of human (Schneiderman and Smith, 1962), Muntjac deer (Heneen and Nichols, 1972), and Chinese hamster cells (Juricek, 1975), whereas later studies showed largely random, or widely separated, homologous chromosomes for these cell types (Hens, 1976; Korf and Daicumakos, 1977; Nagele et al., 1995). In a recent fluorescence in situ hybridization (FISH)1 study of the chromosomal positions in the prometaphase rosettes of four human cell lines, the investigators concluded that homologous chromosomes were always separated from each other by at least 90° and were most likely to be arrayed in a fixed order on the mitotic ring (Nagele et al., 1995). Only a small proportion of the rosettes was suitable for analysis in this study, however, leaving open the possibility that selection may have influenced these results.
We now report the FISH localization of the relative positions of human chromosomes in prometaphase rosettes, early, mid-, and late-anaphases, and telophases of cultured human lymphocytes, MRC-5 cells, and CCD-34Lu cells. A new method was developed for measuring chromosomal positions in virtually all anaphases to ensure sampling of the entire mitotic segment. The results of this study were somewhat surprising in that we found largely random chromosomal positions.
Materials and Methods
Cells
Fibroblasts of the diploid MRC-5 line (a gift of Dr. J. Willey, Medical College of Ohio) and the diploid CCD-34Lu cell line (American Type Culture Collection), both derived from human lung tissue, were grown as monolayers directly on glass slides in RPMI 1640 or EMEM containing l-glutamine (GIBCO BRL), 10% FBS (GIBCO BRL), penicillin, gentamicin, and sodium bicarbonate (Amersham Life Sciences), respectively. The cells were fixed in situ with Carnoy's solution just before confluence. Human lymphocytes were grown in RPMI 1640 with the addition of phytohemagglutinin (Amersham) for 72 h, fixed in Carnoy's, and dropped onto glass slides from 10 cm. The slides were not flamed, but were allowed to air-dry and were stored until hybridization. In some experiments, CCD-34Lu cells were fixed in 4% paraformaldehyde in PBS and stored without drying in 95% alcohol at −20°C until hybridization (Nagele et al., 1995).
FISH
Centromere-specific probes, directly labeled with FluorX (green fluorescence) or Cy3 (red-orange fluorescence), were used when available (Amersham). For the remaining chromosomes, chromosome “paints,” labeled with Spectrum orange or Spectrum green, were used (Vysis), and the brightest point on each “paint image” was used as the location of the centromere. For FISH, slides were incubated in a 2× SSC solution (pH 7.0) for 30 min, followed by dehydration. The centromeric probe mixtures consisted of 2 μl of Cy3-labeled centromeric probe, 2 μl of FluorX-labeled centromeric probe, and 10 μl of hybridization solution (50% formamide/ 2× SSC/10% dextran sulfate). The centromeric-paint probe mixtures consisted of 1 μl of Spectrum orange or green paint probe, 2 μl of FluorX or Cy3 centromeric probe, 1 μl of ddH2O, and 7 μl of hybridization solution. The probe mixtures were denatured at 70°C for 5 min and placed at 4°C until use. Cells hybridized to the centromeric and the paint-centromeric probe mixtures were denatured for 2 and 5 min, respectively, in 70% formamide/2× SSC solution at pH 7.0. The slides were incubated overnight with probe solution in a humidified chamber at 43°C. The slides incubated with the paint-centromeric and the centromeric probes were washed in 50–65% formamide/2× SSC solution (pH 7.0), 2× SSC, and 2× SSC with NP-40 or PBD (pH 8.0), respectively, and counterstained with DAPI. The appropriate number of centromeres were always clearly localized in the Carnoy-fixed mitotic and interphase cells (Fig. 1 A). The paraformaldehyde-fixed CCD-34Lu cells (Nagele et al., 1995) gave relatively dim probe localization under a variety of denaturation times (2–6 min) when compared with the Carnoy-fixed cells. However, treatment of the paraformaldehyde-fixed cells with a weak solution of HCl (200 mM in PBS) for 20 min at room temperature before a 3-min denaturation allowed detection of the appropriate number of fluorescence signals in the majority of rosettes.
Figure 1.
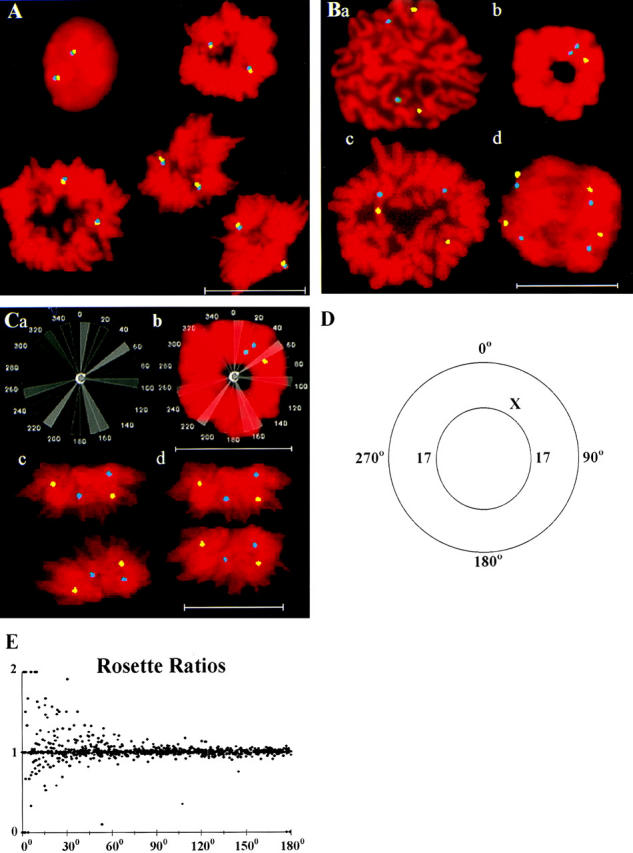
(A) FISH-localized homologues of the X chromosomes in female human lymphocytes doubly hybridized with a FluorX-labeled whole chromosome paint probe (yellow) and a Spectrum orange–labeled centromeric probe (blue). The colocalization of both probes in interphase and mitotic cells is apparent. (B) FISH-localized homologues of MRC-5 chromosomes 11 (yellow) and 17 (blue) in prophase (a); the X (yellow) and 17 (blue) chromosomes in a prometaphase rosette (b); FISH-localized homologues of lymphocyte chromosomes 11 (yellow) and 17 (blue) in a metaphase with undivided centromeres (c); and an early anaphase (d). (C) A grid used to measure rosette chromosomal positions (a); placed over the rosette (b); a mid-anaphase cell with the separating chromosomal masses (c); and a transform of image c in which both mitotic rings are given an identical diameter set on the x-axis, with positive directions on the y-axis being toward the nuclear pole (d). (D) Male rosette with two homologues of chromosome 17 positioned at 90° and 270° and the X chromosome at 45°. (E) Ratios of two independent sets of measurements of angular separation between the same chromosomes in MRC-5 and lymphocyte rosettes (n = 1,011), showing increasing variability as the angular separations decrease. Bars, 20 μm.
Microscopy and Image Processing
The Cy3 and Spectrum orange fluorochromes were localized with a rhodamine-specific filter cube, BP510-560, FT580, LP590, in a Zeiss microscope under epifluorescence optics with a Neofluar 100× oil immersion lens (NA 1.30; Carl Zeiss, Inc.). The FluorX and Spectrum green fluorochromes were visualized with filter cube BP450-490, FT510, LP520, and a G365, FT395, LP420 filter cube was used for the DAPI stain. Analogue images from a CCD camera mounted on the microscope were digitized and processed for removal of extraneous background fluorescence by Probevision software (Applied Imaging Corp. [AI]). The early and mid-anaphase mitotic rings are perpendicular to the slide surface, and FISH-localized chromosomes in these cells were often in slightly different focal planes. When this occurred, the objective was set at an intermediate focal plane between the two probes, which appeared as slightly larger and less bright spots of light than perfectly focused probes. AI image analysis transforms were used to select the brightest points in each of the defocused spots as the location of probe fluorescence. The AI fluorescence microscopy system separately acquires three black and white images at the emission wavelength of the fluorochrome being localized. The black and white images are combined into one pseudocolor image without any movement or alignment changes. Each image was converted into a color graphic overlay (AI) and further processed with Adobe Photoshop (Adobe Systems Inc.) and Probe Ratio software (JVB Imaging). Data were stored and analyzed with the Quatro Pro spreadsheet (Borland) and the SPSS statistical programs (SPSS Inc.).
The emitted light from the contrasting fluorochromes has different refractive indices in the microscope objective. To test whether the varying focal planes and emission spectra caused significant shifts in image positions, we hybridized female lymphocytes with the FluorX paint probe and the Cy3 centromeric probe for the X chromosome. The two probes showed a perfect positional correspondence for all cells measured (Fig. 1 A), ruling out significant spectral aberrations and alignment problems.
Results
Experimental Approach
After S-phase, the newly replicated sister chromatids condense in prophase (Fig. 1 B, panel a), and many, if not all, prophase cells form a tight ring of chromosomes parallel to the slide surface called the prometaphase rosette (Chaly and Brown, 1988; Nagele et al., 1995) (Fig. 1 B, panel b). The prometaphase rosettes progress directly to less compact metaphases (Fig. 1 B, panel c), followed shortly by anaphase (Chaley and Brown, 1988; Nagele et al., 1995). The early (Fig. 1 B, panel d) and mid- (Fig. 1 C, panel c) anaphase mitotic rings are perpendicular to the slide surface. We found, similar to Nagele et al. (1995), that it was difficult to determine the positions of FISH-localized chromosomes in metaphase figures, which often have partially broken or folded mitotic rings (Fig. 1 B, panel c). This was not the case for the more compact rosettes and anaphases (Fig. 1 B, panels b and d, and Fig. 1 C, panel c). The symmetry of chromosomal positions in >99% of the daughter early and mid-anaphases (Fig. 1 B, panel d, and Fig. 1 C, panel c) established that the relative chromosomal positions in the living early and mid-anaphases were maintained after fixation. The mitotic rings of late-anaphases were often parallel to the slide surface (Fig. 1 A, bottom right-hand corner).
Assay of Prometaphase Rosettes, Late-Anaphases, and Telophases.
The proportion of prometaphases forming flat rosette rings was graded in consecutive lymphocytes and MRC-5 cells. Because it had been reported that only “perfect” rosettes were suitable for analysis of chromosomal positions (Nagele et al., 1995), MRC-5 and lymphocyte rosettes were further classified as being perfect (compact, even, and unbroken mitotic rings), “slightly spread” (slight separation of some chromosomes and/or some central asymmetry), or “gap” (<10% broken area in the ring) rosettes. Perfect rosettes were found for 38% (101/261) and 9% (48/551) of the lymphocyte and MRC-5 prometaphases, respectively. However, no differences in the angular separations in perfect, slightly spread, or gap rosettes were found for any of the cell lines (data not shown), and all three rosette types were subsequently measured, giving estimated sampling frequencies of 90% (234/261) and 29% (162/557) of the lymphocyte and MRC-5 prometaphases, respectively.
Fig. 1 D shows a prometaphase or late-anaphase mitotic ring parallel to the slide surface with the two homologues of chromosome 17 separated by 180°. A change of position of one homologue leads to two separation angles between these chromosomes, one <180° and one >180°. The lower angle was measured, allowing a 0–180° separation range between two rosette chromosomes. However, it was necessary arbitrarily to select a center point to place a measuring grid (Fig. 1 C, panel a) over the ring (Fig. 1 C, panel b). To test the reproducibility of this step, we performed two sets of measurements of the same prometaphase rosettes, with the second measurement set performed without knowledge of the prior location of each rosette's center point (Fig. 1 C, panel b). In Fig. 1 E, the ratios of the first to second angular measurements for each rosette are plotted on the y-axis against the mean value of the two measurements on the x-axis. There was considerable variability between the two measurement sets, especially for measurements of smaller angular separations (Fig. 1 E). The variability in our study seemed random, because the ratios were both above and below the value of one (Fig. 1 E).
Consecutive, widely separated CCD-34Lu and MRC-5 chromosomal masses were graded as being late-anaphases (flat rings, Fig. 2 D, panel a, and Fig. 2 E, panel a), telophases (flat, elliptical areas without a ring structure, Fig. 2 D, panel b, and Fig. 2 E, panel b), or of indeterminate morphology (not shown), leading to the following classifications: both chromosomal masses being late-anaphases (CCD-34Lu, n = 18 pairs; MRC-5, n = 18 pairs); both being telophases (CCD-34Lu, n = 14 pairs; MRC-5, n = 30 pairs); and being of mixed/indeterminate morphology (CCD-34Lu, n = 40 pairs; MRC-5, n = 22 pairs). The angular separations in nonpaired, i.e., individual, coded images of these chromosomal masses were measured one at a time, using the geometric centers of each chromosomal mass to center the measuring grid (Fig. 1 C, panel b).
Figure 2.
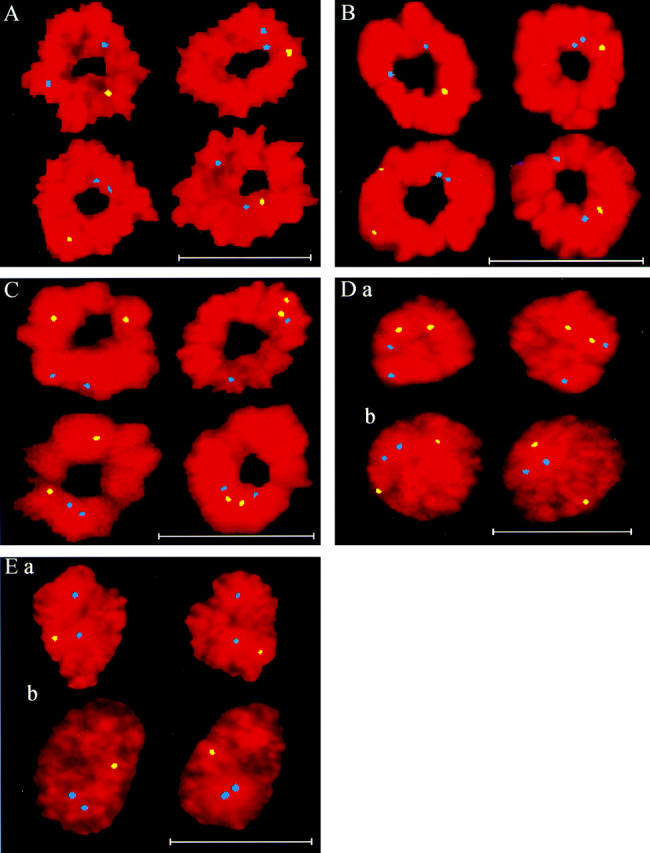
(A) Male lymphocyte rosettes with the FISH-localized homologues of chromosome 17 (blue) and X (yellow) showing widely varying positions. (B) MRC-5 rosettes with the FISH-localized homologues of chromosome 17 (blue) and X (yellow) showing widely varying positions. (C) CCD-34Lu rosettes with the FISH-localized homologues of chromosomes X (yellow) and 7 (blue) showing widely varying positions. (D) CCD-34Lu late-anaphase (a) and telophase (b) pairs with the FISH-localized homologues of chromosomes X (yellow) and 7 (blue). (E) MRC-5 late-anaphase (a) and telophase (b) pairs with the FISH-localized homologues of chromosome 7 (yellow) and X (blue). Bars, 20 μm.
Early and Mid-Anaphase Assay.
The angular chromosomal separations cannot be measured directly in early and mid-anaphase mitotic rings, which are perpendicular to the slide surface (Fig. 1 B, panel d, and Fig. 1 C, panel c). Linear distances were measured between the anaphase chromosomes and then analyzed to gain an estimate of the native chromosome sequence as detailed in the Appendix.
Experimental Results
Rosette Results.
The angular separations measured between the homologues of chromosomes 11 (n = 103) and 17 (n = 203) in MRC-5 rosettes, chromosome 17 in male lymphocyte rosettes (n = 100), chromosome 7 in female lymphocyte rosettes (n = 104), and chromosomes X and 7 in the CCD-34Lu rosettes (n = 156) were highly variable (Figs. 2, A–C, and Fig. 3, A–F). No evidence was found for fixed ranges of separation between these homologues on the mitotic ring, as equal numbers of homologues were separated by <90° and by >90° (Fig. 3, A–F). If the chromosomes are in fixed positions in male cells, the angular separations between the X chromosome and the same two somatic homologues should be identical for every rosette (Fig. 1 D). This was not the case for measurements of the X and 17 chromosome homologues made on male MRC-5 and lymphocyte rosettes, where widely variable angles of separation were found (Fig. 2, A and B, and Fig. 3, G and H).
Figure 3.

Angular separations of FISH-localized chromosomes in MRC-5, lymphocyte, and CCD-34Lu rosettes. (A) MRC-5 chromosome 11 homologues (n = 103). (B) MRC-5 chromosome 17 homologues (n = 203). (C) Male lymphocyte chromosome 17 homologues (n = 100). (D) Female lymphocyte chromosome 7 (n = 104). (E) CCD-34Lu chromosome X homologues (n = 156). (F) CCD-34Lu chromosome 7 homologues (n = 156). (G and H) Nearest (black bars) and farthest (striped bars) angular separations between the 17 homologues and the X chromosome in male MRC-5 rosettes (n = 100, G) and male lymphocyte rosettes (n = 100, H).
Random separations of homologous rosette chromosomes were also found for all of the individual lymphocyte chromosomes, MRC-5 chromosomes 11 and 17, and CCD-34Lu chromosomes X and 7 (see Appendix, Table I). Furthermore, the distributions of the nearest angular separations between the somatic chromosomes to either the X or Y chromosome in male lymphocytes rosettes were also highly variable (see Appendix, Table II).
Table I.
Separation of the Individual Homologues in Prometaphase Rosettes of All Lymphocyte Chromosomes, MRC-5 Chromosomes 11 and 17, CCD-34Lu Chromosomes X and 7; and the Separation of the Homologues of CCD-34Lu Chromosomes X and 7 and MRC-5 Chromosome 7 in Late-Anaphase Mitotic Rings
| Prometaphase rosettes | |||||||||
|---|---|---|---|---|---|---|---|---|---|
| Average homologue separation | |||||||||
| Lymphocytes (male) | Lymphocytes (female) | ||||||||
| Chr. | n | Mean | Range* | SD‡ | Chr. | n | Mean | Range | SD |
| ° | ° | ° | ° | ° | ° | ||||
| 1 | 10 | 114 | 35–177 | 54 | X-X | 104 | 88 | 4–179 | 53 |
| 2 | 15 | 97 | 23–180 | 60 | 7 | 104 | 89 | 5–179 | 52 |
| 3 | 11 | 90 | 23–174 | 55 | |||||
| 4 | 12 | 99 | 17–173 | 55 | MRC-5 (male) | ||||
| 5 | 10 | 103 | 21–175 | 49 | 11 | 103 | 68 | 2–171 | 44 |
| 6 | 25 | 91 | 6–179 | 55 | 17 | 203 | 61 | 0–175 | 42 |
| 7 | 23 | 95 | 1–180 | 56 | |||||
| 8 | 10 | 106 | 34–157 | 47 | CCD-34Lu (female) | ||||
| 9 | 10 | 133 | 52–178 | 42 | X-X | 156 | 88 | 2–180 | 52 |
| 10 | 10 | 68 | 18–158 | 44 | 7 | 156 | 90 | 1–179 | 53 |
| 11 | 12 | 66 | 4–149 | 49 | X-X§ | 26 | 64 | 5–163 | 52 |
| 12 | 11 | 122 | 32–170 | 47 | 7§ | 33 | 93 | 9–172 | 53 |
| 13 | 11 | 72 | 15–178 | 55 | |||||
| 14 | 12 | 91 | 14–149 | 48 | |||||
| 15 | 12 | 107 | 36–169 | 48 | |||||
| 16 | 15 | 96 | 21–150 | 43 | |||||
| 17 | 108 | 83 | 1–173 | 47 | |||||
| 18 | 12 | 85 | 13–168 | 49 | |||||
| 19 | 10 | 86 | 15–150 | 47 | |||||
| 20 | 10 | 87 | 19–155 | 48 | |||||
| 21 | 10 | 81 | 26–137 | 38 | |||||
| 22 | 10 | 105 | 1–172 | 59 | |||||
| X-Y | 15 | 97 | 12–179 | 58 | |||||
| Late-anaphase rings | |||||||||
| CCD-34Lu | MRC-5 | ||||||||
| Chr. | n | Mean | Range* | SD‡ | Chr. | n | Mean | Range | SD |
| ° | ° | ° | ° | ° | ° | ||||
| X-X | 36 | 94 | 10–176 | 52 | 7 | 33 | 101 | 10–173 | 51 |
| 7 | 36 | 94 | 0–172 | 50 |
Table II.
The Nearest Separation of the Individual Homologues of Chromosomes 1–22 to the X or Y Chromosomes in Male Lymphocyte Rosettes and between the Chromosome 7 Homologues to the X Chromosome in Male MRC-5 Late-Anaphases (Fig. 2 E, panel a)
| Nearest angle in lymphocyte prometaphase rosettes to the sex chromosomes (male) | ||||||||
|---|---|---|---|---|---|---|---|---|
| Chr. | X chromosome | Y chromosome | ||||||
| n | Mean | Range* | SD‡ | n | Mean | Range | SD | |
| ° | ° | ° | ° | ° | ° | |||
| 1 | 5 | 61 | 6–122 | 41 | 5 | 60 | 2–140 | 51 |
| 2 | 5 | 59 | 9–118 | 39 | 10 | 78 | 9–140 | 42 |
| 3 | 5 | 62 | 31–117 | 36 | 6 | 106 | 58–141 | 34 |
| 4 | 5 | 53 | 5–168 | 67 | 7 | 48 | 13–99 | 26 |
| 5 | 5 | 56 | 10–75 | 26 | 5 | 50 | 2–123 | 49 |
| 6 | 5 | 87 | 29–156 | 52 | 20 | 64 | 9–120 | 38 |
| 7 | 5 | 88 | 24–155 | 61 | 18 | 61 | 9–178 | 44 |
| 8 | 5 | 44 | 20–106 | 36 | 5 | 35 | 3–85 | 31 |
| 9 | 5 | 50 | 9–102 | 40 | 5 | 47 | 1–145 | 61 |
| 10 | 5 | 52 | 21–142 | 51 | 5 | 69 | 11–135 | 58 |
| 11 | 6 | 94 | 17–158 | 53 | 6 | 44 | 5–97 | 34 |
| 12 | 5 | 52 | 4–79 | 31 | 6 | 68 | 33–107 | 25 |
| 13 | 5 | 109 | 73–137 | 25 | 6 | 65 | 40–109 | 25 |
| 14 | 6 | 53 | 4–102 | 33 | 6 | 65 | 9–129 | 41 |
| 15 | 5 | 69 | 25–124 | 37 | 7 | 82 | 33–104 | 24 |
| 16 | 5 | 52 | 10–145 | 55 | 10 | 57 | 3–164 | 50 |
| 17 | 103 | 59 | 0–162 | 42 | 5 | 73 | 10–116 | 43 |
| 18 | 5 | 43 | 9–77 | 31 | 5 | 52 | 5–88 | 30 |
| 19 | 5 | 26 | 2–66 | 27 | 5 | 99 | 68–139 | 30 |
| 20 | 5 | 55 | 2–105 | 38 | 5 | 67 | 19–150 | 52 |
| 21 | 5 | 53 | 5–105 | 47 | 5 | 75 | 17–161 | 54 |
| 22 | 5 | 50 | 1–105 | 40 | 5 | 75 | 31–127 | 39 |
| Nearest angle between the chromosome 7 homologues and the X chromosome in MRC-5 late-anaphases | ||||||||
| n | Mean | Range* | SD‡ | |||||
| ° | ° | ° | ||||||
| 33 | 66 | 1–158 | 40 |
Early and Mid-Anaphase Results.
We measured the relative chromosomal positions in early and mid-anaphases of all three cell types. Virtually all anaphases were measured, allowing a complete sampling of the mitotic segment. The x-axis distances measured between the early and mid-anaphase chromosomes were compared with different theoretical models of chromosomal separation on the mitotic ring (see Appendix). The pooled x-axis distances measured between all of the homologous chromosomes in the lymphocyte, MRC-5, and CCD-34Lu early and mid-anaphases strongly fit the theoretical model for a random, but no other, distribution (see Appendix, Fig. 7 and Table III). The x-axis distances between the individual early and mid-anaphase chromosomes of these cell types predominately fit the random model, although some heterogeneity among these data sets was observed (see Appendix, Table IV).
Figure 7.
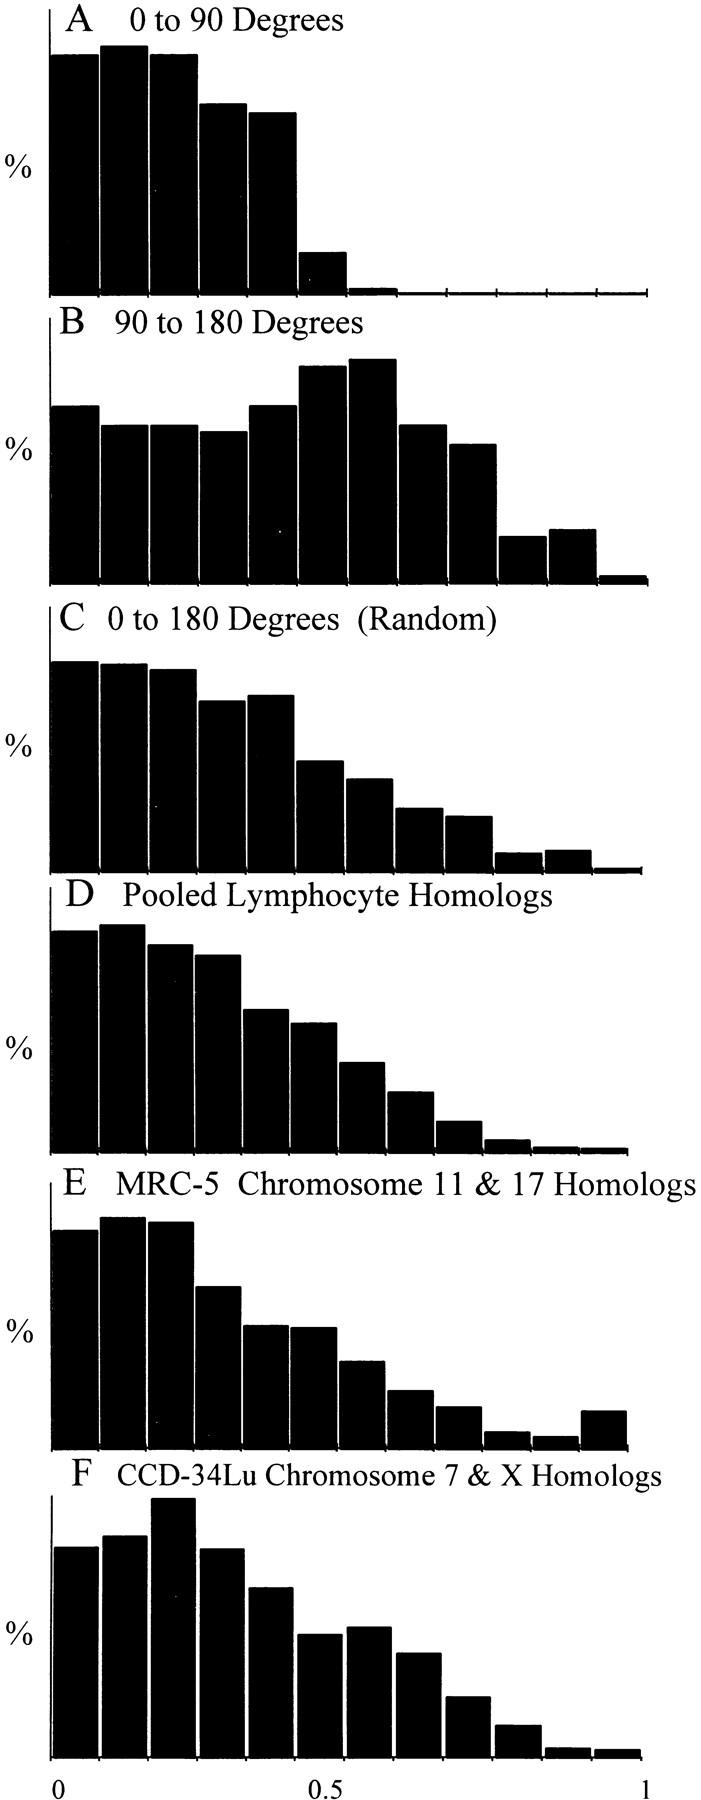
Theoretical and measured distributions of the x-axis distances between homologous chromosomes in early and mid-anaphases. (A–C) Theoretical models of the x-axis distance distributions for two chromosomes separated within the ranges of 0–90° (A), 90–180° (B), and 0–180° (random distribution, C). (D) Pooled x-axis distances between 5,304 homologous pairs of lymphocyte chromosomes 1–22, XX, and XY. (E) Pooled x-axis distances measured between 1,042 pairs of homologous MRC-5 chromosomes 11 and 17. (F) Pooled x-axis distances measured between 816 pairs of homologous CCD-34Lu chromosomes X and 7.
Table III.
χ 2 Analysis for Fit between the Theoretical Models of X-Axis Distances Measured on the Slide Surface for Different Chromosomal Separations on the Native Mitotic Ring and Pooled Anaphase X-Axis Distances Actually Measured between Homologous Lymphocyte (1–22, XX, XY), MRC-5 (11, 17), and CCD-34Lu (X, 7) Chromosomes
| Theoretical models | Analysis of fit | ||||||
|---|---|---|---|---|---|---|---|
| Chr. separation position | Mean x-axis dist.* | Range | Lymph, 1–22, XX, XY (male & female) n = 5,304 P ‡ | Lymph, 1–22, XY (male) n = 3,524 P | Lymph, 3, 6, 7, 8, 11, 15, 17, XX (female) n =1,780 P | MRC-5, 11, 17 (male) n = 1,042 P | CCD-34Lu, XX, 7 (female) n = 816 P |
| ° | % | % | |||||
| 1 (8°) | 4 | 0–11 | 0.000 | 0.000 | 0.000 | 0.000 | 0.000 |
| 2 (16°) | 9 | 0–17 | 0.000 | 0.000 | 0.000 | 0.000 | 0.000 |
| 3 (25°) | 12 | 0–22 | 0.000 | 0.000 | 0.000 | 0.000 | 0.000 |
| 4 (33°) | 15 | 0–26 | 0.000 | 0.000 | 0.000 | 0.000 | 0.000 |
| 5 (41°) | 18 | 0–30 | 0.000 | 0.000 | 0.000 | 0.000 | 0.000 |
| 6 (49°) | 21 | 0–33 | 0.000 | 0.000 | 0.000 | 0.000 | 0.000 |
| 7 (57°) | 24 | 0–37 | 0.000 | 0.000 | 0.000 | 0.000 | 0.000 |
| 8 (65°) | 26 | 0–41 | 0.000 | 0.000 | 0.000 | 0.000 | 0.000 |
| 9 (74°) | 28 | 0–44 | 0.000 | 0.000 | 0.000 | 0.000 | 0.000 |
| 10 (82°) | 30 | 0–48 | 0.000 | 0.000 | 0.000 | 0.000 | 0.000 |
| 11 (90°) | 32 | 0–52 | 0.000 | 0.000 | 0.000 | 0.000 | 0.000 |
| 12 (98°) | 34 | 0–56 | 0.000 | 0.000 | 0.000 | 0.000 | 0.000 |
| 13 (106°) | 36 | 0–59 | 0.002 | 0.002 | 0.009 | 0.004 | 0.002 |
| 14 (115°) | 37 | 0–63 | 0.001 | 0.001 | 0.002 | 0.001 | 0.001 |
| 15 (123°) | 38 | 0–67 | 0.008 | 0.008 | 0.031 | 0.002 | 0.008 |
| 16 (131°) | 40 | 0–69 | 0.003 | 0.003 | 0.001 | 0.001 | 0.080 |
| 17 (139°) | 41 | 0–72 | 0.005 | 0.005 | 0.002 | 0.002 | 0.057 |
| 18 (147°) | 42 | 0–75 | 0.001 | 0.001 | 0.000 | 0.000 | 0.018 |
| 19 (155°) | 42 | 0–78 | 0.003 | 0.003 | 0.001 | 0.001 | 0.030 |
| 20 (164°) | 43 | 0–83 | 0.005 | 0.005 | 0.003 | 0.004 | 0.086 |
| 21 (172°) | 43 | 0–89 | 0.006 | 0.006 | 0.003 | 0.005 | 0.023 |
| 22 (180°) | 44 | 0–100 | 0.005 | 0.005 | 0.003 | 0.004 | 0.066 |
| 1–11 (0–90°)§ | 20 | 0–52 | 0.000 | 0.000 | 0.000 | 0.000 | 0.000 |
| 12–22 (90–180°)‖ | 40 | 0–100 | 0.005 | 0.005 | 0.003 | 0.004 | 0.069 |
| 1–22 (0–180°) ¶ | 30 | 0–100 | 0.935 | 0.935 | 0.821 | 0.877 | 0.907 |
Table IV.
Analysis of the Fit of the X-Axis Distances between the Individual Early and Mid-Anaphase Chromosomes of All Cell Types to the 0–90°, 90–180°, and 0–180° (Random) Theoretical Models, and of the Shortest Anaphase X-Axis Distances between the Somatic and Sex Chromosomes in Male Lymphocytes to the Two-Position Model of Chromosomal Separation (Table I)
| Theoretical models | Sex chromosomes | |||||||||
|---|---|---|---|---|---|---|---|---|---|---|
| Compared | X | Y | ||||||||
| Lymph | 0–90° | 90–180° | 0–180° (Random) | Shortest x-axis distance | Shortest x-axis distance | |||||
| Chr. | n | P * | P | P | n | Range‡ | P § 2-Pos fit | n | Range | P 2-Pos fit |
| % | % | |||||||||
| 1 | 150 | 0.000 | 0.667 | 0.150 | 46 | 0–74 | 0.000 | 46 | 0–62 | 0.000 |
| 2 | 160 | 0.000 | 0.527 | 0.410 | 46 | 0–54 | 0.000 | 60 | 1–96 | 0.000 |
| 3 | 172 | 0.000 | 0.197 | 0.304 | 48 | 0–48 | 0.000 | 48 | 0–46 | 0.000 |
| 4 | 158 | 0.000 | 0.002 | 0.688 | 50 | 1–59 | 0.000 | 48 | 0–52 | 0.000 |
| 5 | 174 | 0.000 | 0.180 | 0.552 | 46 | 0–36 | 0.150 | 48 | 0–60 | 0.000 |
| 6 | 334 | 0.002 | 0.002 | 0.775 | 48 | 3–87 | 0.000 | 52 | 0–40 | 0.371 |
| 7 | 570 | 0.000 | 0.009 | 0.803 | 50 | 1–63 | 0.000 | 50 | 0–55 | 0.136 |
| 8 | 254 | 0.002 | 0.000 | 0.205 | 48 | 1–44 | 0.000 | 48 | 0–71 | 0.000 |
| 9 | 140 | 0.000 | 0.006 | 0.036 | 46 | 1–71 | 0.000 | 46 | 0–48 | 0.000 |
| 10 | 140 | 0.000 | 0.394 | 0.002 | 56 | 1–67 | 0.010 | 46 | 1–42 | 0.000 |
| 11 | 358 | 0.003 | 0.000 | 0.646 | 48 | 0–54 | 0.006 | 48 | 1–36 | 0.011 |
| 12 | 154 | 0.000 | 0.015 | 0.571 | 46 | 0–47 | 0.000 | 48 | 0–50 | 0.000 |
| 13 | 208 | 0.000 | 0.168 | 0.911 | 56 | 1–54 | 0.000 | 56 | 1–33 | 0.020 |
| 14 | 168 | 0.000 | 0.150 | 0.374 | 52 | 0–63 | 0.000 | 46 | 1–37 | 0.000 |
| 15 | 316 | 0.099 | 0.000 | 0.360 | 52 | 1–50 | 0.013 | 60 | 1–58 | 0.000 |
| 16 | 164 | 0.054 | 0.001 | 0.590 | 46 | 0–62 | 0.000 | 60 | 1–60 | 0.006 |
| 17 | 446 | 0.497 | 0.000 | 0.155 | 48 | 0–69 | 0.000 | 48 | 0–40 | 0.000 |
| 18 | 142 | 0.024 | 0.000 | 0.000 | 46 | 1–47 | 0.000 | 50 | 1–36 | 0.002 |
| 19 | 148 | 0.939 | 0.000 | 0.010 | 48 | 0–59 | 0.000 | 48 | 0–39 | 0.485 |
| 20 | 142 | 0.043 | 0.000 | 0.033 | 50 | 1–71 | 0.000 | 52 | 0–34 | 0.000 |
| 21 | 160 | 0.244 | 0.000 | 0.412 | 46 | 0–54 | 0.094 | 62 | 1–43 | 0.000 |
| 22 | 154 | 0.000 | 0.001 | 0.628 | 50 | 1–42 | 0.000 | 46 | 1–34 | 0.000 |
| X-Y | 92 | 0.000 | 0.027 | 0.754 | ||||||
| X-X | 400 | 0.000 | 0.060 | 0.897 | ||||||
| MRC-5 | ||||||||||
| 11 | 496 | 0.000 | 0.014 | 0.935 | ||||||
| 17 | 546 | 0.000 | 0.007 | 0.657 | ||||||
| CCD-34Lu | ||||||||||
| 7 | 408 | 0.000 | 0.069 | 0.994 | ||||||
| X | 408 | 0.000 | 0.080 | 0.930 |
Late-Anaphase and Telophase Results.
The chromosomal separations measured in widely separated, late-anaphase rings between the homologues of the CCD-34Lu chromosomes X and 7 and MRC-5 chromosome 7 were random (see Appendix, Table I), similar to the prometaphase rosettes. The nearest angles between the homologues of chromosome 7 and the X chromosome measured in MRC-5 (male) late-anaphase rings were highly variable, a finding inconsistent with fixed positions of these chromosomes on the late-anaphase rings (see Appendix, Table II). Also, symmetrical positions were found for the same chromosomes in each daughter of the widely separated chromosomal masses, regardless of chromosomal mass morphology (Fig. 1 A, bottom right-hand corner, and Fig. 2, D and E). This symmetry is quantified in Fig. 4, which shows the correlation between angles measured in each daughter of 142 unselected, and consecutively measured, pairs of widely separated CCD-34Lu (n = 72) and MRC-5 (n = 70) chromosomal masses. In the figure, the x-axis coordinate of every point is the angle between two homologues measured in one chromosomal mass. The y-axis coordinate is the same angle measured in either the other daughter chromosomal mass of the pair (daughter-paired, Fig. 4 A) or in a randomly selected chromosomal mass of the same cell type (randomly paired, Fig. 4 B). The 214 pairs of angular measurements made in the daughter-paired chromosomal masses (Fig. 4 A) were highly correlated with each other (correlation coefficient = 0.788), whereas the randomly paired angles (Fig. 4 B) were not correlated (correlation coefficient = −0.087). The daughter-paired angular separations remained highly correlated after the morphologic separation into late-anaphase (54 pairs of measurements), telophase (58 pairs), and mixed/indeterminate (102 pairs) subgroups, with correlation coefficients of 0.856, 0.791, and 0.749, respectively. The randomly paired angles in these morphologic subgroups remained uncorrelated, with correlation coefficients of 0.010, −0.189, and −0.078, respectively.
Figure 4.
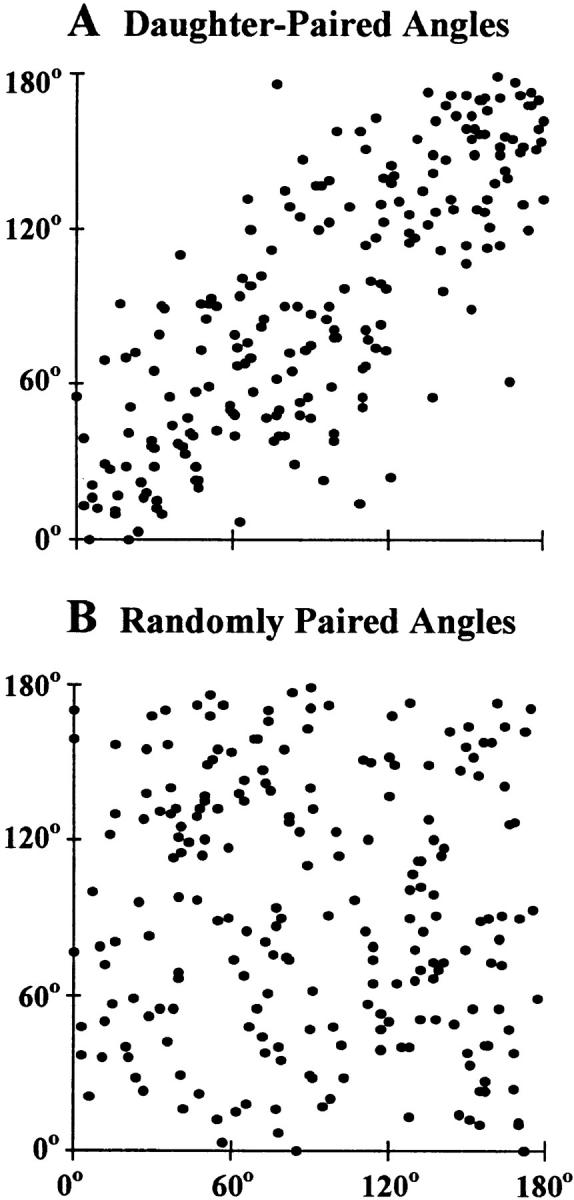
Correlation of the angles between the homologues of CCD-34Lu chromosomes X and 7 and MRC-5 chromosome 7 consecutively measured in 142 widely separated pairs of CCD-34Lu (n = 72) and MRC-5 (n = 70) chromosomal masses (214 pairs of angular measurements compared). The y-axis coordinate of each point plotted is the angle measured between a pair of homologues in one chromosomal mass with the x-axis coordinate being either the same angle measured in the other chromosomal mass of a pair (daughter-paired) or a randomly selected, nondaughter chromosomal mass of the same cell type (randomly paired). It can be seen that the daughter-paired measurements (A) are highly correlated (correlation coefficient = 0.788), whereas the randomly paired measurements (B) are not correlated (correlation coefficient = −0.087).
Discussion
We have found several lines of evidence for a largely random assortment of chromosomal positions on the mitotic rings of three human cell types. The first question addressed was whether or not the rigorous >90° separation for all human homologous chromosomes reported by Nagele et al. (1995) for several cell lines could be confirmed and extended to other nontransformed human cells. We were unable to confirm this finding of >90° separation of homologous chromosomes in rosettes of the CCD-34Lu line, a cell type in which this phenomenon had been reported previously to occur (Nagele et al., 1995), or in lymphocyte or MRC-5 rosettes. For all three cell types in our study, an equal number of rosette homologues were separated by <90° as by >90° (Fig. 2, A–C, and Fig. 3; see Appendix, Tables I and II). Also, the pooled x-axis distances between homologous early and mid-anaphase chromosomes of the lymphocytes, MRC-5, and CCD-34Lu cells strongly fit the random separation model and only weakly fit, or rejected, all other theoretical models of chromosomal separation (see Appendix, Fig. 7 and Tables III and IV). Finally, the individual angular separations measured in different pairs of late-anaphase rings between the homologues of CCD-34Lu chromosomes X and 7 and MRC-5 chromosome 7 were highly variable and thus incompatible with fixed chromosomal positions on the mitotic ring (see Appendix, Tables I and II). These differing results between our study and Nagele's study (1995) are not due to variations in fixation, as the CCD-34Lu chromosomes 7 and X have random positions in both Carnoy- and paraformaldehyde-fixed rosettes (see Appendix, Table I).
The previously reported finding of widely separated homologous chromosomes led to the speculation that all human chromosomes were in the same fixed order on the mitotic ring and in interphase (Nagele et al., 1995). In addition to our direct experimental evidence against widely separated and fixed chromosomal positions on the mitotic ring (Figs. 1–3; see Appendix, Fig. 7 and Tables I II III IV), there are strong theoretical arguments against Nagele's model of rigorously connected chromosomal positions being carried through interphase into subsequent mitotic and meiotic divisions (Nagele et al., 1995). This model requires permanent interconnections between chromosomes, or some other mechanism, to maintain chromosomal spatial order. Although interphase chromosomes are connected to each other, if not by nucleotide strands (Korf and Diacumakos, 1980), then by DNA–protein complexes (Maniotis et al., 1997), there is no evidence that such connections are permanent. The interphase positions of mammalian chromosomes are not static: Barr and Bertram (1949) showed that the position of the X chromosome shifted with electrical stimulation in postmitotic neurons. Shifts in interphase chromosomal positions have also been found in neurons from human epileptic cortex (Borden and Manuelidis, 1988), in lymphocytes during different phases of the cell cycle (Ferguson and Ward, 1992), and in other cells with differentiation (Manuelidis, 1984; Park and De Boni, 1992; Choh and De Boni, 1996). Finally, although Dipteran homologues are paired in adult flies (Metz, 1916), histone gene repeats on the Dipteran chromosome 2 are randomly positioned in the nucleus during the first 13 embryonic cell cycles, and only subsequently pair in late embryos (Hiraoka et al., 1993). It is difficult to imagine how such freedom of interphase chromosome movement, observed for a wide variety of cell types, can be reconciled with fixed and permanent connections between the chromosomes during interphase and on the mitotic ring. Also, if the fixed order of the relative positions of chromosomes on the mitotic ring was maintained from the initial fusing of parental haploid genomes into the next meiotic division, the random, Mendelian segregation of chromosomes could not occur.
A simple mechanism can reconcile many of the conflicting results reported for relative chromosomal positions on the mitotic ring: some have shown loosely organized, or even random, chromosomal positions (Hens, 1976; Nur, 1976; Korf and Diacumakos, 1977; Tanaka, 1981); and others have shown nonrandom positions on the ring (Schneiderman and Smith, 1962; Feldman et al., 1966; Heneen and Nichols, 1972; Juricek, 1975; Hens, 1976; Ferrer and Lacadena, 1977; Heslop-Harrison and Bennett, 1984; Nagele et al., 1995). Different chromosomes have discrete domains within the interphase nucleus (Boveri, 1909; Wilson, 1925; Zorn et al., 1979; Vogel and Krüger, 1983; Fussell, 1984; Hubert and Bourgeois, 1986; Ferguson and Ward, 1992; Cremer et al., 1993; Spector, 1993; Carmo-Fonseca et al., 1996; Choh and De Boni, 1996). In 1885, Rabl suggested that the radial chromosomal positions on the mitotic ring during mitosis were a reflection of the relative chromosomal positions in the preceding interphase (Rabl, 1885; Wilson, 1925). The prophase movements of chromosomes support this view, as there are no wide shifts in the positions of the prophase chromosomes relative to each other as they move to the metaphase plate (Bajer and Molè-Bajer, 1956, 1981; Tanaka, 1981; Fussell, 1984; Chaly and Brown, 1988; Hiraoka et al., 1990).
The relative positions of the chromosomes to each other may vary in different interphase cells due to heterogeneity of nucleolus formation from cell to cell (Hens, 1976; Tanaka, 1981; Hubert and Bourgeois, 1986; Borden and Manuelidis, 1988; Park and De Boni, 1992; Lawrence et al., 1993; Carmo-Foneseca et al., 1996), specific transcription patterns induced in response to local differentiation signals (Manuelidis, 1984; Park and De Boni, 1992; Choh and De Boni, 1996), random drift, and possibly other types of chromatin–nuclear envelope interactions (Lamond and Earnshaw, 1998). The shifts in chromosomal positions due to differentiation or in response to external signals may be related to the coupling of actively induced genes to the mRNA processing machinery. Pre-mRNA transcription sites are preferentially associated with discrete pre-mRNA splicing domains (Lawrence et al., 1993; Spector, 1993; Xing et al., 1995; Carmo-Fonseca et al., 1996). It is not clear whether the splicing domains are induced where transcription occurs, and/or whether actively transcribed genes move to these splicing domains (Lawrence et al., 1993; Spector, 1993; Xing et al., 1995; Carmo-Fonseca et al., 1996). If the latter were true, differentiated or induced gene activity would determine gene, and possibly chromosome, location. In support of this occurring, γ-amino butyric acid, a powerful inducer of specific gene expression in pheochromocytoma cells, induces chromatin movement and kinetochore rearrangements in cultured mouse neurons (Holowacz and De Boni, 1991). Also, estrogen induction of the vitellogenin gene family in male Xenopus laevis hepatocytes is associated with kinetochore rearrangements (Janevski et al., 1995).
In addition to our finding that seemingly all possible chromosomal arrangements may occur on the mitotic ring (Figs. 1–3; see Appendix, Fig. 7 and Tables I II III IV), several lines of evidence in our study also suggested that the relative positions of the chromosomes to each other on a given metaphase plate are transmitted into telophase with remarkable fidelity. First, the homologous centromeres clearly had symmetrical positions in the separating early and mid-anaphase chromosomal masses (Fig. 1 B, panel d, and Fig. 1 C, panel c), ruling out chaotic shifts of chromosomal positions during early karyokinesis. Second, rings similar to those of the prometaphase rosettes (Fig. 1 B, panel b) and metaphases (Fig. 1 B, panel c) are present in many late-anaphases (Fig. 1 A, bottom right-hand corner, Fig. 2 D, panel a, and Fig. 2 E, panel a); suggesting that the ring structure remains intact throughout karyokinesis. Finally, the centromeric positions measured in unselected, individual pairs of late-anaphase and telophase chromosomal masses are highly correlated (Fig. 2, D and E, and Fig. 4), confirming earlier claims of symmetrical chromosomal positions in nonmammalian late-anaphases (Rabl, 1885; Metz, 1916; Tanaka, 1981). All of these findings are consistent with the chromosomal positions on the mitotic plate being carried through anaphase into telophase.
This finding of a permissive mitotic ring which transmits its relative chromosomal order into both daughter telophases suggests a mechanism by which the chromosomal organization of a given interphase nucleus is reestablished in its progeny. Specifically, the nonrandom chromosomal positions of a given interphase cell, induced by nucleolus formation, gene activation, differentiation, or other factors, may lead to similar, nonrandom chromosomal positions on the mitotic ring. This is strongly supported by the results of UV radiation experiments which showed that irradiation of small parts of Go/G1 nuclei caused damage to only a few, usually nonhomologous, chromosomes that are later adjacent to each other on the mitotic ring (Zorn et al., 1979; Cremer et al., 1993), a finding consistent with adjacent interphase chromosomes injured by the irradiation ending up in close proximity to each other during mitosis. The symmetrical homologous chromosomes found in the daughter late-anaphase and telophase pairs in our (Fig. 2, D and E, and Fig. 4) and earlier (Rabl, 1885; Metz, 1916; Tanaka, 1981) studies can be simply explained by the carrying over of the relative chromosomal positions on the mitotic ring through anaphase into telophase. Taken together, these results suggest that the spatial chromosomal organization of the interphase nucleus is maintained from one generation to the next.
In summary, there is a relatively random organization of chromosomal positions on the mitotic rings of human MRC-5 cells, CCD-34Lu cells, and lymphocytes, in contrast to a previous report of an invariable >90° separation of homologous human chromosomes on the mitotic ring (Nagele et al., 1995). We also speculate that nonrandom chromosomal associations on the mitotic ring reported for other cell types may be due to the carrying over of nonrandom interphase chromosomal positions to the mitotic ring, and not to the mitotic ring apparatus selecting out a preferred radial chromosomal order before karyokinesis. Thus, our results show that a fixed order of chromosomal positions on the mitotic ring is not fundamental to, or necessary for, the mitotic segregation of human chromosomes, because human MRC-5 cells, CCD-34Lu cells, and lymphocytes go through mitosis quite smoothly. We also found that the relative positions of chromosomes on each metaphase ring seem to be carried through anaphase into telophase.
Acknowledgments
We thank Professors Allen White (Department of Biomathematics, M.D. Anderson Cancer Center, Houston, TX) and Hewson Swift (Department of Biology, The University of Chicago, Chicago, IL) for their thoughtful reviews. We also thank Elisabeth Lanzl, Kay Langenderfer, Melinda Anstead, Matthew Allison, and Chad Wallace for their help in preparing this manuscript.
This work was supported by the Cancer Biology Fund of the Medical College of Ohio Foundation.
Abbreviations used in this paper
FISH
fluorescence in situ hybridization
MRD
mitotic ring diameter
Appendix
Rosette Tables
Highly variable separations were found between each homologous pair of rosette chromosomes in male and female lymphocytes, MRC-5, and CCD-34Lu cells (Table I), a finding incompatible with fixed chromosomal positions on the mitotic ring. The relative positions of the sex and the somatic chromosomes, colocalized in rosette lymphocytes from a single male donor, were also measured. If the chromosomes are in a fixed order, or in the same position, in each male mitotic ring, the nearest angle between the X and Y chromosomes to each pair of somatic homologues should have the same value from rosette to rosette. This was not the case; the nearest rosette angle of each pair of somatic chromosomes with both sex chromosomes was highly variable (Table II). Finally, paraformaldehyde- and Carnoy-fixed CCD-34Lu rosettes had random positions between the homologues of the X and 7 chromosomes (Table I).
Early and Mid-Anaphase Assay
The angular separations between early and mid-anaphase chromosomes cannot be directly measured because their mitotic rings are largely perpendicular to the slide surface (Fig. 1 B, panel d, and Fig. 1 C, panel c). The linear distances between the FISH-localized chromosomes of these cells must be analyzed to estimate their relative ring positions. The first step is to align the images with a measuring coordinate system. Fig. 5 A shows a drawing of the anaphase in Fig. 1 C, panel c, with the addition of the mitotic spindle apparatus and the mitotic ring diameters (MRDs), placed through the mid-lateral edges of each chromosomal mass. In Fig. 5 B, the chromosomal masses are aligned so that their MRDs are on the x-axis of the measuring coordinate system, with the y-axis coordinates of one image inverted so that all positive y-axis directions are toward the nuclear pole (Fig. 5 B). The X, Y plane (focal plane) is parallel to the slide surface, and the z-axis is perpendicular to the slide surface (not shown).
Figure 5.

Coordinates for measuring chromosomal separations. (A) Anaphase from Fig. 1 C, panel c, showing the mitotic spindle apparatus and MRDs drawn through the mid-lateral edges of each chromosomal mass. Dots correspond to the centromere locations. (B) The MRDs of the chromosomal masses of A placed on the x-axis, with the y-axis coordinates in the right chromosomal mass image inverted so that all y-axis positive directions are toward the nuclear pole. The X, Y plane is parallel to the slide surface. (C) Composite in which the chromosomal masses of B are superimposed over each other. (D) Composite of the outer edges of 346 early and mid-anaphase lymphocyte chromosomal masses and 1,384 centromeric positions (dots). (E) Distances between the homologous chromosomes in five groups of chromosomal masses sorted by area: both the average X (black bars) and Y (white bars) distances between homologues increase with chromosomal mass area (correlation coefficients of 0.95 and 0.90, respectively). (F) Composite of the outer edges and centromeric positions of these chromosomal masses after the area of each chromosomal mass image has been adjusted to an identical MRD as in Fig. 1 C, panel d. (G) Relationship between chromosomal mass area and the interchromosomal distances after the area correction to an identical MRD. The x-axis distances are now independent of area (correlation coefficient = −0.11), whereas the y-axis measurements are still area dependent (correlation coefficient = 0.93).
Correction for Varying Anaphase Spread
A composite overlay (Fig. 5 C) of the images in Fig. 5 B shows imperfect alignment of the chromosomal mass edges and centromeric positions due to varying spread on the slide surface. Fig. 5 D is a composite of 346 chromosomal masses, where even more widely varying positions of the outer edges (black lines) and the centromeric positions (dots) are seen. This varying spread causes a correctable error in the linear distances measured between the FISH-localized chromosomes. Fig. 5 E shows the average X and Y distances between 692 pairs of homologous chromosomes measured in five equal groups of the chromosomal masses shown in Fig. 5 D, sorted by areas; both the X and Y distances between the same chromosomes are relatively longer in the larger chromosomal masses (correlation coefficients of 0.95 and 0.90, respectively). To correct this, each chromosomal mass area was adjusted to produce an identical MRD on the x-axis, as shown in Fig. 1 C, panel d, and Fig. 5 F. The x-axis distances between the chromosome pairs become independent of chromosomal mass area after this transformation (correlation coefficient = −0.11), whereas the y-axis distances remain highly area dependent (correlation coefficient = 0.93, Fig. 5 G).
Corrections for Fixation Distortions and Superimposed Chromosomes
Fig. 6 A is a frequency distribution of a large number of x-axis centromeric positions measured in early and mid-anaphase mitotic rings, creating a postfixation cross section of centromeric density in the X, Z plane, i.e., through the MRD (x-axis) and perpendicular to the slide surface (z-axis). It can be seen in Fig. 6 A that there are relatively fewer centromeres at either end of this curve (towards X = 0% and 100%), due to flattening of the mitotic ring edges from fixation to the slide. Fig. 6 A is also divided into 23 intervals, which contain the same number of centromeres. The x-axis positions of these intervals provide a scaling framework to correct for fixation distortions and for chromosomes superimposed over each other in the perpendicular early and mid-anaphase mitotic rings (Fig. 1 B, panel d, and Fig. 1 C, panel c).
Figure 6.
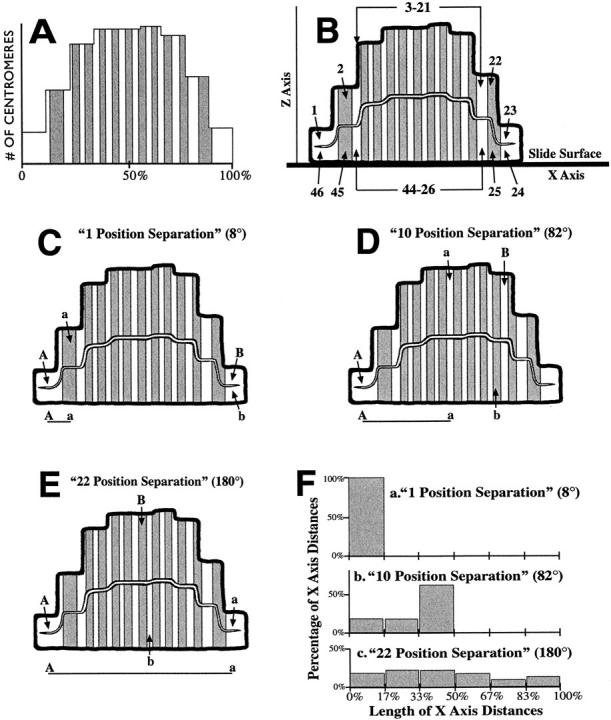
A scaling framework to reconstruct the x-axis distances between fixed anaphase chromosomes back to the native chromosomal sequence. (A) Distribution of the x-axis locations of 7,810 centromeres (2,154 MRC-5 cells and 5,656 lymphocytes) measured in chromosomal mass images aligned and transformed as in Fig. 1 C, panel d. The 23 light and shaded intervals each contain an identical number of centromeres. There are relatively fewer centromeres at either end of the x-axis (toward 0% or 100%) where the fixed mitotic ring edges stretch to meet the slide surface. (B) Panel A drawn as a fixation-distorted mitotic ring viewed in the Z, X plane: the z-axis is perpendicular to the slide surface with the x-axis through the MRD. B defines the x-axis locations of an upper set of chromosomes (labeled 1–23) farthest from the slide surface on the z-axis, and a bottom set of chromosomal locations (24–46) adjacent to the slide surface. The x-axis slide location of each individual upper-set chromosome is superimposed over that of a mirror-image chromosome of the bottom set. (C–E) Views of three mitotic rings fixed to the slide surface through the Z, X plane. Each panel shows the positions of two pairs of chromosomes with the same separation in the native mitotic ring, but fixed in different ring positions on the slide to produce maximum (labeled A and a) and minimum (labeled B and b) x-axis distances between them. (C) 1 position separation (8°) on the native mitotic ring. (D) 10 position separation (82°). (E) 22 position separation (180°). The A-a, or maximum, x-axis distances possible for each pair of chromosomes are also shown beneath each panel. (F) Theoretical distributions for the x-axis distances for two chromosomes with 1 position (8°, panel a), 10 position (82°, panel b), and 22 position (180°, panel c) of separation in the native mitotic ring.
In Fig. 6 B, this frequency distribution is drawn to represent a collapsed mitotic ring, with the 23 interval areas bisected to define the x-axis locations of two sets of 23 chromosomes; one in the top half and the other in the bottom half on the z-axis. The chromosome locations are labeled in a clockwise direction from 1 to 46 (1–23 top chromosome set, 24–46 bottom chromosome set). The x-axis location of each chromosome in the top chromosome set is superimposed over that of a chromosome in the bottom set, i.e., a chromosome located on the x-axis at 5% would have an equal chance of being in the locations labeled 1 or 46, and a chromosome in the center of the x-axis at 50% would have an equal chance of being in locations 12 or 35, and so on (Fig. 6 B). Fig. 6, C–E, shows the positions of two pairs of chromosomes (labeled Aa and Bb) in three fixed mitotic rings. Fig. 6 C shows two possible positions for chromosomes adjacent to each other in the native ring, or a 1 position (8°) separation. Fig. 6, D and E, shows two possible slide positions for pairs of chromosomes with native 10 position (82°, Fig. 6 D) and 22 position (180°, Fig. 6 E) separations. The chromosomes labeled A and a are in positions which give maximum x-axis distances, occurring when the chromosomes are not superimposed over each other and are towards either ring edge (X = 0% or 100%), where the interchromosomal distances on the x-axis are relatively longer (Fig. 6 B). The chromosomes labeled B and b are in positions giving minimum x-axis distances (Bb), occurring when the two chromosomes are superimposed over each other. It can be seen that the maximum x-axis distances are dependent upon the underlying chromosomal separations in the native, unfixed rings, being 11, 48, and 100%, respectively, for the 1, 10, and 22 position separations (labeled A–a in Fig. 6, C–E).
Calculation of X-Axis Distances for Different Native Chromosomal Separations
Assume that 46 anaphases, each with the same two chromosomes 10 positions apart in their mitotic rings, are fixed in 46 different positions on the slide surface. The first ring is fixed in a position so that the two chromosomes are in the locations labeled 1 and 11 in Fig. 6 B, or the positions drawn as A and a in Fig. 6 D. The next ring is fixed so that the two chromosomes are in locations 2 and 12, and the remaining 44 rings are fixed in positions so that the two chromosomes are in the locations labeled 3 and 13, 4 and 14, … 45 and 9, and 46 and 10 of Fig. 6 B, respectively. The 46 x-axis distances measured between these chromosome pairs in all 46 rings are the set of x-axis distances between the locations labeled 1–11, 2–12, 3–13, … 45–9, and 46–10 in Fig. 6 B. This set of 46 x-axis distances is the theoretical distribution for a 10 position (82°) chromosomal separation (Fig. 6 F, panel b). If several hundred, or more, early and mid-anaphases having two chromosomes with a 10 position separation were randomly fixed to a slide, the x-axis distances measured between each of these chromosome pairs would fall on, or close to, one of the 46 values in this 10 position theoretical distribution. Similarly, the theoretical distribution of measured x-axis distances for anaphases whose native mitotic rings have two adjacent chromosomes (8° or a 1 position separation, Fig. 6 F, panel a) consists of the x-axis distances between the locations 1–2, 2–3, 3–4, … 45–46, 46–1, and the theoretical distribution for two chromosomes with a native separation of 22 positions (180°, Fig. 6 F, panel c) consists of the x-axis distances between the locations 1–23, 2–24, 3–25, … 45–21, and 46–22 of Fig. 6 B.
To calculate these distributions, the mid-point x-axis coordinates of the 46 chromosome locations in Fig. 6 B are entered as both the row and column headings of a spreadsheet grid. The numerical values of the rows are subtracted from those of the columns, and the absolute values of the subtraction products paced into a square matrix. Thus, the x-axis distances between any two chromosomal positions in Fig. 6 B can be found at the convergence of the appropriate row and column headings of the matrix. The matrix rows are then shifted, with appropriate back filling, so that the first column of the matrix contains the x-axis distances for the theoretical values for a 1 position chromosomal separation, the second column of the matrix consists of the theoretical x-axis distances for a 2 position separation, and so on. The theoretical x-axis distance distributions for all possible, single angle separations for two chromosomes on the native mitotic ring are summarized in Table III. These distributions can be added to each other to create x-axis distance distributions for chromosomes separated in any discrete range on the native mitotic ring. The distribution of x-axis distances for two chromosomes distributed anywhere within 0–90° of each other on the native ring is represented by all of the x-axis distances in models 1–11 of Table III (Fig. 7 A). Similarly, the x-axis distances expected for two chromosomes always separated by at least 90° on the native ring consist of the x-axis distances in models 12–22 of Table III (Fig. 7 B), and the distribution of x-axis distances for two chromosomes randomly positioned on the native ring (0–180°) is made up of all of the x-axis distances in models 1–22 of Table III (Fig. 7 C).
Statistical Analysis and Model Parameters
The x-axis distances measured between the early and mid-anaphase chromosomes were placed into observed value distributions. 46 x-axis distances for each observed and theoretical distribution were sorted into six bins for χ2 analysis according to the formula: # bins = 1 + 3.3 log(n) (Sturges, 1926). When n in these distributions was >46, it was reduced to 46 by calculation of the percentage of x-axis distances for each bin in a six-bin sort, followed by multiplication of these percentages by 46. The x-axis distances between the majority of chromosomes are <4% (Fig. 6 B), less than the widths of the six bins used for statistical comparison (0–17, 17–33, 33–50, 50–67, 67–83, and 83–100%). Thus, a shift of a chromosome one or more locations out of the ideal registry on the x-axis due to fixation, or other distortions, may not prevent its measurement from being counted in the appropriate statistical bin. The model makes no assumptions on the anaphase mitotic ring's shape other than it being a closed, continuous structure with adjacent chromosomes. The model corrects for varying progress of the chromosomes toward the poles, as the polar movements of the chromosomes are placed on the y-axis and then discarded from analysis. Random distortions of chromosomal positions in the early and mid-anaphases from those of the metaphase plate due to the centromeres being on the inside or outside of the mitotic ring and/or to varying transit rates or paths during karyokinesis would, on average, be canceled out in measurement sets of sufficient sizes. If these errors were not random, they would impose a nonrandom chromosomal order on the early and mid-anaphase chromosomes. This was generally not the case (see below).
Early and Mid-Anaphase Results
Fig. 7, A–C, shows the theoretical distributions for two chromosomes separated by 0–90°, 90–180°, and 0–180° (random) from each other on the native mitotic ring. Fig. 7, D–F, shows the x-axis distances measured between 5,304 pairs of homologous chromosomes (1–22, XX, XY) in anaphase lymphocytes, 1,042 pairs of homologous chromosomes (11 and 17) in MRC-5 anaphases, and 816 pairs of homologous chromosomes (X and 7) in CCD-34Lu anaphases, respectively. The measured x-axis distributions (Fig. 7, D–F) closely resemble the random (0–180°) theoretical distribution (Fig. 7 C). The χ2 analysis of fit supports this conclusion (Table III), with a strong fit found between the pooled x-axis distances of the lymphocyte (Fig. 7 D), MRC-5 (Fig. 7 E), and CCD-34Lu homologues (Fig. 7 F) and the random model (P > 0.82, Table III). The lymphocyte and MRC-5 measurements did not fit any of the other theoretical models listed in Table III (P < 0.01). However, the pooled CCD-34Lu measurements also weakly fit the 131°, 139°, 164°, 180°, and 90°–180° theoretical models (P values = 0.080, 0.057, 0.086, 0.066, and 0.069, respectively, Table III). The x-axis distances measured in male and female lymphocytes only fit the random distribution (Table III).
Table IV shows the probability of fit of the x-axis distances measured between the individual early and mid-anaphase homologues for all lymphocyte chromosomes (1–22, XX, XY), MRC-5 chromosomes 11 and 17, and CCD-34Lu chromosomes 7 and X with the 0–90°, 90–180°, and 0–180° (random) models. 5, 10, and 23 of these 28 individual measurement sets fit (P > 0.05) the 0–90°, 90–180°, and 0–180° (random) theoretical models, respectively (Table IV). The average probabilities of fit between all of these 28 individual measurement sets and the 0–90°, 90– 180°, and the 0–180° (random) models were 0.068, 0.092, and 0.492, respectively. Thus, while there is some heterogeneity in the fit of these individual measurement sets, the overall ring positions of individual pairs of homologues were largely random (Table IV). The heterogeneity of results may have been a chance effect due to relatively small sample sizes, nonrandom transit times, and/or spatial pathways of certain chromosomes during karyokinesis, or to certain chromosomes in some cell types having higher proportions of homologue pairs with limited distribution ranges relative to each other on the ring than predicted by chance alone.
The x-axis distances measured between the sex and somatic chromosomes in the early and mid-anaphases further ruled out fixed chromosomal positions on the ring (Table IV). If the chromosomes are in a fixed order, in male mitotic rings 16 somatic homologues will always be within four positions on either side of the X and Y chromosomes; and all of the shortest x-axis distances measured between these 16 somatic and sex chromosomes would be <26%, the maximum x-axis distance for a 4 position chromosome separation (Table III). This was not the case: the range of every somatic chromosome's shortest x-axis distances to both the X and Y lymphocyte sex chromosomes well exceeded this 26% value (Table IV). Further, all 44 sets of shortest x-axis distances between the individual somatic and sex chromosomes rejected a fit with the 1 position theoretical model at the P < 0.001 level (data not shown), whereas four of these measurement sets should have fit this model strongly if fixed chromosomal positions existed on the ring. The P values of fit of these measurement sets to a 2-position theoretical model are also very low (Table IV), especially considering that these measurements selectively include the relatively small distances due to superimposed centromeres (Fig. 6, C–E).
References
- Bajer A, Molè-Bajer J. Cine-micrographic studies of mitosis in endosperm. II. Chromosome cytoplasmic and Brownian movements. Chromosoma. 1956;7:558–607. [Google Scholar]
- Bajer, A.S., and J. Molè-Bajer. 1981. Mitoses: studies of living cells: a revision of basic concepts. In Mitoses/Cytokineses. A.M. Zimmerman and A. Forer, editors, Academic Press, New York. 227–299.
- Barr ML, Bertram EG. A morphological distinction between neurons of the male and female, and the behavior of the nucleolar satellite during accelerated nucleoprotein synthesis. Nature. 1949;163:676–677. doi: 10.1038/163676a0. [DOI] [PubMed] [Google Scholar]
- Borden J, Manuelidis L. Movement of the X chromosome in epilepsy. Science. 1988;242:1687–1691. doi: 10.1126/science.3201257. [DOI] [PubMed] [Google Scholar]
- Boveri T. Die Blastomerenkerne von Ascaris megalocephala und die Theorie der Chromosomenindividualität. Arch Zellforschung. 1909;3:181–268. [Google Scholar]
- Carmo-Fonseca M, Cunha C, Custodio N, Carvalho C, Jordan P, Ferreira J, Parreira L. The topography of chromosomes and genes in the nucleus. Exp Cell Res. 1996;229:247–252. doi: 10.1006/excr.1996.0367. [DOI] [PubMed] [Google Scholar]
- Chaly N, Brown DL. The prometaphase configuration and chromosome order in early mitosis. J Cell Sci. 1988;91:325–335. doi: 10.1242/jcs.91.3.325. [DOI] [PubMed] [Google Scholar]
- Choh V, De Boni U. Spatial repositioning of centromeric domains during regrowth of axons in nuclei of murine dorsal root ganglion neurons in vitro. . J Neurobiol. 1996;31:325–332. doi: 10.1002/(SICI)1097-4695(199611)31:3<325::AID-NEU5>3.0.CO;2-C. [DOI] [PubMed] [Google Scholar]
- Cremer T, Kurz A, Zibbel R, Dietzel S, Rinke B, Schrock E, Speicher MR, Mathieu U, Jauch A, Emmerich P, et al. Role of chromosome territories in the functional compartmentalization of the cell nucleus. Cold Spring Harbor Symp Quant Biol. 1993;58:777–792. doi: 10.1101/sqb.1993.058.01.085. [DOI] [PubMed] [Google Scholar]
- Feldman M, Mello-Sampayo T, Sears ER. Somatic association in Triticum aestivum. . Proc Natl Acad Sci USA. 1966;50:1192–1199. doi: 10.1073/pnas.56.4.1192. [DOI] [PMC free article] [PubMed] [Google Scholar]
- Ferguson M, Ward DC. Cell-cycle dependent chromosomal movement in pre-mitotic human T-lymphocyte nuclei. Chromosoma. 1992;101:557–565. doi: 10.1007/BF00660315. [DOI] [PubMed] [Google Scholar]
- Ferrer E, Lacadena JR. Homologous somatic association in radial metaphase of Crepisspecies. Chromosoma. 1977;64:25–36. [Google Scholar]
- Fussell CP. Interphase chromosome order. A proposal. Genetics. 1984;62:193–201. [Google Scholar]
- Heneen WK, Nichols WW. Non-random arrangement of metaphase chromosomes in cultured cells of the Indian deer, Muntiacusmuntjak. Cytogenetics. 1972;11:153–164. doi: 10.1159/000130185. [DOI] [PubMed] [Google Scholar]
- Hens L. Chromosome distribution in Chinese hamster fibroblasts. Chromosoma. 1976;57:205–217. doi: 10.1007/BF00295207. [DOI] [PubMed] [Google Scholar]
- Heslop-Harrison JS, Bennett MD. Chromosome order: possible implications for development. J Embryol Exp Morph. 1984;83(Suppl.):51–73. [PubMed] [Google Scholar]
- Hiraoka Y, Agard DA, Sedat JW. Temporal and spatial coordination of chromosomal movement, spindle formation, and nuclear envelope breakdown during prometaphase in Drosophila melanogasterembryos. J Cell Biol. 1990;111:2815–2828. doi: 10.1083/jcb.111.6.2815. [DOI] [PMC free article] [PubMed] [Google Scholar]
- Hiraoka Y, Dernberg AF, Parmelee SJ, Rykowski MC, Agard DA, Sedat JW. The onset of homologous chromosome pairing during Drosophila melanogasterembryogenesis. J Cell Biol. 1993;120:591–600. doi: 10.1083/jcb.120.3.591. [DOI] [PMC free article] [PubMed] [Google Scholar]
- Holowacz T, De Boni U. Arrangement of kinetochore proteins and satellite DNA in neuronal interphase nuclei: changes induced by gamma-aminobutyric acid (GABA) Exp Cell Res. 1991;197:36–42. doi: 10.1016/0014-4827(91)90476-b. [DOI] [PubMed] [Google Scholar]
- Hubert J, Bourgeois CA. The nuclear skeleton and the spatial arrangement of chromosomes in the interphase nucleus of vertebrate somatic cells. Hum Genet. 1986;74:1–15. doi: 10.1007/BF00278778. [DOI] [PubMed] [Google Scholar]
- Janevski J, Park P, De Boni U. Organization of centromeric domains in hepatocyte nuclei: rearrangement associated with de novo activation of the Vitellogenin gene family in Xenopus laevis. . Exp Cell Res. 1995;217:227–239. doi: 10.1006/excr.1995.1082. [DOI] [PubMed] [Google Scholar]
- Juricek DK. Non-random chromosome distribution in radial metaphases from the Chinese hamster. I. Uncultured cells. Chromosoma. 1975;50:313–326. doi: 10.1007/BF00283474. [DOI] [PubMed] [Google Scholar]
- Korf BR, Diacumakos EG. Random arrangement of mitotic chromosomes in radial metaphases of the Indian muntjac. Cytogenet Cell Genet. 1977;19:335. doi: 10.1159/000130827. [DOI] [PubMed] [Google Scholar]
- Korf BR, Diacumakos EG. Absence of true intrachromosomal connections in microsurgically isolated chromosomes. Exp Cell Res. 1980;130:377–385. doi: 10.1016/0014-4827(80)90015-4. [DOI] [PubMed] [Google Scholar]
- Lamond AI, Earnshaw WC. Structure and function in the nucleus. Science. 1998;280:547–553. doi: 10.1126/science.280.5363.547. [DOI] [PubMed] [Google Scholar]
- Lawrence JB, Carter KC, Xing X. Probing functional organization within the nucleus: is genome structure integrated with RNA metabolism? . Cold Spring Harbor Symp Quant Biol. 1993;58:807–818. doi: 10.1101/sqb.1993.058.01.088. [DOI] [PubMed] [Google Scholar]
- Maniotis AG, Bojanowski K, Inger DE. Mechanical continuity and reversible chromosome disassembling within intact genomes rendered from living cells. J Cell Biochem. 1997;65:114–130. [PubMed] [Google Scholar]
- Manuelidis L. Different central nervous system cell types display distinct and nonrandom arrangements of satellite DNA sequences. Proc Natl Acad Sci USA. 1984;81:3123–3127. doi: 10.1073/pnas.81.10.3123. [DOI] [PMC free article] [PubMed] [Google Scholar]
- Metz CW. Chromosome studies on the diptera. II. The paired association of chromosomes in the Diptera, and its significance. J Exp Zool. 1916;21:213–279. [Google Scholar]
- Nagele R, Freeman T, McMarrow L, Lee H-Y. Precise spatial positioning of chromosomes during prometaphase: evidence for chromosomal order. Science. 1995;270:1831–1835. doi: 10.1126/science.270.5243.1831. [DOI] [PubMed] [Google Scholar]
- Nur U. Random arrangement of chromosomes in a radial metaphase configuration. Chromosoma. 1976;40:263–267. [Google Scholar]
- Park PC, De Boni U. Spatial rearrangement and enhanced clustering of kinetochores in interphase nuclei of dorsal root ganglion in vitro: association with nucleolar fusion. Exp Cell Res. 1992;203:222–229. doi: 10.1016/0014-4827(92)90058-g. [DOI] [PubMed] [Google Scholar]
- Rabl C. Uber Zelltheilung. Morphol Jahrbot. 1885;10:214–330. [Google Scholar]
- Schneiderman CJ, Smith CAB. Non-random distribution of certain homologous pairs of normal human chromosomes in metaphase. Nature. 1962;195:1229–1230. doi: 10.1038/1951229a0. [DOI] [PubMed] [Google Scholar]
- Spector DL. Macromolecular domains within the cell nucleus. Annu Rev Cell Biol. 1993;9:265–315. doi: 10.1146/annurev.cb.09.110193.001405. [DOI] [PubMed] [Google Scholar]
- Sturges HA. The choice of class interval. J Am Statist Assoc. 1926;21:65–66. [Google Scholar]
- Tanaka N. Studies on chromosome arrangement in some higher plants. III. Haplopappus gracilis (2n = 4) and Crepis capillaris(2n = 6) Cytologia. 1981;46:545–559. [Google Scholar]
- Vogel F, Krüger J. Is there a general relationship between estimated chromosomal distances in interphase and location of genes with related functions? . Hum Genet. 1983;63:362–368. doi: 10.1007/BF00274763. [DOI] [PubMed] [Google Scholar]
- Wilson, E.B. 1925. The Cell in Development and Heredity. The Macmillan Company, New York. 1232 pp.
- Xing Y, Johnson CV, Moen PT, McNeil JA, Lawrence JB. Nonrandom gene organization: structural arrangements of specific pre-MRNA transcription and splicing with SC-35 domains. J Cell Biol. 1995;131:1635–1647. doi: 10.1083/jcb.131.6.1635. [DOI] [PMC free article] [PubMed] [Google Scholar]
- Zorn C, Cremer C, Cremer T, Zimmer J. Unscheduled DNA synthesis after partial UV irradiation of the cell nucleus. Exp Cell Res. 1979;124:111–119. doi: 10.1016/0014-4827(79)90261-1. [DOI] [PubMed] [Google Scholar]