Spatio-temporal activation of caspase revealed by indicator that is insensitive to environmental effects (original) (raw)
Abstract
Indicator molecules for caspase-3 activation have been reported that use fluorescence resonance energy transfer (FRET) between an enhanced cyan fluorescent protein (the donor) and enhanced yellow fluorescent protein (EYFP; the acceptor). Because EYFP is highly sensitive to proton (H+) and chloride ion (Cl−) levels, which can change during apoptosis, this indicator's ability to trace the precise dynamics of caspase activation is limited, especially in vivo. Here, we generated an H+- and Cl−-insensitive indicator for caspase activation, SCAT, in which EYFP was replaced with Venus, and monitored the spatio-temporal activation of caspases in living cells. Caspase-3 activation was initiated first in the cytosol and then in the nucleus, and rapidly reached maximum activation in 10 min or less. Furthermore, the nuclear activation of caspase-3 preceded the nuclear apoptotic morphological changes. In contrast, the completion of caspase-9 activation took much longer and its activation was attenuated in the nucleus. However, the time between the initiation of caspase-9 activation and the morphological changes was quite similar to that seen for caspase-3, indicating the activation of both caspases occurred essentially simultaneously during the initiation of apoptosis.
Keywords: FRET; caspase-3; caspase-9; nuclear activation of caspase-3; apoptosis
Introduction
Programmed cell death, or apoptosis, is an essential event for animal development and is observed in many developing tissues in both invertebrates and vertebrates. The activation of the caspase family is a central event in apoptosis. 14 members of the caspase family have been reported in mammals (Shi, 2002); seven in Drosophila melanogaster (Kumar and Doumanis, 2000), and three in Caenorhabditis elegans (Cryns and Yuan, 1998). All the caspases are synthesized in a precursor form that requires processing for activation of the enzyme. Downstream caspases, such as caspase-3, are activated by upstream caspases and then cleave many intracellular target proteins to induce apoptotic cell death. Previous reports showed that caspase-9– and caspase-3–null mutant mice exhibit reduced apoptosis and morphological abnormalities in the developing brain, including an expanded ventricular zone, ectopic neuronal structures, and gross brain malformations (Kuida et al., 1996; Hakem et al., 1998; Kuida et al., 1998). Knockout mice lacking the caspase activator protein Apaf-1 also exhibit reduced apoptosis in the embryonic brain and striking craniofacial abnormalities, with a hyperproliferation of neural cells (Cecconi et al., 1998; Yoshida et al., 1998). These findings strongly indicate that caspase activation is critical for normal development, especially in the brain.
Fluorescence resonance energy transfer (FRET)* technology can provide significant information about the dynamics and pattern of endogenous caspase activation in vivo_._ Several papers have reported the use of recombinant caspase substrates composed of enhanced cyan fluorescence protein (ECFP) as the FRET donor and enhanced yellow fluorescence protein (EYFP) as the FRET acceptor, linked by peptides containing the caspase-3 cleavage sequence, DEVD (Tyas et al., 2000; Luo et al., 2001; Rehm et al., 2002). The development of such indicators has enabled researchers to monitor caspase activation at the single-cell level in real time. However, these indicators may have some limitations in the in vivo monitoring of caspase activation for a number of reasons. First, the molar extinction coefficient of the acceptor protein is an important factor for determining the efficiency of FRET; however, the molar extinction coefficient of EYFP is highly dependent on the proton (H+) concentration, especially under physiological pH conditions (pH 7.3; Llopis et al., 1998). Second, EYFP is also highly sensitive to chloride ions (Cl−; Jayaraman et al., 2000). In fact, owing to these characteristics, EYFP has been used as an indicator for pH and Cl−; EYFP-expressing transgenic mice are successfully used to detect pH and Cl− concentration changes in vivo (Metzger et al., 2002). Thus, with changes in H+ or Cl− concentrations, indicators using EYFP as the FRET acceptor may detect signals that are not caused by caspase activity. Several reports have suggested that acidification occurs during apoptosis (Perez et al., 1995; Vincent et al., 1999; Matsuyama et al., 2000) and that the Cl−/HCO3 − antitransporter is involved in apoptotic events (Maeno et al., 2000; Araki et al., 2002). Because a change in Cl− concentration is also known to be associated with neuronal activity, it is crucial to use a Cl− insensitive indicator for monitoring caspases in neurons. A ratiometric indicator (Clomeleon) in which CFP combined with YFP via a flexible peptide linker, similar to the CY3 construct, was used as a reporter of intracellular Cl− concentration ([Cl−]i) in cultured hippocampal neurons (Kuner and Augustine, 2000). Using Clomeleon, changes in the somatic [Cl−]i were observed to spread into dendrites after the focal activation of GABAA receptors on the soma of a neuron. It would be hard to distinguish whether changes in the ECFP/EYFP ratio were caused by [Cl−]i changes or caspase activation in neurons. For these reasons, EYFP-based activated caspase indicators must be improved for the reliable monitoring of caspase activation in vivo.
Venus is a variant of EYFP that exhibits fast and efficient maturation at 37°C (Nagai et al., 2002). The use of Venus as an acceptor for FRET in the Ca2+ indicator (YC2.12) allows the Ca2+ signal to be detected immediately after the gene is introduce into cells. Furthermore, the absorption efficiency of Venus is significantly less sensitive to H+ and Cl− than that of EYFP. Therefore, Venus should be a more suitable FRET acceptor than EYFP in indicators for activated caspase. In this paper, we report an improved indicator for caspase activation based on the FRET method (SCAT) that uses Venus in place of EYFP. We clearly show that SCAT is highly resistant to changes in H+ and Cl− concentration in vitro and insensitive to environmental effects in living cells, allowing us to detect reliable signals for caspase activation. We also show the spatio-temporal dynamics of caspase-3 (DEVDase) activation in the cytosol and nuclei using SCAT3. Finally, by monitoring caspase-9 (LEHDase) in living HeLa cells using SCAT9, we report for the first time a difference in the spatio-temporal dynamics between initiator and executioner caspases.
Results
Improved indicator for activated caspase: SCAT
We generated a hybrid protein, ECFP-Venus, with an 18-amino acid linkage. The linking sequences contained an optimum sequence for caspase cleavage, which was used in a previous report (Tyas et al., 2000). Caspase activity is detected from the FRET from ECFP to Venus; thus, cleavage of the linker peptide by activated caspases abolishes the FRET (Fig. 1 A). We named this indicator SCAT (a sensor for activated caspases based on FRET). We constructed two SCATs, SCAT3 and SCAT9, which contained the DEVD (SCAT3) or LEHD (SCAT9) sequence in the linker region, which is mainly cleaved by caspase-3 or caspase-9, respectively (Thornberry et al., 1997; Fig. 1 B). We constructed SCAT3 (DEVG) for control experiments; it contained a glycine substituted for a critical aspartic acid as the fourth residue of the cleavage site. To detect the nuclear activation of caspase-3, we also constructed nuclear localization signal (NLS)-SCAT3.
Figure 1.
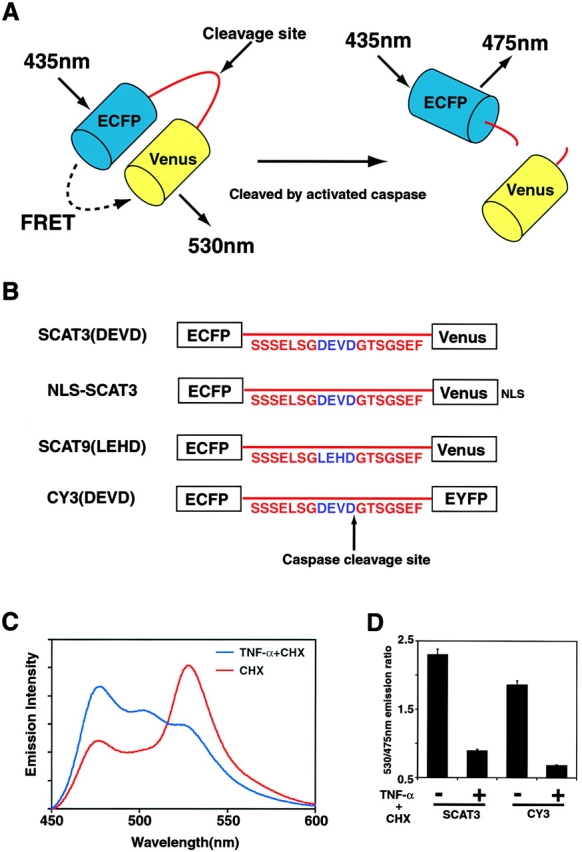
An improved indicator for activated caspases: SCAT. (A) Schematic representation of SCAT. (B) Linker sequences of the SCAT family of indicators. (C) Spectral analysis of SCAT3 in cells exposed to TNF-α/CHX. HeLa cells in 100-mm dishes were transfected with 6 μg pcDNA-SCAT3. 18 h after transfection, the cells were exposed to CHX or TNF-α/CHX and incubated for 6 h. The cell suspensions were then subjected to spectral analysis. (D) Changes in the emission ratio (530/475 nm) of SCAT3 compared with CY3 in cells treated with TNF-α/CHX. The cell suspensions were prepared as described above. The 530/475-nm emission ratio was measured with an excitation wavelength at 435 nm. The data represent results from three independent experiments. Error bars indicate SD.
To confirm the FRET in the SCAT protein, SCAT3 was expressed in HeLa cells, which were then treated with tumor necrosis factor-α/cycloheximide (TNF-α/CHX), and the emission spectra of the cell suspensions were measured (Fig. 1 C). Before TNF-α/CHX treatment, bimodal emission peaks at 475 and 530 nm were observed with excitation at 435 nm. After 6 h of exposure to TNF-α/CHX, which strongly activates caspase-3, the emission peak at 530 nm disappeared and the peak at 475 nm rose, suggesting the cleavage of the linker. To confirm that the emission peak at 530 nm was caused by FRET, the acceptor Venus was photobleached by strong excitation at 525 nm, which does not bleach ECFP. As expected, the emission peak at 475 nm was dequenched, indicating that there was FRET between ECFP and Venus in SCAT (unpublished data).
The value for the 530/475 nm emission ratio of SCAT3 changed from 2.29 to 0.90 in response to TNF-α/CHX treatment, whereas the ratio for CY3 changed from 1.86 to 0.68 (Fig. 1 D). The wider dynamic range of the FRET signal from SCAT3 (1.40 ± 0.08; n = 3) compared with that from CY3 (1.18 ± 0.05; n = 3) may be explained by the complete maturation of Venus, the acceptor contained in SCAT3.
SCAT is resistant to pH and Cl− concentration changes
Our initial goal was to generate an indicator for caspase activation under physiological conditions, such as in a developing embryo. It is important that the indicator does not detect any signals except for caspase activation. We noticed that CY3 was significantly sensitive to changes in the concentration of both H+ and Cl− (Fig. 2, A and B) in vitro. For example, acidification from pH 7.5 to 7.0 decreased the emission ratio of CY3 by 26%. Under the same conditions, only a 0.01% decrease was observed for SCAT3. Therefore, SCAT3 was highly stable under these conditions compared with CY3.
Figure 2.
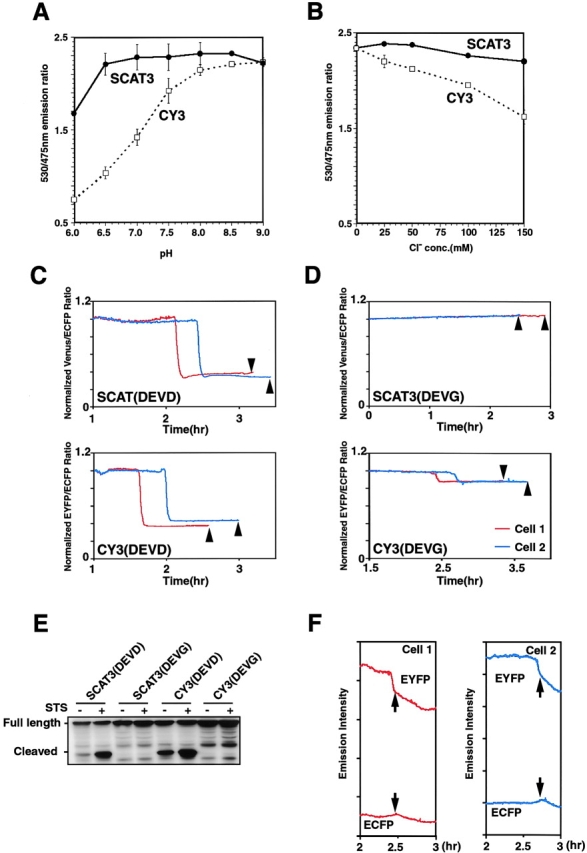
Properties of SCAT3 and CY3. pH resistance (A) and Cl− resistance (B) of SCAT3 compared with CY3. HeLa cells transfected with pcDNA-SCAT3 or pCFP-_DEVD_-YFP were lysed with 0.5% Triton X-100–containing buffer. The 530/475-nm emission ratio was determined with a 435-nm excitation wavelength. The data represent results from three independent experiments. Error bars indicate SD. (C and D) The stability of SCAT compared with CY3 in living single cells. The imaging analysis was started on exposing HeLa cells to 1 μM STS at 18 h after transfection. To compare SCAT3 and CY3, the emission ratio was normalized by defining the baseline ratio before the FRET disruption as 1. Arrowheads indicate the time cells first showed the early apoptotic cell death morphology, including membrane blebbing and cell shrinkage. (E) Western blot analysis of SCAT3- or CY3-expressing HeLa cells exposed by STS. (F) The emission intensity profiles of EYFP and ECFP in CY3 (DEVG)-expressing HeLa cells. Cells 1 and 2 are the same as those shown in D. Arrows indicate the time of the emission ratio decrease in CY3 (DEVG) in D.
To examine these effects in living cells, we monitored the FRET of SCAT3 or CY3 in HeLa cells treated with an apoptosis inducer, staurosporine (STS). A decrease in FRET was observed in SCAT3 and CY3 in response to STS treatment (Fig. 2 C), and these substrate cleavages were confirmed by Western blotting (Fig. 2 E). The caspase cleavage site mutant, SCAT3 (DEVG), did not show any FRET changes until the cells had completely adopted the apoptotic morphology. However, all of the CY3 (DEVG)-expressing HeLa cells showed a significant decrease in FRET (15.1 ± 4.4%, compared with the decrease seen with CY3, n = 21; Fig. 2 D) without CY3 (DEVG) cleavage in the presence of STS (Fig. 2 E). The decrease in the emission ratio of CY3 (DEVG) was caused by a decrease in the emission intensity of EYFP and an increase in the emission intensity of ECFP (Fig. 2 F). Only a small percentage of the SCAT (DEVG)-expressing cells showed a decrease in signal like the one seen with CY3 (DEVG; 2 of 16 cells examined), but the decrease in FRET of SCAT (DEVG) was less than that of CY3 (DEVG; 4.5 and 3.3%, respectively). SCAT becomes sensitive to pH to some extent if the pH is below 6.5, and it is possible that this kind of severe change may occur in a small percentage of cells. Together, these results indicate that SCAT can detect the activation of caspases more specifically than CY3.
Specificity of SCAT3 for activated caspase-3 in apoptotic HeLa cell extract
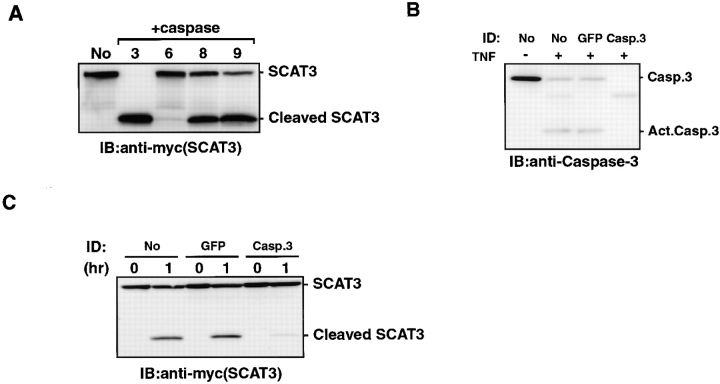
Next, we examined the specificity of SCAT3 for activated caspases in vitro. In vitro_-_synthesized SCAT3 protein was incubated with several activated caspases (Fig. 3 A). It was efficiently cleaved by caspase-3 and partially cleaved by caspase-8 and caspase-9 in vitro. In contrast, little SCAT3 was cleaved by caspase-6. To investigate the specificity of SCAT3 in the TNF treated cell lysates, we performed immunodepletion experiments to remove caspase-3 from TNF-α/CHX-treated HeLa cell lysates. Caspase-3 activation was observed at TNF-α/CHX-treated lysates (Fig. 3 B), then caspase-3 precursor and its activated form were depleted from apoptotic lysates by an anti-caspase-3 antibody. As a control, we incubated TNF-α/CHX-treated lysates with an anti-GFP antibody. We then examined SCAT3 cleavage in these extracts. SCAT3 was effectively cleaved in the control TNF-α/CHX-treated lysates (whether or not they had been treated with the GFP antibody). On the other hand, only a small portion of the SCAT3 was cleaved in the caspase-3–depleted lysates. These results indicated that most of the SCAT3 cleavage in TNF-α/CHX-treated HeLa cell lysates was done by caspase-3.
Figure 3.
The specificity of SCAT3 for activated caspase-3 in TNF-α/CHX-treated HeLa cell lysates. (A) In vitro cleavage analysis of SCAT3. SCAT3 synthesized in vitro was incubated with 1 U of purified activated caspase-3, -6, -8, or -9 for 1 h. The reaction mixture was subjected to Western blotting using an anti-myc mAb. (B) Immunodepletion of caspase-3 from TNF-α/CHX-treated HeLa cell lysates. 20 μg of immunodepleted lysates were subjected to Western blotting using an anti–caspase-3 rabbit pAb (Invitrogen). (C) Cleavage assay of SCAT3 in caspase-3–depleted lysates. SCAT3 synthesized in vitro was incubated with 12 μg caspase-3–depleted lysates prepared from TNF-α/CHX-treated HeLa cells for the indicated periods, and then its cleavage was examined by Western blotting using an anti-myc antibody.
Real-time imaging of the dynamics and patterning of caspase-3 activation in living HeLa cells
Using SCAT3, we monitored the activation of caspase-3 (DEVDase) in living HeLa cells after TNF-α/CHX exposure. The cleavage of SCAT3, but not of SCAT3 (DEVG), after TNF-α/CHX treatment was observed by Western blot analysis (Fig. 4 A), and we could not detect a significant ratio change in the SCAT3 (DEVG) FRET in response to TNF-α/CHX (unpublished data). We found that once caspase-3 activation was initiated in the cytosol, it progressed very rapidly, reaching its maximum in 7.2 ± 1.8 min (n = 13; Fig. 4, B and C, and Video 1, available at http://www.jcb.org/cgi/content/full/jcb.200207111/DC1). These imaging analyses also enabled us to observe the activation of caspase-3 in the nucleus (see next paragraph).
Figure 4.
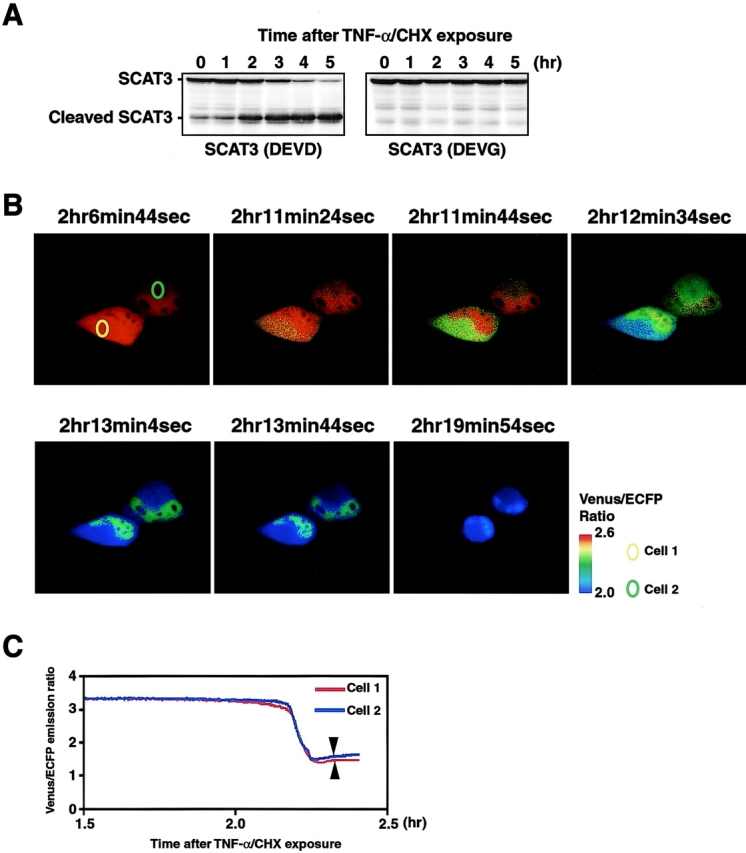
Single-cell imaging analysis of SCAT3-expressing living HeLa cells. (A) Western blot analysis of SCAT3-expressing HeLa cells exposed to TNF-α/CHX. HeLa cells in a 6-well plate were transfected with 1 μg pcDNA-SCAT3. Cells were exposed to 50 ng/ml TNF-α and 10 μg/ml CHX 18 h after transfection. The cells were then lysed with sample buffer at the indicated times. The lysates were examined by Western blotting using an anti-myc antibody. (B) Ratio images of the SCAT3- expressing cells. HeLa cells were transfected with 0.5 μg pcDNA-SCAT3. Imaging analysis was started 18 h after transfection. (C) Venus/ECFP emission ratio changes of individual cells examined in B. Arrowheads indicate the time cells first showed the early apoptotic cell death morphology, including membrane blebbing and cell shrinkage.
Nuclear activation of caspase-3 precedes the apoptotic nuclear morphological change
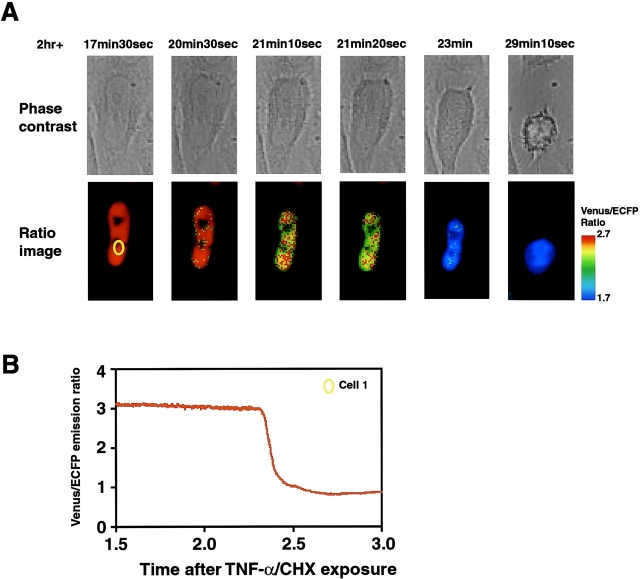
We constructed and expressed NLS-SCAT3, in which an NLS was placed at the COOH terminus (Fig. 5 A). We monitored the nuclear morphology by phase-contrast images at the same time. We observed that in the presence of TNF-α/CHX, caspase-3 was activated in the nucleus. Interestingly, the simultaneous observation of morphology and fluorescence revealed that the nuclear activation of caspase-3 preceded the apoptotic nuclear morphological changes, such as nuclear fragmentation. In addition, we observed the leakage of NLS-SCAT3 protein from the nucleus into the cytosol when the nuclear morphological changes had been completed (Fig. 5 A). We also found that, as observed in the cytosol, the nuclear activation of caspase-3 was a rapid process, reaching its maximum in 11.6 ± 3.7 min (n = 17; Fig. 5 B).
Figure 5.
Nuclear activation of caspase-3 precedes apoptotic nuclear changes. (A) Ratio images and phase-contrast images of NLS-SCAT–expressing cells. HeLa cells were transfected with 0.5 μg pcDNA-SCAT3. Imaging analysis was started 18 h after transfection. (B) Venus/ECFP emission ratio changes of individual cells examined in A.
Specificity of SCAT9 for caspase-9 in apoptotic HeLa cell extract
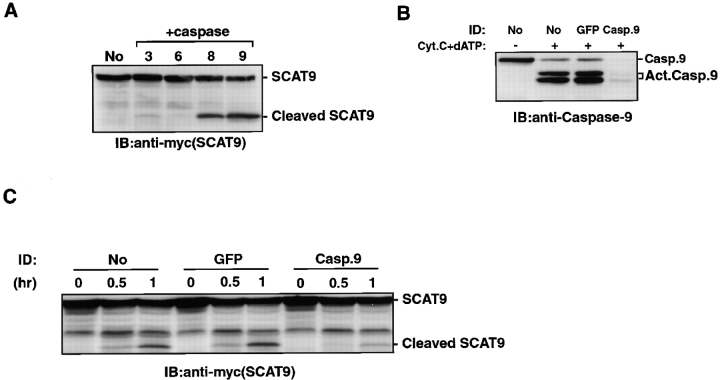
The caspase-9–mediated mitochondrial pathway is critical for the physiological apoptosis that occurs in normal development (Cecconi et al., 1998; Hakem et al., 1998; Kuida et al., 1998; Yoshida et al., 1998). To examine the caspase-9 activation by real-time imaging analysis, we constructed SCAT9, which contains a caspase-9 cleavage-site sequence, LEHD, in its linker region. To test whether SCAT9 could be cleaved specifically by caspase-9, the SCAT9 protein was generated in vitro and incubated with recombinant activated caspase-3, caspase-6, caspase-8, and caspase-9. SCAT9 was cleaved by caspase-8 and caspase-9 with the same efficiency but not by caspase-3 or caspase-6 (Fig. 6 A). We then first examined SCAT9 specificity in TNF-α/CHX-treated HeLa cell lysate. Because of the weak enzymatic activities of caspase-9 in apoptotic extracts from TNF-α/CHX-treated HeLa cells, only the small amount of SCAT9 cleavage was observed in this lysate. In stead, we examined its specificity in apoptotic HeLa extract induced by cytochrome c and dATP. Most of pro- and activated caspase-9 was immunodepleted from apoptotic lysate (Fig. 6 B), and SCAT9 cleavage was examined using caspase-9 depleted lysate. SCAT9 was cleaved in the apoptotic lysates but its cleavage was significantly but not completely blocked by the immunodepletion of caspase-9 (Fig. 6 C). Because we could detect a small amount of caspase-9 in the caspase-9–depleted lysates, it is possible that residual caspase-9 cleaved the SCAT9 in the caspase-9–depleted apoptotic lysate. However, we cannot exclude the possibility that other caspases were involved in this cleavage.
Figure 6.
Specificity of SCAT9 for activated caspase-9 in apoptotic HeLa cell extract. (A) In vitro cleavage analysis of SCAT9. SCAT9 synthesized in vitro was cleaved by purified activated caspase-3, -6, -8, or -9 for 1 h. The reaction mixture was then subjected to Western blotting using an anti-myc mAb. (B) Immunodepletion of caspase-9 from dATP/cytochrome c activated apoptotic HeLa extract. Immunodepleted extracts (18 μg) were subjected to Western blotting using an anti-caspase-9 mouse mAb. Both the precursor and activated forms of caspase-9 could be depleted from the extracts. (C) Cleavage assay of SCAT9 in caspase-9–depleted apoptotic extracts. SCAT9 synthesized in vitro was incubated with 18 μg caspase-9–depleted apoptotic extracts for the indicated periods. The reacted lysates were then examined by Western blotting using an anti-myc antibody.
Real-time imaging analysis of caspase-9 using SCAT9
SCAT9 was cleaved in HeLa cells after exposure to TNF-α/CHX (Fig. 7 A). Therefore, we used SCAT9 to monitor the caspase-9 activation in living HeLa cells (Fig. 7 B and Video 2). Activation was observed in the cytosol, but it was unclear in the nuclei. In contrast to the caspase-3 activation by TNF-α/CHX, the activation of caspase-9 was a very slow process that took at least 48 min (n = 13) to reach its maximum (see Fig. 7 C, where it took 77.5 min and 91.5 min in cell 1 and cell 2, respectively). However, the time from the initial caspase-9 activation to the formation of apoptotic morphological changes was 10.1 ± 2.1 min (n = 13), which was similar to the time course seen with caspase-3 (10.0 ± 2.1 min; n = 13). Therefore, these results indicate that the initiation of the caspase-3 and caspase-9 activation occurred at almost the same time, but caspase-3 and caspase-9 activation was completed before and after the apoptotic morphological changes, respectively (Fig. 7 D).
Figure 7.
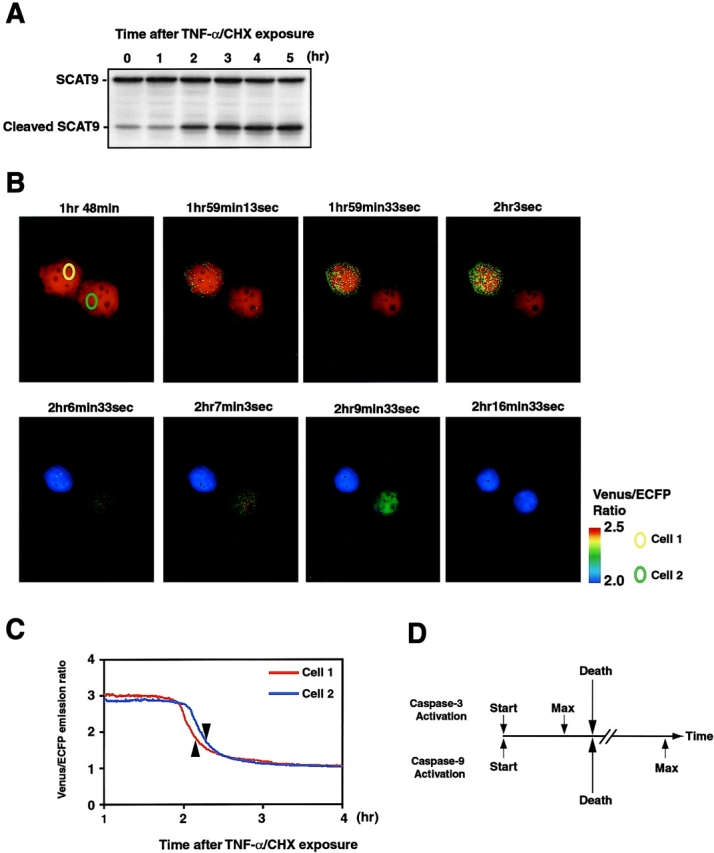
Single-cell imaging analysis of caspase-9 activation using SCAT9. (A) Western blot analysis of SCAT9-expressing HeLa cells treated with TNF-α/CHX. HeLa cells cultured in a 6-well plate were transfected with 1 μg pcDNA-SCAT9. The cells were treated with 50 ng/ml TNF-α and 10 μg/ml CHX 18 h after the transfection. The cells were then lysed with sample buffer at the indicated times. The lysates were examined by Western blotting using an anti-myc antibody. (B) Ratio images of the SCAT9-expressing HeLa cells exposed to 50 ng/ml TNF-α and 10 μg/ml CHX. HeLa cells were transfected with 0.5 μg pcDNA-SCAT9. Imaging analysis was started 18 h after transfection. (C) Venus/ECFP emission ratio changes of individual cells examined in B. Arrowheads indicate the time cells first showed early apoptotic cell death morphological changes, such as membrane blebbing and cell shrinkage. (D) Schematic representation of the activation profile of caspase-3 (DEVDase) and -9 (LEHDase). Arrows indicate the time point of each event.
Discussion
In this work, we developed an improved activated caspase monitoring protein named SCAT. By using Venus as a FRET acceptor, we made SCAT highly resistant to acidification and high Cl− concentration, as assessed by in vitro titration assays. SCAT is thus an ideal indicator for reliably detecting FRET signals that are associated with caspase activation. During animal development, apoptosis is detected in specific regions of the morphogenesis. For example, many cells undergoing apoptosis are observed in the hindbrain roof plate during neural tube closure (Weil et al., 1997), and limb buds are shaped by the apoptotic cell death of the interdigital cells (Zou and Niswander, 1996). These apoptotic cell deaths are likely to be specifically patterned and are associated with normal development. Therefore, caspases must play a critical role in development through their involvement in apoptosis. The generation of transgenic animals expressing SCAT will enable us to investigate the spatio-temporal activation of the caspases in developmental apoptosis in vivo. Because SCAT is insensitive to changes in Cl− and H+, it is especially useful for monitoring caspase activation in neurons. Recently, apoptosis-independent (but activity-dependent) caspase activation was reported in primary cortical neurons (Meyer et al., 2002). SCAT will also provide an indispensable tool to elucidate the physiological roles and activation mechanisms of caspases independent of apoptosis in neurons. In this report, the use of NLS-SCAT permitted us to show that the nuclear activation of caspase-3 preceded the observation of apoptotic nuclear morphological changes. The precursor form of caspase-3 is predominantly synthesized in the cytosol (Chandler et al., 1998; Mancini et al., 1998; Zhivotovsky et al., 1999; Faleiro and Lazebnik, 2000). Together, our data and these reports indicate that activated caspase-3 can be translocated from the cytosol into the nucleus. Although many caspase-3 substrates have been reported, the significance of the nuclear activation of caspase-3 has not yet been studied. ICAD and CAD complex, which is responsible for the apoptotic nuclear fragmentation, also reside in the nucleus in nonapoptotic cells. (Lechardeur et al., 2000). It might be possible that CAD is activated by cleavage of ICAD in nucleus. Nuclear lamins are intermediate filament proteins that are major components of the nuclear lamina and are cleaved by caspase-6, downstream of caspase-3 (Ruchaud et al., 1997). A previous report suggested that the expression of uncleavable mutant lamin A or B caused significant delays in the onset of chromatin condensation and nuclear shrinkage during apoptosis. In addition, apoptotic DNA fragmentation was delayed in these cells (Rao et al., 1996). Therefore, the nuclear activation of caspase-3 may induce the early nuclear morphological changes during apoptosis.
We showed another application of SCAT by creating SCAT9, which contained LEHD in its linker sequence. The specificity of this indicator for caspase-9 was examined by an in vitro cleavage assay and immunodepletion assay using dATP/cytochrome _c_–activated apoptotic HeLa cell lysates. The in vitro cleavage assay revealed that SCAT9 was cleaved not only by caspase-9, but also by caspase-8. If caspase-8 is strongly activated in cells, SCAT9 should detect the activation of caspase-8 as well. In apoptotic HeLa cell lysates, SCAT9 cleavage was significantly suppressed by the depletion of caspase-9, indicating that SCAT9 is mainly cleaved by caspase-9 in these samples. Because we could detect partial cleavage of SCAT9 in the caspase-9–depleted apoptotic lysates, the possible involvement of other caspases cannot be excluded. Another possibility is that residual caspase-9 in the lysates is involved in the cleavage of SCAT9 after caspase-9 immunodepletion. Because caspase-9 is incorporated into the apoptosome, which is a large protein complex, it might prevent the access of the caspase-9 antibody to completely deplete the caspase-9 from the apoptotic lysates.
The caspase-9 activation profile was significantly different from that of caspase-3. The changes in the emission ratio of SCAT9 occurred very slowly compared with the changes in that of SCAT3. Caspase-3 activation was completed before the initiation of apoptotic morphological changes, but caspase-9 activation continued to progress after the morphological changes. These different rates of caspase-3 and caspase-9 activation may be caused by differences in their potential protease activity. When we measured the enzymatic activity of caspase-9 (LEHDase activity) and caspase-3 (DEVDase) in TNF-α/CHX-stimulated HeLa cells, the DEVDase activity was six times higher than that of LEHDase. Caspase-9 would thus take longer to complete the cleavage of SCAT9 than caspase-3 takes to cleave SCAT3 if there are similar levels of the SCAT substrates in cells. In spite of the differences in activation profiles between caspase-3 and -9, the timing of the initiation of these caspases was almost the same (Fig. 7 D). Thus, we provide the first and direct evidence that activation of the initiator caspase and the executioner caspase is temporally coupled to initiate apoptotic changes.
Materials and methods
Gene construction
To construct SCAT3 and SCAT3 (DEVG), Venus was amplified using the following primers: forward, 5'-TTTGGGGTACCAGCGGAAGCGAATTCGTGAGCAAGGGCGAGGAG-3'; reverse, 5'-TTTCGCTCGAGAAGCTTGCG-GCCGCTTACTTGTACAGCTCGTCCAT-3'. The resulting PCR product was digested with KpnI-HindIII, gel-purified, and ligated into the KpnI-HindIII site of the pCFP-_DEVD_-YFP vector or pCFP-_DEVG_-YFP, provided by Dr. Jeremy M. Tavare (University of Bristol, Bristol, UK; Tyas et al., 2000) to generate pcDNA-SCAT3 and pcDNA-SCAT3 (DEVG), respectively. NLS-SCAT3 was generated by adding the nuclear localization signal PKKKRKVEDA to the COOH terminus of SCAT3. To construct SCAT9, ECFP was amplified using the following primers: forward, 5'-TCGACGGATCCGACGAGATGGAGCAGAAGCTGATCTCGGAGGAGGACCTGAAGGTGAGCAAGGGCGAGG-3'; reverse, 5'-TTTGCGGTACCGTCGTGCTCGAGTCCGCTGAGCTCGGACGAGGACTTGTACAGCTCGTCCAT-3'. The PCR products were then digested with BamHI-KpnI, gel-purified, and ligated into the BamHI-KpnI site of pcDNA-SCAT3 to generate pcDNA-SCAT9.
Cell culture and transfection
HeLa cells were maintained in DME (Sigma-Aldrich) supplemented with 100 U/ml penicillin, 100 μg/ml streptomycin, and 10% FBS. Transfections of HeLa cells were performed using the SuperFect reagent (QIAGEN).
Spectral analysis
SCAT3-expressing HeLa cells were exposed to 10 μg/ml CHX or 50 ng/ml TNF-α/10 μg/ml CHX for 6 h, then washed three times in PBS at 37°C. The cells were resuspended in PBS and used for fluorescence spectra determinations with an excitation wavelength of 435 nm at 37°C using a fluorescence spectrophotometer (model F2500; Hitachi).
pH and Cl− titration analysis
For pH titration, a series of buffers was prepared with pHs ranging from 6 to 9 in either 50 mM 2-(N-morpholino) ethanesulfonate, Hepes, or Tris, in the presence of 0.5% Triton X-100, 100 mM KCl, and protease inhibitors (5 μg/ml pepstatin, 10 μg/ml leupeptin, 2 μg/ml aprotinin, 0.1 mM PMSF). For Cl− titration, a series of buffers was prepared with Cl− concentrations ranging from 0 to 450 mM in 0.5% Triton X-100 containing 50 mM Hepes-KOH, pH 7.4, 5 μg/ml pepstatin, 10 μg/ml leupeptin, 2 μg/ml aprotinin, and 0.1 mM PMSF. The ionic strength of these solutions was adjusted to 450 mM with potassium d-gluconate.
HeLa cells (2 × 10⁵ cells) were plated on 6-well plates and harvested at 18 h. The cells were transfected with 1 μg pSCAT3 or pCFP-_DEVD_-YFP (CY3). 24 h after transfection, SCAT3- or CY3-expressing HeLa cells were washed with PBS (37°C) and incubated in the indicated solutions at 37°C for 10 min. The supernatant, obtained by centrifugation at 10,000 g for 10 min at 37°C, was subjected to measurement of the 530/475-nm emission ratio with an excitation wavelength of 435 nm at 37°C.
Western blotting
Cell lysates were prepared by washing cells in PBS, then resuspending the cell pellet in sample buffer (62.5 mM Tris-HCl, pH 6.8, 6 M urea, 10% glycerol, 2% SDS, 0.003% bromophenol blue, and 5% mercaptoethanol). The sample was immediately incubated for 10 min at 95°C, and the cell debris was pelleted before loading the sample onto an SDS-polyacrylamide gel (12%). After electrophoresis, the proteins were transferred onto an Immobilon™ membrane (Millipore) in transfer buffer (25 mM Tris, 192 mM glycine, and 20% methanol). An anti-myc mouse mAb (Invitrogen) and HRP-conjugated anti–mouse IgG (Promega) were used to detect full-length and cleaved SCAT.
Imaging analysis
Cells were plated on polyethyleneimine-coated glass coverslips and transfected with 0.5 μg plasmid vector for 6 h, then maintained in growth medium for another 12 h. During imaging, the cells were maintained in HBSS (GIBCO BRL) containing 10 mM Hepes, pH 7.4, and placed in a heated chamber. Imaging analysis was carried out using illumination pillars (ILL100LH; Olympus) with an interlined charge-coupled device camera (CoolSNAP HQ™; Roper Scientific) controlled by MetaFluor 4.6.5 Software (Universal Imaging Corp.). A 440AF21 excitation filter, a 455DRLP dichroic mirror, and two emission filters (480AF30 for ECFP and 535AF25 for Venus or EYFP) were used for SCAT or CY3 imaging. The two emission filters alternated with a filter changer (Lambda 10-2; Sutter Instrument Co.).
In vitro cleavage of SCAT3 and SCAT9
The in vitro cleavage assay was performed as described previously (Nakanishi et al., 2001). The SCAT3 or SCAT9 protein was prepared by in vitro translation and transcription using a TNT-coupled reticulocyte lysate system (Promega). 2 μl SCAT3 or SCAT9 protein was incubated at 37°C with 1 U purified, active caspase-3, -6, -8, or -9 (MBL International Corporation) for 1 h. The reaction mixture contained 20 mM Hepes-KOH (pH 7.5), 10 mM KCl, 1.5 mM MgCl2, 1 mM EDTA, 1 mM EGTA, 1 mM dithiothreitol, 19 μg/ml aprotinin, and 0.1 mM PMSF. Western blot analysis with the anti-Myc antibody was used to detect the proteins, as described above.
Preparation of apoptotic extracts for SCAT3 and SCAT9 cleavage assay
For SCAT3 cleavage assay, HeLa cells were treated with 50 ng/ml TNF-α and 10 μg/ml CHX and then cultured for 6 h. After washes by PBS two times, cells were suspended by digitonin buffer (10 μM digitonin, 50 μM Tris-HCl, pH 7.5, 1 mM EDTA, and 10 mM EGTA). Samples were incubated at 37°C for 10 min and then centrifuged at 15,000 rpm. The supernatant was collected and MgCl2 was added at final concentration of 2 mM.
For SCAT9 cleavage assay, HeLa cells were harvested by centrifugation at 1,000 rpm for 5 min. After washes in PBS and Buffer A (20 mM Hepes-KOH, pH 7.5, 10 mM KCl, 1.5 mM MgCl2, 1 mM EDTA, 1 mM EGTA, 1 mM DTT, 0.1 mM PMSF, 5 μg/ml pepstatin A, 10 μg/ml leupeptin, and 2 μg/ml aprotinin), the cells were suspended in two vol of buffer A and incubated 20 min on ice. The cells were then homogenized by 15 strokes with a Dounce homogenizer using a B-type pestle. The lysates were clarified by centrifugation at 10,000 g for 1 h. The supernatant was collected, and NaCl was added to a final concentration of 50 mM. The in vitro apoptotic reaction was carried out by the addition of 10 μM cytochrome c and 1 mM dATP for 2 h at 37°C in 3 μg/μl lysate before immunodepletion experiment.
Immunodepletion of caspase-3 or caspase-9 from apoptotic extracts
Aliquots of protein G Sepharose (40 μl) were precoated with 5 μg anti-caspase-9 rabbit pAb, provided by Drs. Yutaka Eguchi and Yoshihide Tsujimoto (Osaka University, Osaka, Japan; Eguchi et al., 1999), 5 μg anti-caspase-3 mouse mAb (Transduction Laboratories), or 5 μg anti-GFP rabbit pAb (MBL International Corporation) in a total volume of 300 μl in Buffer A, and were rocked for 3 h at 4°C. Antibody-coated beads were washed three times with Buffer A, then mixed with apoptotic HeLa cell lysates (150 μg of cytochrome c/dATP apoptotic lysate for SCAT9 and 100 μg of TNF-α/CHX-treated apoptotic lysate for SCAT3 as described above) and rocked for 3 h at 4°C. The beads were removed from the lysates before SCAT3 or SCAT9 cleavage assay.
Online supplemental materials
Videos 1 and 2 show real-time imaging analyses of apoptotic HeLa cells using the SCAT3 and SCAT9 indicators, respectively. HeLa cells were treated with 50 ng/ml TNF-α and 10 μg/ml CHX. Changes in the emission ratio are represented as red (high ratio) to blue (low ratio). Online supplemental material available at http://www.jcb.org/cgi/content/full/jcb.200207111/DC1.
Acknowledgments
We thank Jeremy M. Tavare for the pCFP-_DEVD_-YFP and pCFP-_DEVG_-YFP vectors, Nobuhiro Morishima for helping with the in vitro cleavage assay, Yoshihide Tsujimoto and Yutaka Eguchi for the anti–caspase-9 rabbit pAb, and Yasuo Uchiyama for encouragement.
This work was supported in part by grants from the Japanese Ministry of Education, Science, Sports, Culture, and Technology to M. Miura. This work was also supported in part by grants from the RIKEN Bioarchitect Research Project. K. Takemoto is a research fellow of the Junior Research Associate Program, RIKEN.
The online version of this article includes supplemental material.
Footnotes
*
Abbreviations used in this paper: Cl−, chloride ion; [Cl−]i, intracellular Cl− concentration; CHX, cycloheximide; ECFP, enhanced cyan fluorescence protein; EYFP, enhanced yellow fluorescent protein; FRET, fluorescence resonance energy transfer; H+, proton; NLS, nuclear localization signal; STS, staurosporine; TNF-α, tumor necrosis factor α.
References
- Araki, T., M. Hayashi, N. Watanabe, H. Kanuka, J. Yoshino, M. Miura, and T. Saruta. 2002. Down-regulation of Mcl-1 by inhibition of the PI3-K/Akt pathway is required for cell shrinkage-dependent cell death. Biochem. Biophys. Res. Commun. 290:1275–1281. [DOI] [PubMed] [Google Scholar]
- Cecconi, F., G. Alvarez-Bolado, B.I. Meyer, K.A. Roth, and P. Gruss. 1998. Apaf1 (CED-4 homolog) regulates programmed cell death in mammalian development. Cell. 94:727–737. [DOI] [PubMed] [Google Scholar]
- Chandler, J.M., G.M. Cohen, and M. MacFarlane. 1998. Different subcellular distribution of caspase-3 and caspase-7 following Fas-induced apoptosis in mouse liver. J. Biol. Chem. 273:10815–10818. [DOI] [PubMed] [Google Scholar]
- Cryns, V., and J. Yuan. 1998. Proteases to die for. Genes Dev. 12:1551–1570. [DOI] [PubMed] [Google Scholar]
- Eguchi, Y., A. Srinivasan, K.J. Tomaselli, S. Shimizu, and Y. Tsujimoto. 1999. ATP-dependent steps in apoptotic signal transduction. Cancer Res. 59:2174–2181. [PubMed] [Google Scholar]
- Faleiro, L., and Y. Lazebnik. 2000. Caspases disrupt the nuclear-cytoplasmic barrier. J. Cell Biol. 151:951–959. [DOI] [PMC free article] [PubMed] [Google Scholar]
- Hakem, R., A. Hakem, G.S. Duncan, J.T. Henderson, M. Woo, M.S. Soengas, A. Elia, J.L. de la Pompa, D. Kagi, W. Khoo, J. Potter, R. Yoshida, S.A. Kaufman, S.W. Lowe, J.M. Penninger, and T.W. Mak. 1998. Differential requirement for caspase 9 in apoptotic pathways in vivo. Cell. 94:339–352. [DOI] [PubMed] [Google Scholar]
- Jayaraman, S., P. Haggie, R.M. Wachter, S.J. Remington, and A.S. Verkman. 2000. Mechanism and cellular applications of a green fluorescent protein-based halide sensor. J. Biol. Chem. 275:6047–6050. [DOI] [PubMed] [Google Scholar]
- Kuida, K., T.S. Zheng, S. Na, C. Kuan, D. Yang, H. Karasuyama, P. Rakic, and R.A. Flavell. 1996. Decreased apoptosis in the brain and premature lethality in CPP32-deficient mice. Nature. 384:368–372. [DOI] [PubMed] [Google Scholar]
- Kuida, K., T.F. Haydar, C.Y. Kuan, Y. Gu, C. Taya, H. Karasuyama, M.S. Su, P. Rakic, and R.A. Flavell. 1998. Reduced apoptosis and cytochrome c-mediated caspase activation in mice lacking caspase 9. Cell. 94:325–337. [DOI] [PubMed] [Google Scholar]
- Kumar, S., and J. Doumanis. 2000. The fly caspases. Cell Death Differ. 7:1039–1044. [DOI] [PubMed] [Google Scholar]
- Kuner, T., and G.J. Augustine. 2000. A genetically encoded ratiometric indicator for chloride: capturing chloride transients in cultured hippocampal neurons. Neuron. 27:447–459. [DOI] [PubMed] [Google Scholar]
- Lechardeur, D., L. Drzymala, M. Sharma, D. Zylka, R. Kinach, J. Pacia, C. Hicks, N. Usmani, J.M. Rommens, and G.L. Lukacs. 2000. Determinants of the nuclear localization of the heterodimeric DNA fragmentation factor (ICAD/CAD). J. Cell Biol. 150:321–334. [DOI] [PMC free article] [PubMed] [Google Scholar]
- Llopis, J., J.M. McCaffery, A. Miyawaki, M.G. Farquhar, and R.Y. Tsien. 1998. Measurement of cytosolic, mitochondrial, and Golgi pH in single living cells with green fluorescent proteins. Proc. Natl. Acad. Sci. USA. 95:6803–6808. [DOI] [PMC free article] [PubMed] [Google Scholar]
- Luo, K.Q., V.C. Yu, Y. Pu, and D.C. Chang. 2001. Application of the fluorescence resonance energy transfer method for studying the dynamics of caspase-3 activation during UV-induced apoptosis in living HeLa cells. Biochem. Biophys. Res. Commun. 283:1054–1060. [DOI] [PubMed] [Google Scholar]
- Maeno, E., Y. Ishizaki, T. Kanaseki, A. Hazama, and Y. Okada. 2000. Normotonic cell shrinkage because of disordered volume regulation is an early prerequisite to apoptosis. Proc. Natl. Acad. Sci. USA. 97:9487–9492. [DOI] [PMC free article] [PubMed] [Google Scholar]
- Mancini, M., D.W. Nicholson, S. Roy, N.A. Thornberry, E.P. Peterson, R.L. Casciola, and A. Rosen. 1998. The caspase-3 precursor has a cytosolic and mitochondrial distribution: implications for apoptotic signaling. J. Cell Biol. 140:1485–1495. [DOI] [PMC free article] [PubMed] [Google Scholar]
- Matsuyama, S., J. Llopis, Q.L. Deveraux, R.Y. Tsien, and J.C. Reed. 2000. Changes in intramitochondrial and cytosolic pH: early events that modulate caspase activation during apoptosis. Nat. Cell Biol. 2:318–325. [DOI] [PubMed] [Google Scholar]
- Metzger, F., C.V. Repunte, S. Matsushita, W. Akemann, G.J. Diez, C.S. Ho, T. Iwasato, P. Grandes, S. Itohara, R.H. Joho, and T. Knopfel. 2002. Transgenic mice expressing a pH and Cl− sensing yellow-fluorescent protein under the control of a potassium channel promoter. Eur. J. Neurosci. 15:40–50. [DOI] [PubMed] [Google Scholar]
- Meyer, E.L., L.C. Gahring, and S.W. Rogers. 2002. Nicotine preconditioning antagonizes activity-dependent caspase proteolysis of a glutamate receptor. J. Biol. Chem. 277:10869–10875. [DOI] [PubMed] [Google Scholar]
- Nagai, T., K. Ibata, E.S. Park, M. Kubota, K. Mikoshiba, and A. Miyawaki. 2002. A variant of yellow fluorescent protein with fast and efficient maturation for cell-biological applications. Nat. Biotechnol. 20:87–90. [DOI] [PubMed] [Google Scholar]
- Nakanishi, K., M. Maruyama, T. Shibata, and N. Morishima. 2001. Identification of a caspase-9 substrate and detection of its cleavage in programmed cell death during mouse development. J. Biol. Chem. 276:41237–41244. [DOI] [PubMed] [Google Scholar]
- Perez, S.D., E.D. Collado, and F. Mollinedo. 1995. Intracellular alkalinization suppresses lovastatin-induced apoptosis in HL-60 cells through the inactivation of a pH-dependent endonuclease. J. Biol. Chem. 270:6235–6242. [DOI] [PubMed] [Google Scholar]
- Rao, L., D. Perez, and E. White. 1996. Lamin proteolysis facilitates nuclear events during apoptosis. J. Cell Biol. 135:1441–1455. [DOI] [PMC free article] [PubMed] [Google Scholar]
- Rehm, M., H. Dussmann, R.U. Janicke, J.M. Tavare, D. Kogel, and J.H. Prehn. 2002. Single-cell fluorescence resonance energy transfer analysis demonstrates that caspase activation during apoptosis is a rapid process. Role of caspase-3. J. Biol. Chem. 277:24506–24514. [DOI] [PubMed] [Google Scholar]
- Ruchaud, S., N. Korfali, P. Villa, T.J. Kottke, C. Dingwall, S.H. Kaufmann, and W.C. Earnshaw. 1997. Caspase-6 gene disruption reveals a requirement for lamin A cleavage in apoptotic chromatin condensation. EMBO J. 21:1967–1977. [DOI] [PMC free article] [PubMed] [Google Scholar]
- Shi, Y. 2002. Mechanisms of caspase activation and inhibition during apoptosis. Mol. Cell. 9:459–470. [DOI] [PubMed] [Google Scholar]
- Thornberry, N.A., T.A. Rano, E.P. Peterson, D.M. Rasper, T. Timkey, C.M. Garcia, V.M. Houtzager, P.A. Nordstrom, S. Roy, J.P. Vaillancourt, et al. 1997. A combinatorial approach defines specificities of members of the caspase family and granzyme B. Functional relationships established for key mediators of apoptosis. J. Biol. Chem. 272:17907–17911. [DOI] [PubMed] [Google Scholar]
- Tyas, L., V.A. Brophy, A. Pope, A.J. Rivett, and J.M. Tavare. 2000. Rapid caspase-3 activation during apoptosis revealed using fluorescence-resonance energy transfer. EMBO Rep. 1:266–270. [DOI] [PMC free article] [PubMed] [Google Scholar]
- Vincent, A.M., M. TenBroeke, and K. Maiese. 1999. Neuronal intracellular pH directly mediates nitric oxide-induced programmed cell death. J. Neurobiol. 40:171–184. [DOI] [PubMed] [Google Scholar]
- Weil, M., M.D. Jacobson, and M.C. Raff. 1997. Is programmed cell death required for neural tube closure? Curr. Biol. 7:281–284. [DOI] [PubMed] [Google Scholar]
- Yoshida, H., Y.Y. Kong, R. Yoshida, A.J. Elia, A. Hakem, R. Hakem, J.M. Penninger, and T.W. Mak. 1998. Apaf1 is required for mitochondrial pathways of apoptosis and brain development. Cell. 94:739–750. [DOI] [PubMed] [Google Scholar]
- Zhivotovsky, B., A. Samali, A. Gahm, and S. Orrenius. 1999. Caspases: their intracellular localization and translocation during apoptosis. Cell Death Differ. 6:644–651. [DOI] [PubMed] [Google Scholar]
- Zou, H., and L. Niswander. 1996. Requirement for BMP signaling in interdigital apoptosis and scale formation. Science. 272:738–741. [DOI] [PubMed] [Google Scholar]
