Deficiency in the Transcription Factor Interferon Regulatory Factor (Irf)-2 Leads to Severely Compromised Development of Natural Killer and T Helper Type 1 Cells (original) (raw)
Abstract
Interferon (IFN) regulatory factor (IRF)-2 was originally described as an antagonist of IRF-1–mediated transcriptional regulation of IFN-inducible genes. IRF-1−/− mice exhibit defective T helper type 1 (Th1) cell differentiation. We have used experimental leishmaniasis to show that, like IRF-1−/− mice, IRF-2−/− mice are susceptible to Leishmania major infection due to a defect in Th1 differentiation. Natural killer (NK) cell development is compromised in both IRF-1−/− and IRF-2−/− mice, but the underlying mechanism differs. NK (but not NK+ T) cell numbers are decreased in IRF-2−/− mice, and the NK cells that are present are immature in phenotype. Therefore, like IRF-1, IRF-2 is required for normal generation of Th1 responses and for NK cell development in vivo. In this particular circumstance the absence of IRF-2 cannot be compensated for by the presence of IRF-1 alone. Mechanistically, IRF-2 may act as a functional agonist rather than antagonist of IRF-1 for some, but not all, IFN-stimulated regulatory element (ISRE)-responsive genes.
Keywords: interferon regulatory factor, Th1, natural killer cells, Leishmania, interleukin 15
Introduction
The IFN regulatory factor (IRF) family includes IRF-1 through IRF-7, IFN-stimulated gene factor 3γ (ISGF3γ), and IFN consensus sequence-binding protein (ICSBP) 1. Members of the IRF family were originally identified by their ability to bind DNA sequences common to the promoters of the IFN-α and -β genes 2. IRF family members also bind to IFN-stimulated regulatory elements (ISREs) found in promoters of IFN-inducible genes, such as inducible nitric oxide synthase (iNOS) 3. Studies of wild-type embryonic cells and fibroblasts 2 4 have suggested that IRF-1 and IRF-2 compete for binding at the same DNA locus and can act as mutual antagonists. Although IRF-1 induces expression of IFN-α/β, IRF-2 represses it 4 5. Similarly, although IRF-1 has antioncogenic activity, IRF-2 induces tumorigenicity in embryonic 3T3 cells 6. Mutual antagonism is also suggested by the phenotypes of mice with a targeted disruption of either the IRF-1 or the IRF-2 gene 7 8. Type I IFN induction in response to poly(I):poly(C) is reduced in IRF-1−/− fibroblasts, but upregulated in IRF-2−/− fibroblasts after infection with Newcastle disease virus 7 8. However, in contrast to its repressive effects on IFN-related genes, IRF-2 activates the transcription of histone genes and the vascular cell adhesion molecule (VCAM)-1 gene 9 10. Furthermore, cooperation between IRF-2 and ICSBP is needed to repress the transcriptional activity of some promoters, such as those for MHC class I and 2′-5′oligoadenylate synthetase 11 12 13 14. Interestingly, nuclear extracts of spleen cells from ICSBP−/− mice contain no detectable IRF-2 activity 15, implying a role for ICSBP in the posttranscriptional/translational modification of IRF-2.
ISRE consensus binding sites occur in the promoters of the IL-4 and IL-12 genes 16 17, genes that are critical for the differentiation of naive T cells into Th2 or Th1 cells, respectively 18 19 20. IRF-1−/− mice display a defect in Th1 differentiation, primarily due to reduced IL-12 production 21 22. Deficiency for ICSBP, which can bind to IRF-1, leads to a similar decrease in IL-12 synthesis and impaired Th1 cell differentiation 23 24. It has recently been reported that IL-12 production is also dysregulated in IRF-2–deficient macrophages 25. We thus decided to test the effects on Th differentiation of a null mutation in IRF-2, the putative repressor of IRF-1 and an alternative partner of ICSBP.
Murine cutaneous leishmaniasis, induced by subcutaneous inoculation of the protozoan parasite Leishmania major, is a useful experimental model in which to study Th differentiation. L. major infection is self-healing in resistant mice (e.g., C57BL/6) because of the expansion of macrophage-activating Th1 cells, but is lethal in susceptible mice (e.g., BALB/c) due to the expansion of macrophage-deactivating Th2 cells 26. We have used this model to demonstrate that IRF-2 is required not only for IL-12 production but also for the development of Th1 cells and NK cells, a dominant IFN-γ–secreting and IL-12–inducing cell population.
Materials and Methods
Mice.
Mice were housed in specific pathogen-free facilities according to the ethical and institutional guidelines of the Ontario Cancer Institute and the Institut für Klinische Mikrobiologie und Immunologie, Universität Erlangen. IRF-2−/−, IRF-2+/−, and IRF-2+/+ littermates 7, backcrossed for seven generations to C57BL/6 mice, were used in all experiments. Control BALB/c, C57BL/6, and 129/SvJ mice were purchased from The Jackson Laboratory.
Infection of Mice with L. major and Monitoring of the Disease.
Mice (three to four per group) were infected in the right hind footpad with 2 × 10⁷ stationary phase promastigotes of L. major strain MHOM/IL/81/FEBNI 27 and the increase in footpad thickness (expressed as a percentage) was calculated, as described 22. BALB/c mice had to be killed by week 5 due to severe ulcerations. Parasite burden was determined by limiting dilution analysis as described previously 28. The number of parasites per organ or per cell number plated was determined for each mouse.
Determination of Cytokines by ELISA.
At 4 and 7 wk after infection of mice with L. major, right popliteal LNs were removed and single cell suspensions were made. Cells were restimulated in vitro with or without L. major antigens, as described 22. After 48 h, culture supernatants (SNs) were harvested and IL-4 and IFN-γ levels were determined using ELISA kits (BD PharMingen).
Cell Transfer Experiments.
Purification of C57BL/6 wild-type and recombination activating gene (RAG)-1−/− B cells was performed as described previously 22 using the MACS system (Miltenyi Biotec). The resulting cell population contained >90% B220+ cells and <0.5% CD4+ and CD8+ T cells.
To obtain purified CD4+ cells, spleens and LNs from groups of three IRF-2−/− or IRF-2+/− mice were pooled and CD4+ T cells were isolated using MACS 22. The resulting population consisted of >90% (in the case of IRF-2−/−) and >98% (for IRF-2+/−) CD4+ cells. Contamination with CD8+ cells was <0.2%. RAG-1−/− mice (three per group) were reconstituted intraperitoneally with 11 × 106 B cells with or without 6 × 10⁶ IRF-2−/− or IRF-2+/− CD4+ T cells. On the same day, the reconstituted mice were infected with L. major. 6 wk after cell transfer, mice were killed and cytokine production as well as splenic parasite burdens were determined.
In Vitro Differentiation of CD4+ T Cells.
Pooled single cell suspensions were prepared from spleens, peripheral LNs, or visceral LNs of IRF-2−/− or IRF-2+/− mice. CD4+CD62L+ T cells were isolated using anti-CD4–FITC (Dianova), the anti-FITC multisort kit (Miltenyi Biotec), and anti-CD62L antibodies conjugated to magnetic beads (Miltenyi Biotec). The purified cell preparation contained 91–99% CD4+CD62L+ T cells, referred to as “naive T cells.” For one experiment, CD4+CD62L+ T cells were further purified (>99%) by FACS® sorting on an EPICS ELITE machine (Coulter). Purified T cells were plated at 106 in 1 ml Click's medium in 24-well plates previously coated with 5 μg/ml anti-CD3 mAb 29. Th1 differentiation was induced by the addition of IL-12p70 (1 ng/ml; BD PharMingen) plus anti–IL-4 (10% SNs of hybridoma 11B11 30), whereas Th2 differentiation was induced with IL-4 (10% SNs of X63Ag8-653-mIL-4 cells 31) plus neutralizing anti–IL-12 antiserum (10 μg/ml; provided by Dr. M. Gately, Knoll Pharmaceutical Co., North Mount Olive, NJ). After 96 h, half of the SN was replaced with fresh medium containing IL-2 (10% SN of X63Ag8-653-mIL-2 cells [31]) and the cells were transferred to wells without anti-CD3. After an additional 48 h, the cells were harvested, washed, and plated (105/well) in 200 μl medium in 96-well plates, with or without anti-CD3. After 24 h, SNs were tested for IL-4 or IFN-γ production as described above.
Quantitative Real Time Reverse Transcription PCR by TaqMan Analysis.
IRF-2+/− and IRF-2−/− mice were infected with L. major as described above. 10 d later, popliteal LN cells (LNCs) were prepared and total RNA was purified using the RNeasy kit (QIAGEN). Primers (from MWG Biotech Eberserg) and probes (Eurogentec) were as follows. β-actin: 5′, TCACCCACACTGTCCCCATCTATGA; 3′, GATGCCACAGGATTCCATACCCA; TaqMan probe, ACGCGCTCCCTCATGCCATCCTGCGT. IL-12p35: 5′, CCACCCTTGCCCTCCTAAAC; 3′, GGCAGCTCCCTCTTGTTGTG; TaqMan probe, ACCTCAGTTTGGCCAGGGTCATTCCA. IL-12p40: 5′, TTCAGTGTCCTGCCAGGAGG; 3′, CGGGTCTGGTTTGATGATGTC; TaqMan probe, TGTCACCTGCCCACTGCCGAG. The one tube reverse transcription (RT)-PCR reaction (25 μl volume) consisted of 200 nM each primer, 100 nM probe, 300 μM dNTPs, 3.5 mM MnCl2, 2 μl RNA, 2.5 U Tth polymerase (all from PerkinElmer), and 1× PCR buffer (50 mM bicine, 125 mM potassium acetate, 10 μM EDTA, 8% glycerol, pH 8.2). In the presence of magnesium, Tth polymerase acts as reverse transcriptase as well as DNA polymerase. Amplification and detection were done on an ABI 7700 system with the following profile: 2 min at 50°C, 30 min at 60°C, 5 min at 95°C, and 45 cycles of 95°C for 15 s and 60°C for 1 min. mRNA levels (mean ± SD of duplicate samples for all mice per group) were calculated using the comparative Ct method and normalization to β-actin 32. All PCR products were confirmed by size and restriction enzyme digestion on agarose gels.
Determination of IL-12p70 in Macrophage SNs.
Peritoneal exudate macrophages (PEC Mφ) were obtained by peritoneal lavage 5 d after intraperitoneal injection of 1.5 ml 4% thioglycollate (Difco). 2 × 10⁵ PEC Mφ/well in 100 μl RPMI containing 10% heat-inactivated FCS were seeded in flat-bottomed 96-well microtiter plates and incubated with LPS (Sigma-Aldrich) and/or murine recombinant IFN-γ (R&D Systems) for 18 h. Culture SNs were assayed for nitrite (NO2−), the stable end product of NO production, and for IL-12p70 protein. Nitrite was determined colorimetrically by the Griess method 33, and IL-12p70 by ELISA using commercially available antibody pairs (Opti EIA; BD PharMingen) according to the manufacturer's instructions.
In Vitro NK Assays.
In vitro evaluations of NK-specific cytolytic activity were performed using the NK-sensitive target cell line YAC-1, as described previously 34.
Flow Cytometric Analyses of NK and NK+ T Populations in Lymphoid Compartments.
Peripheral blood was obtained from tail veins of mice. Single cell suspensions of splenocytes were prepared by passing spleens through a 70-μm plastic mesh followed by density gradient purification of viable mononuclear cells (Lympholyte M; Cedarlane Labs). Liver mononuclear cells were prepared as described previously 35. Bone marrow (BM) cells were flushed from femurs and tibias, and erythrocytes were lysed with ammonium chloride solution. Nonspecific staining was blocked with anti-CD16/CD32 mAb (Fc block, 2.4G2). Cells were subsequently stained with the mAbs anti-NK1.1–PE (PK136), anti–pan-NK–FITC (DX5), anti-TCR-β–allophycocyanin (APC) (H57-597), anti–IL-2Rβ–FITC (TM-β1), anti-Ly9.1-biotin (30C7), anti-B220–FITC (RA3-6B2), anti-CD117–APC (c-kit, 2B8), and anti-CD19–biotin (1D3) (all from BD PharMingen), and for detection of biotinylated antibody, streptavidin-RED670 (GIBCO BRL). Cells were analyzed by flow cytometry on a FACSCalibur™ using CELLQuest™ software (Becton Dickinson). Viable lymphocyte populations were gated on the basis of forward and side scatter, and 10,000 gated cells/sample were analyzed.
BM Transplantation and Reconstitution of NK Cells.
107 BM cells were transferred intravenously into lethally irradiated mice (9.0 Gy), and mononuclear cells isolated from the spleen and liver were analyzed 10–12 wk later. Irradiated mice were maintained on acidified water and irradiated chow, with antibiotics in their drinking water for the first 2 wk.
Determination of IL-15 mRNA Expression.
Unfractionated BM from IRF-2+/− or IRF-2−/− mice of 8–10 wk of age was cultured for 6 h in medium alone, or medium containing LPS (30 μg/ml) plus IFN-γ (100 U/ml). Cells were harvested and total RNA was prepared by the RNeasy method (QIAGEN). For determination of IL-15 mRNA, 10 μg total RNA was analyzed using the RiboQuant® multiprobe RNase Protection assay (RPA) system (BD PharMingen) according to the manufacturer's instructions.
In Vitro Culture of BM NK Cells.
Unfractionated BM cells (1.5 × 10⁶) were cultured for 7 d in 24-well plates in RPMI containing 10% FCS plus 50 ng/ml recombinant human IL-15 (R&D Systems). Cells were harvested, counted, and from the frequency of NK1.1+TCR-α/β− cells determined by flow cytometry the number of NK cells was calculated.
In Vitro Culture of CD8+ T Cells.
LN CD8+ T cells were enriched to ∼80–90% purity by negative selection using anti–pan B cell and anti-CD4 T cell magnetic beads (Dynabeads; Dynal). 0.5 × 10⁶ enriched CD8+ cells were cultured in 0–100 ng/ml of human IL-15 (R&D Systems) for 48 h, with bromodeoxyuridine (BrdU) being added for the final 12 h of culture. Cells were harvested, surface stained with anti-CD8–APC (H57-597) and anti-CD44–PE (IM7), and processed for cell cycle analysis using the BrdU Flow Kit (BD PharMingen) according to the manufacturer's instructions. The percentage of CD44hiCD8+ cells in S phase was quantified by flow cytometry (FACSCalibur™ using CELLQuest™ software).
Results
Enhanced Susceptibility of IRF-2−/− Mice to L. major Infection.
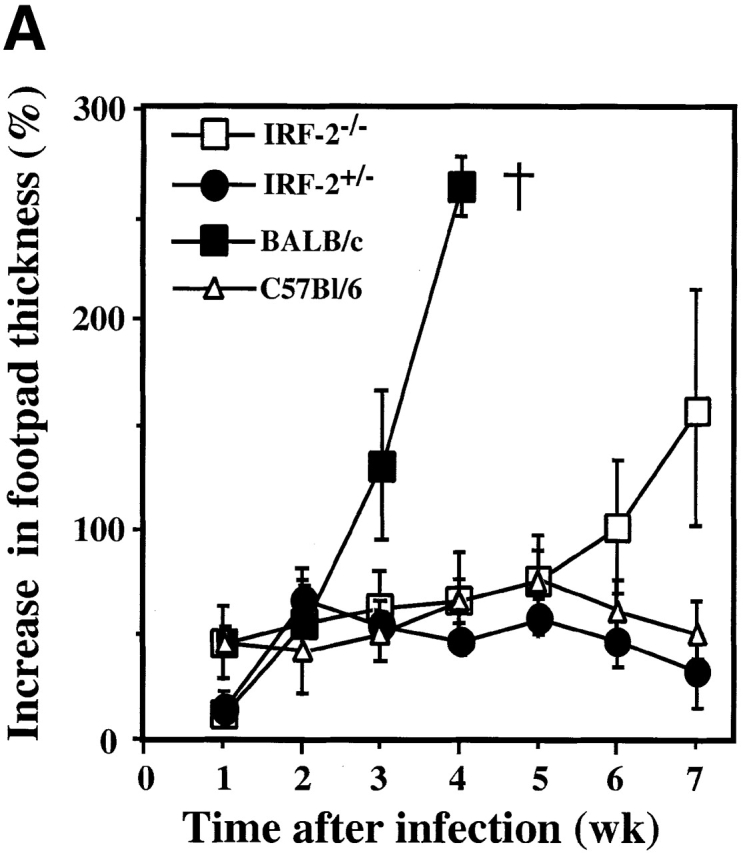
To determine the role of IRF-2 in protection against infection with L. major, the course of leishmaniasis was examined in wild-type C57BL/6 mice and in IRF-2+/− and IRF-2−/− mice of the resistant C57BL/6 background. Wild-type C57BL/6 mice developed a temporary swelling of the footpad which healed by week 7, as did IRF-2+/− mice (Fig. 1 A). In contrast, IRF-2−/− mice developed a progressive increase in footpad thickness and ulcerations similar to, but not as prominent as, those in susceptible BALB/c mice (Fig. 1 A) or IRF-1−/− mice 22.
Figure 1.
Leishmaniasis in IRF-2−/− mice and rescue of RAG-1−/− mice by IRF-2−/− T cells. (A) Time-dependent increase in lesion size after L. major infection in BALB/c, C57BL/6, IRF-2+/−, and IRF-2−/− mice. Mice were infected with L. major as described in Materials and Methods, and the increase in footpad thickness (%) was calculated at the indicated time points. Data are shown as mean ± SD of four mice per group, and are representative of three independent experiments. (B) Protection of RAG-1−/− mice from L. major infection by transfer of IRF-2−/−CD4+ T cells. RAG-1−/− mice received either no cells, or were injected intravenously with B cells from IRF-2+/+ mice without (B), or with (B + IRF-2+/−CD4 or B + IRF-2−/− CD4) CD4+ T cells from IRF-2+/− or IRF-2−/− mice, respectively. The same day, all mice were infected with L. major and lesion sizes were monitored as described for A above. Data shown are the mean ± SD of three mice per group.
To determine whether the increased footpad swelling in IRF-2−/− mice reflected a higher systemic parasite load, parasite numbers in spleens, lesions, and lesion-draining popliteal LNs of L. _major_–infected C57BL/6, IRF-2+/−, and IRF-2−/− mice were analyzed at 4 and 7 wk after infection. C57BL/6 and IRF-2+/− mice with healed local lesions contained comparably small numbers of parasites within footpad lesions and LNs at both time points (Table ). IRF-2+/− spleens contained more parasites than C57BL/6 spleens at 7 wk, indicating a gene dosage effect. In contrast, loss of both IRF-2 alleles led to dramatic increases in parasite burden in the footpad, lesion-draining LNs, and spleens even at 4 wk. 7 wk after infection, IRF-2−/− spleens contained 106 times more parasites than C57BL/6 spleens, a burden equal to that observed in L. _major_–infected IRF-1−/− mice 22.
Table 1.
Clearance of Leishmania Is Defective in IRF-2–deficient Mice
| Organ | No. of weeks after infection | C57BL/6+/+ | IRF-2+/− | IRF-2−/− |
|---|---|---|---|---|
| Footpad | 4 | 5.0 × 10⁵ ± 2.5 × 10⁵ | 2.5 × 10⁵ ± 1.7 × 10⁵ | 2.5 × 10⁷ ± 1.5 × 10⁷ |
| 7 | 7.8 × 10⁵ ± 7.3 × 10⁵ | 1,600 ± 800 | 4.0 × 10⁶ ± 3.5 × 10⁶ | |
| LN | 4 | 1,900 ± 400 | 1,200 ± 500 | 1.6 × 10⁴ ± 1.1 × 10⁴ |
| 7 | 35 ± 13 | 108 ± 64 | 1.1 × 10⁵ ± 0 | |
| Spleen | 4 | 1 ± 1 | 10 ± 8 | 1,500 ± 1,200 |
| 7 | 2 ± 1 | 240 ± 96 | 1.5 × 10⁶ ± 3.0 × 10⁵ |
Impaired Th1 Response in L. major–infected IRF-2−/− Mice.
In BALB/c mice, the fatal course of leishmaniasis is accompanied by the increased expansion of Th2 cells at the expense of Th1 cells 26. To study the role of IRF-2 in Th1 development in vivo, C57BL/6, IRF-2+/−, and IRF-2−/− mice were infected subcutaneously with L. major. 4 wk later, single cell suspensions of lesion-draining popliteal LNs were restimulated in vitro with L. major antigens and the culture SNs were tested 48 h later for IL-4 and IFN-γ production. IRF-2+/− (Table ) and C57BL/6 (not shown) mice exhibited a strong Th1 response to L. major antigens in that high levels of IFN-γ were detected in the SNs. However, the production of IFN-γ by IRF-2−/− LNCs was 30-fold lower than that of IRF-2+/− LNCs, and IL-4 production was substantially increased. Similar results were obtained when cytokine production was assayed 7 wk after infection, and when splenic cells were tested (data not shown). These results indicate a striking shift of the immune response phenotype from Th1 to Th2 in IRF-2−/− mice.
Table 2.
Amounts of IL-4 and IFN-γ (in pg/ml) Secreted In Vitro in Response to L. major Antigens
| IRF-2+/− | IRF-2−/− | |||
|---|---|---|---|---|
| −LmAg | +LmAg | −LmAg | +LmAg | |
| IL-4 | <10 | <10 | <10 | 40 ± 9 |
| IFN-γ | 206 ± 98 | 2,790 ± 1,438 | 75 ± 11 | 88 ± 19 |
Normal Capacity for Th1 Differentiation of IRF-2−/−CD4+ T Cells In Vivo and In Vitro.
A bias towards the Th2 phenotype in IRF-2−/− mice could be caused either by a primary T cell defect or by a lack of microenvironmental signals necessary for Th1 differentiation. To distinguish between these two possibilities, CD4+ T cells from IRF-2+/− and IRF-2−/− mice were purified and transferred into IRF-2+/+RAG-1−/− mice, which are wild-type with respect to IRF-2 but lack T and B cells. To compensate for the lack of B cells, B cells from IRF-2+/+ mice were cotransferred into RAG-1−/− mice. The reconstituted mice were infected with L. major and the course of disease was monitored by measuring footpad lesions. RAG-1−/− mice without cell transfer or with reconstitution of B cells alone showed a progressive increase in lesion size (Fig. 1 B) and high numbers of parasites (Table ). In contrast, mice reconstituted with CD4+ T cells from either IRF-2−/− or IRF-2+/− mice healed their lesions to an equal extent and harbored low numbers of parasites. Thus, IRF-2−/−CD4+ T cells can successfully limit murine leishmaniasis when placed into a wild-type environment. The capacity of the transferred IRF-2−/−CD4+ T cells to secrete cytokines after in vitro restimulation with L. major antigens was also determined (Table ). IRF-2−/−CD4+ T cells produced slightly lower total amounts of both IL-4 and IFN-γ compared with IRF-2+/−CD4+ T cells. However, the Th1-indicative IFN-γ/IL-4 ratio was even increased compared with that of IRF-2+/−CD4+ cells. Thus, in mice bearing functional IRF-2+/+ APCs, the differentiation in vivo of IRF-2−/−CD4+ T cells into Th1 cells was essentially normal. These experiments indicate that the inability of IRF-2−/− mice to develop a Th1 response is not a result of a primary defect in CD4+ T cells.
Table 3.
Cytokine Production after In Vivo Transfer of IRF-2+/− and IRF-2−/− CD4+ T Cells into RAG-1−/− Mice
| Transferred cells | ||||||||
|---|---|---|---|---|---|---|---|---|
| – | IRF-2+/+ B cells | IRF-2+/+ B cells +IRF-2+/− CD4+ | IRF-2+/+ B cells +IRF-2−/− CD4+ | |||||
| Parasite burden | 3.0 × 10⁷ ± 2.7 × 10⁷ | 7.2 × 10⁶ ± 3.6 × 10⁶ | 8.7 × 10⁴ ± 1.3 × 10⁴ | 4.0 × 10⁴ ± 1.3 × 10⁴ | ||||
| In vitro stimulus | ||||||||
| −LmAg | +LmAg | −LmAg | +LmAg | −LmAg | +LmAg | −LmAg | +LmAg | |
| IFN-γ (pg/ml) | <40 | <40 | <40 | <40 | 80 ± 0 | 3,500 ± 70 | <40 | 2,000 ± 0 |
| IL-4 (pg/ml) | <5 | <5 | <5 | <5 | 55 ± 35 | 375 ± 250 | <5 | 50 ± 14 |
The capacity of CD4+ T cells of IRF-2−/− and IRF-2+/− mice to differentiate into Th1 cells was also compared in vitro. Naive CD4+CD62L+ T cells of both genotypes were cultured either under neutral conditions or in a cytokine milieu favoring the differentiation of either Th1 or Th2 cells. After resting and restimulation, culture SNs were tested for the presence of IL-4 or IFN-γ. As shown in Table , both IRF-2−/− and IRF-2+/− CD4+ T cells that were primed so as to promote a Th1 response indeed secreted high amounts of IFN-γ and no IL-4, confirming that Th cells of IRF-2−/− mice have no inherent impediment to Th1 differentiation. In addition, Th2-primed IRF-2−/− and IRF-2+/− CD4+ T cells secreted high amounts of IL-4 and lower amounts of IFN-γ, showing that a lack of IRF-2 does not preclude IRF-2−/−CD4+ T cells from adopting a Th2 phenotype. Interestingly, however, Th2-primed IRF-2+/−CD4+ T cells produced substantially more IFN-γ than IRF-2−/−CD4+ T cells. Such a difference was even more obvious between IRF-2−/− and IRF-2+/− CD4+ T cells primed under neutral conditions (anti-CD3 alone). In the absence of a strong stimulus towards either Th1 or Th2 development, IRF-2+/−CD4+ T cells (like wild-type CD4+ T cells) spontaneously developed into Th1 cells, although they produced less IFN-γ than cells stimulated in the presence of IL-12. In contrast, neutrally primed IRF-2−/−CD4+ T cells failed to develop into either Th1 or Th2 cells, a finding reproduced in four independent experiments using FACS®-sorted cells of purity >99%. The absence of Th1/Th2 cells was not caused by apoptosis of IRF-2−/−CD4+ T cells upon restimulation, because (a) IRF-2−/−CD4+ T cells proliferated to the same extent as IRF-2+/−CD4+ T cells under neutral conditions, and (b) IRF-2−/−CD4+ T cells retained the capacity to differentiate into IFN-γ– or IL-4–producing cells after secondary stimulation in the presence of IL-12 or IL-4 (data not shown). In addition, IRF-2−/− and IRF-2+/− CD4+ T cells expressed equal levels of CD3 (not shown). These data suggest that, in a C57BL/6 background, naive CD4+ T cells exhibit a natural bias towards the development of a Th1 response, but that this Th1 bias is absent in IRF-2−/− CD4 T cells.
Table 4.
In Vitro Differentiation of CD4+ IRF-2+/− and IRF-2−/− T Cells
| IRF-2+/− | IRF-2−/− | |||||||
|---|---|---|---|---|---|---|---|---|
| IFN-γ | IL-4 | IFN-γ | IL-4 | |||||
| Secondary stimulus: | − | anti-CD3 | − | anti-CD3 | − | anti-CD3 | − | anti-CD3 |
| Primary stimulus | ||||||||
| Anti-CD3 | <0.016 | 6 | <0.0075 | <0.0075 | <0.016 | <0.016 | <0.0075 | <0.0075 |
| Anti-CD3 + IL-4 + anti–IL-12 | <0.016 | 13 | <0.0075 | 65 | <0.016 | 50 | <0.0075 | 63 |
| Anti-CD3 + IL-12 + anti–IL-4 | 1 | 1,260 | <0.0075 | <0.0075 | <0.016 | 600 | <0.0075 | <0.0075 |
Reduced IL-12 but Normal NO Production in IRF-2−/− Mice.
In IRF-1−/− mice, defective IL-12p70 production was identified as the likely reason for the bias towards the Th2 phenotype 21 22, prompting us to compare IL-12 production by IRF-2+/−, IRF-2−/−, and IRF-1−/− PEC Mφ stimulated in vitro with LPS and IFN-γ. A marked reduction in IL-12p70 produced by IRF-2−/− PEC Mφ compared with IRF-2+/− PEC Mφ was observed, particularly at limiting concentrations of in vitro stimuli (Fig. 2 A). However, the defect in IL-12 production was not as profound as that observed in IRF-1−/− PEC Mφ, confirming recently published data 25.
Figure 2.
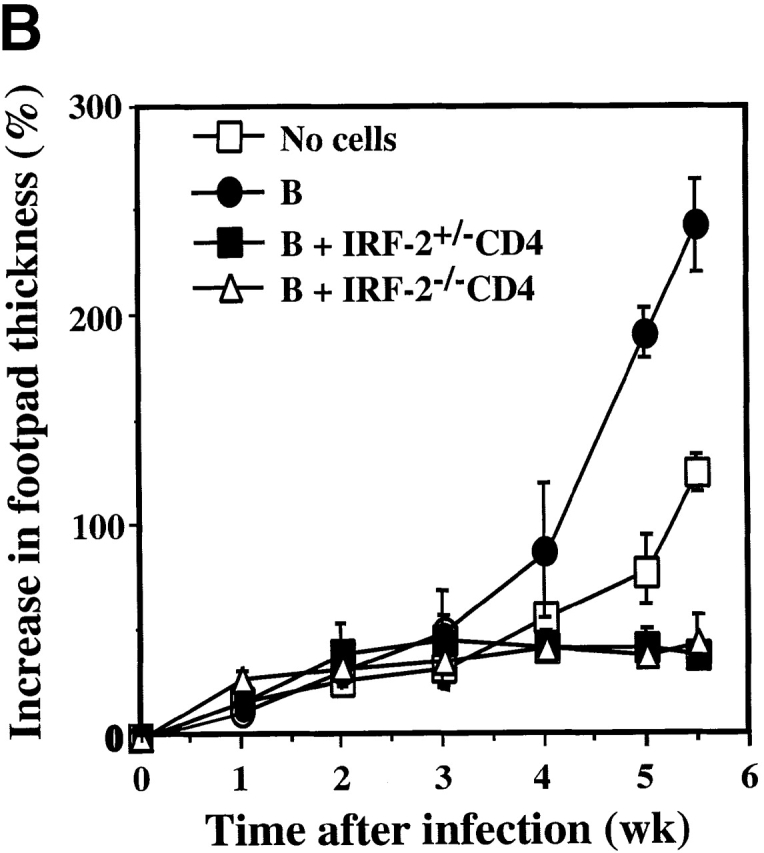
Defective IL-12p70 production but normal NO secretion by IRF-2−/− PEC Mφ. (A) IL-12p70 production by PEC Mφ in response to LPS, with or without increasing concentrations of IFN-γ, as determined by ELISA. (B) NO production by the PEC Mφ in A as assessed by measurement of NO2−. Results for A and B are representative of two experiments each and are depicted as the mean ± SD of triplicate samples from two mice per group. ND, not detectable. (C) Expression of IL-12 p35 and p40 genes. Total mRNA from popliteal LNCs of IRF-2−/− and IRF-2+/− mice, either infected with L. major 10 d earlier or uninfected, was prepared from three mice per group. Quantitative RT-PCR to detect p35 and p40 mRNA was performed (see Materials and Methods). The values obtained for uninfected IRF-2−/− mice were arbitrarily set to one, and the data shown give the number of fold increase in p35 and p40 expression in IRF-2+/− mice relative to these values. Values shown are mean ± SD for three mice per group. One experiment representative of two independent trials is shown.


Production of NO is critical for clearance of L. major 36. Despite their reduced IL-12 secretion, stimulated IRF-2−/− PEC Mφ produced amounts of NO greater than (in the absence of exogenous IFN-γ) or equal to (in the presence of exogenous IFN-γ) those produced by IRF-2+/− PEC Mφ (Fig. 2 B). IRF-1−/− PEC Mφ failed to produce any NO in response to these stimuli. Flow cytometric analyses demonstrated that PEC Mφ from IRF-2+/−, IRF-2−/−, and IRF-1−/− mice had identical forward/side scatter characteristics and stained equally for Mac-1+ (CD11b/CD18) and F4/80+. Thus, apart from their defect in IL-12 production, IRF-2−/− PEC Mφ were very similar in gross phenotype to IRF-2+/− PEC Mφ and clearly functional as assessed by NO release. Therefore, the enhanced susceptibility to L. major in IRF-2−/− mice is not due to reduced NO secretion. Normal NO production in the absence of IRF-2 (but not IRF-1) also implies distinct roles for IRF-1 and IRF-2 in the regulation of at least some inducible genes.
To demonstrate defective IL-12 production in the absence of IRF-2−/− in vivo_,_ IL-12 production by popliteal LNCs during L. major infection was quantified. 10 d after infection, total RNA was purified from popliteal LNCs and quantitative RT-PCR was performed to detect expression of the IL-12 p35 and p40 genes (Fig. 2 C). Approximately equal amounts of p35 and p40 mRNAs could be detected in LNCs from uninfected IRF-2+/− and IRF-2−/− mice. In LNCs of L. _major–_infected mice, the levels of p35 mRNA (the constitutive IL-12 component) were still comparable but there was a significant reduction in p40 mRNA (the inducible component) in IRF-2−/− LNCs compared with IRF-2+/− LNCs, likely accounting for the defective IL-12 production in IRF-2−/− mice in vivo.
Profound Reduction in NK Cell Numbers in IRF-2−/− Mice.
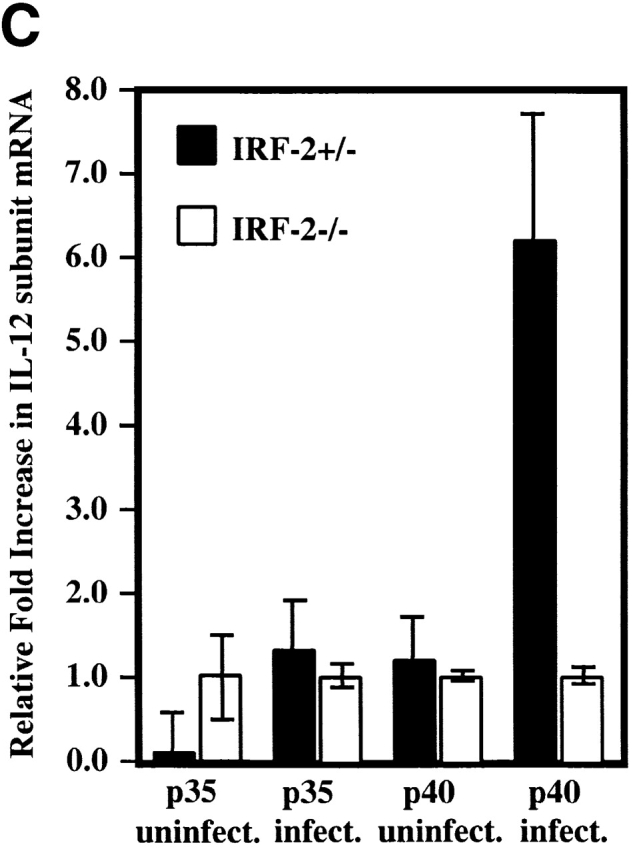
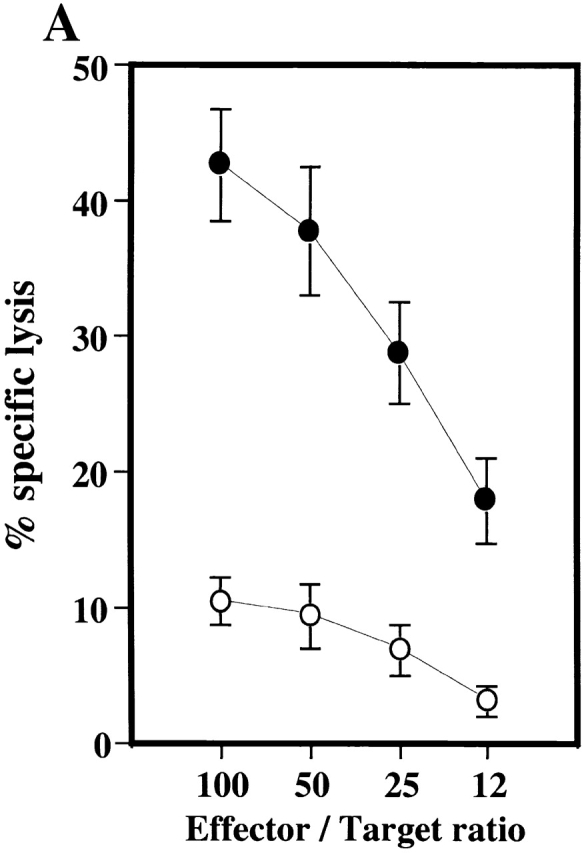
Although Th1 cells are the major players in L. major clearance, NK cells also have an important role 37 38. We thus investigated whether, like IRF-1−/− mice, IRF-2−/− mice exhibit defects in NK cell development and/or function. To assess total NK function, poly(I):poly(C), which induces type 1 IFN and activates NK cells, was injected intravenously into IRF-2−/− and IRF-2+/− mice. 1 d later, splenic mononuclear cells were harvested and tested in vitro for lytic activity against the NK target cell line YAC-1 (Fig. 3 A). IRF-2−/− splenocytes displayed a large decrease in NK activity compared with IRF-2+/− splenocytes, indicating an overall deficit in NK function in this organ. A strong defect in NK cell activity was also noted in vivo in a tumor rejection model using the NK-sensitive cell line RMA-S (data not shown).
Figure 3.
Defective NK activity and development in IRF-2−/− mice. (A) In vitro cytolytic activity against YAC-1 cells. NK activity was induced in mice by injection of poly(I):poly(C), and lytic activity of splenic NK cells from IRF-2+/− (•) or IRF-2−/− (○) mice was assessed. Data are shown as mean ± SEM for four mice of each genotype. (B) Frequency of NK cells in lymphoid compartments of IRF-2−/− mice. SPL, spleen; LIV, liver. Numbers shown are the mean percent ± SEM of NK (NK1.1+TCR-α/β−, top left) and NK+T (NK1.1+TCR-α/β+, top right) cells for four mice (+/+, +/−) or six mice (−/−) of 8–12 wk of age. Percentages of TCR-α/β+NK1.1− cells in IRF-2+/+, IRF-2+/−, and IRF-2−/− mice were approximately equal in both lymphoid compartments (data not shown).

To establish if this decreased NK activity correlated with a reduction in NK cell numbers, the proportion of cells carrying the NK cell marker NK1.1, with or without TCR-α/β, was determined in several tissue compartments of IRF-2+/+, IRF-2+/−, and IRF-2−/− mice. In spleen and liver (Fig. 3 B), as well as in peripheral blood (data not shown), the percentage of NK1.1+TCR-α/β− cells was dramatically decreased in IRF-2−/− mice compared with IRF-2+/− and IRF-2+/+ mice. Strikingly, approximately equal numbers of NK1.1+TCR-α/β+ T (NK1+ T) cells were observed in all three genotypes.
In contrast to the periphery, the proportion of NK1.1+ TCR-α/β− cells in the BM of IRF-2−/− mice was only slightly reduced compared with IRF-2+/− controls (2.82 ± 1.17 vs. 2.01 ± 0.95% in IRF-2+/− and IRF-2−/−, respectively, mean percentage of viable lymphocytes gated ± SD for 11 mice). Thus, the lack of functional NK activity both in vivo and in vitro correlates well with the profound reduction in NK cell numbers in the periphery, but not the BM, of IRF-2−/− mice.
Altered NK Cell Development in the Absence of IRF-2.
The development of NK cells requires interaction between NK progenitors and the BM microenvironment 39. To identify cell populations affected by a lack of IRF-2, BM cells from IRF-2−/− mice in a C57BL/6 background were transferred into irradiated, H-2–compatible 129/SvJ (129J) mice. The expression of Ly9.1, a marker expressed on lymphocytes of 129J mice but not C57BL/6 mice, allowed us to distinguish between donor-derived lymphoid cells (Ly9.1−) and BM recipient–derived cells (Ly9.1+). In irradiated 129J mice receiving IRF-2−/− BM (IRF-2−/−→129J), the frequency of donor-derived NK cells (Ly9.1−, TCR-α/β−, NK1.1+, DX5+) was reduced in the spleen (Fig. 4 A) and liver (data not shown) compared with irradiated wild-type 129J mice which received IRF-2+/− BM cells (IRF-2+/−→129J). In contrast, the frequency of donor-derived NK+ T cells was comparable in IRF-2+/−→129J and IRF-2−/−→129J chimeras (0.4 ± 0.1 and 0.4 ± 0.1% NK1.1+TCR-α/β+, respectively; mean ± SD for seven mice in each group), showing that there was not a global lack of engraftment of IRF-2–deficient BM stem cells. To determine if IRF-2−/− mice are able to provide an appropriate microenvironment for IRF-2−/− NK progenitors to differentiate into mature NK cells, we performed the reverse transfer of wild-type 129J BM into irradiated C57BL/6 IRF-2+/− or IRF-2−/− mice. In this case, NK cells derived from the donor 129J mice were distinguished by expression of Ly9.1, DX5, and the IL-2Rβ chain (NK1.1 is not expressed on lymphoid cells of 129J origin). Both 129J→IRF-2+/− and 129J→IRF-2−/− BM chimeras were able to generate donor-derived NK cells (Ly9.1+, TCR-α/β−, IL-2Rβ+, DX5+) to a similar extent in both spleen (Fig. 4 B) and liver (data not shown). These results show that IRF-2 is required for the optimal development of NK cell progenitors into mature NK cells, but is not required for the maintenance of a BM microenvironment permissive for NK cell development.
Figure 4.
Lack of IRF-2 results in altered NK cell development but a normal BM microenvironment. BM was transferred into lethally irradiated hosts, and splenic NK cell reconstitution was assessed at 10–12 wk after transfer. (A) Transfer of C57BL/6 (Ly9.1−) IRF-2+/− or IRF-2−/− BM into wild-type 129J (Ly9.1+) recipients. A representative FACS® profile is shown, together with the percentage of TCR-α/β−-gated splenic lymphocytes identified as NK cells of donor origin (Ly 9.1−NK1.1+DX5+) (mean percent ± SD, seven mice per group). (B) Transfer of wild-type 129J BM into IRF-2+/− or IRF-2−/− recipients. A representative FACS® profile and the percentage of TCR-α/β−-gated splenic lymphocytes identified as NK cells of donor origin (Ly 9.1+IL-2Rβ+DX5+) is shown (mean percent ± SD, four mice per group). (C) B220 and c-kit expression on IRF-2−/− BM NK cells reveals an immature phenotype. Histograms show B220 (left) and c-kit (right) expression on BM NK1.1+ TCR-α/β−CD19− (B220) and NK1.1+CD19− (c-kit) cells. The solid histogram represents an isotype control, the thin line represents IRF-2+/−, and the bold line represents IRF-2−/− cells. Histograms show staining for one mouse in each group, representative of nine (B220) and four to five (c-kit) mice.


The progress of NK cell development can be assessed by monitoring the expression of the hematopoietic markers B220 (CD45) and c-kit (CD117). As shown in Fig. 4 C, a greater proportion of IRF-2−/− BM NK cells had the less mature NK1.1+c-kit+CD19−B220+ phenotype than in IRF-2+/− BM. Percentages of B220+NK1.1+TCR-α/β−CD19− cells were 45.6 ± 1.3 3, 44.5 ± 8.7 9, and 72.0 ± 6.5 9 in IRF-2+/+, IRF-2+/−, and IRF-2−/− mice, respectively (mean percent ± SD, number of mice analyzed in parentheses). Percentages of c-kit+NK1.1+ CD19− cells were 16.7 ± 2.0 3, 22.9 ± 3.0 4, and 69.9 ± 6.1 5 in IRF-2+/+, IRF-2+/−, and IRF-2−/− mice, respectively (mean percent ± SD). The surface expression of these markers reconfirms our observation that NK cell development is retarded in IRF-2−/− mice.
Failure of IL-15 to Support NK Development in IRF-2−/− BM.
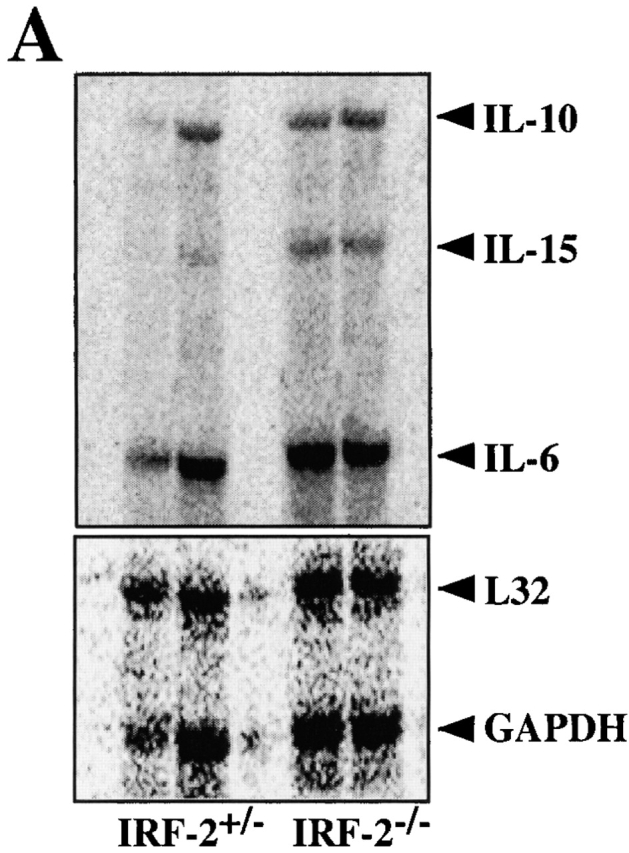
The pivotal role of IL-15 in the differentiation, survival, and activation of NK cells (for a review, see reference 40), and the defect in IL-15 production observed in IRF-1−/− mice 41 42, prompted us to examine IL-15 expression in IRF-2−/− mice. Expression of IL-15 mRNA species was compared in total BM isolated from IRF-2+/− and IRF-2−/− mice. IL-15 mRNA was found to be present in greater abundance in IRF-2−/− BM stimulated with LPS plus IFN-γ than in stimulated IRF-2+/− BM (Fig. 5 A). In conjunction with our BM chimera results, these data indicate that IRF-2−/− BM is indeed capable of producing physiologically relevant amounts of IL-15.
Figure 5.
IL-15 transcripts can be induced in the absence of IRF-2, but IRF-2−/− BM NK cells are refractory to the proliferative effects of IL-15. (A) Expression of IL-15 mRNA by IRF-2+/− and IRF-2−/− BM stimulated with LPS plus IFN-γ as assessed by RNase Protection assay (top). A shorter exposure of the gel shows the expression of the housekeeping genes L32 and glyceraldehyde 3-phosphate dehydrogenase (GAPDH) (bottom). RNA obtained from BM of two mice of each genotype is shown. No IL-15 mRNA was detected in unstimulated BM of either genotype (data not shown). (B) Defect in IL-15–mediated NK development. BM was cultured in the absence (left) or presence (right) of IL-15 for 7 d, after which cells were harvested, counted, and analyzed by flow cytometry. The number of NK1.1+TCR-α/β− cells recovered is shown. Values are the mean ± SD for two mice per group. One result representative of five experiments is shown.
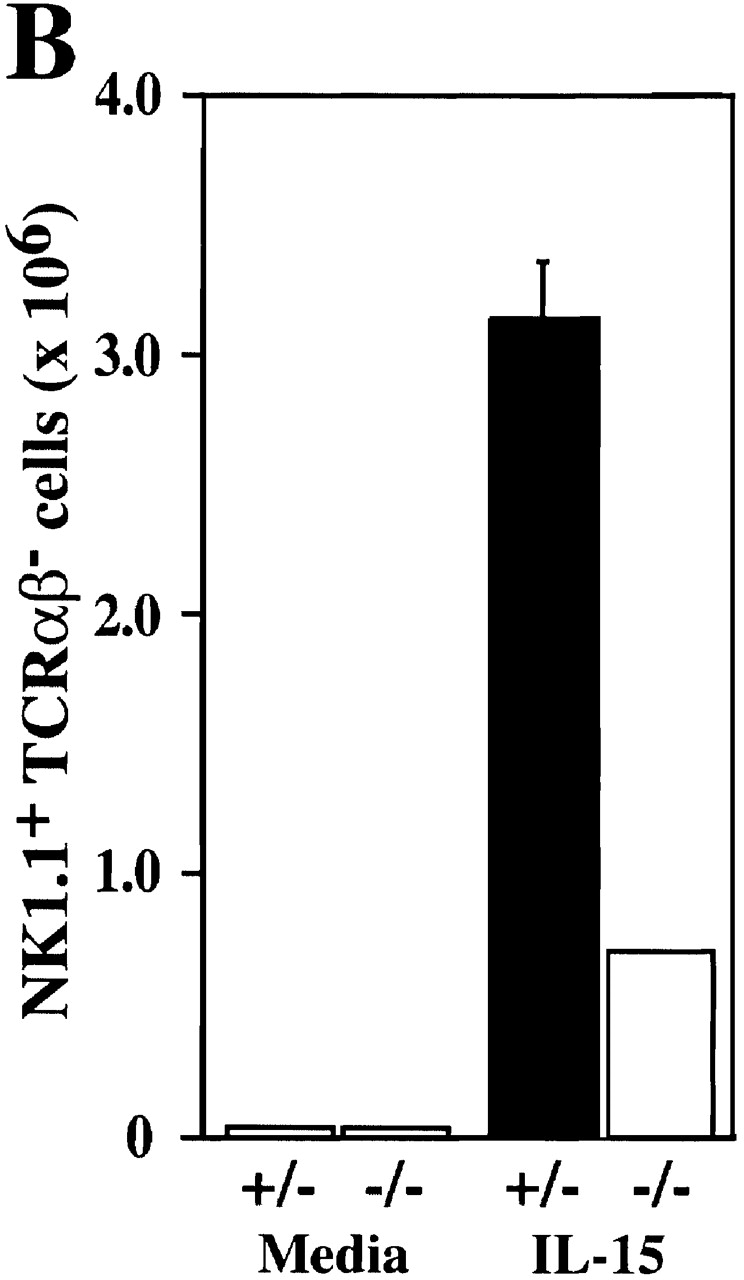
We next investigated the ability of IL-15 to support IRF-2−/− NK cell differentiation and proliferation in vitro. Culture of IRF-2+/− BM in IL-15 for 7 d resulted in the generation of relatively pure NK cells (∼90% NK1.1+ TCR-α/β−, data not shown). After 7 d culture in IL-15, IRF-2−/− BM was also able to generate NK cells (∼90% NK1.1+TCR-α/β−, data not shown) but the yield was markedly reduced compared with IRF-2+/− BM (Fig. 5 B). In a control experiment (not shown), IL-15 was able to rescue NK cell development in IRF-1−/− BM, confirming previous reports 41 42. From this data it can be concluded that IRF-1 is clearly not able to fully compensate for a lack of IRF-2 in IL-15–induced NK differentiation, suggesting that the defect in NK development in IRF-2−/− mice differs significantly from that of IRF-1−/− mice.
Surface expression of the IL-2Rβ chain is thought to be essential for the maturation of NK cell progenitors, conferring responsiveness to IL-15 with the subsequent acquisition of proliferative and lytic potential 43. Both IRF-2−/− and IRF-2+/− BM NK cells displayed equivalent surface expression of IL-2Rβ (data not shown), ruling out a defect in IL-2Rβ expression as the cause of the failure of IL-15 to induce IRF-2−/− BM NK proliferation. In addition, γc subunit expression was equivalent in IRF-2+/− and IRF-2−/− BM NK cells (data not shown). Is the defective IL-15 response seen in NK cells restricted only to that cell type? To address this question, we cultured enriched CD8+ T cells in various doses of human recombinant IL-15, and assessed proliferation of CD8+CD44hi T cells by BrdU incorporation using flow cytometry (data not shown). BrdU incorporation was comparable in both IRF-2+/− and IRF-2−/− CD8+ T cells, indicating that no global defect in IL-15 responsiveness exists in IRF-2–deficient mice.
The defect in NK cell differentiation therefore has different underlying causes in IRF-1– and IRF-2–deficient mice, suggesting that IRF-1 is not able to compensate for a lack or IRF-2 in this respect.
Discussion
In this study, we present novel data showing that the transcriptional factor IRF-2 is required for Th1 responses and NK cell development. IRF-2−/− mice failed to mount a strong Th1 response to L. major infection, and developed enlarged local skin lesions and highly elevated parasite loads. In contrast to IRF-1−/− mice, which also show increased susceptibility to leishmaniasis 22, IRF-2−/− mice produced normal levels of NO 44, illustrating that the increased susceptibility of IRF-2−/− mice cannot be explained simply by a defect in iNOS induction. Rather, IRF-2−/− mice are highly susceptible to L. major infection because of a skewing of their T cell responses towards a Th2 phenotype. A similar bias has been demonstrated in BALB/c mice, the susceptible mouse strain used as the standard for studies in murine experimental leishmaniasis 25.
The Th2 phenotype of IRF-2−/− mice does not reside in a primary defect in the ability of CD4+ T cells to differentiate into Th1 cells. Transfer of purified IRF-2−/−CD4+ T cells into susceptible RAG-1−/− mice was as effective as transfer of IRF-2+/−CD4+ T cells in protecting the recipients against leishmaniasis, and IRF-2−/−CD4+ T cells were fully able to differentiate into Th1 cells in the IRF-2 competent environment of a RAG-1−/− mouse. IRF-2−/− CD4+ T cells were also capable of differentiating into either Th1 or Th2 cells in vitro when cocultured with IL-12 or IL-4, respectively. These data clearly show that, under the appropriate conditions, IRF-2−/−CD4+ T cells are perfectly able to differentiate into Th1 cells and that the defect underlying the Th2 bias of IRF-2−/− mice must encompass cells other than CD4+ T cells.
In fact, our results suggest that defects in several cell types cooperate to create the Th2 phenotype in IRF-2−/− mice. IRF-2−/− macrophages produce reduced amounts of IL-12 after in vitro stimulation (25; and this study), and IL-12p40 mRNA is significantly reduced in the lesion-draining LNs of IRF-2−/− mice. In vivo, macrophages do not produce IL-12 constitutively, but are induced to do so by IFN-γ 45. IFN-γ is a major product of NK cells, and IRF-2−/− mice contain drastically reduced numbers of NK cells. Thus, the defective induction of IL-12 in the absence of early IFN-γ production by NK cells may synergize with the reduced inherent capacity of IRF-2−/− macrophages to produce IL-12 to influence Th1 development. In part, IRF-2−/−CD4+ T cells by themselves may also contribute to the Th2 bias, as indicated by their failure to differentiate in vitro into Th1 cells after anti-CD3 stimulation in the absence of cytokines. Therefore, it is possible that IRF-2 may play a role in a recently described pathway of IL-12–independent Th1 differentiation 46.
A central role for IL-15 in NK cell progenitor differentiation and proliferation has been clearly demonstrated in studies of gene-targeted mice lacking components of the IL-15 receptor 47 48 or IL-15 itself 49. The lack of NK cells in IRF-1−/− mice has been attributed to a defect in IL-15 production in BM 41 42. In IRF-2−/− mice, IL-15 transcripts are readily detectable in stimulated IRF-2−/− BM cells and an NK-permissive microenvironment is present because irradiated IRF-2−/− BM chimeras can support wild-type NK cell development. However, IRF-2−/− BM NK cells are immature and show reduced proliferation in response to exogenous IL-15. In contrast to the situation seen in NK cells, IL-15–induced proliferation of CD44hi CD8+ T cells in vitro is comparable in both IRF-2+/− and IRF-2−/− cells, indicating that there is no global defect in IL-15 responsiveness in IRF-2–deficient mice. The precise molecular defect underlying the reduced responsiveness of IRF-2−/− NK progenitors to IL-15 and the developmental retardation of NK cell development is currently under investigation.
In contrast to the NK cell defect, normal numbers of NK+ T cells were present in all IRF-2−/− lymphoid compartments tested. NK+ T cells constitute an interesting IL-4– and IFN-γ–producing subset of T lymphocytes that exhibits a highly skewed TCR repertoire 50. The physiological role of NK+ T cells remains obscure, but may involve the production of IL-4 that occurs immediately after CD3 stimulation 51. Because NK+ T cells are present in normal numbers in IRF-2−/− mice, there may be a relative overabundance of IL-4 (produced by NK+ T cells) compared with IL-12 (produced by NK cell–dependent macrophages) that also biases towards Th2 responses.
We have shown that IRF-2−/− mice are remarkably similar to IRF-1−/− mice 21 22 in terms of their susceptibility to Leishmania infection, their bias towards a Th2 response, and their cytokine secretion profiles. Furthermore, the macrophages of both IRF-1−/− and IRF-2−/− mice have a diminished capacity to produce IL-12. These results suggest that IRF-2, like IRF-1, mediates at least part of its effects through direct transcriptional activation, possibly via the formation of a complex with another IRF family member. Candidate molecules are IRF-1 itself and ICSBP, which is expressed in cells of the myeloid and lymphoid lineages and which has been shown to interact with IRF-1 13 and IRF-2 15. This hypothesis would be favored by the fact that, like IRF-1−/− and IRF-2−/− mice, ICSBP−/− mice display defective Th1 differentiation 24 25. However, the phenotypes of IRF-1−/− and IRF-2−/− mice differ in three important ways which may at the same time be evidence for in vivo antagonism of IRF-1 by IRF-2, at least for some genes. First, IRF-2−/− mice contain normal numbers of NK+ T cells, whereas these cells are severely reduced in IRF-1−/− mice 42. Second, IL-15 expression is enhanced in BM of IRF-2−/− mice, but absent in IRF-1−/− BM. Third, NO synthesis in IRF-1−/− macrophages is almost absent 3 but is normal 44 in IRF-2−/− macrophages. In conclusion, IRF-2 appears to act as an functional agonist rather than antagonist of IRF-1 in the regulation of some, but not all, genes involved in the differentiation of Th cells. In addition, IRF-2 is required for optimal maturation of NK cells.
Acknowledgments
We thank Dr. R. Titus for the parasite burden determination protocol, Denis Bouchard and Peter Rohwer for flow cytometry advice, Arsen Zakarian and Claudia Giessler for expert technical assistance, and Dr. M. Saunders for scientific editing of the manuscript.
This work was supported by the Deutsche Forschungsgemeinschaft (SFB 263), the National Institutes of Health, the Medical Research Council of Canada, and the National Cancer Institute of Canada.
Footnotes
M. Lohoff and G.S. Duncan contributed equally to this work.
Abbreviations used in this paper: APC, allophycocyanin; BM, bone marrow; BrdU, bromodeoxyuridine; ICSBP, IFN consensus sequencing binding protein; IRF, IFN regulatory factor; iNOS, inducible NO synthase; ISRE, IFN-stimulated regulatory element; LNC, LN cell; Mφ, macrophage(s); NO, nitric oxide; PEC, peritoneal exudate cell; RAG, recombination activating gene; RT, reverse transcription; SN, supernatant.
References
- Mamane Y., Heylbroeck C., Genin P., Algarte M., Servant M.J., LePage C., DeLuca C., Kwon H., Lin R., Hiscott J. Interferon regulatory factorsthe next generation. Gene. 1999;237:1–14. doi: 10.1016/s0378-1119(99)00262-0. [DOI] [PubMed] [Google Scholar]
- Lamphier M., Taniguchi T. The transcription factors IRF-1 and IRF-2. The Immunologist. 1994;2:167–171. [Google Scholar]
- Kamijo R., Harada H., Matsuyama T., Bosland M., Gerecitano J., Shapiro D., Le J., Koh S.I., Kimura T., Green S.J. Requirement for transcription factor IRF-1 in NO synthase induction in macrophages. Science. 1994;263:1612–1615. doi: 10.1126/science.7510419. [DOI] [PubMed] [Google Scholar]
- Harada H., Willison K., Sakakibara J., Miyamoto M., Fujita T., Taniguchi T. Absence of the type I IFN system in EC cellstranscriptional activator (IRF-1) and repressor (IRF-2) genes are developmentally regulated. Cell. 1990;63:303–312. doi: 10.1016/0092-8674(90)90163-9. [DOI] [PubMed] [Google Scholar]
- Fujita T., Kimura Y., Miyamoto M., Barsoumian E.L., Taniguchi T. Induction of endogenous IFN-alpha and IFN-beta genes by a regulatory transcription factor, IRF-1. Nature. 1989;337:270–272. doi: 10.1038/337270a0. [DOI] [PubMed] [Google Scholar]
- Harada H., Kitagawa M., Tanaka N., Yamamoto H., Harada K., Ishihara M., Taniguchi T. Anti-oncogenic and oncogenic potentials of interferon regulatory factors-1 and -2. Science. 1993;259:971–974. doi: 10.1126/science.8438157. [DOI] [PubMed] [Google Scholar]
- Matsuyama T., Kimura T., Kitagawa M., Pfeffer K., Kawakami T., Watanabe N., Kundig T.M., Amakawa R., Kishihara K., Wakeham A. Targeted disruption of IRF-1 or IRF-2 results in abnormal type I IFN gene induction and aberrant lymphocyte development. Cell. 1993;75:83–97. [PubMed] [Google Scholar]
- Reis L.F., Ruffner H., Stark G., Aguet M., Weissmann C. Mice devoid of interferon regulatory factor 1 (IRF-1) show normal expression of type I interferon genes. EMBO (Eur. Mol. Biol. Organ.) J. 1994;13:4798–4806. doi: 10.1002/j.1460-2075.1994.tb06805.x. [DOI] [PMC free article] [PubMed] [Google Scholar]
- Vaughan P.S., van der Meijden C.M.J., Aziz F., Harada H., Taniguichi T., van Wijnen A.J., Stein J.L., Stein G.S. Cell cycle regulation of histone H4 gene transcription requires the oncogenic factor IRF-2. J. Biol. Chem. 1998;273:194–199. doi: 10.1074/jbc.273.1.194. [DOI] [PubMed] [Google Scholar]
- Jesse T.L., LaChance R., Iademaro M.F., Dean D.C. Interferon regulatory factor-2 is a transcriptional activator in muscle where it regulates expression of vascular cell adhesion molecule-1. J. Cell Biol. 1998;140:1265–1276. doi: 10.1083/jcb.140.5.1265. [DOI] [PMC free article] [PubMed] [Google Scholar]
- Weisz A., Marx P., Sharf R., Appella E., Driggers P.H., Ozato K., Levi B.Z. Human interferon consensus sequence binding protein is a negative regulator of enhancer elements common to interferon-inducible genes. J. Biol. Chem. 1992;267:25589–25596. [PubMed] [Google Scholar]
- Nelson N., Marks M.S., Driggers P.H., Ozato K. Interferon consensus sequence-binding protein, a member of the interferon regulatory factor family, suppresses interferon-induced gene transcription. Mol. Cell. Biol. 1993;13:588–599. doi: 10.1128/mcb.13.1.588. [DOI] [PMC free article] [PubMed] [Google Scholar]
- Bovolenta C., Driggers P.H., Marks M.S., Medin J.A., Politis A.D., Vogel S.N., Levy D.E., Sakaguchi K., Appella E., Coligan J.E. Molecular interactions between interferon consensus sequence binding protein and members of the interferon regulatory factor family. Proc. Natl. Acad. Sci. USA. 1994;91:5046–5050. doi: 10.1073/pnas.91.11.5046. [DOI] [PMC free article] [PubMed] [Google Scholar]
- Sharf R., Meraro D., Azriel A., Thornton A.M., Ozato K., Petricoin E.F., Larner A.C., Schaper F., Hauser H., Levi B.Z. Phosphorylation events modulate the ability of interferon consensus sequence binding protein to interact with interferon regulatory factors and to bind DNA. J. Biol. Chem. 1997;272:9785–9792. doi: 10.1074/jbc.272.15.9785. [DOI] [PubMed] [Google Scholar]
- Holtschke T., Lohler J., Kanno Y., Fehr T., Giese N., Rosenbauer F., Lou J., Knobeloch K.P., Gabriele L., Waring J.F. Immunodeficiency and chronic myelogenous leukemia-like syndrome in mice with a targeted mutation of the ICSBP gene. Cell. 1996;87:307–317. doi: 10.1016/s0092-8674(00)81348-3. [DOI] [PubMed] [Google Scholar]
- Tanaka N., Kawakami T., Taniguchi T. Recognition DNA sequences of interferon regulatory factor 1 (IRF-1) and IRF-2, regulators of cell growth and the interferon system. Mol. Cell. Biol. 1993;13:4531–4538. doi: 10.1128/mcb.13.8.4531. [DOI] [PMC free article] [PubMed] [Google Scholar]
- Ma X., Chow J.M., Gri G., Carra G., Gerosa F., Wolf S.F., Dzialo R., Trinchieri G. The interleukin 12 p40 gene promoter is primed by interferon gamma in monocytic cells. J. Exp. Med. 1996;183:147–157. doi: 10.1084/jem.183.1.147. [DOI] [PMC free article] [PubMed] [Google Scholar]
- Swain S.L., Weinberg A.D., English M., Huston G. IL-4 directs the development of Th2-like helper effectors. J. Immunol. 1990;145:3796–3806. [PubMed] [Google Scholar]
- Le Gros G., Ben Sasson S.Z., Seder R., Finkelman F.D., Paul W.E. Generation of interleukin 4 (IL-4)–producing cells in vivo and in vitroIL-2 and IL-4 are required for in vitro generation of IL-4–producing cells. J. Exp. Med. 1990;172:921–929. doi: 10.1084/jem.172.3.921. [DOI] [PMC free article] [PubMed] [Google Scholar]
- Hsieh C.S., Macatonia S.E., Tripp C.S., Wolf S.F., O'Garra A., Murphy K.M. Development of TH1 CD4+ T cells through IL-12 produced by Listeria-induced macrophages. Science. 1993;260:547–549. doi: 10.1126/science.8097338. [DOI] [PubMed] [Google Scholar]
- Taki S., Sato T., Ogasawara K., Fukuda T., Sato M., Hida S., Suzuki G., Mitsuyama M., Shin E.H., Kojima S. Multistage regulation of Th1-type immune responses by the transcription factor IRF-1. Immunity. 1997;6:673–679. doi: 10.1016/s1074-7613(00)80443-4. [DOI] [PubMed] [Google Scholar]
- Lohoff M., Ferrick D., Mittrucker H.W., Duncan G.S., Bischof S., Rollinghoff M., Mak T.W. Interferon regulatory factor-1 is required for a T helper 1 immune response in vivo. Immunity. 1997;6:681–689. doi: 10.1016/s1074-7613(00)80444-6. [DOI] [PubMed] [Google Scholar]
- Scharton-Kersten T., Contursi C., Masumi A., Sher A., Ozato K. Interferon consensus sequence binding protein–deficient mice display impaired resistance to intracellular infection due to a primary defect in interleukin 12 p40 induction. J. Exp. Med. 1997;186:1523–1534. doi: 10.1084/jem.186.9.1523. [DOI] [PMC free article] [PubMed] [Google Scholar]
- Giese N.A., Gabriele L., Doherty T.M., Klinman D.M., Tadesse H.L., Contursi C., Epstein S.L., Morse H.C. Interferon (IFN) consensus sequence-binding protein, a transcription factor of the IFN regulatory factor family, regulates immune responses in vivo through control of interleukin 12 expression. J. Exp. Med. 1997;186:1535–1546. doi: 10.1084/jem.186.9.1535. [DOI] [PMC free article] [PubMed] [Google Scholar]
- Salkowski C.A., Kopydlowski K., Blanco J., Cody M.J., McNally R., Vogel S.N. IL-12 is dysregulated in macrophages from IRF-1 and IRF-2 knockout mice. J. Immunol. 1999;163:1529–1536. [PubMed] [Google Scholar]
- Reiner S.L., Locksley R.M. The regulation of immunity to Leishmania major . Annu. Rev. Immunol. 1995;13:151–177. doi: 10.1146/annurev.iy.13.040195.001055. [DOI] [PubMed] [Google Scholar]
- Stenger S., Donhauser N., Thuring H., Rollinghoff M., Bogdan C. Reactivation of latent leishmaniasis by inhibition of inducible nitric oxide synthase. J. Exp. Med. 1996;183:1501–1514. doi: 10.1084/jem.183.4.1501. [DOI] [PMC free article] [PubMed] [Google Scholar]
- Lima H.C., Bleyenberg J.A., Titus R.G. A simple method for quantifying Leishmania in tissues of infected animals. Parasitol. Today. 1997;13:80–82. doi: 10.1016/s0169-4758(96)40010-2. [DOI] [PubMed] [Google Scholar]
- Lohoff M., Schmitt E., Reske-Kunz A.B., Rollinghoff M. Different response of Th1 cells for stimulation with anti-CD3 antibodies. Eur. J. Immunol. 1990;20:653–658. doi: 10.1002/eji.1830200328. [DOI] [PubMed] [Google Scholar]
- Ohara J., Paul W.E. Production of a monoclonal antibody to and molecular characterization of B-cell stimulatory factor-1. Nature. 1985;315:333–336. doi: 10.1038/315333a0. [DOI] [PubMed] [Google Scholar]
- Karasuyama H., Melchers F. Establishment of mouse cell lines which constitutively secrete large quantities of interleukin 2, 3, 4 or 5, using modified cDNA expression vectors. Eur. J. Immunol. 1988;18:97–104. doi: 10.1002/eji.1830180115. [DOI] [PubMed] [Google Scholar]
- Fehniger T.A., Shah M.H., Turner M.J., VanDeusen J.B., Whitman S.P., Cooper M.A., Suzuki K., Wechser M., Goodsaid F., Caligiuri M.A. Differential cytokine and chemokine gene expression by human NK cells following activation with IL-18 or IL-15 in combination with IL-12implications for the innate immune response. J. Immunol. 1999;162:4511–4520. [PubMed] [Google Scholar]
- Green L.C., Wagner D.A., Glogowski J., Skipper P.L., Wishnok J.S., Tannenbaum S.R. Analysis of nitrate, nitrite, and [15N]nitrate in biological fluids. Anal. Biochem. 1982;126:131–138. doi: 10.1016/0003-2697(82)90118-x. [DOI] [PubMed] [Google Scholar]
- Duncan G.S., Mittrucker H.W., Kagi D., Matsuyama T., Mak T.W. The transcription factor interferon regulatory factor-1 is essential for natural killer cell function in vivo. J. Exp. Med. 1996;184:2043–2048. doi: 10.1084/jem.184.5.2043. [DOI] [PMC free article] [PubMed] [Google Scholar]
- Ohteki T., MacDonald H.R. Major histocompatibility complex class I related molecules control the development of CD4+CD8− and CD4−CD8− subsets of natural killer 1.1+ T cell receptor-α/β+ cells in the liver of mice. J. Exp. Med. 1994;180:699–704. doi: 10.1084/jem.180.2.699. [DOI] [PMC free article] [PubMed] [Google Scholar]
- Wei X.Q., Charles I.G., Smith A., Ure J., Feng G.J., Huang F.P., Xu D., Muller W., Moncada S., Liew F.Y. Altered immune responses in mice lacking inducible nitric oxide synthase. Nature. 1995;375:408–411. doi: 10.1038/375408a0. [DOI] [PubMed] [Google Scholar]
- Scharton T.M., Scott P. Natural killer cells are a source of interferon gamma that drives differentiation of CD4+ T cell subsets and induces early resistance to Leishmania major in mice. J. Exp. Med. 1993;178:567–577. doi: 10.1084/jem.178.2.567. [DOI] [PMC free article] [PubMed] [Google Scholar]
- Laskay T., Rollinghoff M., Solbach W. Natural killer cells participate in the early defense against Leishmania major infection in mice. Eur. J. Immunol. 1993;23:2237–2241. doi: 10.1002/eji.1830230928. [DOI] [PubMed] [Google Scholar]
- Williams N.S., Klem J., Puzanov I.J., Sivakumar P.V., Schatzle J.D., Bennett M., Kumar V. Natural killer cell differentiationinsights from knockout and transgenic mouse models and in vitro systems. Immunol. Rev. 1998;165:47–61. doi: 10.1111/j.1600-065x.1998.tb01229.x. [DOI] [PubMed] [Google Scholar]
- Waldman T.A., Tagaya Y. The multifaceted regulation of interleukin-15 expression and the role of this cytokine in NK cell differentiation and host response to intracellular pathogens. Annu. Rev. Immunol. 1999;17:19–49. doi: 10.1146/annurev.immunol.17.1.19. [DOI] [PubMed] [Google Scholar]
- Ogasawara K., Hida S., Azimi N., Tagaya Y., Sato T., Yokochi-Fukada T., Waldman T.A., Taniguchi T., Taki S. Requirement for IRF-1 in the microenvironment supporting development of natural killer cells. Nature. 1998;391:700–703. doi: 10.1038/35636. [DOI] [PubMed] [Google Scholar]
- Ohteki T., Yoshida H., Matsuyama T., Duncan G.S., Mak T.W., Ohashi P.S. The transcription factor interferon regulatory factor 1 (IRF-1) is important during the maturation of natural killer 1.1+ T cell receptor-α/β1 (NK1+ T) cells, natural killer cells, and intestinal intraepithelial T cells. J. Exp. Med. 1998;187:967–972. doi: 10.1084/jem.187.6.967. [DOI] [PMC free article] [PubMed] [Google Scholar]
- Williams N.S., Klem J., Puzanov I.J., Sivakumar P.V., Bennett M., Kumar V. Differentiation of NK1.1+, Ly49+ NK cells from flt3+ multipotent marrow progenitor cells. J. Immunol. 1999;163:2648–2656. [PubMed] [Google Scholar]
- Fehr T., Schoedon G., Odermatt B., Holtschke T., Schneemann M., Bachmann M.F., Mak T.W., Horak I., Zinkernagel R.M. Crucial role of interferon consensus sequence binding protein, but neither of interferon regulatory factor 1 nor of nitric oxide synthesis for protection against murine listeriosis. J. Exp. Med. 1997;185:921–931. doi: 10.1084/jem.185.5.921. [DOI] [PMC free article] [PubMed] [Google Scholar]
- Flesch I.E., Hess J.H., Huang S., Aguet M., Rothe J., Bluethmann H., Kaufmann S.H. Early interleukin 12 production by macrophages in response to mycobacterial infection depends on interferon gamma and tumor necrosis factor alpha. J. Exp. Med. 1995;181:1615–1621. doi: 10.1084/jem.181.5.1615. [DOI] [PMC free article] [PubMed] [Google Scholar]
- Kaplan M.H., Wurster A.L., Grusby M.J. A signal transducer and activator of transcription (stat) 4–independent pathway for the development of T helper type 1 cells. J. Exp. Med. 1998;188:1191–1196. doi: 10.1084/jem.188.6.1191. [DOI] [PMC free article] [PubMed] [Google Scholar]
- Lodolce J.P., Boone D.L., Chai S., Swain R.E., Themistocles D., Trettin S., Ma A. IL-15 receptor maintains lymphoid homeostasis by supporting lymphocyte homing and proliferation. Immunity. 1998;9:669–676. doi: 10.1016/s1074-7613(00)80664-0. [DOI] [PubMed] [Google Scholar]
- Suzuki H., Duncan G.S., Takimoto H., Mak T.W. Abnormal development of intestinal intraepithelial lymphocytes and peripheral natural killer cells in mice lacking the IL-2 receptor beta chain. J. Exp. Med. 1997;185:499–505. doi: 10.1084/jem.185.3.499. [DOI] [PMC free article] [PubMed] [Google Scholar]
- Kennedy M.K., Glaccum M., Brown S.N., Butz E.A., Viney J.L., Embers M., Matsuki N., Charrier K., Sedger L., Willis C.R. Reversible defects in natural killer and memory CD8 T cell lineages in interleukin 15–deficient mice. J. Exp. Med. 2000;191:771–780. doi: 10.1084/jem.191.5.771. [DOI] [PMC free article] [PubMed] [Google Scholar]
- Bendelac A., Rivera M.N., Park S.-H., Roark J.H. Mouse CD1-specific NK1 T cellsdevelopment, specificity, and function. Annu. Rev. Immunol. 1997;15:535–562. doi: 10.1146/annurev.immunol.15.1.535. [DOI] [PubMed] [Google Scholar]
- Yoshimoto T., Paul W.E. CD4+, NK1.1+ T cells promptly produce interleukin 4 in response to in vivo challenge with anti-CD3. J. Exp. Med. 1994;179:1285–1295. doi: 10.1084/jem.179.4.1285. [DOI] [PMC free article] [PubMed] [Google Scholar]