BDCA-2, a Novel Plasmacytoid Dendritic Cell–specific Type II C-type Lectin, Mediates Antigen Capture and Is a Potent Inhibitor of Interferon α/β Induction (original) (raw)
Abstract
Plasmacytoid dendritic cells are present in lymphoid and nonlymphoid tissue and contribute substantially to both innate and adaptive immunity. Recently, we have described several monoclonal antibodies that recognize a plasmacytoid dendritic cell-specific antigen, which we have termed BDCA-2. Molecular cloning of BDCA-2 revealed that BDCA-2 is a novel type II C-type lectin, which shows 50.7% sequence identity at the amino acid level to its putative murine ortholog, the murine dendritic cell–associated C-type lectin 2. Anti–BDCA-2 monoclonal antibodies are rapidly internalized and efficiently presented to T cells, indicating that BDCA-2 could play a role in ligand internalization and presentation. Furthermore, ligation of BDCA-2 potently suppresses induction of interferon α/β production in plasmacytoid dendritic cells, presumably by a mechanism dependent on calcium mobilization and protein-tyrosine phosphorylation by src-family protein-tyrosine kinases. Inasmuch as production of interferon α/β by plasmacytoid dendritic cells is considered to be a major pathophysiological factor in systemic lupus erythematosus, triggering of BDCA-2 should be evaluated as therapeutic strategy for blocking production of interferon α/β in systemic lupus erythematosus patients.
Keywords: interferon type I, monoclonal antibodies, magnetic cell sorting, interferon inducers, systemic lupus erythematosus
Introduction
Plasmacytoid dendritic cells (PDCs),* which are also known as plasmacytoid T cells (1), plasmacytoid monocytes (2), natural IFN-α/β–producing cells (natural IPCs; references 3–10), and type 2 predendritic cells (pDC2; references 11–14), constitute a subset of immature dendritic cells (DCs), which is capable of differentiating in vitro into mature DCs with typical dendritic cell morphology and potent T cell stimulatory function when exposed to IL-3 alone (15–17), IL-3 and CD40L (18, 19), viruses (20, 21), and bacterial DNA containing unmethylated CpG motifs (CpG-DNA; references 14 and 22). Immature PDCs have been found in human LN (23), tonsils (18, 24), peripheral blood (16, 17, 19, 24–27), cord blood (13, 28), adult and fetal thymus (13, 29–31), fetal liver (13), and fetal bone marrow (13, 24). In addition, presence of PDCs in affected and sometimes even nonaffected tissue has been described in association with many pathological circumstances, including granulomatous lymphadenitis (32), Kikuchi's lymphadenitis (33), dermal lesions and noninflammatory skin of systemic lupus erythematosus (SLE) patients (34, 35), benign cutaneous lymphoid infiltrates (36, 37), nasal mucosa of allergic as well as nonallergic individuals (38), and cerebrospinal fluid from patients with inflammatory as well as noninflammatory neurological diseases (39). Identification of immature PDCs in blood has been commonly based on a multitude of immunophenotypic criteria, such as the absence of CD11c, ILT-1, and a panel of leukocyte lineage-specific Ags (e.g., CD3, CD14, CD19, and CD56) and the presence of CD4, CD123, HLA-DR, CD68, ILT3, or CD45RA (10, 16, 17, 24–27). However, using a panel of new mAb raised against blood DCs, we have recently identified two novel markers of PDCs (19), BDCA-2 and BDCA-4, which enable direct identification of PDCs in human blood. Here we describe the molecular and functional characterization of BDCA-2. BDCA-2 is a novel type II C-type lectin presumably involved in ligand internalization, processing and presentation, as well as in inhibition of IFN-α/β synthesis in PDCs. Our results identify BDCA-2 as an attractive pharmaceutical target for specific downmodulation of IFN-α/β expression in patients with SLE.
Materials and Methods
Cell Preparations.
Buffy coats from normal healthy volunteers were obtained from the Institute for Transfusion Medicine, Merheim Hospital, Cologne, Germany. PBMCs were prepared from buffy coats by standard Ficoll-Paque (Amersham Pharmacia Biotech) density gradient centrifugation. PDCs were isolated from PBMCs by direct magnetic labeling with anti–BDCA-4 mAb (AD5–17F6)–conjugated microbeads (BDCA-4 Cell Isolation Kit; Miltenyi Biotec; reference 19) and enrichment of labeled cells using a high-gradient magnetic cell sorting device (MiniMACS®; Miltenyi Biotec). As determined by staining with PE-conjugated anti–BDCA-2 mAb (AC144; Miltenyi Biotec; reference 19) and flow cytometric analysis using a FACSCalibur™ (Becton Dickinson) and CELLQuest™ software (Becton Dickinson), PDC purities of 92–98% were routinely obtained.
For molecular cloning of BDCA-2, PDCs were isolated from leukapheresis products by indirect magnetic labeling with FITC-conjugated anti–BDCA-2 mAb (AC144; Miltenyi Biotec) and anti-FITC mAb-conjugated microbeads (Miltenyi Biotec), followed by enrichment of labeled cells using a clinically approved immunomagnetic selection device (CliniMACS®; Miltenyi Biotec). Leukapheresis products from nonmobilized volunteers were obtained from the DRK-Blutspendezentrale Ulm, Ulm, Germany.
For reverse transcription (RT)-PCR analysis of BDCA-2 mRNA expression, T cells, B cells, NK cells, and monocytes were isolated from PBMCs by cell sorting with a FACSVantage™ (Becton Dickinson) using mAb against CD3 (mAb SK9, IgG2b; Becton Dickinson), CD19 (mAb 4G7, IgG1; Becton Dickinson), CD56 (mAb MY31, IgG1; Becton Dickinson), and CD14 (mAb MφP9, IgG2b; Becton Dickinson), respectively. Similarly, CD11c+ myeloid DCs and CD123+ PDCs were isolated by FACS® based on the absence of a panel of leukocyte lineage-specific Ag (Lineage Cocktail 1 from Becton Dickinson including mAb against CD3, CD14, CD16, CD19, CD20, and CD56), and the presence of HLA-DR (mAb L243, IgG2a; Becton Dickinson) and either of CD11c (mAb S-HCL-3, IgG2b; Becton Dickinson) or of CD123 (mAb 9F5, IgG1; Becton Dickinson), respectively.
Expression Cloning of Full-length BDCA-2 cDNA.
Poly(A)+ RNA was isolated from magnetically purified PDC using Oligo(dT) microbeads and a high-gradient magnetic cell sorting device (μMACS® mRNA Isolation Kit; Miltenyi Biotec), and used to construct a cDNA library in pEF18SR, a modified pEF18S expression vector (40). Transient expression was performed in COS1 cells. After several rounds of MACS® and finally FACS® using anti BDCA-2 mAb AC144 (19), plasmid DNA of a positive clone (H4#10A) was purified and sequenced. Homology searches were performed in GenBank/EMBL/DDBJ nucleotide databases. Alignments with the murine DC-associated C-type lectin 2 (dectin-2; reference 41) and the human DC immunoreceptor (DCIR; reference 42) and several other type II C-type lectins were analyzed using the ALIGN function of the Genestream server at the Institut de Génétique Humaine, Montpellier, France.
RT-PCR Analysis.
For RT-PCR analysis of BDCA-2 mRNA expression in various blood cell populations, poly(A)+ RNA was isolated from FACS®-purified human T cells, B cells, NK cells, monocytes, CD11c+ myeloid blood DCs, and CD11c− PDCs. First-strand cDNA was prepared from isolated poly(A)+ RNA by reverse transcription using Oligo(dT)12–18 primers (Life Technologies) and the SuperScript II reverse transcriptase (Life Technologies). For RT-PCR analysis of BDCA-2 mRNA expression in various tissues (heart, brain, placenta, lung, liver, skeletal muscle, kidney, pancreas, spleen, thymus, prostate, testis, ovary, small intestine, LN, bone marrow, and fetal liver) sets of normalized first-strand cDNA (Human Multiple Tissue cDNA Panels I and II; CLONTECH Laboratories, Inc.) were used. All cDNAs were normalized to several different housekeeping genes (glyceraldehyde-3-phosphate dehydrogenase, phospholipase A2, α-tubulin, and β-actin). PCR amplification (34 or 38 cycles) was performed using AdvanTaq Plus DNA Polymerase (CLONTECH Laboratories, Inc.) and the primers 5′-TTG AAA GAA CCA CAC CCC GAA AGT-3′ (forward primer) and 5′-TAG CTT TCT ACA ACG GTG GAT GCC-3′ (reverse primer) under the following conditions: 30 s denaturation at 94°C and 120 s annealing and elongation at 68°C. The PCR products were size-fractionated by agarose gel electrophoresis and analyzed after ethidium bromide staining.
Cloning of Truncated BDCA-2 cDNAs (Splice Variants).
Purified Poly(A)+ RNA from PDCs was subjected to DNase I treatment and BDCA-2 mRNA species were specifically amplified by RT-PCR using the Titan One Tube RT-PCR-System (Roche Diagnostics GmbH) and the primers 5′-ACA CAA TGG TGC CTG AAG AAG-3′ (forward primer) and 5′-ACA TTT TAG GGG CAT TCC TTG TA-3′ (reverse primer). After preincubation for 10 min at 25°C and for 30 min at 55°C, PCR cycles (20, 25, and 30 cycles) were run under the following conditions: 30 s denaturation at 94°C, 45 s annealing at 57°C, and 90 s elongation at 72°C. Amplified cDNA fragments were size-fractionated by 4–12% Tris-borate-EDTA (TBE) PAGE and analyzed after staining with ethidium bromide. Individual bands were excised and subjected to PCR reamplification (30 cycles) using the same primer set and the same cycle conditions. After another round of size-fractionation by 4–12% TBE PAGE and excision of the appropriate bands, reamplified fragments were cloned and sequenced. To confirm that two different truncated BDCA-2 mRNA species lacking either exon 3 (665 bp) or exon 4 (647 bp) were present in one excised band (Fig. 4), another round of PCR reamplification (30 cycles; 30 s denaturation at 94°C, 60 s annealing at 60°C, and 60 s elongation at 72°C) was performed using two new sets of primers that allow for amplification of only the variant lacking exon 3 (forward primer binding in exon 2: 5′-ACA CAA TGG TGC CTG AAG AAG-3′ and reverse primer binding in exon 4: 5′-TGG ACA GCC TCT TGA CAG TTT-3′) or the variant lacking exon 4 (forward primer binding in exon 3: 5′-TGG CAG TCG TAT CCA TCT TG-3′; reverse primer binding in exon 7: 5′-ACA TTT TAG GGG CAT TCC TTG TA-3′).
Figure 4.
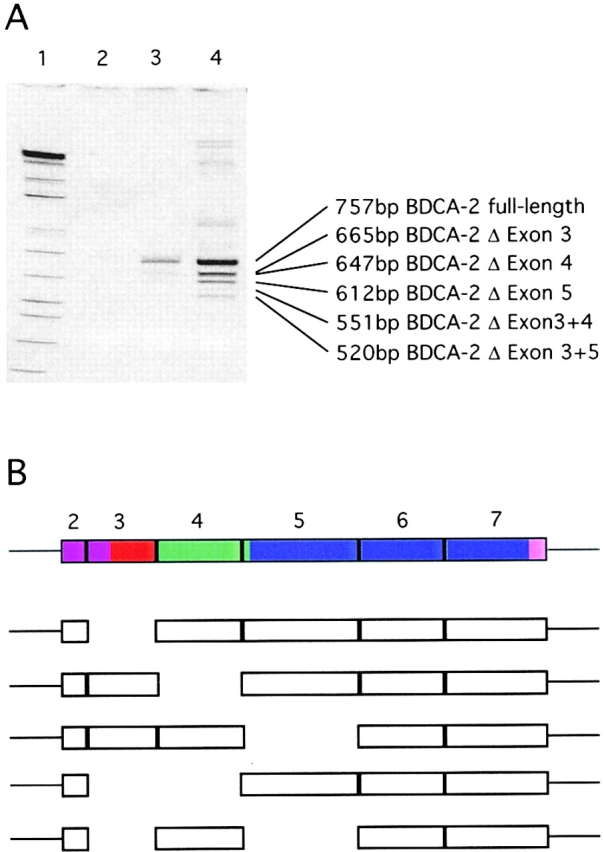
(A) Identification of putative alternative splice forms of BDCA-2 mRNA. Poly(A)+ RNA was isolated from purified PDCs and analyzed for the presence of BDCA-2 mRNA by RT-PCR amplification (lane 2, 20 PCR cycles; lane 3, 25 PCR cycles; lane 4, 30 PCR cycles). The PCR products were size-fractionated by 4–12% TBE PAGE. A further PCR amplification of individual excised bands enabled the cloning and sequencing of individual splice variants. (B) Schematic drawing of the coding region of full-length BDCA-2 mRNA. The structural domains are indicated by different colors (violet, cytoplasmic domain; red, transmembrane domain; green, neck domain; and blue, CRD) and the individual exons (exons 2–7) of the coding region are represented as boxes. Below the full-length BDCA-2 mRNA, BDCA-2 splice variants are shown with the missing exons indicated by gaps.
Immunohistological Localization/Characterization of BDCA-2–expressing PDCs.
Immunohistochemical staining of air-dried, acetone-fixed sections from LNs, tonsils, thymus, and testis with anti–BDCA-2 mAb (AC144, IgG1) was done following an indirect immunoperoxidase technique. Single-color immunofluorescent staining of acetone-fixed cryosections of lymph nodes and thymus was done by primary staining with nonconjugated anti–BDCA-2 mAb (AC144, IgG1) or CD123 mAb (7G3, IgG2a; Becton Dickinson) and secondary staining with FITC-conjugated anti–mouse IgG1 Ab (Southern Biotechnology Associates, Inc.) and Texas red–conjugated anti–mouse IgG2a Ab (Southern Biotechnology Associates, Inc.), respectively.
Double–color immunofluorescent staining of cryostat sections of frozen human tonsils was performed using anti–BDCA-2-FITC (AC144, IgG1) and nonconjugated mAb (IgG2) against CD8, CD20, CD123, and HLA-DR, respectively. Staining with nonconjugated primary mAb was revealed by secondary staining with biotinylated anti-isotype mAb and Texas red–conjugated streptavidin.
Immunoprecipitation.
Cells were surface labeled with 1 mCi of Na125I using the sulfosuccinimidyl-3-(4-hydroxyphenyl)propionate method (43). After surface labeling, cells were lysed in 1% Triton X-100, 100 mM Tris-HCl, pH 7.4, 150 mM NaCl, 5 mM EDTA, 1 mM PMSF, 10 μg/ml aprotinin, and 10 μg/ml leupeptin. After overnight preclearing with protein G-sepharose, lysates were incubated with anti–BDCA-2 mAb (AC144, IgG1) or isotype-matched control mAb at +4°C for 4 h, and immune complexes were precipitated by addition of protein G-Sepharose for 1.5 h at +4°C. Precipitates were washed three times with lysis buffer, followed by a final wash with 10 mM Tris-HCl, pH 7.4, 15 mM NaCl, and then resuspended in nonreducing or reducing sample buffer. SDS-PAGE analysis was performed according to a standard procedure. After the run, gels were dried and exposed to autoradiography film (Amersham Pharmacia Biotech) for 2–5 d.
Measurement of Cytosolic Calcium Concentrations ([Ca2+]i).
PDCs, U937 cells, and BDCA-2–transfected U937 cells were loaded with Indo-1 AM (Sigma-Aldrich) as described (44). In stimulation experiments, anti–BDCA-2 mAb (AC144, IgG1) was added to PDCs, U937 cells, and BDCA-2–transfected U937 cells, respectively, followed by F(ab′)2 goat anti–mouse IgG (Milan Analytica) as cross-linker. Cells were then analyzed on a flow cytofluorimeter (FACSVantage™; Becton Dickinson) to detect Ca2+ fluxes. Only live (based on forward scatter criteria) and Indo-1–loaded cells (based on 405 nM versus 525 nM emission spectra) were included in the analysis. To test whether a [Ca2+]i increase was dependent on extracellular Ca2+, cells were stimulated in buffer with excess EGTA (4 mM). To test whether a [Ca2+]i increase was dependent on src-family protein-tyrosine kinases, cells were preincubated for 40 min with 20 μg/ml PP2 (Calbiochem).
Western Blotting.
For anti-phosphotyrosine blots, PDCs, BDCA-2–transfected U937 cells, and BDCA-2–transfected Jurkat cells (106) were incubated for 2 min at 37°C with medium or with anti–BDCA-2 mAb (AC144, IgG1). Cells were washed in ice-cold PBS and lysed in Laemmli protein sample buffer (0.06 M Tris-HCl, pH 6.8, 2% SDS, 10% glycerine, 0.005% bromphenol blue). Cell lysates were sonicated, boiled, separated by SDS-PAGE, transferred to nitrocellulose, and probed with horseradish peroxidase (HRP)-coupled anti-phosphotyrosine mAb PY20 (100 ng/ml; Becton Dickinson). Immunoblotted proteins were visualized by chemiluminescence using enhanced chemiluminescence detection reagents (Amersham Pharmacia Biotech).
Ag Presentation Assay.
30,000 cells of the B13 T cell clone (45) were cocultured with (a) 37,000, (b) 18,500, (c) 9,250, (d) 4,625, (e) 2,312, and (f) 1,156 irradiated PDCs (3,000 rad) in 96-well flat-bottom microplates in the presence of 200 ng/ml of IgG1 mAb. mAb used in the assay were the following: anti–BDCA-2 (AC144, IgG1), anti–ILT3 (ZM3.8, IgG1), and anti-cytokeratin (CK3–11D5, IgG1). After 48 h, the cultures were pulsed with [3H]thymidine (1 μCi/well, specific activity 5 Ci/mmol), and the radioactivity incorporated was measured after additional 16 h.
In Vitro Stimulation of PDCs.
Purified PDCs were cultured at a cell density of 5 × 10⁵ to 106 cells/ml in medium (RPMI 1640 supplemented with 2 mM L-glutamine, 10% FCS, 110 mg/liter sodium pyruvate, 100 U/ml penicillin, and 100 μg/ml streptomycin) at 37°C in a humidified 5% CO2-containing atmosphere in the presence of 10 ng/ml IL-3 (PeproTech) for 24 h. One of the following agents was typically added for induction of IFN-α/β expression: (a) influenza A/PR8 virus (FLU, used at a final concentration of 5 hemagglutinating units/ml), (b) anti–single-stranded (ss) and double-stranded (ds) DNA mAb MER-3 (Serotec; dialyzed against RPMI 1640 and used at a final concentration of 2.5 μg/ml) plus plasmid pcDNA3 (used at a final concentration 0.5 μg/ml), (c) sera from SLE patients (provided by Falk Hiepe, Charite, Medical School of the Humboldt University, Berlin, Germany, and used at a final dilution of 1/5), (d) CpG oligonucleotides (AAC-30 and GAC-30; reference 14), and (e) OK432, an immunomodulator derived from the Su strain of Streptococcus pyogenes. To test the effect of triggering of BDCA-2 on the induction of IFN-α/β expression, anti–BDCA-2 mAb (AC144, IgG1) was added at a final concentration of 5 μg/ml.
ELISA.
The levels of IFN-α in culture supernatants were determined by an ELISA kit (R&D Systems).
Results
BDCA-2 Is a Type II C-type Lectin.
We used transient expression cloning in COS1 cells to identify BDCA-2, the molecule recognized by the PDC-specific mAb AC144 (19). A full-length 1,313 bp cDNA sequence was isolated after transfection of COS1 cells with a cDNA library prepared from purified PDCs. The cDNA contains a 491 bp 5′ UTR, a 642 bp open reading frame, a 3′ UTR of 150 nucleotides, and a poly(A) tail of 30 bp (GenBank/EMBL/DDBJ accession no. AF293615). The open reading frame predicts a novel polypeptide of 213 amino acids (Fig. 1) with a molecular mass of 25.021 kD. The presence of a hydrophobic signal anchor (residues 22–41) indicates a type II transmembrane protein. BDCA-2 belongs to the Ca2+-dependent (C-type) lectin family with a single carbohydrate recognition domain (CRD; Fig. 1) featuring a glutamate-proline-asparagine (EPN) motif (position 172–174) predicting mannose-type specificity (46). Three potential N-glycosylation sites are present at positions 110–113, 137–140, and 164–167 amino acids, respectively. Finally, BDCA-2 contains an intracellular domain of 21 amino acids without any known motif implicated in signal transduction.
Figure 1.

Amino acid sequence alignment of the type II C-type lectins BDCA-2, murine dectin-2, and human DCIR. Identical or conserved residues are indicated by (*), conserved and semiconserved substitutions by (:) and (.), respectively; the putative transmembrane domains are shown in red italics; the shaded area denotes the CRD and the residues strongly conserved among C-type lectins are shown in bold type (H, hydrophobic; A, aliphatic; C, cysteine; G, glycine; E, glutamic acid; W, tryptophan; Δ, aromatic; +, involved in calcium-dependent binding of carbohydrate; +P++, so-called EPN-motif predicting mannose-type specificity [reference 46]).
Amino acid sequence comparison in the GenBank and EMBL databases revealed marked homology between BDCA-2 and several type II C-type lectins, especially in the CRD. BDCA-2 displays highest homology with murine dectin-2 (50.7% amino acid identity in the overall sequence; reference 41) and human DCIR (42.1% amino acid identity in the overall sequence; reference 42; Fig. 1).
Genomic Structure and Chromosomal Localization of the Human BDCA-2 Gene.
Due to complete nucleotide sequence identity over seven stretches between the BDCA-2–encoding cDNA and sequences of genomic DNA fragments present in the Genbank database (GenBank/EMBL/DDBJ accession no. AC006517: clone RP11–277J24, working draft sequence, 21 unordered pieces), the human BDCA-2 gene could be mapped to the short arm of chromosome 12. Furthermore, by analyzing the ends of the seven sequence identity stretches (the putative exon-intron boundaries) for the presence of conserved splice donor (5′(C/A)AG-GU(A/G)AGU) and acceptor sites (5′(U/C)11N(U/C)AG-(G/A)) (47), and by sequencing a series of truncated BDCA-2 mRNA species (see below), the number of exons in the full-length BDCA-2 mRNA as well as the precise positions of intron excisions, could be deduced. The full-length BDCA-2 mRNA consists of seven exons, with exon 1 (1–361 bp) representing most of the 5′ UTR, exon 2 (362–522 bp) encoding 10 amino acids of the cytoplasmic domain, exon 3 (523–615 bp) encoding 31 amino acids mainly in the transmembrane domain, exon 4 (616–726 bp) encoding 37 amino acids mainly in the neck domain, exon 5 (727–872 bp) encoding 49 amino acids mainly in the CRD, exon 6 (873–988 bp) encoding 39 bp in the CRD, and exon 7 (989–1283 bp) encoding 47 bp in the CRD. The overall exon-intron organization of BDCA-2 and dectin-2 (41) are virtually identical, suggesting that dectin-2 may indeed represent the murine homologue of human BDCA-2 rather than the homologue of any other human C-type lectin.
BDCA-2 Is Selectively Expressed in PDCs.
Using first-strand cDNA from multiple tissues and blood leukocyte populations for analyzing BDCA-2 mRNA expression by PCR (34 cycles, forward primer in the 5′UTR and a reverse primer in the 3′UTR), BDCA-2 transcripts were easily detectable in purified PDCs, but not detectable in all other tested blood leukocyte populations, including CD11c+ myeloid DCs, and in all tested tissues (Fig. 2). This finding provides evidence that other cells than PDCs most likely do not express BDCA-2 mRNA. On the other hand, this finding also raises the question of whether PDCs in tissues do not express BDCA-2 or whether the PCR analysis has not been sensitive enough to detect PDC-derived BDCA-2 mRNA in first-strand cDNA from whole tissues. To further analyze this, four more PCR cycles (38 instead of 34) were used for PCR amplification of BDCA-2 mRNA. Indeed, using four more PCR cycles, weak BDCA-2 mRNA signals were also detectable in some but not all tissues (tonsil, bone marrow, pancreas, testis, and ovary; data not shown). To analyze to which degree BDCA-2 mRNA expression in these tissues might be attributable to presence of BDCA-2–expressing PDCs, sections from several tissues were stained with anti–BDCA-2 mAb. Double-staining of sections from tonsils for BDCA-2 (green) and CD8, CD20, CD123, or HLA-DR (red), respectively, revealed that BDCA-2 expression is completely restricted to CD123+HLA-DR+CD8−CD20− PDCs. In fact, confirming previous observations about the localization of PDCs in tonsils (18), BDCA-2+CD123+HLA-DR+CD8−CD20− PDCs were found in the T cell–rich extrafollicular areas but not within germinal centers (Fig. 3). Anti–BDCA-2 mAb also strongly labeled large clusters of CD123+ PDCs occurring in reactive LN (data not shown). Interestingly, whereas most if not all PDCs in tonsils and LNs were found to coexpress BDCA-2 and CD123, high endothelial venules (HEVs) were CD123+, but completely negative for BDCA-2 (Fig. 2). Similarly, by immunohistochemical staining of serial sections of normal human thymus, PDCs in thymus were also found to coexpress BDCA-2 and CD123. However, it should be noted that anti–BDCA-2 mAb also stained a considerable proportion of cortical thymocytes, whereas CD123 was totally negative on these cells (data not shown). Whether this is due to some cross-reactivity of anti–BDCA-2 mAb AC144 with molecules on cortical thymocytes or whether positive staining indeed reflects BDCA-2 expression on cortical thymocytes is currently under investigation. Immunohistochemical analysis of testis obtained from patients with seminoma clearly shows that neoplastic and normal epithelium are not stained for BDCA-2, but BDCA-2+CD123+ cells displaying a PDC morphology are regularly detectable in association with lymphoid aggregates, that typically occur in this tumor. As commercial first-strand cDNA is not necessarily derived from tissue of healthy donors, this indicates that the presence of BDCA-2 mRNA in the commercial first-strand cDNA from testis (obtained from CLONTECH Laboratories, Inc.) may be attributable to the presence of infiltrating PDCs, rather than attributable to BDCA-2 mRNA expression by normal testis tissue. The same might also be true for pancreas, ovary, and bone marrow.
Figure 2.

Expression analysis of BDCA-2 mRNA by RT-PCR (34 PCR-cycles) on various tissues and cell populations (1, heart; 2, brain; 3, placenta; 4, lung; 5, liver; 6, skeletal muscle; 7, kidney; 8, pancreas; 9, spleen; 10, thymus; 11, testis; 12, ovary; 13, small intestine; 14, LN; 15, bone marrow; 16, fetal liver; 17, tonsil; 18, T cells; 19, B cells; 20, NK cells; 21, monocytes; 22, CD11cbrightCD123low myeloid DCs (reference 19); 23, CD11c−CD123bright PDCs). All cDNAs were normalized using four housekeeping genes including glyceraldehyde 3-phosphate dehydrogenase (G3PDH).
Figure 3.
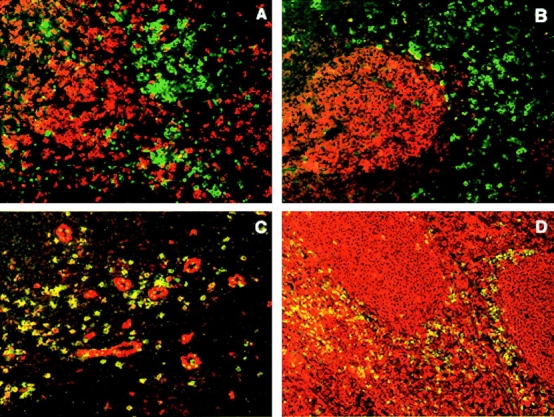
Anatomical localization of BDCA-2–expressing PDCs in inflamed tonsils. Fluorescent double staining with FITC–conjugated (green) anti–BDCA-2 mAb and Texas Red–conjugated (red) CD8 mAb (A), CD20 mAb (B), CD123 mAb (C), and anti–HLA-DR mAb (D). Note that BDCA-2–expressing PDCs are found in the T cell-rich extrafollicular areas but not within the germinal center. Like CD123, BDCA-2 is expressed on PDCs, but unlike CD123, BDCA-2 is not expressed on HEVs. One representative experiment of three is shown.
Identification of Truncated BDCA-2 Transcripts Probably Generated by Alternative Splicing.
We detected some size heterogeneity among the PCR-amplified BDCA-2 transcripts. Apart from a band of ∼750 bp (full-length BDCA-2 mRNA), at least four additional bands of smaller size were detected (Fig. 4), suggesting the presence of different BDCA-2 mRNA species. This possibility was tested by cloning and sequencing of PCR-amplified BDCA-2 mRNA. At least five truncated BDCA-2 mRNA species that probably represent splice variants were identified (Fig. 4). These are variants lacking (a) exon 3, (b) exon 4, (c) exon 5 (d) exon 3 and 4, and (e) exon 3 and 5. If translated, these putative splice variants would give rise to isoforms of BDCA-2 lacking (a) the transmembrane domain, (b) the neck domain, (c) the whole CRD (lack of exon 5 results in a frame shift which produces a termination codon in exon 6), (d) the transmembrane as well as the neck domain, and (e) the transmembrane as well as the whole CRD.
Apparent Molecular Mass of BDCA-2.
To define the biochemical characteristics of BDCA-2, we performed immunoprecipitations from 125I surface-labeled PDCs and BDCA-2–transfected U937 cells. A prominent band of ∼38 kD was detected in all BDCA-2+ cells under nonreducing and reducing conditions (Fig. 5). The difference between the apparent molecular weight and the molecular mass predicted from the full-length amino acid sequence (25.021 kD), most likely results from N-glycosylation at the N-glycosylation sites (see above). The presence of at least one (PDCs and BDCA-2–transfected U937 cells) or even of two (only PDCs) additional less prominent bands of ∼85 kD and ∼45 kD, respectively, under nonreducing and reducing conditions, could be due to formation of SDS-stable dimers (85-kD band), differential glycosylation or the presence of coimmunoprecipitated adaptor proteins.
Figure 5.

SDS-PAGE analysis of BDCA-2 immunoprecipitated from 125I-labeled PDC (A) and BDCA-2–transfected U937 human monocytoid leukemia cells (B). BDCA-2 appears as a ∼38 kD band under nonreducing (NR) and reducing (R) conditions. IC, isotype-matched control mAb. One representative experiment of three is shown.
Intracellular Calcium Mobilization after Anti–BDCA-2 mAb Labeling.
The possibility that anti–BDCA-2 mAb labeling of PDCs results in signal trunsduction was first addressed by measuring cytosolic calcium concentrations ([Ca2+]i) in PDCs and BDCA-2–transfected U937 and Jurkat cells before and after anti–BDCA-2 mAb labeling. As shown in Fig. 6 B, ligation of surface BDCA-2 with a specific mAb followed by a secondary cross-linking Ab elicited a rapid and transient rise in [Ca2+]i in PDCs and BDCA-2–transfected U937 cells, but not in BDCA-2–transfected Jurkat cells (data not shown) and nontransfected U937 cells. This [Ca2+]i increase was not affected when extracellular calcium was chelated with excess EGTA (Fig. 6 C), indicating that the [Ca2+]i increase is due to intracellular calcium release. Interestingly, the [Ca2+]i increase was much less pronounced when src-family protein-tyrosine kinases were blocked by preincubation with the specific inhibitor PP2 (Fig. 6 D).
Figure 6.

A rapid and transient rise in [Ca2+]i is induced in PDCs (left dotplots) and BDCA-2-transfected U937 cells (middle dotplots), but not in nontransfected U937 cells (right dotplots) after ligation of surface BDCA-2 with specific primary mAb (AC144, IgG1) and secondary cross-linking F(ab′)2 goat anti–mouse IgG (B). This [Ca2+]i increase is not affected when extracellular calcium is chelated with excess EGTA (C), but inhibited when src-family protein-tyrosine kinases are blocked by preincubation with the specific inhibitor PP2 (D). One representative experiment of six is shown.
Protein-Tyrosine Phosphorylation after Ligation of BDCA-2 with Specific mAb.
To test whether intracellular calcium mobilization was paralleled by protein-tyrosine phosphorylation, we performed antiphosphotyrosine immunoblotting on whole cell lysates of purified PDCs, BDCA-2–transfected U937 cells, and BDCA-2–transfected Jurkat cells before and after stimulation with anti–BDCA-2 mAb. As shown in Fig. 7, PDCs and BDCA-2 transfected U937 cells triggered via BDCA-2 displayed a substantial increase in overall protein-tyrosine phosphorylation, as compared with nonstimulated PDCs and BDCA-2–transfected U937 cells, respectively. Like the [Ca2+]i (see above), overall protein-tyrosine phosphorylation is not at all affected by BDCA-2 triggering in BDCA-2–transfected Jurkat cells. This is definitely not due to lack of surface expression of BDCA-2 in Jurkat cells, but may rather be due to lack of an adaptor protein functioning in BDCA-2 signal transduction.
Figure 7.

Triggering of BDCA-2 induces protein tyrosine phosphorylation in purified PDCs (A) and BDCA-2 transfected U937 cells (B), but not in BDCA-2–transfected Jurkat cells (C). Cells were incubated with medium alone (−) or with anti–BDCA-2 mAb (AC144, IgG1) (+). Cell lysates were size-fractionated by SDS-PAGE, transferred to nitrocellulose membranes, and probed with horseradish peroxidase-coupled antiphosphotyrosine mAb PY20. One representative experiment of two is shown.
BDCA-2 on PDCs Is Able to Rapidly Internalize and Deliver Anti–BDCA-2 mAb into an Ag-processing Compartment.
We have previously shown that labeling of BDCA-2 on PDCs by anti–BDCA-2 mAb and incubation at 37°C induces rapid internalization of the Ag–mAb complex (19). Interestingly, the same is not true for BDCA-2–transfected U937 and Jurkat cells. When BDCA-2–transfected U937 and Jurkat cells were labeled with FITC-conjugated anti BDCA-2 mAb AC144 (IgG1) and incubated for various periods of time at 37°C to allow internalization, the amount of AC144 mAb remaining on the cell surface as determined by staining with PE-conjugated rat anti–mouse IgG1 mAb did not decrease over time but remained constant (data not shown).
To further investigate a possible role of BDCA-2 on PDCs in Ag capture and Ag presentation, we analyzed the ability of purified PDCs to present AC144 mAb to a CD4+ MHC class II–restricted T cell clone specific for a mouse IgG1-derived peptide epitope (45). As controls, an IgG1 mAb that binds to ILT3 (ZM3.8), a receptor on PDCs known to be capable of delivering its ligand to an intracellular compartment where class II loading occurs (48), and an IgG1 mAb that does not bind to surface molecules on PDCs (anti-cytokeratin mAb CK3–11D5) were used. As shown in Fig. 8, PDCs present AC144 mAb to T cells more efficiently than the anti-ILT3 mAb ZM3.8 and far more efficiently than anti-cytokeratin mAb CK3–11D5. This indicates that BDCA-2 can efficiently deliver its ligand into an Ag-processing compartment.
Figure 8.

Presentation of anti–BDCA-2 mAb (AC144, IgG1) to a T cell clone specific for mouse IgG1 by irradiated PDCs. Anti–BDCA-2 mAb AC144 (▪) is presented more efficiently than anti-ILT3 mAb ZM3.8 (▴) and far more efficiently than anti-cytokeratin mAb CK3–11D5 (•). One representative experiment of two is shown.
Ligation of BDCA-2 Inhibits Induction of IFN-α/β Expression in PDCs.
PDCs produce large amounts of IFN-α/β when stimulated in vitro with (a) viruses (3–8, 10, 21, 49, 50), (b) bacteria (51) (c) bacterial DNA (oligonucleotides) containing particular unmethylated CpG motifs (CpG-DNA) (14, 22), (d) dsRNA (poly(I:C)) (22), (e) sera from patients with SLE containing an IFN-α/β–inducing factor (most likely complexes of anti-DNA Ab and immunostimulatory hypomethylated DNA (52, 53), or (f) complexes of anti–double-stranded DNA mAb and unmethylated plasmid DNA (human anti-ss/ds DNA mAb MER-3 plus plasmid pcDNA3) mimicking the IFN-α/β–inducing factor present in sera from SLE patients (53). We tested whether in vitro induction of IFN-α/β expression in purified PDCs by FLU, anti-ss/ds DNA mAb MER-3 plus plasmid pcDNA3, and sera from SLE patients is influenced by anti–BDCA-2 mAb labeling of PDCs. As shown in Fig. 9 A, coincubation of purified PDCs with the IFN-α/β–inducing agents and anti–BDCA-2 mAb AC144 (IgG1), but not a nonbinding control IgG1 mAb, dramatically inhibited induction of IFN-α/β expression as compared with incubation of PDCs with the IFN-α/β–inducing agents alone. Similar results were obtained using CpG oligodeoxynucleotides (AAC-30 and GAC-30) and a killed streptococcal preparation (OK432) for induction of IFN-α/β expression in PDCs (data not shown). Interestingly, with most IFN-α/β–inducing agents (e.g., anti ss/ds DNA mAb MER-3 plus plasmid pcDNA3 or sera from SLE patients), we reproducibly obtained complete or nearly complete blocking of induction of IFN-α/β expression by anti–BDCA-2 mAb, whereas only partial blocking was obtained using FLU as IFN-α/β–inducing agent. Titration of the anti–BDCA-2 mAb (Fig. 9 B) reveals that concentrations below 100 ng/ml are sufficient for a 50% inhibition of the IFN-α/β response to anti-ss/ds DNA mAb MER-3 plus plasmid pcDNA3. To check whether anti–BDCA-2 mAb inhibits induction of IFN-α/β expression simply by PDC killing or by induction of PDC maturation, we comparatively analyzed total numbers of viable PDCs and expression of several leukocyte Ag (CD83, CD80, CD86, etc.) after various periods of culturing of PDCs in the presence or absence of anti–BDCA-2 mAb. No significant differences were found (data not shown).
Figure 9.

(A) Ligation of BDCA-2 suppresses induction of IFN-α/β production in PDCs. Stimulation of PDCs with FLU, anti-ss/ds DNA mAb MER-3 plus plasmid pcDNA3, or serum from a SLE patient, but not with anti-ss/ds DNA mAb MER-3 alone or plasmid pcDNA3 alone, induces production of large amounts of IFN-α/β in PDCs. Induction of IFN-α/β production with this agents can be inhibited by coincubation with anti–BDCA-2 mAb (AC144, IgG1), but not by coincubation with an isotype-matched control IgG1 mAb. The data shown are representative of more than six experiments using FLU, more than two experiments using anti-ss/ds DNA mAb MER-3 plus plasmid pcDNA3, and three experiments using SLE sera as IFN-α/β production–inducing agent. (B) Anti–BDCA-2 mAb-mediated suppression of induction of IFN-α/β production is mAb concentration dependent. Purified PDCs were coincubated with one of the IFN-α/β–inducing agents (anti-ss/ds DNA mAb MER-3 plus plasmid pcDNA3) and titrated amounts of anti–BDCA-2 mAb (AC144, IgG1). Note that concentrations below 100 ng/ml are sufficient for a 50% inhibition of the IFN-α/β response.
Discussion
DCs constitute a heterogeneous population of cells with different developmental pathways and maturation stages. While several leukocyte surface Ag, including costimulatory molecules, chemokine receptors, endocytic/phagocytic receptors, and typical DC activation/maturation Ag are differentially regulated during DC maturation (54), their expression is not restricted to DCs. Surface Ag restricted to DC subsets, such as PDCs, however, are highly valuable tools for cell monitoring in healthy volunteers and patients. We have previously demonstrated that BDCA-2 is an excellent marker for the identification of PDCs in blood (19). The present study extends this finding to lymphoid (LNs, tonsils, thymus) and nonlymphoid (testis) tissue. In line with the Ab staining data, our RT-PCR analysis also indicates a strict restriction of BDCA-2 mRNA expression to PDCs.
DCs are found to express a huge number of lectins that appear to serve quite distinct functions. Members of the C-type lectin family can be divided into two groups based on their molecular structures: (a) type I surface lectins with multiple CRD in the NH2-terminal extracellular region, and (b) type II surface lectins with a single CRD in the COOH-terminal extracellular region. DC express type I as well as type II lectins. Endocytic activity, a hallmark of receptor-mediated uptake of Ag, is exhibited by type I multi-CRD lectins, such as the macrophage-mannose receptor (MMR; reference 55) and DEC-205 (56), as well as by type II single-CRD lectins, such as CD23 (57) and Langerin (58). Langerin is specifically expressed by Langerhans cells, whereas the MMR, CD23, and DEC-205 are not specifically expressed by DCs in general or by a particular DC subset. Our data indicate that BDCA-2 is a unique endocytic type II single-CRD lectin specifically expressed in PDCs and able to target ligand into Ag processing and peptide-loading compartments for presentation to T cells.
In addition to its Ag-capturing function, BDCA-2 can mediate potent inhibition of induction of IFN-α/β expression in PDCs. Production of IFN-α/β in response to several different types of viruses (3–8, 10, 21, 50), bacteria (51), CpG-DNA (14, 22), dsRNA (22), and SLE serum (52, 53) is by far the most prominent feature of PDCs. It has recently been shown that PDCs express high amounts of toll-like receptor 9 (TLR9; reference 59) and that TLR9 confers responsiveness to CpG-DNA (60). Thus, TLR9 is a prime candidate for mediating induction of IFN-α/β expression in PDCs, but, in the light of the wide variety of IFN-α/β–inducing agents, other receptors are likely to serve the same function. Our data show that triggering of BDCA-2 can potently inhibit in vitro induction of IFN-α/β expression in PDCs by (a) viruses, (b) the combination of anti-dsDNA mAb and unmethylated plasmid DNA, (c) SLE serum, (d) CpG oligonucleotides, and (e) OK432. The diversity of IFN-α/β–inducing agents makes it anyway highly unlikely that anti–BDCA-2 mAb AC144 simply blocks binding of the IFN-α/β–inducing agents to PDCs, but this can also be ruled out by the fact that induction of IFN-α/β expression is also suppressed if the IFN-α/β–inducing agent is added 1 h before the anti–BDCA-2 mAb (data not shown).
SLE patients have increased levels of IFN-α/β in the circulation and increased production of IFN-α/β may well be of pathogenic significance in SLE (61–63). This is strongly supported by the observation that IFN-α/β therapy of patients with nonautoimmune diseases occasionally induces the development of Ab against dsDNA and SLE-like syndromes (64-67). PDCs have been proposed to be a major source of IFN-α/β in SLE (52), but the observation that SLE patients have a reduced number of PDCs in peripheral blood (68) seemed to contradict this hypothesis. However, recent studies by Farkas et al. (35) and Blomberg et al. (34) have demonstrated accumulation of PDCs in cutaneous SLE lesions. This indicates that the low numbers of PDC in blood are due to their increased recruitment to tissues. Furthermore, by showing that the density of PDCs in affected skin correlated well with the number of cells expressing the IFN-α/β–inducible protein MxA, Farkas et al. (35) provided strong evidence that PDCs are indeed a major source of IFN-α/β in SLE. Based on our in vitro results it appears reasonable to evaluate a novel strategy for inhibiting IFN-α/β production by PDCs in SLE patients, namely by means of in vivo administration of anti–BDCA-2 mAb.
BDCA-2 showed the highest degree of homology to murine dectin-2 (50.7% amino acid identity in the overall sequence; reference 41) and to human DCIR (42.1% amino acid identity in the overall sequence; reference 42). BDCA-2 and dectin-2 differ from DCIR in that the immunoreceptor tyrosine-based inhibitory motif (ITIM) found in the intracellular domain of DCIR was absent from the relatively short intracellular domains of dectin-2 (14 amino acids) and BDCA-2 (21 amino acids). The intracellular domains of BDCA-2 and dectin-2 also lack an immunoreceptor tyrosine based activation motif (ITAM) and any other known motif implicated in signal transduction. Based upon these observations, Ariizumi et al. (41) concluded that dectin-2 has no signaling potential. We found that triggering of BDCA-2 induces src-family protein-tyrosine kinase–dependent intracellular calcium mobilization and protein-tyrosine phosphorylation of intracellular proteins. Thus, though no apparent signaling motif is present in the intracellular domain of BDCA-2, BDCA-2 clearly is a signaling receptor that activates protein-tyrosine kinases. Previous studies on the regulation of IFN-α/β production in PDCs indicate that activation of protein kinases may play a direct role in the BDCA-2–mediated inhibition of IFN-α/β induction (69, 70). It remains to be analyzed whether signaling is accomplished by the pairing of BDCA-2 with a signaling membrane adaptor molecule, such as DAP12. DAP12 associates noncovalently with a large number of receptors in natural killer and myeloid cells, including several membrane glycoproteins of the C-type lectin superfamily. All associations are based on the presence of a negatively charged residue in the transmembrane domain of DAP12 and a positive charge in the transmembrane domain of the receptor (71, 72). As positively charged amino acid residues are not present in the transmembrane domain of BDCA-2, it is rather unlikely that DAP12 itself associates with BDCA-2.
Unfortunately, no information is currently available on the natural ligands and the carbohydrate specificities of DCIR, dectin-2, and BDCA-2. In fact, a His-tagged recombinant protein containing the extracellular domain of dectin-2 showed no specific binding to any of a panel of carbohydrate probes (41). Future studies are required to identify the ligand(s) of BDCA-2.
In this context, it may also be worth mentioning that at least five different truncated BDCA-2 transcripts, which are most likely generated by alternative splicing, have been identified. If these truncated BDCA-2 transcripts are translated, all of them completely lack one or two structural components: the transmembrane domain alone, the neck domain alone, the CRD alone, the transmembrane domain and the neck domain, or the transmembrane domain and the CRD. Two truncated isoforms have also been identified for dectin-2, one with a 34 amino acids deletion in the neck domain and one with a 41 amino acids deletion within the CRD (41). Isoforms lacking the transmembrane domain might serve as soluble receptors controlling membrane-bound receptor-mediated functions.
In conclusion, in this study, we report the molecular cloning and functional characterization of BDCA-2, a novel lectin specifically expressed by PDCs. Remarkably, BDCA-2 is a PDC-specific transmembrane lectin that appears to display a dual function of Ag-capturing and potent inhibition of IFN-α/β induction. As production of IFN-α/β by PDCs has been implicated to play an important role in innate antiviral immunity (21) and Th1 polarization (20), triggering of BDCA-2 may be critical for skewing T cell responses toward a non-Th1 type of response and enable viruses to escape from the host immune defense.
Acknowledgments
We are grateful to Falk Hiepe and Andreas Thiel for generous gifts of SLE sera, and to Norimitsu Kadowaki for providing CpG oligodeoxynucleotides. We thank Daniela Bubalo, Sabine Cremer, Silvana Festa, and Tanja Conrads for expert technical assistance.
A. Dzionek, Y. Sohma, and J. Nagafune contributed equally to this work.
Y. Yamaguchi and J. Schmitz share senior authorship for this work.
Footnotes
*
Abbreviations used in this paper: CRD, carbohydrate recognition domain; DC, dendritic cell; DCIR, human DC immunoreceptor; dectin-2, DC-associated C-type lectin 2; ds, double-stranded; FLU, influenza A/PR8 virus; PDC, plasmacytoid dendritic cell; RT, reverse transcription; SLE, systemic lupus erythematosus; ss, single-stranded; TBE, Tris-borate-EDTA; TLR9, toll-like receptor 9.
References
- 1.Vollenweider, R., and K. Lennert. 1983. Plasmacytoid T-cell clusters in non-specific lymphadenitis. Virchows Arch. 44:1–14. [DOI] [PubMed] [Google Scholar]
- 2.Facchetti, F., C. de Wolf-Peeters, D.Y. Mason, K. Pulford, J.J. van den Oord, and V.J. Desmet. 1988. Plasmacytoid T cells: immunohistochemical evidence for their monocyte/macrophage origin. Am. J. Pathol. 133:15–21. [PMC free article] [PubMed] [Google Scholar]
- 3.Perussia, B., V. Fanning, and G. Trinchieri. 1985. A leukocyte subset bearing HLA-DR antigens is responsible for in vitro alpha interferon production in response to viruses. Nat. Immun. Cell Growth Regul. 4:120–137. [PubMed] [Google Scholar]
- 4.Chehimi, J., S.E. Starr, H. Kawashima, D.S. Miller, G. Trinchieri, B. Perussia, and S. Bandyopadhyay. 1989. Dendritic cells and IFN-alpha-producing cells are two functionally distinct non-B, non-monocytic HLA-DR+ cell subsets in human peripheral blood. Immunology. 68:488–490. [PMC free article] [PubMed] [Google Scholar]
- 5.Fitzgerald-Bocarsly, P., M. Feldman, M. Mendelsohn, S. Curl, and C. Lopez. 1988. Human mononuclear cells which produce interferon-alpha during NK(HSV-FS) assays are HLA-DR positive cells distinct from cytolytic natural killer effectors. J. Leukoc. Biol. 43:323–334. [DOI] [PubMed] [Google Scholar]
- 6.Feldman, M., and P. Fitzgerald-Bocarsly. 1990. Sequential enrichment and immunocytochemical visualization of human interferon-alpha-producing cells. J. Interferon Res. 10:435–446. [DOI] [PubMed] [Google Scholar]
- 7.Fitzgerald-Bocarsly, P. 1993. Human natural interferon-alpha producing cells. Pharmacol. Ther. 60:39–62. [DOI] [PMC free article] [PubMed] [Google Scholar]
- 8.Siegal, F.P., N. Kadowaki, M. Shodell, P.A. Fitzgerald-Bocarsly, K. Shah, S. Ho, S. Antonenko, and Y.J. Liu. 1999. The nature of the principal type 1 interferon-producing cells in human blood. Science. 284:1835–1837. [DOI] [PubMed] [Google Scholar]
- 9.Svensson, H., A. Johannisson, T. Nikkila, G.V. Alm, and B. Cederblad. 1996. The cell surface phenotype of human natural interferon-alpha producing cells as determined by flow cytometry. Scand. J. Immunol. 44:164–172. [DOI] [PubMed] [Google Scholar]
- 10.Cella, M., D. Jarrossay, F. Facchetti, O. Alebardi, H. Nakajima, A. Lanzavecchia, and M. Colonna. 1999. Plasmacytoid monocytes migrate to inflamed lymph nodes and produce large amounts of type I interferon. Nat. Med. 5:919–923. [DOI] [PubMed] [Google Scholar]
- 11.Rissoan, M.C., V. Soumelis, N. Kadowaki, G. Grouard, F. Briere, R. de Waal Malefyt, and Y.J. Liu. 1999. Reciprocal control of T helper cell and dendritic cell differentiation. Science. 283:1183–1186. [DOI] [PubMed] [Google Scholar]
- 12.Spits, H., F. Couwenberg, A.Q. Bakker, K. Weijer, and C.H. Uittenbogaart. 2000. Id2 and Id3 inhibit development of CD34+ stem cells into predendritic cell (pre-DC)2 but not into pre-DC1. Evidence for a lymphoid origin of pre-DC2. J. Exp. Med. 192:1775–1784. [DOI] [PMC free article] [PubMed] [Google Scholar]
- 13.Blom, B., S. Ho, S. Antonenko, and Y.J. Liu. 2000. Generation of interferon alpha-producing predendritic cell (pre-DC)2 from human CD34+ hematopoietic stem cells. J. Exp. Med. 192:1785–1796. [DOI] [PMC free article] [PubMed] [Google Scholar]
- 14.Kadowaki, N., S. Antonenko, and Y.J. Liu. 2001. Distinct CpG DNA and polyinosinic-polycytidylic acid double-stranded rna, respectively, stimulate CD11c(-) type 2 dendritic cell precursors and CD11c(+) dendritic cells to produce type I IFN. J. Immunol. 166:2291–2295. [DOI] [PubMed] [Google Scholar]
- 15.Ito, T., R. Amakawa, M. Inaba, S. Ikehara, K. Inaba, and S. Fukuhara. 2001. Differential regulation of human blood dendritic cell subsets by ifns. J. Immunol. 166:2961–2969. [DOI] [PubMed] [Google Scholar]
- 16.Ito, T., M. Inaba, K. Inaba, J. Toki, S. Sogo, T. Iguchi, Y. Adachi, K. Yamaguchi, R. Amakawa, J. Valladeau, et al. 1999. A CD1a+/CD11c+ subset of human blood dendritic cells is a direct precursor of Langerhans cells. J. Immunol. 163:1409–1419. [PubMed] [Google Scholar]
- 17.Kohrgruber, N., N. Halanek, M. Groger, D. Winter, K. Rappersberger, M. Schmitt-Egenolf, G. Stingl, and D. Maurer. 1999. Survival, maturation, and function of CD11c− and CD11c+ peripheral blood dendritic cells are differentially regulated by cytokines. J. Immunol. 163:3250–3259. [PubMed] [Google Scholar]
- 18.Grouard, G., M.C. Rissoan, L. Filgueira, I. Durand, J. Banchereau, and Y.J. Liu. 1997. The enigmatic plasmacytoid T cells develop into dendritic cells with interleukin (IL)-3 and CD40-ligand. J. Exp. Med. 185:1101–1111. [DOI] [PMC free article] [PubMed] [Google Scholar]
- 19.Dzionek, A., A. Fuchs, P. Schmidt, S. Cremer, M. Zysk, S. Miltenyi, D.W. Buck, and J. Schmitz. 2000. BDCA-2, BDCA-3, and BDCA-4: three markers for distinct subsets of dendritic cells in human peripheral blood. J. Immunol. 165:6037–6046. [DOI] [PubMed] [Google Scholar]
- 20.Cella, M., F. Facchetti, A. Lanzavecchia, and M. Colonna. 2000. Plasmacytoid dendritic cells activated by influenza virus and CD40L drive a potent TH1 polarization. Nat. Immunol. 1:305–310. [DOI] [PubMed] [Google Scholar]
- 21.Kadowaki, N., S. Antonenko, J.Y. Lau, and Y.J. Liu. 2000. Natural interferon alpha/beta-producing cells link innate and adaptive immunity. J. Exp. Med. 192:219–226. [DOI] [PMC free article] [PubMed] [Google Scholar]
- 22.Bauer, M., V. Redecke, J.W. Ellwart, B. Scherer, J.P. Kremer, H. Wagner, and G.B. Lipford. 2001. Bacterial CpG-DNA triggers activation and maturation of human CD11c−, CD123+ dendritic cells. J. Immunol. 166:5000–5007. [DOI] [PubMed] [Google Scholar]
- 23.Facchetti, F., C. De Wolf-Peeters, J.J. van den Oord, R. De vos, and V.J. Desmet. 1988. Plasmacytoid T cells: a cell population normally present in the reactive lymph node. An immunohistochemical and electronmicroscopic study. Hum. Pathol. 19:1085–1092. [DOI] [PubMed] [Google Scholar]
- 24.Olweus, J., A. BitMansour, R. Warnke, P.A. Thompson, J. Carballido, L.J. Picker, and F. Lund Johansen. 1997. Dendritic cell ontogeny: a human dendritic cell lineage of myeloid origin. Proc. Natl. Acad. Sci. USA. 94:12551–12556. [DOI] [PMC free article] [PubMed] [Google Scholar]
- 25.O'Doherty, U., M. Peng, S. Gezelter, W.J. Swiggard, M. Betjes, N. Bhardwaj, and R.M. Steinman. 1994. Human blood contains two subsets of dendritic cells, one immunologically mature and the other immature. Immunology. 82:487–493. [PMC free article] [PubMed] [Google Scholar]
- 26.Strobl, H., C. Scheinecker, E. Riedl, B. Csmarits, C. Bello-Fernandez, W.F. Pickl, O. Majdic, and W. Knapp. 1998. Identification of CD68+lin− peripheral blood cells with dendritic precursor characteristics. J. Immunol. 161:740–748. [PubMed] [Google Scholar]
- 27.Robinson, S.A., S. Patterson, N. English, D. Davies, S.C. Knight, and C.D.L. Reid. 1999. Human peripheral blood contains two lineages of dendritic cells. Eur. J. Immunol. 29:2769–2778. [DOI] [PubMed] [Google Scholar]
- 28.Sorg, R.V., G. Kogler, and P. Wernet. 1999. Identification of cord blood dendritic cells as an immature CD11c− population. Blood. 93:2302–2307. [PubMed] [Google Scholar]
- 29.Res, P.C., F. Couwenberg, F.A. Vyth-Dreese, and H. Spits. 1999. Expression of pTalpha mRNA in a committed dendritic cell precursor in the human thymus. Blood. 94:2647–2657. [PubMed] [Google Scholar]
- 30.Vandenabeele, S., H. Hochrein, N. Mavaddat, K. Winkel, and K. Shortman. 2001. Human thymus contains 2 distinct dendritic cell populations. Blood. 97:1733–1741. [DOI] [PubMed] [Google Scholar]
- 31.Bendriss-Vermare, N., C. Barthelemy, I. Durand, C. Bruand, C. Dezutter-Dambuyant, N. Moulian, S. Berrih-Aknin, C. Caux, G. Trinchieri, and F. Briere. 2001. Human thymus contains IFN-alpha-producing CD11c(−), myeloid CD11c(+), and mature interdigitating dendritic cells. J. Clin. Invest. 107:835–844. [DOI] [PMC free article] [PubMed] [Google Scholar]
- 32.Facchetti, F., C. De Wolf Peeters, R. De Vos, J.J. Van Den Oord, K.A.F. Pulford, and V.J. Desmet. 1989. Plasmacytoid monocytes (so-called plasmacytoid T cells) in granulomatous lymphadenitis. Hum. Pathol. 20:588–593. [DOI] [PubMed] [Google Scholar]
- 33.Feller, A.C., K. Lennert, H. Stein, H.D. Bruhn, and H.H. Wuthe. 1983. Immunohistology and aetiology of histiocytic necrotizing lymphadenitis. Report of three instructive cases. Histopathology. 7:825–839. [DOI] [PubMed] [Google Scholar]
- 34.Blomberg, S., M.L. Eloranta, B. Cederblad, K. Nordlin, G.V. Alm, and L. Ronnblom. 2001. Presence of cutaneous interferon-alpha producing cells in patients with systemic lupus erythematosus. Lupus. 10:484–490. [DOI] [PubMed] [Google Scholar]
- 35.Farkas, L., K. Beiske, F. Lund-Johansen, P. Brandtzaeg, and F.L. Jahnsen. 2001. Plasmacytoid dendritic cells (natural interferon- alpha/beta-producing cells) accumulate in cutaneous lupus erythematosus lesions. Am. J. Pathol. 159:237–243. [DOI] [PMC free article] [PubMed] [Google Scholar]
- 36.Facchetti, F., G. Boden, C. De Wolf Peeters, R. Vandaele, H. Degreef, and V.J. Desmet. 1990. Plasmacytoid monocytes in Jessner's lymphocytic infiltration of the skin. Am. J. Dermatopathol. 12:363–369. [DOI] [PubMed] [Google Scholar]
- 37.Facchetti, F., D. Marocolo, M.L. Morassi, V. Villanacci, and P.G. Grigolato. 1991. Cutaneous Kikuchi's disease. Am. J. Surg. Pathol. 15:1012–1014. [DOI] [PubMed] [Google Scholar]
- 38.Jahnsen, F.L., F. Lund-Johansen, J.F. Dunne, L. Farkas, R. Haye, and P. Brandtzaeg. 2000. Experimentally induced recruitment of plasmacytoid (CD123high) dendritic cells in human nasal allergy. J. Immunol. 165:4062–4068. [DOI] [PubMed] [Google Scholar]
- 39.Pashenkov, M., Y.M. Huang, V. Kostulas, M. Haglund, M. Soderstrom, and H. Link. 2001. Two subsets of dendritic cells are present in human cerebrospinal fluid. Brain. 124:480–492. [DOI] [PubMed] [Google Scholar]
- 40.Ohashi, H., K. Maruyama, Y.C. Liu, and A. Yoshimura. 1994. Ligand-induced activation of chimeric receptors between the erythropoietin receptor and receptor tyrosine kinases. Proc. Natl. Acad. Sci. USA. 91:158–162. [DOI] [PMC free article] [PubMed] [Google Scholar]
- 41.Ariizumi, K., G.L. Shen, S. Shikano, R. Ritter, P. Zukas, D. Edelbaum, A. Morita, and A. Takashima. 2000. Cloning of a second dendritic cell-associated C-type lectin (dectin-2) and its alternatively spliced isoforms. J. Biol. Chem. 275:11957–11963. [DOI] [PubMed] [Google Scholar]
- 42.Bates, E.E., N. Fournier, E. Garcia, J. Valladeau, I. Durand, J.J. Pin, S.M. Zurawski, S. Patel, J.S. Abrams, S. Lebecque, et al. 1999. APCs express DCIR, a novel C-type lectin surface receptor containing an immunoreceptor tyrosine-based inhibitory motif. J. Immunol 163:1973–1983. [PubMed] [Google Scholar]
- 43.Reid, P.A., and C. Watts. 1990. Cycling of cell-surface MHC glycoproteins through primaquine-sensitive intracellular compartments. Nature. 346:655–657. [DOI] [PubMed] [Google Scholar]
- 44.Valitutti, S., M. Dessing, and A. Lanzavecchia. 1993. Role of cAMP in regulating cytotoxic T lymphocyte adhesion and motility. Eur. J. Immunol. 23:790–795. [DOI] [PubMed] [Google Scholar]
- 45.Lanzavecchia, A., S. Abrignani, D. Scheidegger, R. Obrist, B. Dorken, and G. Moldenhauer. 1988. Antibodies as antigens. The use of mouse monoclonal antibodies to focus human T cells against selected targets. J. Exp. Med. 167:345–352. [DOI] [PMC free article] [PubMed] [Google Scholar]
- 46.Weis, W.I., M.E. Taylor, and K. DrickAm. 1998. The C-type lectin superfamily in the immune system. Immunol. Rev 163:19–34. [DOI] [PubMed] [Google Scholar]
- 47.Padgett, R.A., P.J. Grabowski, M.M. Konarska, S. Seiler, and P.A. Sharp. 1986. Splicing of messenger RNA precursors. Annu. Rev. Biochem. 55:1119–1150. [DOI] [PubMed] [Google Scholar]
- 48.Cella, M., C. Dohring, J. Samaridis, M. Dessing, M. Brockhaus, A. Lanzavecchia, and M. Colonna. 1997. A novel inhibitory receptor (ILT3) expressed on monocytes, macrophages, and dendritic cells involved in antigen processing. J. Exp. Med. 185:1743–1751. [DOI] [PMC free article] [PubMed] [Google Scholar]
- 49.Gobl, A.E., K. Funa, and G.V. Alm. 1988. Different induction patterns of mRNA for IFN-alpha and -beta in human mononuclear leukocytes after in vitro stimulation with herpes simplex virus-infected fibroblasts and Sendai virus. J. Immunol. 140:3605–3609. [PubMed] [Google Scholar]
- 50.Feldman, S.B., M. Ferraro, H.M. Zheng, N. Patel, S. Gould-Fogerite, and P. Fitzgerald-Bocarsly. 1994. Viral induction of low frequency interferon-alpha producing cells. Virology. 204:1–7. [DOI] [PubMed] [Google Scholar]
- 51.Svensson, H., B. Cederblad, M. Lindahl, and G. Alm. 1996. Stimulation of natural interferon-alpha/beta-producing cells by Staphylococcus aureus. J. Interferon Cytokine Res. 16:7–16. [DOI] [PubMed] [Google Scholar]
- 52.Vallin, H., S. Blomberg, G.V. Alm, B. Cederblad, and L. Ronnblom. 1999. Patients with systemic lupus erythematosus (SLE) have a circulating inducer of interferon-alpha (IFN-alpha) production acting on leucocytes resembling immature dendritic cells. Clin. Exp. Immunol. 115:196–202. [DOI] [PMC free article] [PubMed] [Google Scholar]
- 53.Vallin, H., A. Perers, G.V. Alm, and L. Ronnblom. 1999. Anti-double-stranded DNA antibodies and immunostimulatory plasmid DNA in combination mimic the endogenous IFN-alpha inducer in systemic lupus erythematosus. J. Immunol. 163:6306–6313. [PubMed] [Google Scholar]
- 54.Banchereau, J., F. Briere, C. Caux, J. Davoust, S. Lebecque, Y.J. Liu, B. Pulendran, and K. Palucka. 2000. Immunobiology of dendritic cells. Annu. Rev. Immunol. 18:767–811. [DOI] [PubMed] [Google Scholar]
- 55.Sallusto, F., M. Cella, C. Danieli, and A. Lanzavecchia. 1995. Dendritic cells use macropinocytosis and the mannose receptor to concentrate macromolecules in the major histocompatibility complex class II compartment: downregulation by cytokines and bacterial products. J. Exp. Med. 182:389–400. [DOI] [PMC free article] [PubMed] [Google Scholar]
- 56.Jiang, W., W.J. Swiggard, C. Heufler, M. Peng, A. Mirza, R.M. Steinman, and M.C. Nussenzweig. 1995. The receptor DEC-205 expressed by dendritic cells and thymic epithelial cells is involved in antigen processing. Nature. 375:151–155. [DOI] [PubMed] [Google Scholar]
- 57.Bieber, T. 1992. Fc epsilon RII/CD23 on epidermal Langerhans' cells. Res. Immunol. 143:445–447. [DOI] [PubMed] [Google Scholar]
- 58.Valladeau, J., O. Ravel, C. Dezutter-Dambuyant, K. Moore, M. Kleijmeer, Y. Liu, V. Duvert-Frances, C. Vincent, D. Schmitt, J. Davoust, et al. 2000. Langerin, a novel c-type lectin specific to Langerhans cells, is an endocytic receptor that induces the formation of Birbeck granules. Immunity. 12:71–81. [DOI] [PubMed] [Google Scholar]
- 59.Liu, Y.J., H. Kanzler, V. Soumelis, and M. Gilliet. 2001. Dendritic cell lineage, plasticity and cross-regulation. Nat. Immunol. 2:585–589. [DOI] [PubMed] [Google Scholar]
- 60.Bauer, S., C.J. Kirschning, H. Hacker, V. Redecke, S. Hausmann, S. Akira, H. Wagner, and G.B. Lipford. 2001. Human TLR9 confers responsiveness to bacterial DNA via species-specific CpG motif recognition. Proc. Natl. Acad. Sci. USA. 98:9237–9242. [DOI] [PMC free article] [PubMed] [Google Scholar]
- 61.Strannegard, O., S. Hermodsson, and G. Westberg. 1982. Interferon and natural killer cells in systemic lupus erythematosus. Clin. Exp. Immunol. 50:246–252. [PMC free article] [PubMed] [Google Scholar]
- 62.Kim, T., Y. Kanayama, N. Negoro, M. Okamura, T. Takeda, and T. Inoue. 1987. Serum levels of interferons in patients with systemic lupus erythematosus. Clin. Exp. Immunol. 70:562–569. [PMC free article] [PubMed] [Google Scholar]
- 63.Ytterberg, S.R., and T.J. Schnitzer. 1982. Serum interferon levels in patients with systemic lupus erythematosus. Arthritis Rheum. 25:401–406. [DOI] [PubMed] [Google Scholar]
- 64.Kalkner, K.M., L. Ronnblom, A.K. Karlsson Parra, M. Bengtsson, Y. Olsson, and K. Oberg. 1998. Antibodies against double-stranded DNA and development of polymyositis during treatment with interferon. QJM. 91:393–399. [DOI] [PubMed] [Google Scholar]
- 65.Ronnblom, L.E., G.V. Alm, and K.E. Oberg. 1991. Autoimmunity after alpha-interferon therapy for malignant carcinoid tumors. Ann. Intern. Med. 115:178–183. [DOI] [PubMed] [Google Scholar]
- 66.Ronnblom, L.E., G.V. Alm, and K.E. Oberg. 1990. Possible induction of systemic lupus erythematosus by interferon-alpha treatment in a patient with a malignant carcinoid tumour. J. Intern. Med. 227:207–210. [DOI] [PubMed] [Google Scholar]
- 67.Ehrenstein, M.R., E. McSweeney, M. Swane, C.P. Worman, A.H. Goldstone, and D.A. Isenberg. 1993. Appearance of anti-DNA antibodies in patients treated with interferon-alpha. Arthritis Rheum. 36:279–280. [DOI] [PubMed] [Google Scholar]
- 68.Cederblad, B., S. Blomberg, H. Vallin, A. Perers, G.V. Alm, and L. Ronnblom. 1998. Patients with systemic lupus erythematosus have reduced numbers of circulating natural interferon-alpha-producing cells. J. Autoimmun. 11:465–470. [DOI] [PubMed] [Google Scholar]
- 69.Li, Q., M. Feldman, C. Harmon, and P. Fitzgerald-Bocarsly. 1996. Role of tyrosine kinases, protein kinase C, and protein kinase A in the regulation of interferon-alpha production induced by herpes simplex virus type 1. J. Interferon Cytokine Res. 16:109–118. [DOI] [PubMed] [Google Scholar]
- 70.Sandberg, K., M.L. Eloranta, A.E. Gobl, and G.V. Alm. 1991. Phorbol ester-mediated inhibition of IFN-alpha/beta gene transcription in blood mononuclear leukocytes. J. Immunol. 147:3116–3121. [PubMed] [Google Scholar]
- 71.Campbell, K.S., and M. Colonna. 1999. DAP12: a key accessory protein for relaying signals by natural killer cell receptors. Int. J. Biochem. Cell Biol. 31:631–636. [DOI] [PubMed] [Google Scholar]
- 72.Lanier, L.L., and A.B. Bakker. 2000. The ITAM-bearing transmembrane adaptor DAP12 in lymphoid and myeloid cell function. Immunol. Today. 21:611–614. [DOI] [PubMed] [Google Scholar]