Enhanced B Cell Expansion, Survival, and Humoral Responses by Targeting Death Receptor 6 (original) (raw)
Abstract
Targeted disruption of death receptor (DR)6 results in enhanced CD4+ T cell expansion and T helper cell type 2 differentiation after stimulation. Similar to T cells, DR6 is expressed on resting B cells but is down-regulated upon activation. We examined DR6−/− B cell responses both in vitro and in vivo_._ In vitro, DR6−/− B cells undergo increased proliferation in response to anti–immunoglobulin M, anti-CD40, and lipopolysaccharide. This hyperproliferative response was due, at least in part, to both increased cell division and reduced cell apoptosis when compared with wild-type B cells. Consistent with these observations, increased nuclear levels and activity of nuclear factor κB transcription factor, c-Rel, and elevated Bcl-xl expression were observed in DR6−/− B cells upon stimulation. In addition, DR6−/− B cells exhibited higher surface levels of CD86 upon activation and were more effective as antigen-presenting cells in an allogeneic T cell proliferation response. DR6−/− mice exhibited enhanced germinal center formation and increased titers of immunoglobulins to T-dependent as well as T-independent type I and II antigens. This is the first demonstration of a regulatory role of DR6 in the activation and function of B cells.
Keywords: hyperproliferation, TNFR superfamily, apoptosis, CD40, spleen
Introduction
Members of the TNF/TNFR family play a critical role in the regulation of inflammation and immune responses along with lymphoid tissue homeostasis (1, 2). Many TNF-related ligands and their cognate receptors induce regulatory signals in primary cells and stimulate diverse signaling pathways, including the activation of caspases, the translocation of nuclear factor (NF)*-κB, and the activation of mitogen-activated protein kinases such as c-Jun amino-terminal kinase or extracellular signal regulatory kinase (1). Consequently, several TNF/TNFR family members have been shown to be essential for both the etiology and progression of adaptive immune responses. Specifically, those involving interactions between T and B cells, such as CD40L/CD40, OX40L/OX40, and BlyS/[TACI/BCMA/BAFF-R], have been shown to contribute to the generation of an effective immune response (3–17). These investigations indicate that TNF/TNFR family member interactions can control several aspects of B cell biology including development, homeostasis, activation, and tolerance.
Members of the NF-κB transcription factor family, including c-Rel, are regulated by many TNF family members and their receptors and are essential for mitogen-induced proliferation of B cells (18–21). C-Rel–deficient B cells proliferate poorly and have survival defects after stimulation (21). C-Rel is also required for cell cycle progression of B cells (22). It has been demonstrated, however, that transgenic expression of Bcl-xL, a c-Rel gene target, can rescue c-Rel–deficient B cells from their survival defects (23). Thus, regulating the transcriptional activity of NF-κB family members is a vital step in controlling B cell functions, especially during activation.
Death receptor (DR)6 is a death domain–containing receptor within the TNFR superfamily and its expression is observed in a number of tissues, including lymphoid tissues (24–26). However, the complete physiological functions of DR6 remain unknown. Recent studies of DR6-deficient (DR6−/−) mice have demonstrated that DR6 serves as an important regulator for CD4+ T cell proliferation and Th differentiation (25, 26). However, because T and B cell interactions provide mutually beneficial signals that are conducive to a protective immune response, targeted disruption of DR6 may also have intrinsic effects on B cells and humoral immune responses.
In this study, DR6 was shown to be expressed on naive B cells from WT mice and rapidly down-regulated upon activation. The proliferation and cell division of DR6−/− B cells in response to stimulation in vitro was enhanced compared with WT B cells_._ The absence of DR6 augmented B cell functions in vivo as evidenced by increased production of Ig isotypes in response to both T cell–dependent and T cell–independent antigens. Histological analysis revealed enhanced splenic germinal center formation in DR6−/− mice after in vivo antigen challenge. In addition, DR6−/− B cells exhibited higher nuclear levels of c-Rel, increased expression of Bcl-xL, and decreased cell apoptosis upon activation compared with WT B cells. Together, these findings offer evidence that DR6 provides a regulatory mechanism for B cell activation and humoral immune responses.
Materials and Methods
Mice.
The generation and maintenance of DR6−/− mice along with WT littermates have been previously described (25). BALB/c mice (H-2d) were purchased from Harlan. All animals were kept in American Association for Accreditation of Laboratory Animal Care–accredited pathogen-free facilities and provided standard laboratory diet and water ad libitum.
B Cell Culture and Proliferation Assay.
Splenic cell suspensions were isolated from 8–10-wk-old WT and DR6−/− mice by homogenizing spleens between frosted glass slides (Fisher Scientific) and removing RBCs with ACK lysing buffer (BioWhittaker). B cells were enriched by positive selection using magnetic anti-B220 microbeads and autoMACS® magnetic cell sorter (Miltenyi Biotec). The purity of isolated B cells was subsequently analyzed by flow cytometry and found to be 93–97% B220+. Purified B cells were cultured in triplicate wells (5 × 10⁵ cells/well) of a Costar® 96-well tissue culture plate (Corning, Inc.) in RPMI 1640 medium (Invitrogen) supplemented with 2 mM l-glutamine, 25 mM Hepes, 100 U/ml penicillin, 100 μg/ml streptomycin, 5.5 × 10⁻⁵ M 2-ME, and 10% FCS (all supplements are from Invitrogen) at 37°C, 5% CO2 with or without different stimulators for 72 h. Stimulators included 5 μg/ml LPS (Escherichia coli 055:B5; Difco), 10 μg/ml anti-CD40 (HM40-3; BD Biosciences), and 20 μg/ml whole rabbit anti–mouse IgM (Zymed Laboratories). Proliferation was measured by incorporation of 1 μCi/well [3H]thymidine (ICN Biomedicals) during the last 12 h of culture using a filtermate harvester (Packard Instrument Co.) and a 1450 microbeta liquid scintillation counter (Amersham Biosciences).
Flow Cytometry.
Cell subset analysis was performed by preparing cell suspensions from RBC-lysed spleen, bone marrow (one femur), PBL, and peritoneal exudate cell (PEC). Cells were suspended (1–2 × 10⁶ cells/sample) in PBS plus 0.1% BSA (Fraction V; Invitrogen) and initially blocked with Fc Block™ (BD Biosciences) at 4°C for 30 min. For analysis of B cell purity after positive magnetic sorting, cell suspensions were stained with CD45R/B220-FITC or CD4-FITC (both from BD Biosciences). For analysis of mature, immature, and marginal zone B cell populations in the spleen and bone marrow, cell suspensions were first stained with CD45R/B220-CyChrome™ (BD Biosciences). Mature and immature B cells were identified using anti–mouse IgM-FITC (BD Biosciences) and anti–mouse IgD-PE (Southern Biotechnology Associates, Inc.), whereas marginal zone B cells were identified using CD21/35 (CR2/CR1)-FITC and CD23-PE (both from BD Biosciences). Cell suspensions from the spleen, PBL, and PEC were analyzed for B1 B cells using CD45R/B220-FITC and CD5-PE (both from BD Biosciences). Isotype control Abs included FITC-, PE-, and CyChrome™-conjugated rat IgG2aκ and rat IgG2bκ (both from BD Biosciences). 4 × 10⁴ lymphocyte-gated events were collected and the percentage for each gated cell population was multiplied by the total number of live cells (determined by trypan-blue exclusion) recovered from each site to provide absolute numbers.
Phenotypes of WT and DR6−/− B220+ cells in cultures generated as described above were determined at specific time points by staining with anti-CD80 (B7.1)-PE, CD86 (B7.2)-PE, or MHC class II I-Ab, CD54 (ICAM-1), CD69 (Very Early Activation Antigen), and CD95 (Fas) along with hamster IgGκ and λ, rat IgG2aκ, and mouse IgG2aκ isotype controls (all from BD Biosciences). Surface expression of DR6 was determined by staining with either biotinylated goat anti–human DR6 antibody or control biotinylated normal goat IgG (R&D Systems) and specific Ab binding was detected with streptavidin-PE (BD Biosciences). Cross-reactivity of the anti–human DR6 antibody with murine DR6 was confirmed by flow cytometric and Western immunoblot analysis (unpublished data). 10,000 lymphocyte-gated events were collected and determined to be live cells via duplicate samples stained with propidium iodide (Molecular Probes). The binding of annexin V to cell surface phosphatidylserine was assayed on anti-IgM, anti-CD40, and LPS-activated B cells from WT and DR6−/− mice using the Annexin V-FITC apoptosis detection kit (BD Biosciences). All flow cytometric data were collected with a FACSort™ (Becton Dickinson) using CellQuest™ software (Becton Dickinson).
Cell Division Analysis.
Splenic B cells from naive mice were labeled with 5-(and 6)-carboxyfluorescein diacetate, succinimidyl ester (CFSE; Molecular Probes) according to established protocols (27). In brief, suspensions at 107 cells/ml in HBSS were prewarmed to 37°C. CFSE was then added to a final concentration of 1 μM and the cells were incubated for 10 min at 37°C with occasional mixing, followed by the addition of 10× volume of ice-cold RPMI medium containing 10% FCS. After washing twice with RPMI medium, CFSE-labeled cells were cultured as described above with or without either 5 μg/ml LPS, 10 μg/ml anti-CD40, or 20 μg/ml anti-IgM for 24, 48, and 72 h before flow cytometric analysis. Lymphocyte-gated populations were determined to be live cells via duplicate samples stained with propidium iodide (Molecular Probes). Histogram peaks denoting specific daughter cell generations were determined by initially analyzing the CFSE mean fluorescence intensity of cells left in media alone, and then identifying peaks that corresponded to one-half of this mean fluorescence intensity (cell division one) and of subsequent generations.
Western Blot and Gel Mobility Shift Assay (GMSA).
1.2 × 10⁷ WT and DR6−/− splenic B cells were stimulated with 10 μg/ml anti-IgM or 1 μg/ml anti-CD40, collected, and washed with PBS. Cytoplasmic and nuclear protein extracts were isolated at time points of 0, 30 min, and 4 h using NE-PER™ Nuclear and Cytoplasmic Extraction Reagents (Pierce Chemical Co.) and quantified for total protein content by BCA assay (Pierce Chemical Co.). Equivalent amounts of protein were separated using SDS-PAGE, transferred to nitrocellulose membranes, and blots were probed with antibodies specific to c-Rel (C; Santa Cruz Biotechnology, Inc.).
For Bcl-xL Western blots, whole cell lysates from B cell cultures were stimulated with anti-IgM or anti-CD40 for 0 and 4 h and prepared in 1× RIPA buffer (150 mM NaCl, 1% NP-40, 50 mM Tris, pH 8.0, 0.5% sodium deoxycholate, and 0.1% SDS). Cell lysates were quantified for total protein content by BCA assay (Pierce Chemical Co.) and equivalent amounts were loaded for SDS-PAGE followed by transfer to nitrocellulose membranes. Bcl-xL in anti-CD40–stimulated samples was detected with rabbit polyclonal anti–Bcl-xL (Cell Signaling Technology, Inc.), whereas mouse monoclonal anti–Bcl-xL (H-5; Santa Cruz Biotechnology, Inc.) was used to detect the protein in anti-IgM–treated samples as the stimulus was a rabbit anti–mouse IgM (μ chain–specific) antibody that was detected by the original secondary antibody (horseradish peroxidase anti–rabbit). All blots were probed with mouse anti–β actin (Sigma-Aldrich) as a loading control. C-Rel, Bcl-xL, and β actin proteins were detected with horseradish peroxidase–conjugated anti–rabbit or anti–mouse secondary antibodies (Jackson ImmunoResearch Laboratories) and developed by SuperSignal® West Pico Chemiluminescent Substrate kit (Pierce Chemical Co.).
GMSAs were performed as previously described (28) using 2 μg nuclear proteins and 0.5 μg poly [d (I-C)]. The following oligonucleotides (Sigma-Aldrich) containing binding sites for c-Rel were used as probe: first strand: 5′-gggAGTTGAGGGGACTTTCCCAGGC-3′; second strand: 5′-GCCTGGGAAAGTCCCCTCAACT-3′. Small letters indicate linker nucleotides for labeling purposes. Cold homogenous oligonucleotide was used for competition assays to test the specific binding. Anti–c-Rel (C; Santa Cruz Biotechnology, Inc.) was added after the nuclear proteins were incubated with the probe and used for supershift assays.
MLR.
Splenic B cell cultures from DR6−/− mice and WT littermates (H-2Kb) were stimulated with 10 μg/ml anti-CD40 for 24 h. Anti-CD40–treated B cells were then washed and irradiated with 3,000 rads from a 137Cs source at 250 rads/min and used as allogeneic stimulator cells (29). Responder splenic CD3+ T cells from BALB/c mice (H-2Kd), isolated by positive magnetic cell sorting (Miltenyi Biotec), were mixed with the stimulator cells. Both cell populations were seeded at 4 × 10⁵ cells/well in a 96-well plate in 0.2 ml of Iscove's modified Dulbecco's medium supplemented with 10% FCS, 2 mM glutamine, 100 U/ml penicillin, and 100 μg/ml streptomycin. After 72 h of stimulation, wells were pulsed with 1 μCi of [3H]thymidine and incubated an additional 6 h before harvesting and counting as described above.
Serum Immunoglobulin Analysis.
8–10-wk-old DR6−/− mice and WT littermates were challenged intraperitoneally with 100 μl PBS (CaCl2- and MgCl2-free; Invitrogen) solution containing either 10 μg 4-hydroxy-3-nitrophenylacetyl (NP)-conjugated ficoll (NP24-AECM-Ficoll; Biosearch Technologies), 20 μg NP-LPS (Biosearch Technologies), or 50 μg NP-conjugated KLH (NP36-KLH; Biosearch Technologies) in 100 μl solution of CFA (Difco) on day 0. Serum was collected before (preimmune) and on days 4, 7, and 14 after challenge. NP-specific Ig isotypes from each group were quantified by coating ELISA plates (Costar®) overnight at 4°C with 10 μg/ml NP25-BSA (Biosearch Technologies) in 50 mM carbonate/bicarbonate buffer (pH 9.6; Sigma-Aldrich). Plates were blocked for 1 h at room temperature (rt) with 1% gelatin in Tris-buffered saline (TBS; Sigma-Aldrich) and washed three times with TBS plus 0.05% Tween-20 (TBS-T; Sigma-Aldrich). Serum samples serially diluted in 0.1% gelatin/TBS were added and incubated at rt for 1 h. After three washes with TBS-T, plates were incubated for 30 min at rt with alkaline phosphatase–conjugated goat anti–mouse IgM and IgG isotypes (SBA Clonotyping™ System/AP; Southern Biotechnology Associates, Inc.). Plates were washed five times with TBS-T, followed by the addition of p-nitrophenyl phosphate substrate solution and read after 25 min at 405 nm on a νmax kinetic microplate reader (Molecular Devices). All data were quantified against the purified mouse isotype standards (Mouse Immunoglobulin Standard Panel; Southern Biotechnology Associates, Inc.). BSA-coated plates gave no detectable binding of serum isotypes.
Immunohistochemistry.
8–10-wk-old DR6−/− mice and WT littermates were challenged intraperitoneally with 50 μg NP-KLH in CFA as described above. Tissues were fixed overnight in zinc-buffered formalin (Fisher Scientific) and then transferred to 70% ethanol before processing through paraffin. Five micron sections were generated by microtome and sections were placed on positive-charged slides. Slides were baked overnight at 60°C, deparaffinized in xylene, and rehydrated through graded alcohols to water (30). Antigen retrieval was performed by immersing the slides in Target Retrieval Solution (DakoCytomation) for 20 min at 90°C in a water bath, cooling at rt for 10 min, washing in water, and then proceeding with immunostaining. All subsequent staining steps were performed on the Dako Autoimmunostainer. Incubations were performed at rt and TBS plus 0.05% Tween 20, pH 7.4 (DakoCytomation), was used for all washes and diluents. Slides were blocked with protein blocking solution (DakoCytomation) for 25 min. After washing, 10 μg/ml of either biotinylated anti–mouse CD45R/B220 (BD Biosciences) or biotinylated peanut agglutinin (PNA; Vector Laboratories) was added to the slides and incubated for 60 min. Streptavidin–horseradish peroxidase kit (LSAB2; DakoCytomation) was then used along with a 3,3′-diaminobenzidine chromagen. Slides were removed from the autostainer and counter-stained with hematoxylin for 30 s followed by permanent mounting and light microscopy analysis.
Statistical Analysis.
The statistical significance of data presented in Figs. 1 D, 3, A–C, and 5 D was determined by two-sampled Student's t test as noted.
Figure 1.
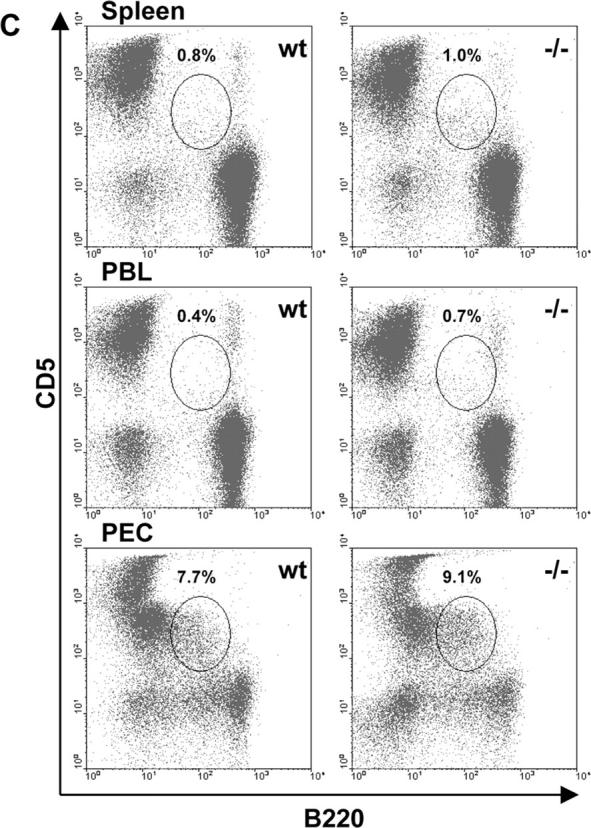
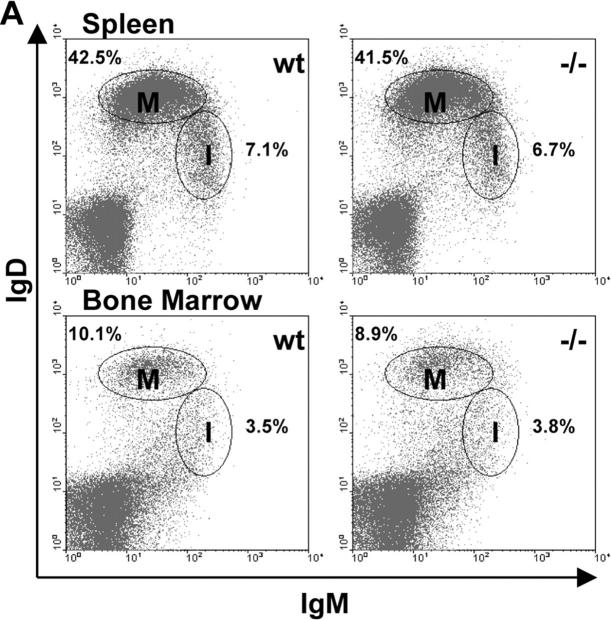
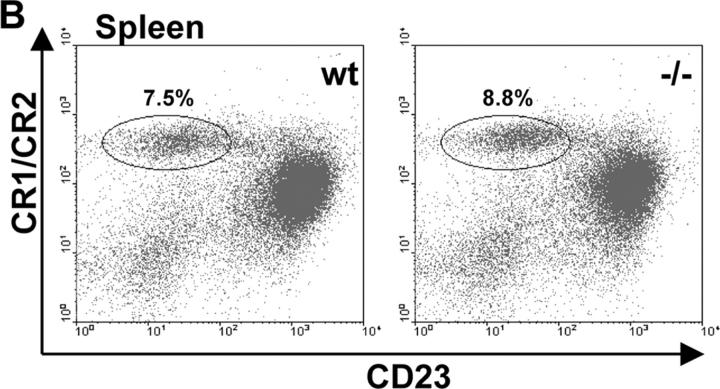
Mature, immature, marginal zone, and B1 B cell populations in DR6−/− mice. Single cell suspensions of spleen, bone marrow (1 femur), PBL, and PEC from groups (n = 5) of naive DR6−/− (−/−) and WT (wt) littermates mice were isolated and analyzed by flow cytometry. (A) Splenocytes and B220+-gated bone marrow cells were analyzed for proportions of mature (M, IgMdull and IgDhigh) and immature (I, IgMhigh and IgDdull) B cell populations as denoted by gates. (B) Analysis of marginal zone B cells (CR1/CR2high and CD23low) from B220+-gated splenocytes of DR6−/− and WT mice as indicated by the gate. (C) Percentages of B1 B cells (B220+ and CD5+) from spleen, PBL, and PEC of naive DR6−/− mice and WT littermates. (D) Absolute numbers of mature, immature, B1, and marginal zone B cells (MZB) are represented and were determined by multiplying the total tissue live cell count by the percentages described above from DR6−/− and WT mice. Tissues include spleen (SPL), bone marrow (BM), PBL, and PEC. Results shown are representative of two independent experiments. Values shown represent the mean and error bars represent the SD. *, P < 0.01.
For in vitro annexin V binding data (see Fig. 3, G–I) and in vivo immunoglobulin data (see Fig. 6), a mixed effects model was fit using the compound symmetry covariance structure. The terms used in this model were “Treatment” (WT vs. DR6−/−), “Day” (4, 7, and 14 for Fig. 6 and 24, 48, and 72 h for Fig. 3, G–I), and “Treatment*Day” interaction as fixed effects and “Animals nested within Treatment” as the random effect. Baseline protein expression levels were included as covariates in the model whenever appropriate. Because the distribution of the protein expression levels was not symmetric, Box-Cox transformation method (31) was used to transform the data to ensure symmetry and homogenous variance. The mixed effect model was fit for this transformed data using the JMP software, version 4.0.2. Within the framework of this mixed effects model comparisons between DR6−/− and WT treatments were made for days 4, 7, and 14 (see Fig. 6), and 24, 48, and 72 h (Fig. 3, G–I). Statistical significance was claimed when the two-tailed P values were <0.05.
Figure 3.

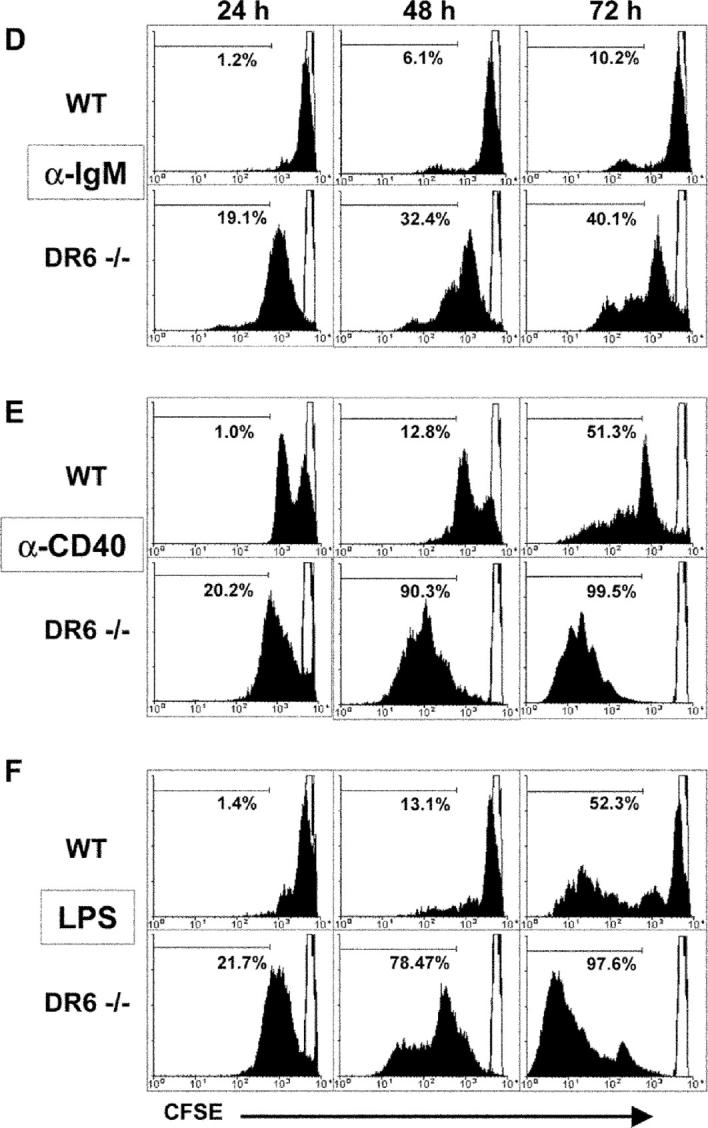

Effect of DR6 deficiency on B cell proliferation, cell division, and survival. B cells isolated from spleens of 8–10-wk-old DR6-deficient (DR6−/−) and WT littermate control mice were stimulated with 20 μg/ml anti-IgM (A), 10 μg/ml anti-CD40 (B), or 5 μg/ml LPS (C) as described in Materials and Methods. Cells were cultured in triplicates in 96-well plates for 72 h and B cell proliferation was measured by [3H]thymidine incorporation during the final 12 h of culture. Values shown represent the mean and error bars represent the SD. *, P < 0.01. (D–F) For B cell division measurement, purified B cells were labeled with fluorescence dye CFSE as described in Materials and Methods. Cells were then incubated for 24, 48, and 72 h with either 20 μg/ml anti-IgM (D), 10 μg/ml anti-CD40 (E), or 5 μg/ml LPS (F) as indicated. Loss of CFSE fluorescence, indicating cell division progression, was measured by flow cytometry. Lymphocyte-gated populations were determined to be live cells via duplicate samples stained with propidium iodide. Solid filled histograms indicate activated cells and unfilled histograms represent cultures at t = 0. Histogram markers indicate the percentage of cells that underwent at least three rounds of division. (G–I) Splenic B220+ cells of DR6-deficient (DR6−/−) and WT control mice were stimulated with either 20 μg/ml anti-IgM (G), 10 μg/ml anti-CD40 (H), or 5 μg/ml LPS (I). At 24, 48, and 72 h of culture, annexin V binding activity of cells was analyzed by flow cytometry as described in Materials and Methods. Values shown represent the mean percentage of annexin V+/propidium iodide− cells in duplicate cultures and error bars represent the standard deviation. *, P < 0.05; **, P < 0.01.
Figure 6.
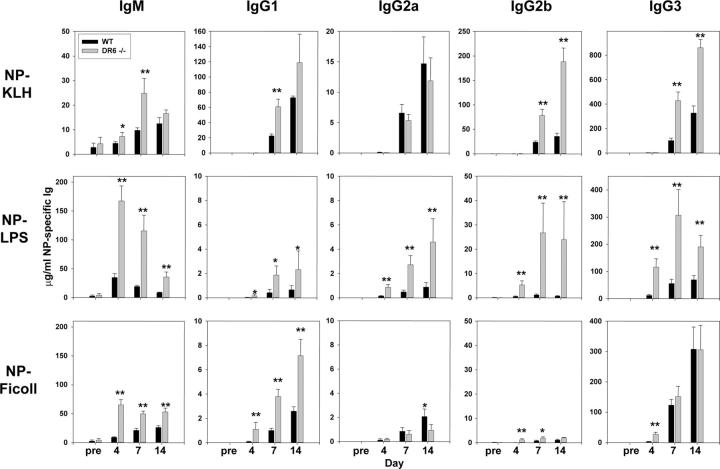
Enhanced T-dependent and T-independent type I and II responses in DR6−/− mice. Cohorts (n = 5) of DR6-deficient (DR6−/−) and WT mice were immunized with either 50 μg NP-KLH (T-dependent), 20 μg NP-LPS (T-independent type I), or 10 μg NP-Ficoll (T-independent type II) on day 0. Serum NP-specific IgM and different IgG isotypes levels were measured from preimmune mice (pre) and at days 4, 7, and 14 after challenge by ELISA as described in Materials and Methods. Values shown represent mean values of five mice from each genotype group and error bars represent the SEM. *, P < 0.05; **, P < 0.01.
Results
B Cell Development and Populations in DR6−/− Mice.
Although the two previous reports on DR6−/− mice indicated no gross histological defects nor differences in B220+ cell populations (25, 26), we evaluated whether the absence of DR6 affected B cell development and/or populations of conventional B2, B1, and marginal zone B cells. Cell preparations from the spleen and bone marrow of naive DR6−/− or WT mice were analyzed for mature and immature B cell populations by staining for surface levels of IgM and IgD (Fig. 1) . The absence of DR6 did not significantly affect the mature (IgMdull and IgDhigh) or immature (IgMhigh and IgDdull) compartment in the spleen or bone marrow with respect to either percentage or absolute numbers (Fig. 1, A and D; P > 0.09 for all compared populations). Additional analysis of the spleen for marginal zone B cells (B220+, CR1/CR2+, and CD23low) also revealed no significant (P > 0.9) differences in percentages or absolute numbers when compared with WT littermates (Fig. 1, B and D). To determine if B1 cell populations were present in DR6−/− mice, primary cells from the spleen, PBL, and PEC were analyzed for CD5+ and B220+ populations. DR6−/− mice exhibited similar percentages of B1 cells in all three sites (Fig. 1 C) and absolute numbers of these cells were not significantly different (Fig. 1 D; P > 0.09 for all three sites). In addition, no significant differences in B cell turnover in naive DR6−/− and WT mice were observed as measured by bromodeoxyuridine incorporation (unpublished data). Together, these data suggest that targeted disruption of DR6 causes no gross defects in B cell lineage development or peripheral populations.
B Cell Surface Expression of DR6.
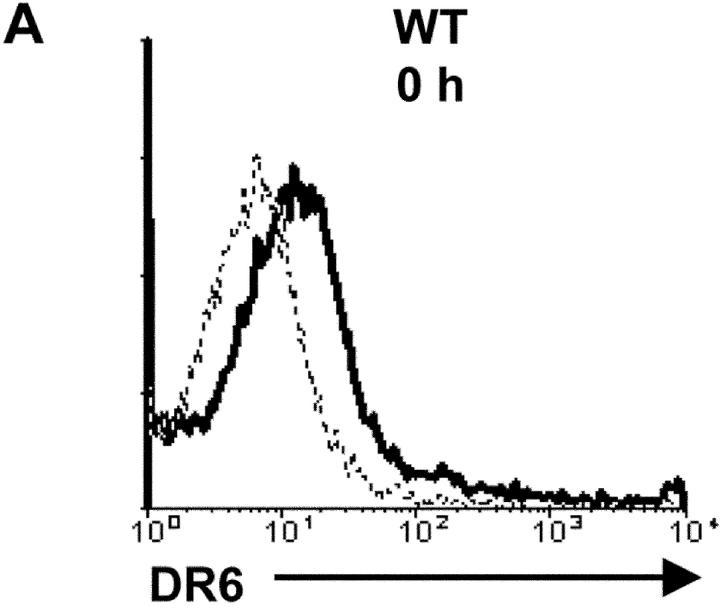
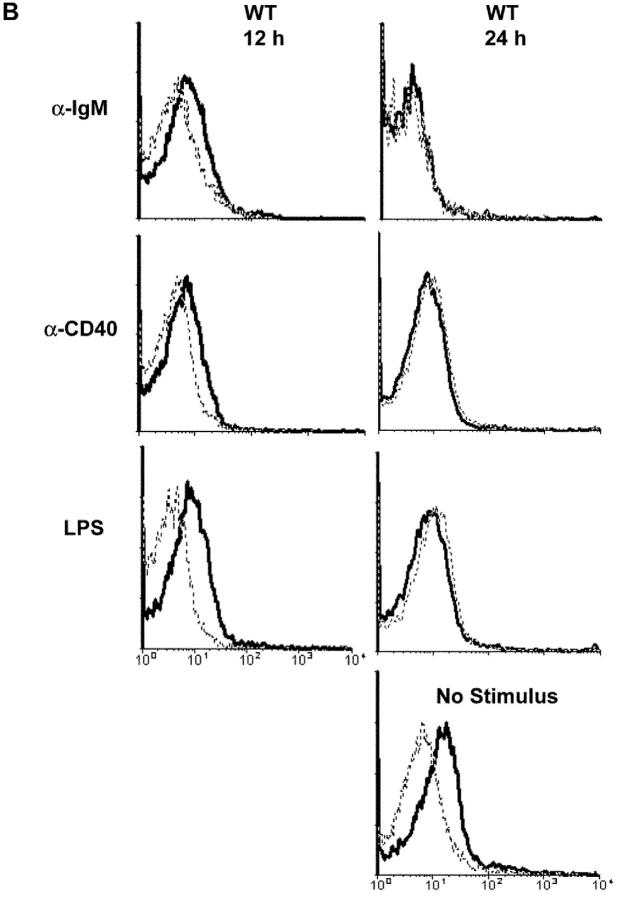
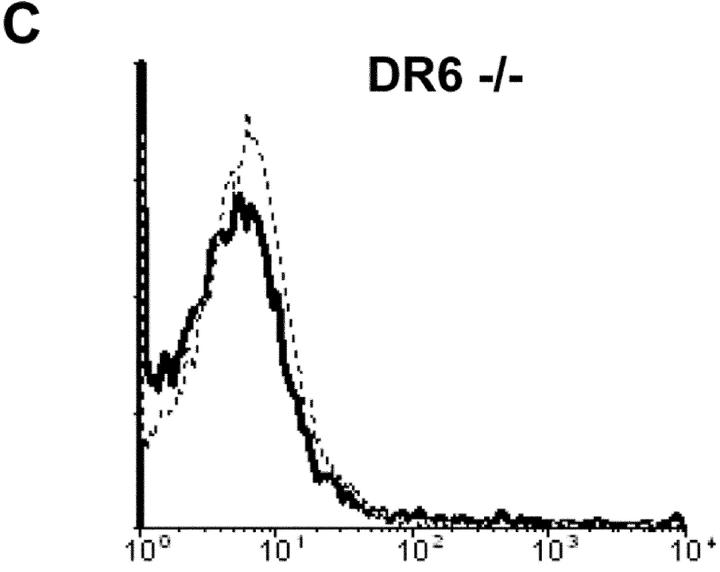
Previously, it was shown that DR6 transcripts were expressed in adult lymphoid tissue such as spleen and lymph node (25, 26). To examine if surface levels of DR6 are expressed and regulated on B cells, B220+ cells from the spleens of naive DR6−/− and WT mice were stained for surface DR6 before and after stimulation with either anti-IgM, anti-CD40, or LPS and subsequently analyzed by flow cytometry. Surface DR6 was detected on naive WT B cells before stimulation (Fig. 2 A, 0 h), however, this expression was down-regulated after treatment with either anti-IgM, anti-CD40, or LPS (Fig. 2 B). Gradual loss of surface DR6 appeared to occur during the initial 12–24 h of culture and was undetectable above the goat Ig control by 24 h after stimulation (Fig. 2 B). In contrast, DR6 expression was still detected on WT B cells after 24 h in media alone, indicating that loss of DR6 surface expression was activation dependent. B220+ cells from DR6−/− mice exhibited no positive staining above the goat Ig control (Fig. 2 C). These data suggest that DR6 surface expression is lost upon stimulation and may play a role in activation.
Figure 2.
Down-regulated DR6 surface expression on activated WT B cells. B cells were purified from spleen using positive selection as described in Materials and Methods. B220+ cells were activated with 20 μg/ml anti-IgM, 10 μg/ml anti-CD40, or 5 μg/ml LPS and then analyzed for DR6 expression by flow cytometry. Surface expression of DR6 was measured before (A) and 12 and 24 h after plating (B). Solid line histograms represent anti-DR6 staining and dashed line histograms represent biotinylated goat Ig control. (C) DR6-deficient (DR6−/−) B cells were used for confirming Ab specific staining. Loss of DR6 surface expression on WT cells between 12 and 24 h was dependent on stimulation, as cultures left in media alone (no stimulus) for 24 h had no significant loss of DR6 surface expression. Y axis represents relative cell number and x axis represents log10 fluorescence intensity. Data shown are representative of three independent experiments.
Enhanced B Cell Proliferation in the Absence of DR6.
The differential expression of DR6 between resting and activated B cells implies that DR6 might play a regulatory role in B cell responses. To address this, B cell proliferation in response to different stimulators was examined in vitro. Purified B cells (93–97% B220+) were activated with either anti-IgM, anti-CD40, or LPS for 72 h and proliferation was measured. Levels of [3H]thymidine incorporation in DR6−/− B cells using all three stimuli were significantly higher than that of B cells from WT mice (Fig. 3, A–C) . These 72-h cultures were essentially free of contaminating CD4+ T cells (<0.9%; unpublished data) and little to no [3H]thymidine incorporation was observed in the absence of stimulation (Fig. 3, A–C). These results suggest that DR6 affects B cell proliferation induced by a variety of stimuli.
Absence of DR6 Promotes Cell Division Progression and Survival of Mitogen-stimulated B Cells.
Although DR6−/− B cells show increased [3H]thymidine incorporation after mitogen stimulation compared with WT B cells, it is unclear whether this is a consequence of increased cell division, decreased apoptosis, or possibly a combination of both. To address these issues, we performed cell division and cell death analysis on mitogen-activated splenic B cells from WT and DR6−/− mice. Before culture with either anti-IgM, anti-CD40, or LPS, B cells from naive mice were labeled with CSFE and CFSE fluorescence was monitored after 24, 48, and 72 h of stimulation (27). Relative to B cells from WT mice, an increased number of cell division cycles was clearly demonstrated in DR6−/− B cells at all time points and with all three stimuli (Fig. 3, D–F). These data indicate that DR6 influences B cell proliferation by regulation of cell division.
To examine whether there was a direct effect of DR6 on B cell apoptosis, annexin V binding was analyzed 24, 48, and 72 h after the treatment of WT and DR6−/− B cells with either anti-IgM, anti-CD40, or LPS (Fig. 3, G–I). Fig. 3, G–I, shows that the percentage of annexin V+ propidium iodide− DR6−/− B cells was significantly lower compared with that of WT B cells with all three stimuli with the exception of LPS stimulation at 24 h. Together, these results indicate that enhanced cell division progression and decreased apoptosis contribute to the increased proliferative response of DR6−/− B cells as measured by [3H]thymidine incorporation.
Increased Levels and Activity of Nuclear C-Rel and Elevated Bcl-xL Expression upon Activation of DR6−/− B Cells.
C-Rel is one of the critical transcription factors controlling B cell proliferation and survival especially after activation by B cell receptor (BCR) or CD40 cross-linking (21, 22, 32). Cultured B cells from WT and DR6−/− mice were stimulated with anti-IgM or anti-CD40, and at different time points nuclear and cytoplasm extracts were prepared and used for Western blot analysis. As shown in Fig. 4 A, increased nuclear levels of c-Rel were observed in DR6−/− B cells upon stimulation with anti-CD40 and anti–IgM. DR6−/− B cells exhibited marked increases of nuclear c-Rel compared with WT B cells after 30 min stimulation with either anti-CD40 or anti–IgM (Fig. 4 A, top). DR6−/− B cells still displayed a higher abundance of c-Rel in the nucleus than WT B cells after 4 h of anti-IgM stimulation (Fig. 4 A, bottom), whereas anti-CD40–treated B cells showed no difference.
Figure 4.
Increased nuclear levels and activity of c-Rel and elevated Bcl-xL expression in activated DR6−/− B cells. (A) Western blot analysis of c-Rel in cytoplasmic and nuclear extracts from DR6-deficient (−/−) and WT (wt) B cell cultures. Purified splenic B cells were stimulated with or without 10 μg/ml anti-IgM or 1 μg/ml anti-CD40 for 30 min or 4 h as indicated. Cytoplasmic (C) and nuclear (N) extracts were prepared as described in Materials and Methods. C-Rel was detected with specific anti–c-Rel Ab after SDS-PAGE. Equal amounts of either cytoplasmic or nuclear protein extracts were loaded into wells and data shown are representative of two independent experiments. (B) GMSA with nuclear fractions of DR6−/− and WT B cells activated with anti-IgM or anti-CD40 for 0.5 or 4 h as described in Materials and Methods. Nuclear c-Rel from activated DR6−/− B cells bound to its specific DNA probe (top) and supershifted with the addition of anti–c-Rel antibody (bottom). Middle bands were nonspecific binding, as they were not competed by cold homologous oligonucleotide. (C) B cells from DR6-deficient (−/−) or WT (wt) were either untreated or treated with anti-IgM or anti-CD40 for 4 h and total cell lysates were prepared in 1× RIPA buffer as described in Materials and Methods. After SDS-PAGE and Western transfer, Bcl-xL in anti-CD40–stimulated samples was detected with rabbit polyclonal anti–Bcl-xL, whereas mouse monoclonal anti–Bcl-xL was used to detect the protein in anti-IgM–treated samples as the stimulus was a rabbit anti–mouse IgM antibody that was detected by the original secondary, anti–rabbit antibody. All blots were probed with mouse anti–β actin as a loading control. Data shown are representative of two independent experiments.
Consistent with the Western blot data described above, increased nuclear c-Rel–DNA complexes were observed using nuclear fractions of activated DR6−/− B cells as visualized by GMSA analysis (Fig. 4 B, top). In addition, the c-Rel–DNA complex was supershifted by the addition of anti–c-Rel Ab (Fig. 4 B, bottom), indicating that the increase of nuclear c-Rel from activated DR6−/− B cells correlates with increased protein–DNA complexes. These data suggest that DR6 may function in part by regulating signaling pathways that result in increasing nuclear levels of c-Rel.
To test whether increased nuclear levels of c-Rel impacted specific gene expression, we investigated the expression Bcl-xL, which is transcriptionally controlled by c-Rel and is important for cell survival (33). WT and DR6−/− B cells were treated for 4 h with anti-IgM or anti-CD40 and total cell lysates were probed for Bcl-xL by Western blot. Elevated Bcl-xL protein was observed in activated DR6−/− B cells compared with WT B cells at 4 h for both stimuli (Fig. 4 C). These data suggest that decreased apoptosis observed in DR6−/− B cells might be due in part to increased Bcl-xL expression early after activation.
Up-regulation of CD86 Expression and Enhanced APC Function in DR6−/− B Cells.
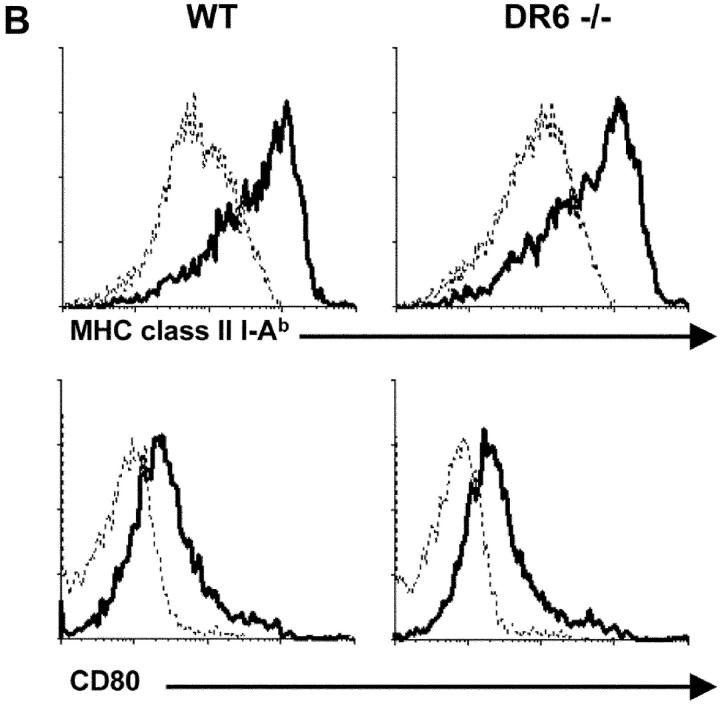
B cell activation leads to the up-regulation of a number of cell surface molecules that are important for T–B cell collaboration (34, 35). Interactions between CD40 and CD40L can lead to the up-regulation of a number of B cell surface costimulatory molecules including those of the B7 family (35). We compared up-regulation of several of these molecules on B cells from WT and DR6−/− mice after activation. Stimulation with either anti-IgM, anti-CD40, or LPS resulted in an increased number of cells with high CD86 surface expression in DR6−/− B cell cultures compared with WT at 24 h (Fig. 5 A). In contrast, surface levels of CD80, CD54, CD69, CD95, and MHC class II I-Ab were expressed at similar levels on DR6−/− and WT B cells (Fig. 5 B and unpublished data). CD86 surface expression was also monitored at 0, 12, 24, and 36 h with either anti-IgM, anti-CD40, or LPS stimulation. Peak CD86 expression for both DR6−/− and WT B cells occurred from 12–24 h, however, DR6−/− cultures consistently had 15–28% more cells with high CD86 expression compared with WT cultures. By 36 h, anti-IgM–treated DR6−/− and WT cultures had CD86 levels that returned to basal levels, whereas DR6−/− cultures with anti-CD40 or LPS stimulation still exhibited 15–19% more CD86high-expressing cells compared with WT cultures (unpublished data). These data suggested that DR6 might be involved in regulating B cell CD86 expression, which is necessary for T cell proliferation in response to antigen presentation on B cells (36, 37).
Figure 5.
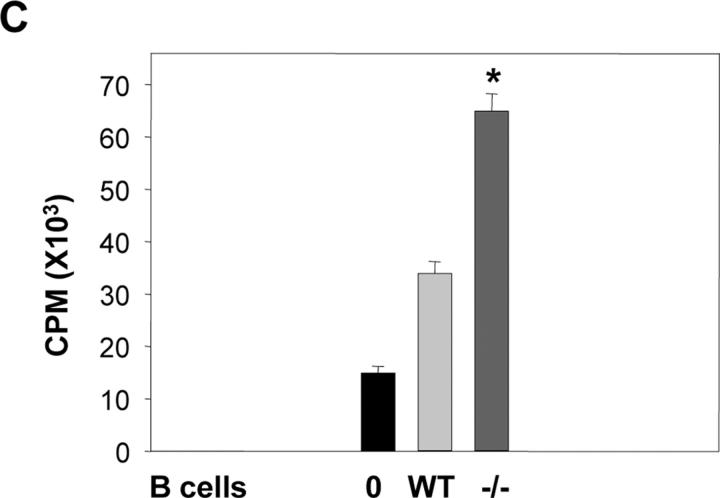
Enhanced expression of CD86 and APC function by activated DR6−/− B cells. (A) B220+ cells from DR6−/− or WT mice were stimulated with 20 μg/ml anti-IgM, 10 μg/ml anti-CD40, or 5 μg/ml LPS for 24 h and analyzed by flow cytometry for CD86 surface expression. Solid line histograms represent CD86 staining of activated cells and dashed line histograms represent unstimulated levels. (B) As in A but LPS-stimulated B cell cultures were analyzed for surface expression of MHC class II I-Ab (top) and CD80 (bottom). Y axis represents relative cell number and x axis represents log10 fluorescence intensity. (C) For allogeneic T cell proliferation assay, responding T cells (H-2d) were purified from BALB/c mice and cultured in the presence or absence of irradiated WT or DR6-deficient (−/−) B cells that were previously stimulated with 10 μg/ml anti-CD40 for 24 h and then irradiated. After 5 d of incubation, the proliferation of allogeneic T cells was measured by [3H]thymidine incorporation in the last 6 h of pulse. Values shown represent the mean and error bars represent the SD. *, P < 0.01. Data shown are representative of three independent experiments.
To address whether DR6 affects their physiological function as APC, B cells of DR6−/− mice and WT littermates were stimulated with anti-CD40 for 24 h. Activated B cells were then washed, irradiated, and used in mixed lymphocyte stimulation assays with allogeneic T cells as responding cells. Fig. 5 C illustrates that an augmented T cell proliferative response was observed when activated DR6−/− B cells were used as stimulator cells. These results suggest that DR6 might be involved in B cell APC function, which in turn could affect the outcome of B and CD4+ T cell interactions that occur during adaptive immune responses in vivo.
Increased T-dependent and T-independent Humoral Responses in DR6−/− Mice.
The effects of DR6 deficiency in humoral responses to T-dependent antigen were compared by challenging DR6−/− and WT mice with NP-conjugated KLH (NP-KLH) in CFA. In agreement with an earlier study (26), we detected modest increases in NP-specific IgM but a large increase in IgG1 at day 7 in DR6−/− mice compared with WT (Fig. 6 , top). Although IgG2a was not significantly different between DR6−/− and WT mice, the absence of DR6 greatly increased serum levels of NP-specific IgG2b and IgG3 (Fig. 6, top).
Data presented so far would indicate an intrinsic role for DR6 in B cell activation. To investigate this further, WT and DR6−/− mice were immunized with either a T-independent type I (NP-LPS) or type II (NP-Ficoll) antigen. Immunization with NP-LPS induced higher average NP-specific titers of all isotypes in DR6−/− mice compared with WT littermates, although overall levels of IgG1, IgG2a, and IgG2b were lower than for NP-KLH immunization (Fig. 6, middle). Immunization with NP-Ficoll resulted in significantly (P < 0.01) higher titers of NP-specific IgM and IgG1 in DR6−/− mice compared with WT mice, whereas IgG2b was higher at days 4–7 and IgG3 was higher at day 4 in DR6−/− mice (Fig.6, bottom). There was no significant difference of IgG3 between WT and DR6−/− mice at days 7 and 14. These results indicate that targeted disruption of DR6 not only affects in vivo T-dependent humoral responses, but also has effects on T-independent type I and II humoral responses.
Germinal Center Formation Is Augmented in the Absence of DR6.
During T-dependent B cell responses, germinal centers are the anatomical site of T–B cell interactions and represent a physiological hallmark of Th activity. To determine if DR6 deficiency affects germinal center formation, spleens of WT and DR6−/− mice immunized with NP-KLH were removed at day 14 and analyzed by immunohistochemistry. Although spleen sections from naive WT and DR6−/− mice displayed no gross anatomical differences (25 and unpublished data), spleen sections from immunized DR6−/− mice stained for B220 exhibited increased cellularity and size of the B cell area of white pulp compared with WT spleens (Fig. 7 , top). Staining with PNA revealed an enhanced size of germinal centers in DR6−/− mice compared with WT controls (Fig. 7, bottom), indicating that the absence of DR6 also enhances the development of anatomical locations of B cell proliferation after antigen challenge.
Figure 7.

Expanded B cell areas and enhanced germinal center formation in DR6−/− mice. For immunohistological analysis, spleens from cohorts (n = 3) of DR6-deficient (DR6−/−) or WT mice were removed at 14 d after NP-KLH challenge and sections were prepared as described in Materials and Methods. B220+ areas of the splenic white pulp are shown in brown at 10× (top). Germinal centers were visualized by PNA+ staining of successive spleen sections described above. PNA+ areas (in brown) within the B cell follicles indicate germinal centers (bottom, 40×). B220 and PNA staining was visualized with 3,3′-diaminobenzidine chromagen and sections were counterstained with hematoxylin.
Discussion
Intracellular signals generated by interactions between a number of TNF/TNFR family members have been shown to be critical for the function of B lymphocytes at multiple steps of humoral immune responses (1, 3–17, 35). Stimulation of CD40 on B cells is essential for Ig isotype class switching of T-dependent antibody responses and germinal center formation (38, 39). Interactions between B lymphocyte stimulator (BLyS) and its receptors have been shown to influence multiple aspects of B cell biology, including development, proliferation, homeostasis, and humoral responses, especially to T-independent type II antigens (5–13, 15–17). Absence of DR6 was previously shown to enhance CD4+ T cell proliferation along with Th2 differentiation and cytokine production (25, 26). In the course of in vivo responses, however, CD4+ T cells undergo multiple interactions with other cell types to establish protective immunity. During T cell–dependent B cell responses, interactions between antigen–BCR, MHC class II–peptide-TCR, CD28–CD86, and CD40–CD40L generate intracellular signals in both T and B cells that are necessary for the progression of a humoral response (40, 41). Surface expression of DR6 was detected on resting B220+ cells and like CD4+ T cells (25), this expression was down-regulated after stimulation (Fig. 2). These data suggested that DR6 may also have functions intrinsic to B cells that occur early in responses.
We investigated the impact of DR6 deficiency on modulating B cell responses both in vitro and in vivo. DR6−/− mice exhibited no gross defects in B cell development or in peripheral populations of conventional B2, B1, or marginal zone B cells (Fig. 1). The in vitro proliferation of DR6−/− B cells was markedly increased after stimulation with either anti-IgM, anti-CD40, or LPS (Fig. 3, A–C). These responses were due, at least in part, to increased cell mitosis (Fig. 3, D–F) and reduced apoptosis (Fig. 3, G–I) after activation. Together, these in vitro results indicate that lack of DR6 in B cells can influence their activation, proliferation, and survival.
NF-κB/Rel family members are among the many transcription factors implicated in controlling gene expression in B lymphocytes and also can serve to protect cells from apoptotic signals (22, 32, 33). C-Rel is expressed at high levels in lymphoid cells (19). C-Rel–deficient B lymphocytes have impaired proliferative responses to anti-IgM, anti-CD40, or LPS and exhibit defects in their ability to receive survival signals through anti-IgM or LPS stimulation (21, 23). In our study, increased nuclear levels of c-Rel capable of forming c-Rel–DNA complexes were observed in activated DR6−/− B cells, suggesting that DR6 may regulate B cell proliferative responses, at least in part, through a c-Rel–mediated pathway. Our data is consistent with previous studies (21, 22) indicating that c-Rel is a critical transcription factor for both cell division and apoptosis, and DR6 appears to be involved in regulating nuclear c-Rel activity. The increase of nuclear c-Rel in DR6−/− B cells could be caused by accelerating the nuclear translocation by increased NF-κB pathway activation. However, we did not observe any differences in NF-κB activation between WT and DR6−/− B cells after stimulation (unpublished data), suggesting the increase of nuclear c-Rel is not due to increased NF-κB activation and accelerated c-Rel nuclear translocation.
Bcl-2 family proteins have been shown to play an important role for the survival of various stages of B lymphocytes and Bcl-xL is crucial for the survival and maturation of germinal center B cells (42). The expression of apoptosis inhibitor Bcl-xL is known to be transcriptionally regulated by c-Rel (33). Enhanced expression of Bcl-xL was observed in activated DR6−/− B cells (Fig. 4 B), suggesting that increased nuclear c-Rel levels and Bcl-xL expression may contribute to both increased proliferation and decreased apoptosis of activated DR6−/− B cells.
The CD28–CD86 interaction has been demonstrated to be important for T cell activation (43). Increased expression of CD86 upon stimulation of B cells through BCR or CD40 was found to contribute to enhanced production of IgG1 and IgE (44). Additionally, it was recently reported that signals induced by cross-linking of CD86, but not CD80, on activated B cells enhanced proliferation and production of IgG1 along with augmenting levels of Bcl-xL (45). Upon activation, a greater percentage of cultured DR6−/− B cells exhibited high CD86 surface expression compared with WT B cells (Fig. 5 A). In addition, our data demonstrated increased allogeneic T cell proliferation in response to previously activated DR6−/− B cells as APC (Fig. 5 C). The increased CD86 expression of DR6−/− B cell populations may contribute, via costimulatory signals, to increased T cell responses and/or may also provide signals directly to the B cell itself.
CD4+ T cells can influence antibody isotype secretion to T-dependent antigens. Th2 cells contribute to IgG1 and IgE isotype generation whereas Th1 cells influence IgG2a and IgG3 isotypes (46, 47). Previous studies showed that upon KLH challenge, production of Th2 cytokines was markedly higher in the activated DR6−/− T cells (25, 26). Consistent with these previous studies, DR6−/− mice immunized with NP-KLH exhibited increased IgM and IgG1 isotypes at day 7, however, no significant difference was observed in IgG2a levels compared with WT controls.
In addition, we observed an increase in the size of germinal centers in DR6−/− spleens after T-dependent antigen challenge (Fig. 7). Previous studies have shown that CD28 is a crucial factor for germinal center formation (48) and CD28 expression is up-regulated in DR6−/− T cells compared with WT mice (25). This, along with higher B cell CD86 expression, suggests that DR6−/− B cells received stronger stimulating signals in the T cell–rich regions of the white pulp to promote the formation of germinal centers. Although the absence of DR6 affects T-dependent humoral responses, it is unclear whether this is mediated through intrinsic effects on B cells, the preferential Th2 differentiation of CD4+ T cells, or a combination of both.
T-independent antigens are also critical for host defense and involve the stimulation of B cells by antigen-presenting dendritic cells without the initial involvement of CD4+ T cells (49). In addition to T-dependent humoral responses, DR6−/− mice also displayed increased Ig levels in response to T-independent type I (NP-LPS) and type II (NP-Ficoll) antigens. These data further indicate that DR6 serves a regulatory role that is intrinsic to B cells, although it does not exclude the possibility that DR6 influences cellular responses in both the innate and adaptive arms of host defense.
Our current studies provide evidence that DR6 has a fundamental role in activation-induced B cell expansion, survival, and humoral responses. Therefore, modulation of the DR6 signaling pathway might be able to control the extent of B cell responses in addition to CD4+ T cell responses and potentially provide therapeutic benefits to treat certain immune system disorders, such as asthma, allergy, and various autoimmune diseases.
Acknowledgments
We thank Dr. Subba Rao Chintalacharuvu and Dr. Armen B. Shanafelt for critical review of the manuscript, Dr. Viswanath Devanarayan for statistical assistance, Angela J. Okragly and Timothy W. Noblitt for technical assistance, and Qing Zhang for maintaining the mice.
C.S. Schmidt is a postdoctoral fellow at Eli Lilly and Company.
C.S. Schmidt and J. Liu contributed equally to this work.
J. Liu's current address is Pharmacopeia, Inc., 3000 Eastpark Boulevard, Cranbury, NJ 08512.
Footnotes
*
Abbreviations used in this paper: BCR, B cell receptor; CFSE, 5-(and 6)-carboxyfluorescein diacetate, succinimidyl ester; DR, death receptor; GMSA, gel mobility shift assay; NF, nuclear factor; NP, 4-hydroxy-3-nitrophenylacetyl; PEC, peritoneal exudate cell; PNA, peanut agglutinin; rt, room temperature; TBS, Tris-buffered saline.
References
- 1.Smith, C.A., T. Farrah, and R.G. Goodwin. 1994. The TNF-receptor superfamily of cellular and viral proteins: activation, costimulation, and death. Cell. 76:959–962. [DOI] [PubMed] [Google Scholar]
- 2.Locksley, R.M., N. Killeen, and M.J. Lenardo. 2001. The TNF and TNF receptor superfamilies: integrating mammalian biology. Cell. 104:487–501. [DOI] [PubMed] [Google Scholar]
- 3.van Kooten, C., and J. Banchereau. 1997. Functions of CD40 on B cells, dendritic cells and other cells. Curr. Opin. Immunol. 9:330–337. [DOI] [PubMed] [Google Scholar]
- 4.Stuber, E., and W. Strober. 1996. The T cell–B cell interaction via OX40-OX40L is necessary for the T cell–dependent humoral immune response. J. Exp. Med. 183:979–989. [DOI] [PMC free article] [PubMed] [Google Scholar]
- 5.Moore, P.A., O. Belvedere, A. Orr, K. Pieri, D.W. LaFleur, P. Feng, D. Soppet, M. Charters, R. Gentz, D. Parmelee, et al. 1999. BLyS: member of the tumor necrosis factor family and B lymphocyte stimulator. Science. 285:260–263. [DOI] [PubMed] [Google Scholar]
- 6.Mukohopadhyay, A., J. Ni, Y. Zhai, G.-L. Yu, and B.B. Aggarwal. 1999. Identification and characterization of a novel cytokine, THANK, a TNF homologue that activates apoptosis, nuclear factor-kappaB, and c-Jun NH2-terminal kinase. J. Biol. Chem. 274:15978–15987. [DOI] [PubMed] [Google Scholar]
- 7.Schneider, P., F. Mackay, V. Steiner, K. Hofmann, J.L. Bodmer, N. Holler, C. Ambrose, P. Lawton, S. Bixler, and H. Acha-Orbea. 1999. BAFF, a novel ligand of the tumor necrosis factor (TNF) family, stimulates B cell growth. J. Exp. Med. 189:1747–1756. [DOI] [PMC free article] [PubMed] [Google Scholar]
- 8.Shu, H.-B., W.-H. Hu, and H. Johnson. 1999. TALL-1 is a novel member of the TNF family that is down-regulated by mitogens. J. Leukoc. Biol. 65:680–683. [PubMed] [Google Scholar]
- 9.Gross, J.A., J. Johnston, S. Mudri, R. Enselman, S.R. Dillon, K. Madden, W. Xu, J. Parrish-Novak, D. Forster, C. Lofton-Day, et al. 2000. TACI and BCMA are receptors for a TNF homologue implicated in B-cell autoimmune disease. Nature. 404:995–999. [DOI] [PubMed] [Google Scholar]
- 10.Mackay, F., S.A. Woodcock, P. Lawton, C. Ambrose, M. Baetscher, P. Schneider, J. Tschopp, and J.L. Browning. 1999. Mice transgenic for BAFF develop lymphocytic disorders along with autoimmune manifestations. J. Exp. Med. 190:1697–1710. [DOI] [PMC free article] [PubMed] [Google Scholar]
- 11.Khare, S.D., I. Sarosi, X.-Z. Xia, S. McCabe, K. Miner, I. Solovyev, N. Hawkins, M. Kelley, D. Chang, G. Van, et al. 2000. Severe B cell hyperplasia and autoimmune disease in TALL-1 transgenic mice. Proc. Natl. Acad. Sci. USA. 97:3370–3375. [DOI] [PMC free article] [PubMed] [Google Scholar]
- 12.Schiemann, B., J.L. Gommerman, K. Vora, T.G. Cachero, S. Shulga-Morskaya, M. Dobles, E. Frew, and M.L. Scott. 2001. An essential role for BAFF in the normal development of B cells through a BCMA-independent pathway. Science. 293:2111–2114. [DOI] [PubMed] [Google Scholar]
- 13.Gross, J.A., S.R. Dillon, S. Mudri, J. Johnston, A. Littau, R. Roque, M. Rixon, O. Schou, K.P. Foley, H. Haugen, et al. 2001. TACI-Ig neutralizes molecules critical for B cell development and autoimmune disease: impaired B cell maturation in mice lacking Blys. Immunity. 15:289–302. [DOI] [PubMed] [Google Scholar]
- 14.Thompson, J.S., S.A. Bixler, F. Qian, K. Vora, M.L. Scott, T.G. Cachero, C. Hession, P. Schneider, I.D. Sizing, C. Mullen, et al. 2001. BAFF-R, a newly identified TNF receptor that specifically interacts with BAFF. Science. 293:2108–2111. [DOI] [PubMed] [Google Scholar]
- 15.Yan, M., S.A. Marsters, I.S. Grewal, H. Wang, A. Ashkenazi, and V.M. Dixit. 2000. Identification of a receptor for BlyS demonstrates a crucial role in humoral immunity. Nat. Immunol. 1:37–41. [DOI] [PubMed] [Google Scholar]
- 16.von Bulow, G.-U., J.M. van Deursen, and R.J. Bram. 2001. Regulation of the T-independent humoral response by TACI. Immunity. 14:573–582. [DOI] [PubMed] [Google Scholar]
- 17.Yan, M., H. Wang, B. Chan, M. Roose-Girma, S. Erickson, T. Baker, D. Tumas, I.S. Grewal, and V.M. Dixit. 2001. Activation and accumulation of B cells in TACI-deficient mice. Nat. Immunol. 2:638–643. [DOI] [PubMed] [Google Scholar]
- 18.Clevers, H.C., and R. Grosschedl. 1996. Transcriptional control of lymphoid development: lessons from gene targeting. Immunol. Today. 17:336–343. [DOI] [PubMed] [Google Scholar]
- 19.Ghosh, S., M.J. May, and E.B. Kopp. 1998. NF-κB and Rel proteins:evolutionarily conserved mediators of immune responses. Annu. Rev. Immunol. 16:225–260. [DOI] [PubMed] [Google Scholar]
- 20.Wallach, D., E.E. Varfolomeev, N.L. Malinin, Y.V. Goltsev, A.V. Kovalenko, and M.P. Boldin. 1999. Tumor necrosis factor receptor and Fas signaling mechanisms. Annu. Rev. Immunol. 17:331–367. [DOI] [PubMed] [Google Scholar]
- 21.Tumang, J.R., A. Owyang, S. Andjelic, Z. Jin, R.R. Hardy, M.-L. Liou, and H.-C. Liou. 1998. C-Rel is essential for B lymphocyte survival and cell cycle progression. Eur. J. Immunol. 28:4299–4312. [DOI] [PubMed] [Google Scholar]
- 22.Grumont, R.J., I.J. Rourke, L.A. O'Reilly, A. Strasser, K. Miyake, W. Sha, and S. Gerondakis. 1998. B lymphocytes differentially use the Rel and nuclear factor κB1 (NF-κB1) transcription factors to regulate cell cycle progression and apoptosis in quiescent and mitogen-activated cells. J. Exp. Med. 187:663–674. [DOI] [PMC free article] [PubMed] [Google Scholar]
- 23.Owyang, A.M., J.R. Tumang, B.R. Schram, C.Y. Hsia, T.W. Behrens, T.L. Rothstein, and H.-C. Liou. 2001. c-Rel is required for the protection of B cells from antigen receptor-mediated, but not Fas-mediated, apoptosis. J. Immunol. 167:4948–4956. [DOI] [PubMed] [Google Scholar]
- 24.Pan, G., J.H. Bauer, V. Haridas, S. Wang, D. Liu, G. Yu, C. Vincenz, B.B. Aggarwal, J. Ni, and V. M. Dixit. 1998. Identification and functional characterization of DR6, a novel death domain-containing TNF receptor. FEBS. 431:351–356. [DOI] [PubMed] [Google Scholar]
- 25.Liu, J., S. Na, A. Glasebrook, N. Fox, P.J. Solenberg, Q. Zhang, H.Y. Song, and D.D. Yang. 2001. Enhanced CD4+ T cell proliferation and Th2 cytokine production in DR6-deficient mice. Immunity. 15:23–34. [DOI] [PubMed] [Google Scholar]
- 26.Zhao, H., M. Yan, H. Wang, S. Erickson, I.S. Grewal, and V.M. Dixit. 2001. Impaired c-Jun amino terminal kinase activity and T cell differentiation in death receptor 6–deficient mice. J. Exp. Med. 194:1441–1448. [DOI] [PMC free article] [PubMed] [Google Scholar]
- 27.Lyons, A.B., and C.R. Parish. 1994. Determination of lymphocyte division by flow cytometry. J. Immunol. Methods. 171:131–137. [DOI] [PubMed] [Google Scholar]
- 28.Liu, J., D. Bramblett, Q. Zhu, M. Lozano, R. Kobayashi, S. Ross, and J.P. Dudley. 1997. The matrix-binding protein SATB1 participates in negative regulation of tissue-specific MMTV expression. Mol. Cell. Biol. 9:5275–5287. [DOI] [PMC free article] [PubMed] [Google Scholar]
- 29.Kozono, Y., R. Abe, H. Kozono, R.G. Kelly, T. Azuma, and V.M. Holers. 1998. Cross-linking CD21/CD35 or CD19 increases both B7-1 and B7-2 expression on murine splenic B cells. J. Immunol. 160:1565–1572. [PubMed] [Google Scholar]
- 30.Sheehan, D.C., and B.B. Hrapchak. 1980. Theory and Practice of Histotechnology. Second Edition. Battelle Press, Columbus/Richland. 481 pp.
- 31.Box, G.E.P., and D.R. Cox. 1964. An analysis of transformations. J. R. Stat. Soc. Ser. B. 26:211–243. [Google Scholar]
- 32.Grumont, R.J., I.J. Rourke, and S. Gerondakis. 1998. Rel-dependent induction of A1 transcription is required to protect B cells from antigen receptor ligation-induced apoptosis. Genes Dev. 13:400–411. [DOI] [PMC free article] [PubMed] [Google Scholar]
- 33.Chen, C., L.C. Edelstein, and C. Gelinas. 2000. The Rel/NF-κB family directly activates expression of the apoptosis inhibitor Bcl-x(L). Mol. Cell. Biol. 20:2687–2695. [DOI] [PMC free article] [PubMed] [Google Scholar]
- 34.Rivera, A., C.-C. Chen, N. Ron, J.P. Dougherty, and Y. Ron. 2001. Role of B cells as antigen-presenting cells in vivo revisited: antigen-specific B cells are essential for T cell expansion in lymph nodes and for systemic T cell responses to low antigen concentrations. Int. Immunol. 13:1583–1593. [DOI] [PubMed] [Google Scholar]
- 35.Calderhead, D.M., Y. Kosaka, E.M. Manning, and R.J. Noelle. 2000. CD40-CD154 interactions in B-cell signaling. Curr. Top. Microbiol. Immunol. 245:73–99. [DOI] [PubMed] [Google Scholar]
- 36.Ho, W.Y., M.P. Cooke, C.C. Goodnow, and M.M. Davis. 1994. Resting and anergic B cells are defective in CD28-dependent costimulation of naive CD4+ T cells. J. Exp. Med. 179:1539–1549. [DOI] [PMC free article] [PubMed] [Google Scholar]
- 37.Evans, D.E., M.W. Munks, J.M. Purkerson, and D.C. Parker. 2000. Resting B lymphocytes as APC for naive T lymphocytes: dependence on CD40 ligand/CD40. J. Immunol. 164:688–697. [DOI] [PubMed] [Google Scholar]
- 38.Kawabe, T., T. Naka, K. Yoshida, T. Tanaka, H. Fujiwara, S. Suematsu, N. Yoshida, T. Kishimoto, and H. Kikutani. 1994. The immune responses in CD40-deficient mice: impaired immunoglobulin class switching and germinal center formation. Immunity. 1:167–178. [DOI] [PubMed] [Google Scholar]
- 39.Borrow, P., A. Tishon, S. Lee, J. Xu, I.S. Grewal, M.B. Oldstone, and R.A. Flavell. 1996. CD40L-deficient mice show deficits in antiviral immunity and have an impaired memory CD8+ CTL response. J. Exp. Med. 183:2129–2142. [DOI] [PMC free article] [PubMed] [Google Scholar]
- 40.Law, C.L., A. Craxton, K.L. Otipoby, S.P. Sidorenko, S.J. Klaus, and E.A. Clark. 1996. Regulation of signaling through B-lymphocyte antigen receptors by cell-cell interactions. Immunol. Rev. 153:123–154. [DOI] [PubMed] [Google Scholar]
- 41.Croft, M., and C. Dubey. 1997. Accessory molecule and costimulation requirements for CD4 T cell responses. Crit. Rev. Immunol. 17:89–118. [DOI] [PubMed] [Google Scholar]
- 42.Cory, S. 1995. Regulation of lymphocyte survival by the Bcl-2 gene family. Annu. Rev. Immunol. 13:513–543. [DOI] [PubMed] [Google Scholar]
- 43.Greenfield, E.A., K.A. Nguyen, and V.K. Kuchroo. 1998. CD28/B7 costimulation: a review. Crit. Rev. Immunol. 18:389–418. [DOI] [PubMed] [Google Scholar]
- 44.Kasprowicz, D.J., A.P. Kohm, M.T. Berton, A.J. Chruscinski, A. Sharpe, and V.M. Sanders. 2000. Stimulation of the B cell receptor, CD86 (B7-2), and the b2-adrenergic receptor intrinsically modulates the level of IgG1 and IgE produced per B cell. J. Immunol. 165:680–690. [DOI] [PubMed] [Google Scholar]
- 45.Suvas, S., V. Singh, S. Sahdev, H. Vohra, and J.N. Agrewala. 2002. Distinct role of CD80 and CD86 in the regulation of the activation of B cell and B cell lymphoma. J. Biol. Chem. 277:7766–7775. [DOI] [PubMed] [Google Scholar]
- 46.Stevens, T.L., A. Bossie, V.M. Sanders, R. Fernandez-Botran, R.L. Coffman, T.R. Mosmann, and E.S. Vitetta. 1988. Regulation of antibody isotype secretion by subsets of antigen-specific helper T cells. Nature. 334:255–258. [DOI] [PubMed] [Google Scholar]
- 47.Finkelman, F.D., J. Holmes, I.M. Katona, J.F. Urban, J.P. Beckmann, L.S. Park, K.A. Schooley, R.L. Coffman, T.R. Mosmann, and W.E. Paul. 1990. Lymphokine control of in vivo immunoglobulin isotype selection. Annu. Rev. Immunol. 8:303–333. [DOI] [PubMed] [Google Scholar]
- 48.Ferguson, S.E., S. Han, G. Kelsoe, and C.B. Thompson. 1996. CD28 is required for germinal center formation. J. Immunol. 156:4576–4581. [PubMed] [Google Scholar]
- 49.Fagarasan, S., and T. Honjo. 2000. T-independent immune response: new aspects of B cell biology. Science. 290:89–92. [DOI] [PubMed] [Google Scholar]
