Receptor Avidity and Costimulation Specify the Intracellular Ca2+ Signaling Pattern in Cd4+Cd8+ Thymocytes (original) (raw)
Abstract
Thymocyte maturation is governed by antigen–T cell receptor (TCR) affinity and the extent of TCR aggregation. Signals provided by coactivating molecules such as CD4 and CD28 also influence the fate of immature thymocytes. The mechanism by which differences in antigen–TCR avidity encode unique maturational responses of lymphocytes and the influence of coactivating molecules on these signaling processes is not fully understood. To better understand the role of a key second messenger, calcium, in governing thymocyte maturation, we measured the intracellular free calcium concentration ([Ca2+] i) response to changes in TCR avidity and costimulation. We found that TCR stimulation initiates either amplitude- or frequency-encoded [Ca2+]i changes depending on (a) the maturation state of stimulated thymocytes, (b) the avidity of TCR interactions, and (c) the participation of specific coactivating molecules. Calcium signaling within immature but not mature thymocytes could be modulated by the avidity of CD3/CD4 engagement. Low avidity interactions induced biphasic calcium responses, whereas high avidity engagement initiated oscillatory calcium changes. Notably, CD28 participation converted the calcium response to low avidity receptor engagement from a biphasic to oscillatory pattern. These data suggest that calcium plays a central role in encoding the nature of the TCR signal received by thymocytes and, consequently, a role in thymic selection.
Keywords: selection, avidity, TCR, CD4, CD28
Thymocyte development is governed by interactions between Ags, expressed on the surface of stromal cells within the thymus, and TCRs. CD4+CD8+ double-positive (DP)1 thymocytes are primary targets of selection events that shape the T cell repertoire. The fate of a DP thymocyte is determined both by the affinity of Ag–TCR engagement and by the extent of receptor aggregation induced by this interaction, influences collectively referred to as avidity 1 2 3. Thus, high avidity Ag–TCR interactions are required for the removal of developing thymocytes from the T cell pool (negative selection), whereas lower avidity TCR–Ag interactions initiate maturation (positive selection) 4. The signaling processes evoked by high or low avidity engagement and the subsequent steps leading to different developmental responses are not fully understood.
TCR engagement alone appears insufficient to promote either cell death or differentiation, regardless of the affinity of the interaction. Coactivating/costimulating molecules engaged by ligands expressed on stromal cells cooperate with the TCR to determine the fate of immature DP thymocytes. For example, signals provided by the TCR and CD2 or CD4 induce positive selection of CD4+CD8+ thymocytes in vitro 5 6. Negative selection of CD4+CD8+ thymocytes also requires a second signal, which can be provided by the costimulatory molecule CD28 7 8 9.
Calcium has been implicated as an essential second messenger during lymphocyte maturation and differentiation 10 11 12 13. Unique calcium signaling responses are associated with distinct patterns of transcription factor expression or maturation. For example, in thymocytes, the mean amplitude of antigen-induced calcium signals and the developmental fate vary with the affinity of an Ag–TCR interaction 14. In these cells, high affinity peptide–TCR interactions evoke high amplitude calcium elevations and negative selection, whereas low affinity peptide–TCR interactions evoke low amplitude calcium elevations and positive selection. In naive peripheral B lymphocytes, the amplitude of experimentally regulated calcium elevations determines which transcription factors are activated 15, whereas in resting peripheral human T lymphocytes, oscillating intracellular calcium (Ca2+i) changes induce specific transcription factors by reducing their effective threshold for calcium activation 16. Different calcium signaling responses may also underlie distinct functional states of lymphocytes. For example, antigen evokes a biphasic calcium response in naive B cells but induces calcium oscillations in tolerant B cells 17. These data collectively suggest that amplitude- and frequency-modulated calcium signals can encode distinct cellular responses of lymphocytes. However, the receptor interactions that define each pattern of calcium signaling are not fully understood.
Given that immature CD4+CD8+ thymocytes exhibit distinct developmental responses depending upon the nature of the TCR signal they receive, we examined the calcium responses to distinct TCR-mediated signals. We show that TCR signaling can be encoded either as amplitude differences or oscillatory changes in Ca2+i depending on (a) the maturation state of the stimulated thymocytes, (b) the avidity of an TCR interaction, and (c) the coreceptor involved in the engagement.
Materials and Methods
Thymocyte Preparation.
Thymi were obtained from adult or fetal C57Bl/6 mice. Intact lobes were placed in a small volume of DMEM without NaHCO3 and phenol red. The tonicity of the basal medium was adjusted to 310 mOsm with ∼1.6 g of NaCl per liter and supplemented with 10 mM Hepes buffer, 5% heat-inactivated fetal bovine serum, and 1 mM l-glutamine. Thymocytes were released by gently tearing open the capsule with small forceps. Noncellular material was removed by filtering this preparation through 70 mM nylon mesh. The filtered preparation was maintained at room temperature, and aliquots were used for calcium measurements without further manipulation.
Single-Cell Fluorescence Measurements.
Murine thymocytes were loaded with the cell-permeant calcium indicator fura-2 acetoxymethyl ester (AM, 3.0 μM; Molecular Probes, Inc.) in DMEM for 10 min at room temperature (25°C), placed into the recording chamber on an inverted fluorescent microscope (Nikon Inc.), and allowed to adhere to Poly-D-lysine (100 μg/ml; Sigma Chemical Co.) treated coverslips for 5 min. Ca2+ i was measured at room temperature unless indicated otherwise. We observed no measurable difference in the calcium signaling response at 25 vs. 37°C. mAbs to relevant surface receptors were added to thymocyte suspensions during the final 10 min of fura-2 loading. Excess extracellular fura-2 AM and unbound antibody was washed away by perfusing the microscope recording chamber with extracellular bath solution for 5 min. The bath solution consisted of 155 mM NaCl, 4.5 mM KCl, 2 mM CaCl2, 1 mM MgCl2, 5 mM glucose, and 10 mM Hepes and was adjusted to pH 7.4. Discrete bandwidth excitation light (340 ± 10 nm, 380 ± 10 nm) from a xenon source coupled to a computer-controlled monochromator (TILL; Applied Scientific Imaging) was directed to the epifluorescence attachment of the microscope through a small quartz fiber-optic guide. Excitation light was directed to the fluorescence objective (100×; Nikon Inc.) via a dichroic mirror. The emitted fluorescence from the fura-2–loaded cells passed through a 470-nm-long pass filter, and images were obtained with an intensified charge–coupled video camera (model C2400-68; Hammamatsu Phototonics) connected to the side port of the inverted microscope. Four fluorescent video images were averaged and digitized (0.5 Hz) with a video frame grabber (Matrox) using Metafluor acquisition and analysis software (Universal Imaging Corp.). Stored images were analyzed off-line using the Metafluor package. Within cursor-defined areas of interest, paired 340/380 images were background subtracted and the ratio was calculated. The absolute ratio values in the cursor-defined areas were exported into Microsoft Excel and converted to [Ca2+] 18. In situ calibration factors, R max (340/380 ratio obtained in presence of 5 μM ionomycin and 10 mM Ca2+), R min (340/380 ratio in presence of 5 μM ionomycin and excess EGTA), and F380max, and F380min (maximum and minimum 510 nm emission with 380 nm excitation) were determined. The values obtained for R min, R max, F380min, and F380max were 0.25, 20.0, 40, and 100, respectively, and a dissociation constant (K d) of 224 was used for fura-2.
Antibodies and Receptor Aggregation.
Biotin-conjugated mAbs specific for CD4 (RM4-5, PharMingen), TCR (H57-597), CD28 (37.51, PharMingen), CD5 (53-7.3, PharMingen), CD3 (145-2C11, PharMingen), and CD28 (37.51, PharMingen) were used to activate thymocytes. Calcium signaling responses were initiated by aggregating antibody-bound surface receptors with streptavidin, which was added to the recording chamber. For routine measurements, streptavidin was added to the bath at a final concentration of 0.25–0.5 μg/ml. In several calcium experiments, polystyrene microspheres (5 μM diameter; Interfacial Dynamics Corp.) were used to aggregate surface receptors. Cells were first treated with biotin-conjugated antibodies against relevant receptors (see Results), and these antibody-bound receptors were aggregated with streptavidin-coated (0.5–1.0 μg/ml) polystyrene microspheres (Interfacial Dynamics Corp.). Microspheres (106) were prepared by incubation (1.5 h, 37°C) with αCD28 (5 μg/ml) and/or αCD3 (1 μg/ml) and αCD4 (1μg/ml), and were rinsed three times with PBS containing 1% BSA. Antibody-treated microspheres were cultured at a 1:1 ratio with CD4+ CD8+ thymocytes. The functional responses were determined after 16–20 h of incubation.
Thymocyte Phenotyping.
In some experiments, after measuring Ca2+ i, surface CD4, CD8, and CD5 expression levels were determined for each cell. Antibodies (PharMingen) against CD8 (53-6.7, FITC), CD5 (53-7.3, PE) and CD4 (RM4-5, Cy-Chrome) were added directly to the microscope chamber (15 min, 25°C), and unbound antibody was removed by perfusion with bath solution (5 min). Digital images were collected sequentially for each fluorochrome. Three separate filter cubes (Chroma Technologies) were used to image FITC, PE, and Cy-Chrome fluorescence. These digital images were first used to determine the CD4/CD8 phenotype of each cell. The activation/maturation state of CD4+CD8+ thymocytes was further refined based upon the level of CD5 expression. A value for the CD5 fluorescence intensity was obtained at an intermediate focal plane for each cell in the image field to identify CD5low, CD5int, and CD5high cells. Thymocytes were grouped simply according to average percentages obtained for each population from flow cytometric analysis. Thus, 30% of cells with the lowest CD5 intensities were designated as CD5low cells, 55% of cells as CD5int., and 15% of cells as CD5high.
Results
TCR/CD3-mediated Maturation and Death Signals Induce Distinct Ca2+ i Signaling Responses.
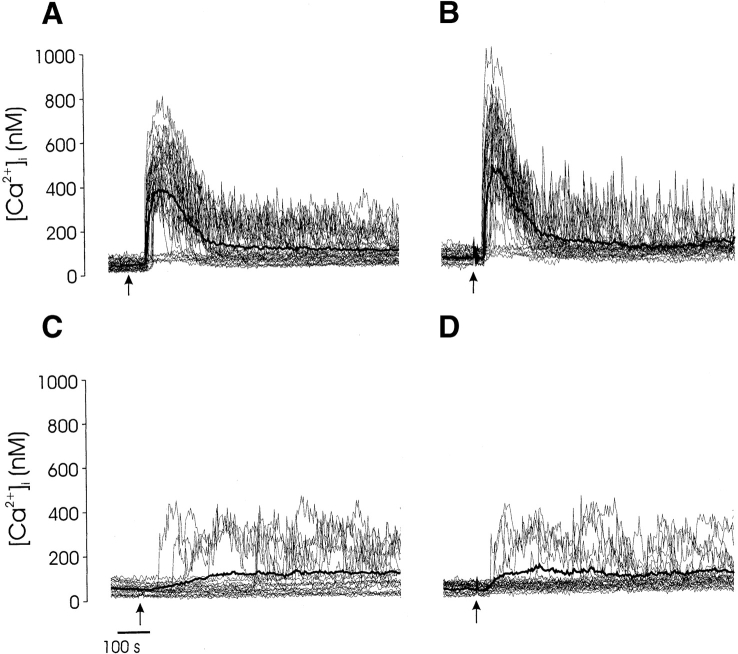
To determine whether distinct TCR-mediated stimuli evoke distinct calcium responses in immature T cells, we measured the intracellular free calcium concentration ([Ca2+]i) in individual thymocytes after coengagement of surface molecules that induce either maturation (CD4 and TCR or CD3; reference 5) or apoptosis (CD28 and TCR or CD3; reference 7). Each of these costimulatory receptors had a distinct effect on TCR/CD3-mediated Ca2+ signaling within individual thymocytes (Fig. 1). Maturation stimuli (TCR/CD4 or CD3/CD4) evoked two different patterns of calcium signaling. Responding cells (∼75%) typically exhibited an initial rapid [Ca2+]i elevation, which peaked within 30 s and decayed (Fig. 1A and Fig. B). After the initial rise, [Ca2+]i either decreased to an elevated steady state (biphasic response) or exhibited repetitive two- to fourfold elevations (spikes) above resting levels. In spiking cells, the frequency was similar for both CD3/CD4 (0.013 Hz)- and TCR/CD4 (0.010 Hz)-stimulated thymocytes (Fig. 1A and Fig. B). Apoptotic stimuli (CD3 and CD28 coengagement) evoked a limited [Ca2+]i response in a small proportion (∼25%) of thymocytes. Although [Ca2+ i] spikes were observed in a few CD3/CD28-stimulated cells (∼10%), none of these thymocytes exhibited a large initial [Ca2+]i transient (Fig. 1 C). Moreover, the response to CD3/CD28 was indistinguishable from the response to CD3 alone (Fig. 1 D).
Figure 1.
Thymocyte calcium signaling is dependent upon the coreceptor that is coengaged with TCR/CD3. Unfractionated murine thymocytes were incubated with biotin-conjugated antibodies to CD3 and CD4 (A), TCR and CD4 (B), CD3 and CD28 (C), and CD3 alone (D), and calcium signaling was initiated by the addition of streptavidin (0.5 μg/ml) to the recording chamber (arrow). Each panel is representative of similar results obtained in at least 10 separate experiments. The mean response of all cells is shown for each experiment (bold line).
The Pattern of Ca2+ Signaling Reflects the Thymocyte Maturation Status.
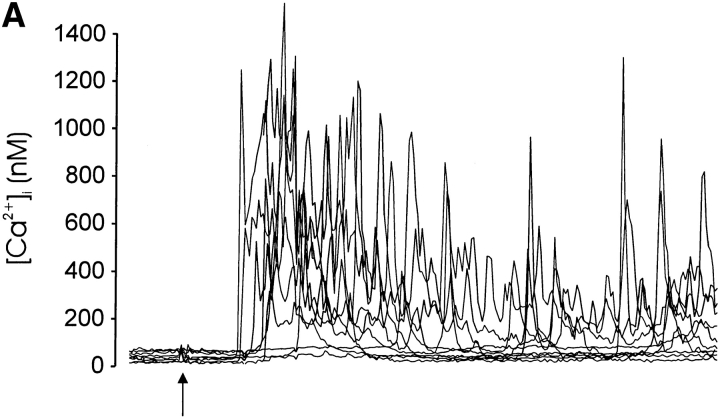
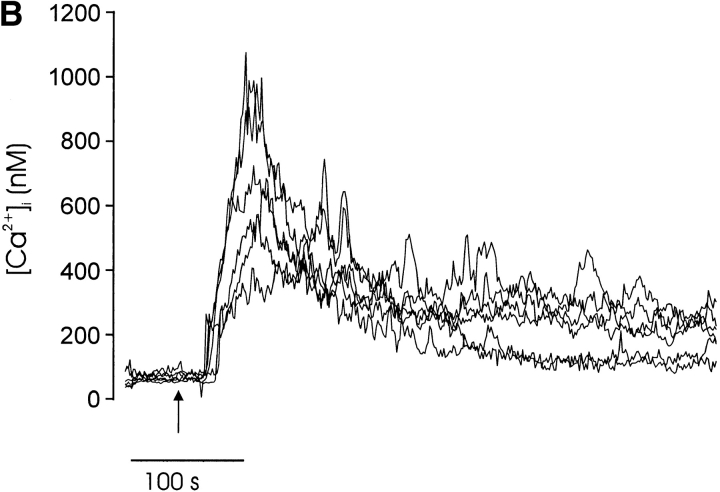
We were interested in examining the basis for the different patterns of CD3/CD4-mediated Ca2+ signaling and reasoned that they may reflect the responses of cells in different maturational states. We tested this hypothesis first by comparing [Ca2+]i signaling responses initiated by CD3/CD4 coengagement in two isolated populations representative of the most immature and mature TCR+ cells (Fig. 2). Immature thymocytes isolated from the day 17 fetal thymus contained no mature subpopulations and displayed a markedly homogeneous spiking [Ca2+]i response (Fig. 2 A). Conversely, all responding mature peripheral CD4+ T lymphocytes exhibited a biphasic [Ca2+]i response after CD3/CD4 coengagement, and [Ca2+]i spikes were never observed (Fig. 2 B). These results suggest that the TCR/CD3-mediated calcium response is determined, at least in part, by the maturation state of each lymphocyte.
Figure 2.
Different CD3/CD4-evoked calcium signaling patterns in mature and immature lymphocytes. Single-cell [Ca2+]i changes triggered by coaggregation of surface CD3 and CD4. (A) Thymocytes isolated from day 17 fetal thymi were stimulated by bath addition of streptavidin (0.5 mg/ml) at the indicated time (arrow). The majority of cells had either a CD4−CD8− (49.5%) or CD4+CD8+ (39.3%) phenotype. No TCRhigh cells were identified in these populations, although a proportion of DP thymocytes expressed intermediate levels of TCR (data not shown). Only responding thymocytes (17% of all cells) are shown. (B) Lymph node lymphocytes were labeled with biotin-conjugated anti-CD3 and anti-CD4 and were stimulated by bath addition of streptavidin (0.5 μg/ml; arrow) to the recording chamber. Shown is the response of several CD4+ cells, which were identified immediately after the Ca2+ i measurement by in situ staining with PE-conjugated anti-CD4 mAb. These responses are typical of at least three separate experiments.
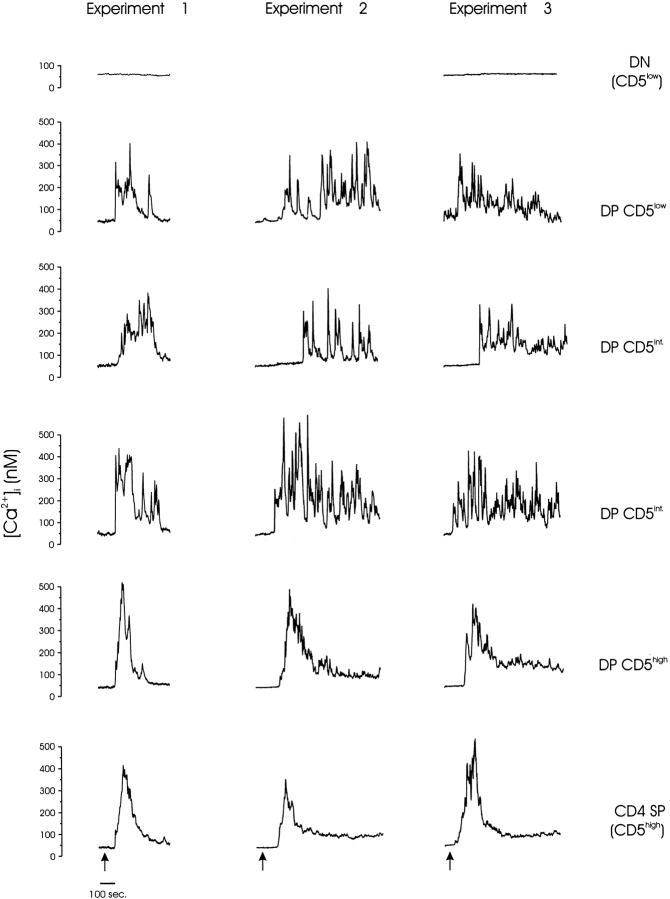
We next examined CD3/CD4-mediated signaling in each major thymocyte subpopulation to identify the precise maturational stage at which the [Ca2+]i signaling response changes from a spiking to a biphasic pattern. Rather than purify cells of each maturational state, we recorded CD3/CD4-initiated calcium responses within freshly isolated unfractionated thymocytes and subsequently determined the maturation phenotype of each cell. We were able to distinguish multiple thymocyte subpopulations at distinct developmental stages by staining for surface CD4, CD8, and CD5 (Fig. 3).
Figure 3.
TCR/CD4-mediated calcium responses of phenotypically defined thymocytes. Single-cell video imaging was used to measure Ca2+ i within all thymocytes in a 100× objective field. Biotin-conjugated, mAb-labeled surface CD3 and CD4 were aggregated by addition of streptavidin (0.5 μg/ml) to the bath chamber (arrows). The [Ca2+]i is plotted for individual thymocytes (identified in the bright field image by number) to demonstrate differences in the calcium signaling pattern associated with each maturation phenotype. The composite CD4/CD8/CD5 phenotype of each cell was determined by manually analyzing separate fluorescent images obtained for each receptor in situ, and the aggregate thymocyte phenotype is indicated. The cells shown are representative of all cells of similar phenotype in this experiment, and these data are from three similar experiments. Experiments 1 and 2 were performed at 25°C, and experiment 3 was performed at 37°C.
As expected, the most immature thymocytes (double negative, CD4−CD8−CD5low) did not respond to CD3/CD4 stimulation, presumably because they do not express CD3. Two subpopulations of CD4+CD8+ thymocytes were clearly distinguishable by differences in surface levels of the maturation/activation marker, CD5 19. Immature DP (CD4+CD8+CD5low/int) thymocytes, the bulk of immature T cells in the thymus, responded with an initial transient [Ca2+]i elevation followed by Ca2+ spikes. These [Ca2+]i spikes often originated from and returned to the resting baseline level and continued for more than 20 min. Mature CD4+CD8+CD5high thymocytes typically exhibited a biphasic [Ca2+]i change with little spiking activity, whereas the most mature (CD4+CD8−CD5high) thymocytes exhibited a pure biphasic response. These results suggest that the capacity of thymocytes to generate calcium spikes is developmentally restricted in the mouse to the immature CD4+CD8+ thymocyte stage.
Regulation of Calcium Oscillations in Immature Thymocytes by the Extent of Receptor Aggregation.
The molecular basis for different TCR/CD3-mediated developmental responses of CD4+CD8+ thymocytes is unknown but clearly governed by the strength of TCR engagement and could arise from differences in the proximal signals generated, including calcium. We therefore examined the relationship between the [Ca2+]i response pattern and the strength or avidity of the TCR signal. We quantitatively varied the signal strength in our system by modulating the extent of CD3/CD4 coaggregation. To do this, we systematically altered the concentration of streptavidin used to cross-link the stimulating (biotinylated) antibodies, thereby altering the degree of receptor aggregation. We reasoned that at high concentrations, streptavidin would tend to form monovalent complexes with biotin, whereas at limiting concentrations, the tetravalent streptavidin would form large complexes with multiple biotin molecules, resulting in aggregation of biotinylated antibodies and their ligands (Fig. 4 A).
Figure 4.
The effect of maturation and receptor aggregation on calcium signaling in thymocytes. Streptavidin was used to aggregate biotin-conjugated, mAb-labeled surface receptors and trigger calcium signaling within thymocytes. (A) Model of receptor aggregation by streptavidin. At high concentrations of streptavidin (right; streptavidin/biotin ratio >>1), the majority of streptavidin molecules should form monovalent complexes with biotin (stoichiometry of 1:1), resulting in minimal receptor aggregation. At lower streptavidin levels, the biotin/streptavidin stoichiometry will approach 4, resulting in higher receptor aggregation, although the overall number of receptors engaged would begin to decrease as streptavidin became limiting. Maximal receptor aggregation occurs over an intermediate range of streptavidin concentrations. (B) Thymocytes were labeled with biotin-conjugated anti-CD3 and anti-CD4, and separate aliquots were treated with different streptavidin concentrations (0.25–10 μg/ml). Available biotin and streptavidin binding sites were identified by incubating thymocytes with R670-conjugated streptavidin or PE-conjugated biotin, respectively. The relative maximum PE and R670 fluorescence intensities are plotted against the cross-linking streptavidin concentration.
To verify this strategy, we evaluated the extent of receptor aggregation by assessing the presence of unbound biotin molecules on antibody and unoccupied biotin-binding sites on streptavidin. We detected unbound biotin molecules and unoccupied biotin-binding sites by treating cells prepared for stimulation with R670-conjugated streptavidin (R670–SA) or PE-conjugated biotin (PE–biotin) (Fig. 4 B). Consistent with the notion that maximal receptor aggregation occurs at low streptavidin concentrations, PE–biotin bound minimally at limiting concentrations of aggregating streptavidin, indicating that biotin-binding sites were fully occupied (Fig. 4 B). Conversely, PE–biotin bound maximally at high streptavidin concentrations, indicating that biotin-binding sites on streptavidin were minimally occupied. We also measured R670–SA binding to unbound, antibody-associated biotin to precisely determine the concentrations of aggregating streptavidin at which all antibody-associated biotin was maximally engaged. R670–SA binding decreased progressively with increasing concentrations of aggregating streptavidin (Fig. 4 B), indicating that antibody-associated biotin was maximally engaged by aggregating streptavidin at concentrations exceeding 1.0 μg/ml.
These data suggest that maximal antibody (and by inference, receptor) aggregation will occur at a streptavidin concentration at which R670–SA and PE–biotin fluorescence are both minimal (i.e., when biotin and biotin binding sites are maximally engaged; Fig. 4 A). This occurs near the intersection of the curves (Fig. 4 B). Thus, optimal aggregation of CD3 and CD4 can be achieved at 0.25–0.75 μg/ml of aggregating streptavidin, whereas minimal aggregation will occur at relatively high streptavidin concentrations (5 μg/ml), when biotin-binding sites on streptavidin exceed available biotin. The model presents an idealized interpretation of how streptavidin can be used to vary the extent of receptor–antibody aggregation. It should be noted that primary antibodies used in these experiments are bivalent and could themselves cause a limited degree of cross-linking. Also, it is likely that even at very high concentrations, streptavidin would cross-link some antibody-bound receptors. Thus, we use the term minimal aggregation to describe this experimental condition.
Thymocyte Ca2+ Signaling Patterns Vary with the Extent of Receptor Aggregation.
To evaluate the relationship between receptor aggregation and calcium signaling, surface CD3 and CD4 were maximally (0.5 μg/ml streptavidin) or minimally (5.0 μg/ml streptavidin) aggregated, and calcium responses of individual thymocytes were grouped according to the level of CD5 expression, a sensitive measure of maturation status 19. The majority of immature, CD5low (CD4−CD8− and some CD4+CD8+) thymocytes were relatively nonresponsive to receptor aggregation. A few, presumably DP CD5low cells, exhibited calcium spikes (Fig. 5 A). The pattern of calcium signaling among these CD5low responders was converted to a monophasic pattern under conditions of minimal receptor aggregation (Fig. 5 B).
Figure 5.
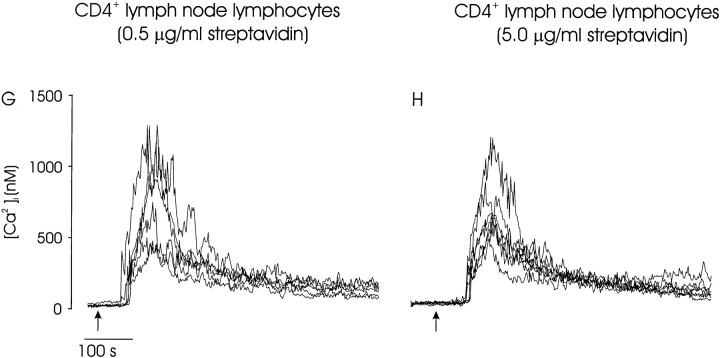
The effect of receptor aggregation on calcium signaling. Ca2+ i signaling was induced by CD3/CD4 coaggregation in thymocytes and peripheral CD4+ lymphocytes under maximal (0.5 μg/ml) and minimal (5.0 μg/ml) aggregating conditions. The calcium responses of thymocytes are plotted together for cells expressing low (A and B), intermediate (C and D), or high (E and F) levels of CD5. Several representative traces are shown for each phenotype, and the mean response of all cells is indicated (bold line). The CD3/CD4-mediated calcium response in mature peripheral CD4+ lymphocytes is insensitive to the receptor aggregation status. Calcium signaling was triggered by engagement of CD3 and CD4 with low (0.5 μg/ml; G) or high (5.0 μg/ml; H) streptavidin. CD4+ cells were identified within unpurified lymph node preps at the conclusion of the calcium measurement with PE-conjugated anti-CD4. Several representative traces are shown for each condition. These data are representative of at least three separate experiments for each condition.
The Ca2+ i signaling pattern in immature, CD5int (CD4+ CD8+) thymocytes was also markedly affected by the extent of receptor/coreceptor aggregation. Maximal receptor aggregation (0.5 μg/ml streptavidin) induced a relatively rapid initial elevation of [Ca2+]i, similar to that observed in mature cells. However after ∼1 min, [Ca2+]i decayed from its peak level and a spiking (0.019 Hz) signaling response persisted in most (26/45) responding cells (Fig. 5 C). Minimal aggregation of CD3 and CD4 receptors (5 μg/ml streptavidin) on immature DP thymocytes evoked a biphasic [Ca2+]i increase in all responding cells. The initial mean [Ca2+]i peak was higher than under maximally aggregating conditions; however, the [Ca2+]i decayed to an elevated steady state (Fig. 5 D), similar to nonspiking mature peripheral cells (Fig. 2 B).
Aggregation of CD3 and CD4 evoked a biphasic calcium signaling response in mature CD5high thymocytes that was largely independent of the receptor aggregation status. (Fig. 5E and Fig. F). The only significant effect of aggregation on mature cells was a higher mean peak [Ca2+]i (Fig. 5, bold line) induced under conditions of maximal receptor engagement but minimal receptor aggregation. Mature peripheral CD4+ lymph node lymphocytes responded similarly to mature thymocytes. Peripheral CD4+ cells exhibited a biphasic calcium signaling response regardless of the streptavidin concentration used for stimulation (Fig. 5G and Fig. H). Thus, only DP CD5low and CD5int thymocytes have the capacity to vary their calcium responses to changes in TCR avidity.
CD28 Enhances the Calcium Response to CD3/CD4 Coaggregation.
For most thymocytes, CD4 is functionally dissociated from the TCR complex due to its engagement by MHC class II expressed on thymic epithelium. This dissociation inhibits the participation of CD4-associated tyrosine kinase Lck in TCR signaling 20. Thus, freshly isolated immature CD4+CD8+ thymocytes do not respond to isolated TCR/CD3 signals and require CD4 costimulation to induce a calcium response (Fig. 1 D). Coengagement of TCR/CD3 and coactivators such as CD4 allow Lck to participate in TCR signaling (Fig. 1 A; reference 21).
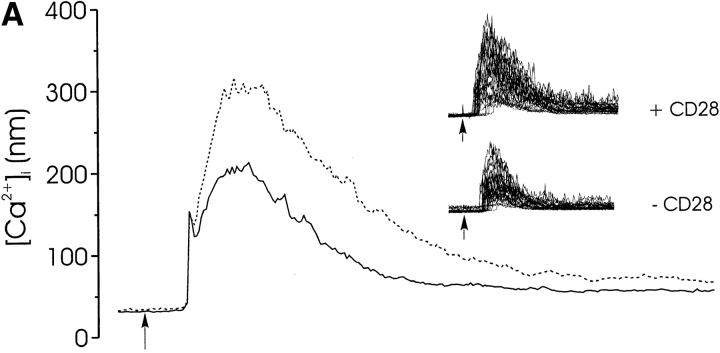
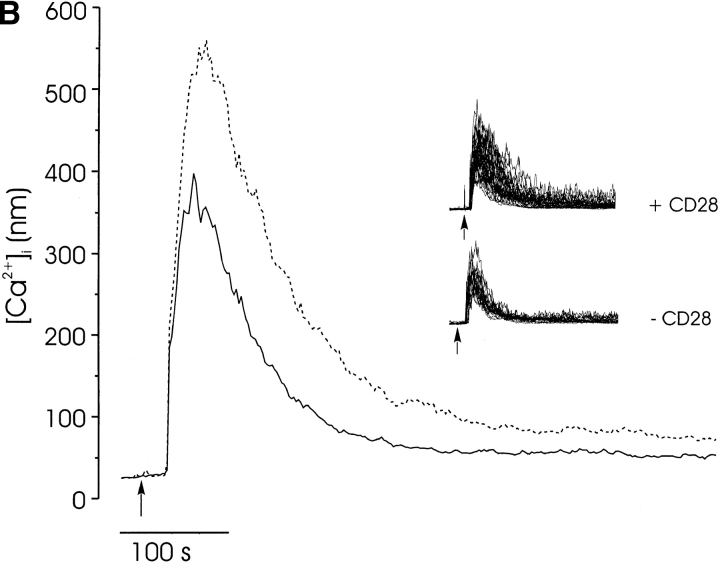
CD28 does not cooperate with the TCR to induce a calcium response in freshly isolated lymphocytes (Fig. 1) because it does not recruit Lck to the complex 22. To determine whether CD28 signaling could modulate the TCR-mediated [Ca2+]i response when Lck was available, we examined the calcium response to coengagement of CD3, CD4, and CD28. The amplitude of the initial calcium rise was significantly higher in the presence of CD28 costimulation (Fig. 6, broken lines) than in its absence (solid lines). This was true both at maximally (Fig. 6 A; 1.0 μg/ml streptavidin) and minimally (Fig. 6 B; 5 μg/ml streptavidin) aggregating concentrations of streptavidin. Interestingly, CD28 significantly enhanced the spiking activity of thymocytes, even at high concentrations of streptavidin (Fig. 6 B, inset), when spikes are not ordinarily observed.
Figure 6.
The effect of CD28 on the calcium response to CD3/CD4 aggregation. The calcium responses of CD4+CD8+ thymocytes were triggered by coengagement of CD3, CD4, (solid line), and CD28 (broken line) induced by high (1.0 μg/ml streptavidin; A) and low (5.0 μg/ml streptavidin; B) receptor aggregation. The mean response is shown, as well as the responses of individual cells (inset). This effect of CD28 on calcium was observed in three separate experiments.
Thus, although CD28 alone cannot cooperate with CD3/TCR to generate calcium signals in immature thymocytes, it does modify the CD3/CD4 response. In fact, CD28 costimulation appears to mimic the effect of increased receptor aggregation on calcium signaling, even under conditions of minimal aggregation.
Calcium Signaling Patterns Correlate with Thymocyte Death.
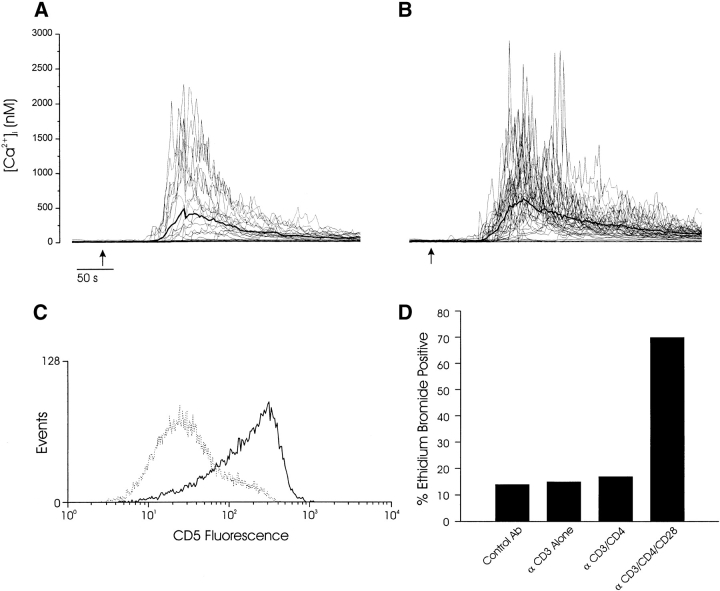
The observed correlation between receptor avidity/aggregation and calcium signaling and the ability of CD28 to convert biphasic to spiking responses is consistent with an underlying role for calcium in thymocyte fate determination. Because the in vitro induction of thymocyte death and maturation requires immobilized antibody, we used microspheres to cross-link the TCR complex and coreceptors in parallel calcium signaling and thymocyte maturation experiments. Using this approach, coaggregation of CD3 and CD4 evoked a biphasic calcium response (Fig. 7 A) similar to that evoked by high concentrations of soluble streptavidin (Fig. 5D and Fig. F, and Fig. 6 B). Coengagement of CD3, CD4, and CD28 resulted in a spiking calcium response within many cells and a greater elevation in the mean peak and plateau [Ca2+]i compared with CD3/CD4 stimulation (Fig. 7 B). This effect of CD28 was similar to the CD28-mediated augmentation of the calcium signal after aggregation with soluble streptavidin (Fig. 6).
Figure 7.
Correlation between calcium signaling response and thymocyte fate. Calcium signaling responses of single thymocytes after aggregation of (A) CD3 and CD4 or (B) CD3, CD4, and CD28 with streptavidin-coated microspheres (see Materials and Methods). The mean calcium response is indicated in each plot with a bold line. The thymocyte/microsphere ratio was ∼1:1, and all responding cells contacted a single microsphere. In these experiments, 1/18 cells (A) exhibited a single spike subsequent to the initial transient [Ca2+]i elevation, whereas 18/32 responding cells (B) exhibited one or more calcium spikes ≥50% of the initial peak [Ca2+]i. Arrows indicate the times when microspheres were added to the recording chamber. (C) CD3/CD4-coated microspheres induced increased CD5 expression (solid line) compared with control antibody–treated cells (broken line) but not apoptosis (D, third bar from left). (D) CD3-, CD4-, and CD28-coated microspheres induced a significant increase in the number of apoptotic cells. These maturation and calcium results are representative of at least three separate experiments with microspheres.
We next examined the effect of CD3, CD4, and CD28 stimulation on CD4+CD8+ thymocyte fate in vitro. Consistent with previous studies using plate-bound antibody, microspheres treated with CD3 and CD4 induced activation of all thymocytes (as reflected by upregulation of CD5; Fig. 7 C) but not death (Fig. 7 D). CD28 coengagement caused a marked and specific increase in thymocyte death. (Fig. 7 D).
Discussion
In this report, we demonstrate that TCR/CD3-mediated Ca2+ signaling patterns differ in developing thymocytes depending on (a) the maturation stage, (b) the extent of TCR aggregation, and (c) the participation of costimulatory or coactivating molecules. Notably, immature CD4+CD8+ thymocytes, whose developmental responses are known to vary with the nature of TCR signals, have the unique capacity to decode distinct TCR signals by generating distinct calcium responses. Our data demonstrate that low avidity TCR engagement of CD4+CD8+ thymocytes initiated a single biphasic Ca2+ signal, whereas high avidity TCR engagement initiated an oscillatory or spiking Ca2+ signaling pattern.
We observed markedly heterogeneous Ca2+ signaling patterns within thymocytes after CD3/CD4 aggregation and found that these signaling differences correlated with the thymocyte developmental stage. As one might expect, the most immature thymocytes (CD4−CD8−CD5low), which express little if any TCR on their surfaces, did not respond to TCR stimulation. Mature thymocyte populations (CD4+CD8−CD5high and CD4+CD8+CD5high) exhibited a biphasic Ca2+ signaling response that was also typical of mature peripheral T cells. In contrast, immature CD4+ CD8+ cells (CD4+CD8+CD5low and CD4+CD8+CD5int), the targets of most selection events that occur within the thymus, could vary their Ca2+ signaling responses. Immature DP thymocytes typically exhibited an initial transient elevation of [Ca2+]i after receptor aggregation that subsequently decayed to an elevated steady state or oscillated depending upon the degree of receptor aggregation. Within a homogeneously immature population of fetal thymocytes, CD3/CD4 evoked only Ca2+ i spikes in responding cells. In contrast, [Ca2+]i spikes could not be evoked in mature, peripheral murine T cells regardless of the extent of TCR/CD3 aggregation. Together, these data indicate that the capacity to generate Ca2+ spikes is restricted to immature CD4+CD8+ thymocytes.
The ability to generate biphasic or oscillatory Ca2+ i signaling responses based upon the extent of TCR/CD3 aggregation is a unique characteristic of immature CD4+ CD8+ thymocytes, which suggests that Ca2+ could play a role in determining the developmental fate of these cells. CD4+CD8+ thymocytes are the targets of both negative and positive selection and will die or differentiate depending on the nature of the TCR signal they receive. Although the precise mechanism by which TCR engagement can specify negative and positive developmental responses is unknown, data clearly suggest that differences in TCR affinity and aggregation, collectively referred to as avidity, are key 1 4. Receptor avidity and the maturational response are modulated by subtle structural alterations in peptide ligands. This ability of similar peptide ligands to induce positive or negative selection also correlates with the mean amplitude of the calcium response evoked by each ligand 14 23.
By varying the concentration of our receptor-engaging reagent, streptavidin, we have been able to modulate the extent of TCR/CD3 aggregation and, hence, mimic differences in antigen–TCR avidity. We find that avidity differences can be translated into distinct patterns of Ca2+ signaling within thymocytes. High avidity TCR interactions, such as those associated with negative selection of DP thymocytes, evoked [Ca2+]i spikes and an elevation in the mean [Ca2+]i amplitude, whereas low avidity interactions, which are associated with positive selection, initiated a biphasic calcium signal. These findings imply that signals that induce Ca2+ spikes will induce thymocyte apoptosis, whereas those that generate a single biphasic response will initiate maturation. It should be noted that semimature CD4+HSAhigh cells can also undergo negative selection 24 25. We did not look specifically at the calcium responses of this population; however, we did not observe spiking responses in CD4+ single-positive cells. Thus, negative selection of CD4+HSAhigh thymocytes likely occurs by a distinct mechanism from immature DP thymocytes.
Interestingly, the biphasic Ca2+ signal generated by low avidity CD3 and CD4 engagement was converted to a spiking pattern by CD28, which provides an apoptotic signal in thymocytes 7 8 9. CD28 also increased the peak amplitude of Ca2+ i oscillations and the mean [Ca2+]i after high avidity engagement of CD3/CD4. These data are consistent with the observation that peptides capable of triggering negative selection cause higher mean amplitude calcium elevations than those that trigger positive selection 14. The mechanism underlying this effect of CD28 may be related to a recent observation that CD28 engagement amplifies TCR-mediated signaling 26 by promoting the redistribution and clustering of activation molecules, possibly within kinase-rich microdomains 27, at the site of TCR engagement. Thus CD28-mediated amplification of calcium spiking activity in thymocytes may reflect its ability to change the structure and makeup of the TCR signaling complex.
Our data are consistent with previous studies indicating that TCR/CD3 engagement with CD2 or CD4 induces maturation to the CD4 lineage in vitro 5. In fact, TCR engagement without aggregation is associated with positive selection 28. In these previous studies, stimulation was provided by saturating levels of plate-bound rather than soluble antibody. In our system, positive selecting conditions induced by high levels of soluble streptavidin (maximal receptor engagement but minimal receptor aggregation) are associated with biphasic calcium signals. We also duplicated conditions that induce thymocyte activation versus death using antibody fixed to microspheres. These experiments demonstrated that a biphasic calcium signaling response is associated with cell activation and repetitive spikes are associated with thymocyte apoptosis.
The significance of these findings is underscored by recent studies indicating that calcium alone can specify different patterns of gene transcription in lymphocytes and that specificity is encoded in the amplitude and/or frequency of cytoplasmic Ca2+ changes 15 16 29. A variety of calcium-regulated protein kinases and phosphatases expressed by lymphocytes, including calcineurin, calmodulin-dependent kinase II (CaMKII) and protein kinase Cγ, could translate different Ca2+ i signaling patterns 30 31. Each is expressed in thymocytes and is responsive to TCR signals 32 33 34. Notably, CaMKII activity is modulated by the [Ca2+]i oscillation frequency 30. These or other calcium-sensitive enzymes, which can distinguish between calcium amplitude– or frequency–encoded receptor signals, may initiate different patterns of gene expression and specify distinct developmental fates.
The molecular basis for Ca2+ spikes has not been defined in murine or human thymocytes, although calcium oscillations have been extensively studied in human peripheral lymphocytes 35 36. It is generally accepted that [Ca2+]i initially increases due to inositol 1,4,5-trisphosphate–mediated release from intracellular stores and is sustained by extracellular influx. In primary human T cells, [Ca2+]i oscillations are initiated by transient feedback inhibition of rising calcium on its own influx 37 38, and [Ca2+]i levels are reduced by uptake into mitochondria and reuptake into the endoplasmic reticulum 39 40. As Ca2+ i falls, inhibition of its own influx is relieved. The net result is that [Ca2+]i increases and decreases due to the sequential and repetitive activation and inactivation of influx under conditions of constant TCR stimulation 36. In thymocytes, we found that both calcium spikes and steady state elevations in [Ca2+]i were inhibited by removal of extracellular calcium, suggesting that extracellular [Ca2+] plays a role in both signaling responses (data not shown).
Several additional mechanisms may determine the pattern of calcium signaling. For example, in human T lymphocytes the plasma membrane potential strongly influences the magnitude of calcium influx and, consequently, the pattern of signaling. Sequential activation and inactivation of voltage-dependent and calcium-activated potassium channels has been shown to rapidly modulate the membrane potential and the driving force for calcium influx 41. Other studies have demonstrated that ryanodine receptors play a role in the generation of calcium oscillations in human T cells 42 43. Finally, in human B lymphocytes, [Ca2+]i oscillations result from repetitive calcium release and reuptake into the endoplasmic reticulum, whereas sustained calcium elevations require extracellular calcium influx 44.
In summary, our data provide evidence that Ca2+ i, which is one of the most proximal molecular reflections of TCR signaling, underlies the ability of immature CD4+CD8+ thymocytes to distinguish between low and high avidity TCR signals. The unique ability of CD4+CD8+ thymocytes to generate distinct Ca2+ i signaling responses (depending upon the avidity of the TCR signal) strongly suggests that calcium plays a central role in regulating thymic selection.
Acknowledgments
We thank David Wiest and Andrew Wells for reading the manuscript and for helpful suggestions and Caroline Bishop for help with preliminary experiments.
Support was provided by National Institutes of Health grants AI-39678 (to B.D. Freedman and Q.H. Liu) and HL-45239 (to M.I. Kotlikoff), the Merck Scholars Program to Haverford College for S. Somersan, and National Science Foundation grant MCB-9728332 to J.A. Punt.
Footnotes
1used in this paper: DP, double-positive
References
- Ashton-Rickardt P.G., Bandeira A., Delaney J.R., Van Kaer L., Pircher H.P., Zinkernagel R.M., Tonegawa S. Evidence for a differential avidity model of T cell selection in the thymus. Cell. 1994;76:651–663. doi: 10.1016/0092-8674(94)90505-3. [DOI] [PubMed] [Google Scholar]
- Teh H.S., Motyka B., Teh S.J. Influence of the affinity of selecting ligands on T cell positive and negative selection and the functional maturity of the positively selected T cells. Crit. Rev. Immunol. 1997;17:399–410. [PubMed] [Google Scholar]
- Chidgey A.P., Boyd R.L. Positive selection of low responsive, potentially autoreactive T cells induced by high avidity, non-deleting interactions. Int. Immunol. 1998;10:999–1008. doi: 10.1093/intimm/10.7.999. [DOI] [PubMed] [Google Scholar]
- Ashton-Rickardt P.G., Tonegawa S. A differential-avidity model for T-cell selection. Immunol. Today. 1994;15:362–366. doi: 10.1016/0167-5699(94)90174-0. [DOI] [PubMed] [Google Scholar]
- Cibotti R., Punt J.A., Dash K.S., Sharrow S.O., Singer A. Surface molecules that drive T cell development in vitro in the absence of thymic epithelium and in the absence of lineage-specific signals. Immunity. 1997;6:245–255. doi: 10.1016/s1074-7613(00)80327-1. [DOI] [PubMed] [Google Scholar]
- Bommhardt U., Cole M.S., Tso J.Y., Zamoyska R. Signals through CD8 or CD4 can induce commitment to the CD4 lineage in the thymus. Eur. J. Immunol. 1997;27:1152–1163. doi: 10.1002/eji.1830270516. [DOI] [PubMed] [Google Scholar]
- Punt J.A., Osborne B.A., Takahama Y., Sharrow S.O., Singer A. Negative selection of CD4+CD8+ thymocytes by T cell receptor–induced apoptosis requires a costimulatory signal that can be provided by CD28. J. Exp. Med. 1994;179:709–713. doi: 10.1084/jem.179.2.709. [DOI] [PMC free article] [PubMed] [Google Scholar]
- Amsen D., Kruisbeek A.M. CD28-B7 interactions function to co-stimulate clonal deletion of double-positive thymocytes. Int. Immunol. 1996;8:1927–1936. doi: 10.1093/intimm/8.12.1927. [DOI] [PubMed] [Google Scholar]
- Kishimoto H., Cai Z., Brunmark A., Jackson M.R., Peterson P.A., Sprent J. Differing roles for B7 and intercellular adhesion molecule-1 in negative selection of thymocytes. J. Exp. Med. 1996;184:531–537. doi: 10.1084/jem.184.2.531. [DOI] [PMC free article] [PubMed] [Google Scholar]
- Abe R., Ishida Y., Yui K., Katsumata M., Chused T. T cell receptor–mediated recognition of self-ligand induces signaling in immature thymocytes before negative selection. J. Exp. Med. 1992;176:459–468. doi: 10.1084/jem.176.2.459. [DOI] [PMC free article] [PubMed] [Google Scholar]
- Nakayama T., Ueda Y., Yamada H., Shores E.W., Singer A., June C.H. In vivo calcium elevations in thymocytes with T cell receptors that are specific for self ligands. Science. 1992;257:96–99. doi: 10.1126/science.1621102. [DOI] [PubMed] [Google Scholar]
- Negulescu P.A., Shastri N., Cahalan M.D. Intracellular calcium dependence of gene expression in single T lymphocytes. Proc. Natl. Acad. Sci. USA. 1994;91:2873–2877. doi: 10.1073/pnas.91.7.2873. [DOI] [PMC free article] [PubMed] [Google Scholar]
- Kane L.P., Hedrick S.M. A role for calcium influx in setting the threshold for CD4+CD8+ thymocyte negative selection. J. Immunol. 1996;156:4594–4601. [PubMed] [Google Scholar]
- Mariathasan S., Bachmann M.F., Bouchard D., Ohteki T., Ohashi P.S. Degree of TCR internalization and Ca2+ flux correlates with thymocyte selection. J. Immunol. 1998;161:6030–6037. [PubMed] [Google Scholar]
- Dolmetsch R.E., Lewis R.S., Goodnow C.C., Healy J.I. Differential activation of transcription factors induced by Ca2+ response amplitude and duration. Nature. 1997;386:855–858. doi: 10.1038/386855a0. [DOI] [PubMed] [Google Scholar]
- Dolmetsch R.E., Xu K., Lewis R.S. Calcium oscillations increase the efficiency and specificity of gene expression. Nature. 1998;392:933–936. doi: 10.1038/31960. [DOI] [PubMed] [Google Scholar]
- Healy J.I., Dolmetsch R.E., Timmerman L.A., Cyster J.G., Thomas M.L., Crabtree G.R., Lewis R.S., Goodnow C.C. Different nuclear signals are activated by the B cell receptor during positive versus negative signaling. Immunity. 1997;6:419–428. doi: 10.1016/s1074-7613(00)80285-x. [DOI] [PubMed] [Google Scholar]
- Grynkiewicz G., Poenie M., Tsien R.Y. A new generation of Ca2+ indicators with greatly improved fluorescence properties. J. Biol. Chem. 1985;260:3440–3450. [PubMed] [Google Scholar]
- Azzam H.S., Grinberg A., Lui K., Shen H., Shores E.W., Love P.E. CD5 expression is developmentally regulated by T cell receptor (TCR) signals and TCR avidity. J. Exp. Med. 1998;188:2301–2311. doi: 10.1084/jem.188.12.2301. [DOI] [PMC free article] [PubMed] [Google Scholar]
- Wiest D.L., Yuan L., Jefferson J., Benveniste P., Tsokos M., Klausner R.D., Glimcher L.H., Samelson L.E., Singer A. Regulation of T cell receptor expression in immature CD4+CD8+ thymocytes by p56lck tyrosine kinasebasis for differential signaling by CD4 and CD8 in immature thymocytes expressing both coreceptor molecules. J. Exp. Med. 1993;178:1701–1712. doi: 10.1084/jem.178.5.1701. [DOI] [PMC free article] [PubMed] [Google Scholar]
- Haughn L., Gratton S., Caron L., Sekaly R.P., Veillette A., Julius M. Association of tyrosine kinase p56lck with CD4 inhibits the induction of growth through the alpha beta T-cell receptor. Nature. 1992;358:328–331. doi: 10.1038/358328a0. [DOI] [PubMed] [Google Scholar]
- Ward S.G. CD28a signalling perspective. Biochem. J. 1996;318:361–377. doi: 10.1042/bj3180361. [DOI] [PMC free article] [PubMed] [Google Scholar]
- Sebzda E., Wallace V.A., Mayer J., Yeung R.S., Mak T.W., Ohashi P.S. Positive and negative thymocyte selection induced by different concentrations of a single peptide. Science. 1994;263:1615–1618. doi: 10.1126/science.8128249. [DOI] [PubMed] [Google Scholar]
- Kishimoto H., Sprent J. Negative selection in the thymus includes semimature T cells. J. Exp. Med. 1997;185:263–271. doi: 10.1084/jem.185.2.263. [DOI] [PMC free article] [PubMed] [Google Scholar]
- Kishimoto H., Surh C.D., Sprent J. A role for Fas in negative selection of thymocytes in vivo. J. Exp. Med. 1998;187:1427–1438. doi: 10.1084/jem.187.9.1427. [DOI] [PMC free article] [PubMed] [Google Scholar]
- Wulfing C., Davis M.M. A receptor/cytoskeletal movement triggered by costimulation during T cell activation. Science. 1998;282:2266–2269. doi: 10.1126/science.282.5397.2266. [DOI] [PubMed] [Google Scholar]
- Viola A., Schroeder S., Sakakibara Y., Lanzavecchia A. T lymphocyte costimulation mediated by reorganization of membrane microdomains. Science. 1999;283:680–682. doi: 10.1126/science.283.5402.680. [DOI] [PubMed] [Google Scholar]
- Takahama Y., Suzuki H., Katz K.S., Grusby M.J., Singer A. Positive selection of CD4+ T cells by TCR ligation without aggregation even in the absence of MHC. Nature. 1994;371:67–70. doi: 10.1038/371067a0. [DOI] [PubMed] [Google Scholar]
- Li W., Llopis J., Whitney M., Zlokarnik G., Tsien R.Y. Cell-permeant caged InsP3 ester shows that Ca2+ spike frequency can optimize gene expression. Nature. 1998;392:936–941. doi: 10.1038/31965. [DOI] [PubMed] [Google Scholar]
- DeKoninck P., Schulman H. Sensitivity of CaM kinase II to the frequency of Ca2+ oscillations. Science. 1998;279:227–230. doi: 10.1126/science.279.5348.227. [DOI] [PubMed] [Google Scholar]
- Oancea E., Meyer T. Protein kinase C as a molecular machine for decoding calcium and diacylglycerol signals. Cell. 1998;95:307–318. doi: 10.1016/s0092-8674(00)81763-8. [DOI] [PubMed] [Google Scholar]
- Galandrini R., Albi N., Tripodi G., Zarcone D., Terenzi A., Moretta A., Grossi C.E., Velardi A. Antibodies to CD44 trigger effector functions of human T cell clones. J. Immunol. 1993;150:4225–4235. [PubMed] [Google Scholar]
- Manger B., Weiss A., Imboden J., Laing T., Stobo J.D. The role of protein kinase C in transmembrane signaling by the T cell antigen receptor complex. Effects of stimulation with soluble or immobilized CD3 antibodies. J. Immunol. 1987;139:2755–2760. [PubMed] [Google Scholar]
- Szamel M., Resch K. T-cell antigen receptor-induced signal-transduction pathways—activation and function of protein kinases C in T lymphocytes. Eur. J. Biochem. 1995;228:1–15. doi: 10.1111/j.1432-1033.1995.tb20221.x. [DOI] [PubMed] [Google Scholar]
- Hess S.D., Oortgiesen M., Cahalan M.D. Calcium oscillations in human T and natural killer cells depend upon membrane potential and calcium influx. J. Immunol. 1993;150:2620–2633. [PubMed] [Google Scholar]
- Dolmetsch R.E., Lewis R.S. Signaling between intracellular Ca2+ stores and depletion-activated Ca2+ channels generates [Ca2+]i oscillations in T lymphocytes. J. Gen. Physiol. 1994;103:365–388. doi: 10.1085/jgp.103.3.365. [DOI] [PMC free article] [PubMed] [Google Scholar]
- Zweifach A., Lewis R.S. Rapid inactivation of depletion-activated calcium current (ICRAC) due to local calcium feedback. J. Gen. Physiol. 1995;105:209–226. doi: 10.1085/jgp.105.2.209. [DOI] [PMC free article] [PubMed] [Google Scholar]
- Lewis R.S., Dolmetsch R.E., Zweifach A. Positive and negative regulation of depletion-activated calcium channels by calcium. Soc. Gen. Physiol. Ser. 1996;51:241–254. [PubMed] [Google Scholar]
- Hoth M., Fanger C.M., Lewis R.S. Mitochondrial regulation of store-operated calcium signaling in T lymphocytes. J. Cell Biol. 1997;137:633–648. doi: 10.1083/jcb.137.3.633. [DOI] [PMC free article] [PubMed] [Google Scholar]
- Launay S., Bobe R., Lacabaratz-Porret C., Bredoux R., Kovacs T., Enouf J., Papp B. Modulation of endoplasmic reticulum calcium pump expression during T lymphocyte activation. J. Biol. Chem. 1997;272:10746–10750. doi: 10.1074/jbc.272.16.10746. [DOI] [PubMed] [Google Scholar]
- Verheugen J.A., Vijverberg H.P. Intracellular Ca2+ oscillations and membrane potential fluctuations in intact human T lymphocytesrole of K+ channels in Ca2+ signaling. Cell Calcium. 1995;17:287–300. doi: 10.1016/0143-4160(95)90075-6. [DOI] [PubMed] [Google Scholar]
- Guse A.H., da Silva C.P., Berg I., Skapenko A.L., Weber K., Heyer P., Hohenegger M., Ashamu G.A., Schulze-Koops H., Potter B.V. Regulation of calcium signalling in T lymphocytes by the second messenger cyclic ADP-ribose. Nature. 1999;398:70–73. doi: 10.1038/18024. [DOI] [PubMed] [Google Scholar]
- Ricard I., Martel J., Dupuis L., Dupuis G., Payet M.D. A caffeine/ryanodine-sensitive Ca2+ pool is involved in triggering spontaneous variations of Ca2+ in Jurkat T lymphocytes by a Ca2+-induced Ca2+ release (CICR) mechanism. Cell Signal. 1997;9:197–206. doi: 10.1016/s0898-6568(96)00141-6. [DOI] [PubMed] [Google Scholar]
- Choquet D., Ku G., Cassard S., Malissen B., Korn H., Fridman W.H., Bonnerot C. Different patterns of calcium signaling triggered through two components of the B lymphocyte antigen receptor. J. Biol. Chem. 1994;269:6491–6497. [PubMed] [Google Scholar]
