The Role of Apoptosis in the Regulation of Hematopoietic Stem Cells: Overexpression of BCL-2 Increases Both Their Number and Repopulation Potential (original) (raw)
Abstract
Hematopoietic stem cells (HSC) give rise to cells of all hematopoietic lineages, many of which are short lived. HSC face developmental choices: self-renewal (remain an HSC with long-term multilineage repopulating potential) or differentiation (become an HSC with short-term multilineage repopulating potential and, eventually, a mature cell). There is a large overcapacity of differentiating hematopoietic cells and apoptosis plays a role in regulating their numbers. It is not clear whether apoptosis plays a direct role in regulating HSC numbers. To address this, we have employed a transgenic mouse model that overexpresses BCL-2 in all hematopoietic cells, including HSC: H2K-_BCL_-2. Cells from H2K-_BCL_-2 mice have been shown to be protected against a wide variety of apoptosis-inducing challenges. This block in apoptosis affects their HSC compartment. H2K-_BCL_-2–transgenic mice have increased numbers of HSC in bone marrow (2.4× wild type), but fewer of these cells are in the S/G2/M phases of the cell cycle (0.6× wild type). Their HSC have an increased plating efficiency in vitro, engraft at least as well as wild-type HSC in vivo, and have an advantage following competitive reconstitution with wild-type HSC.
Keywords: hematopoietic stem cells, apoptosis, BCL-2, homeostasis
Introduction
The hematopoietic system produces large numbers of mature cells each day, a capacity it retains throughout life through the presence of hematopoietic stem cells (HSC). A careful balance between self-renewal and differentiation is necessary to maintain both HSC, which are relatively constant throughout life, and adequate numbers of mature cells. Different models, like clonal succession, have been proposed to describe how this might be achieved. 5-Bromo-2′-deoxyuridine labeling in vivo has recently shown that all HSC in mice are constantly going in and out of cell cycle, such that in any given month virtually all HSC divide 1 2. In view of the proliferative capacity of both multipotent and committed progenitors, a small fraction of the cells produced by cell division of HSC with long-term multilineage reconstituting potential (LT-HSC) is sufficient to produce all the mature hematopoietic cells needed to maintain the organism. Yet the numbers of HSC, while increasing somewhat with age in mice 3, remain fairly similar throughout adult life. This overcapacity, which allows emergency responses, means that regulation of hematopoietic cell production is necessary to maintain homeostasis. For the more primitive cell populations, such as HSC, this can in principle be accomplished by adjusting the balance between self-renewal and differentiation. For the more mature compartments, apoptosis plays an important role as well 4 5 6 7. It is currently not clear whether apoptosis plays a similarly important and direct role in homeostasis of hematopoietic stem cell numbers in vivo 8.
In recent years, the importance of apoptosis in both normal and pathological physiology has become increasingly clear, and large numbers of genes and their encoded proteins have been characterized with respect to their role in apoptosis (e.g., 9–12). _Bcl_-2 13 14 15 was the first identified regulator of cell death 16. It belongs to a family whose members both help protect against the induction of apoptosis (e.g., _Bcl_-2 and _Bcl_-xL) and help induce it (e.g., Bax and Bad) 9. Overexpression of both _Bcl_-2 and _Bcl_-xL in transgenic mice has demonstrated their ability to block apoptosis induced by many, but not all, stimuli. Some of the apoptotic stimuli that are blocked partially at best include CTL-induced killing 17 18 and FAS-induced apoptosis 19 20 21. In addition, it has been documented that aberrant expression of members of the _Bcl_-2 family affects the cell cycle. Overexpression of those members of the family that protect against induced apoptosis lengthens the cell cycle 22, while overexpression of proapoptotic members has the opposite effect 23.
The consequences of blocking programmed cell death have been studied in transgenic mice overexpressing _Bcl_-2 or _Bcl_-xL 4 5 6 7. These studies have demonstrated that blocking cell death leads to perturbations in cell populations and can contribute to the development of malignancies and autoimmune disease. It does not prevent negative selection during lymphocyte maturation. Overexpression of _Bcl_-2 has revealed an unexpected limited role, regulating survival rather then guiding proliferation and differentiation for some cytokines 7 24 25 26 27. Although _Bcl_-2 has been overexpressed in early hematopoietic progenitor cells in vitro 24, it has not been targeted to HSC in vivo. To achieve this, we have recently generated a transgenic mouse in which the human _BCL_-2 is overexpressed under control of the well-characterized mouse H-2Kb promoter, combined with the Moloney murine leukemia virus LTR. This promoter is expressed at high levels in HSC 28 29 30 and many other tissues. We have reported that H2K-_BCL_-2 transgenic mice express high levels of human BCL-2 protein in all hematopoietic lineages, including HSC. As a consequence of this, multiple cell populations, including HSC of H2K-_BCL_-2–transgenic mice, are protected against lethal challenges such as total body irradiation, which results in increased resistance of the organism as a whole 30.
The high level of overexpression of functional BCL-2 protein in HSC of H2K-_BCL_-2–transgenic mice allows us to evaluate directly the role of apoptosis in the regulation of HSC numbers in vivo. This involves both the study of the effect of a block on apoptosis on HSC maintenance, as well as determining the ability of these cells to reconstitute lethally irradiated hosts. The increase in HSC in vivo, and the increased plating efficiency in vitro and reconstitution capability in vivo demonstrate directly that apoptosis is an important mechanism for limiting HSC numbers.
Materials and Methods
Mouse Strains.
H2K-_BCL_-2–transgenic mice were derived as described 30. In brief, the transgenic construct contains a human _BCL_-2 cDNA fragment cloned into the expression vector H2K-i-LTR. This vector expresses cDNAs under control of the H2K-promoter/enhancer and Moloney MuLV enhancer/poly(A) site. This construct was introduced into zygotes from crosses between F1(C57BL/6 × C3H). Mice that were positive by Southern blot analysis were backcrossed onto C57Bl/Ka, Thy-1.1, and CD45.2 (H-2b). The transgene was followed in later generations by flow cytometric screening for expression of the human BCL-2 protein in peripheral blood cells. Mice used in this study were backcrossed at least five times onto C57Bl/Ka and were confirmed to be homozygous for Thy-1.1 by flow cytometry. Three independent founderlines (1038, 1043, and 1053) were used in this study. Congenic mice C57Bl/Ka, (Thy1.1, CD45.2), C57Bl/Ka (Thy1.1, CD45.1), and the F1 crosses were bred at the animal care facility at the Stanford University School of Medicine. All mice were maintained on acidified water, pH 2.5.
Irradiation.
The lethal preconditioning regimen for HSC and bone marrow reconstitution was 9.5 Gy total body irradiation, given in two doses with a 3-h interval using a 200-kV x-ray machine. Mice were given antibiotic water (1.1 g/liter neomycin sulfate and 106 U/liter polymyxin B sulfate) for at least 8 wk after irradiation to reduce the chance of infection from opportunistic pathogens. Mice used for irradiation were 8–12 wk old.
Tissue Culture.
AC11 bone marrow stroma cells were cultured in RPMI 1640 with 5% FCS, 5 × 10⁻⁵ M β-mercaptoethanol, penicillin, and streptomycin. Cells were subcultured using collagenase/dispase (Boehringer Mannheim). Cells were irradiated before plating of bone marrow cells (3,000 rad, Cs-source). Methylcellulose and myelocult medium (M5300) was purchased from Stem Cell Technologies. Growth factors used in the platings are IL-3 (1%), IL-6 (10 ng/ml), GM-CSF (1 ng/ml), SF (30 ng/ml), Flt3L (20 ng/ml), Tpo (15 ng/ml), and erythropoietin (10 U/ml). IL-3 is concentrated supernatant from WEHI-3b cells, all other factors are recombinant.
Flow Cytometry.
Single cell suspensions were obtained in staining medium (HBSS + 3% fetal calf serum, 10 mM Hepes, pH 7.0, and 2 mM EDTA after ammonium chloride lysis of the red blood cells, if necessary, and straining through a nylon mesh. Cells were preincubated with mouse IgG (Sigma Chemical Co.) and stained for 20 min with the various antibodies at the appropriate dilutions, and, if necessary, incubated with secondary antibodies. Cells were stained with antibodies against surface markers, followed, when staining for the human BCL-2 protein, by fixation (5 min, 0.8% formaldehyde in PBS) and permeabilization (5 min, 0.3% saponin in staining medium). Cells were then incubated for 3–16 h with anti–BCL-2 antibody in 0.3% saponin in staining medium, followed, if necessary, by incubation with the appropriate secondary antibody for 20 min. Sorting of HSC was modified from previously published protocols (e.g., 30). In brief, bone marrow cells are enriched for c-Kit+ cells using MACS-columns (Miltenyi Biotechnology). The cells are stained with FITC-19XE5 (anti–Thy1.1), lineage-cocktail, Texas red–E13-161-7 (anti–Sca-1), APC-2B8 (anti–c-Kit), and biotin-3C11 (anti–c-Kit). Enriched cells are sorted as described. The lineage cocktail consists of KT31.1 (anti–CD3), GK1.5 (anti–CD4), 53-7.8 (anti–CD5), 53-6.7 (anti–CD8), 6B2 (anti–B220), Ter119 (anti–TER119), M1/70 (anti–Mac-1) and 8C5 (anti–Gr-1). They are used either directly conjugated to PE, or are visualized by secondary antibodies (anti–rat PE or anti–rat Cy5PE). For analysis of reconstituted mice, peripheral blood (∼10 drops) was collected from the tail vein in PBS + 5 mM EDTA. Red cells were sedimented using 2% dextran (Pharmacia LKB Biotechnology Inc.) in PBS, remaining red cells were lysed with 0.15 ammonium chloride/0.01 M potassium bicarbonate. The cells were divided into two aliquots, preblocked with mouse IgG and stained with CD45.2-FITC, Gr-1-PE, Mac-1-biotin, and CD45.1-APC or CD45.2-FITC, CD3-PE, B220-biotin, and CD45.1-APC. Lineage analysis on organs of reconstituted mice was done with the same antibody combinations. For analysis of the relative contribution of injected cells to the HSC pool, bone marrow was stained with the same lineage cocktail as above, followed by anti–rat Cy5PE. The cells were then stained with biotin3C11 (anti–c-Kit), followed by streptavidin-beads (Miltenyi Biotechnology). The bone marrow was enriched for c-Kit+ cells using MACS columns. The enriched cells were then stained with CD45.2-FITC, Thy-1.1-PE, Sca-1-Texas red, and CD45.1-APC. An aliquot of the enriched cells was stained with the normal HSC markers including APC-2B8 (anti–c-Kit) to ensure that <10% of the HSC-gated cells were c-Kitneg. Labeled cells were analyzed and sorted with a dual laser FACS® Vantage (Becton Dickinson Immunocytometry Systems), made available through the FACS® shared user group at Stanford University. Flow cytometry data were analyzed using FACS®/Desk (Stanford University) or FlowJo (Treestar Inc.). Dead cells were excluded from analysis by their propidium iodide staining characteristics. Two parameter data are presented as 5% probability plots with outliers.
The rat antibodies 53-7.3 (anti–CD5), 53-6.7 (anti–CD8), Ter-119 (anti–erythro), GK 1.5 (anti–CD4), KT 31.1 (anti–CD3), 6B2 (anti–B220), M1/70 (anti–Mac-1), 8C5 (anti–GR-1), E13-161 (anti–Sca-1), 3C11 (anti–c-Kit), 2B8 (anti–c-Kit), ALI-4A2 (anti–CD45.2), and A20.1.7 (anti–CD45.1) were prepared from the respective hybridoma clones as were their conjugates. Secondary antibodies were obtained from Caltag. Avidin Texas red was obtained from Cappel Laboratories, anti–human BCL-2 (clone 124) from Dako Corp.
Vital staining of cells with Hoechst 33342 to determine DNA content was done as described 2.
Results
H2K-BCL-2–transgenic Mice Have More HSC.
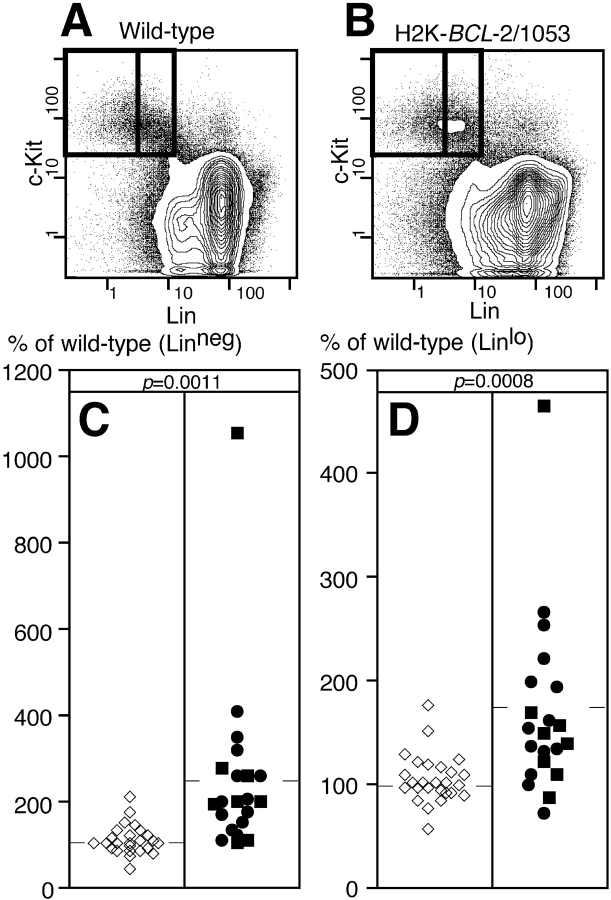
LT-HSC in this study are defined by the following combination of cell surface markers: Thy-1.1lo, Sca-1high, c-Kithigh, and Linneg. Cells with this phenotype, which form a rare population in whole bone marrow, have been found to contain a population of cells with long-term multilineage reconstitution potential. The limit dilution dose for reconstitution with these cells is ∼10 cells injected i.v. 31. Cells with short-term multilineage reconstitution potential (ST-HSC) differ from the LT-HSC population in increased, but low level, expression of certain Lin-markers (initially Mac-1 followed by CD4), and are present in larger numbers in whole bone marrow 31. When bone marrow is stained for these HSC markers (Fig. 1A and Fig. B), the profiles for wild-type and H2K-_BCL_-2–transgenic mice are similar, except for relatively minor differences, such as increased numbers of T cells (Thy-1.1high cells). The HSC populations as defined in wild-type mice can be easily recognized in bone marrow from transgenic mice. Morphologically, HSC from H2K-_BCL_-2–transgenic mice resemble those of wild-type mice (Fig. 1 C). LT-HSC are relatively small and uniform in size, while ST-HSC are more varied in size. Antibody staining for the presence of human BCL-2 protein in cells with the LT-HSC surface phenotype shows that all cells express the transgene at high levels (Fig. 1 D). This is in agreement with earlier data showing high levels of expression in cells sorted for three (Thy-1.1, Lin, Sca-1) of the four HSC markers, and with the fact that these cells are protected against radiation-induced apoptosis 30. All three founderlines used in this study (1038, 1043, and 1053) have very similar levels of expression of the transgene in HSC (Fig. 1 D). All of this is in agreement, but doesn't prove, that HSC in H2K-_BCL_-2–transgenic mice have the same cell surface characteristics as wild-type HSC. However, HSC cannot be defined by cell surface markers alone, since these can vary 32. Therefore LT- and ST-HSC from H2K-_BCL_-2–transgenic mice were tested for their ability to repopulate lethally irradiated animals under limit-dilution conditions. They do this at least as well as wild-type HSC (see below). Quantitation of cells with HSC surface phenotype in H2K-_BCL_-2–transgenic bone marrow reveals an increase in their numbers, compared with that present in wild-type bone marrow (Fig. 2). This is the case both for cells with the LT-HSC surface phenotype (Linneg) and for cells with the ST-HSC surface phenotype (Linlo). As tabulated in Table , the expansion of HSC is more dramatic in the LT-HSC compartment (2.4× wild-type levels) than in the ST-HSC compartment (1.7× wild-type levels). The spread in HSC numbers in H2K-_BCL_-2–transgenic bone marrow is larger than that encountered in wild-type littermates, as is demonstrated in Fig. 2 and the difference in SD in Table between wild-type and H2K-_BCL_-2. The transgenic data on HSC numbers in Fig. 2, relative data, and Table , actual percentages of bone marrow, are based on the analysis of mice from two different transgenic founderlines, 1038 and 1053. When analyzed separately, there is no significant difference in the number of stem cells between them (Fig. 2). Since there are no differences in the total bone marrow cellularity between H2K-_BCL_-2–transgenic mice and wild-type littermates 30, this increased frequency of HSC means increased numbers of HSC in the bone marrow.
Figure 1.
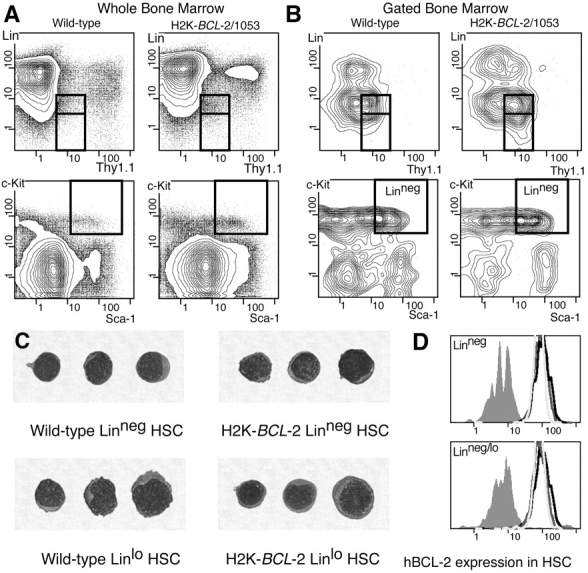
HSC FACS®-staining profiles and expression of hBCL-2 in HSC. (A) Staining profiles on WBM of wild-type and H2K-_BCL_-2–transgenic mice for the four surface markers used to define HSC: Thy-1.1FITC, LinPE, Sca-1TXR, and c-KitAPC. Boxed areas indicate the gates within which HSC are present. The two boxes in the Thy-1.1 versus Lin plots depict LT-HSC (Linneg, bottom) and ST-HSC (Linlo, top). (B) As in A, except that the plots depict populations gated for Sca-1+ and c-Kit+ (top) and Thy-1.1lo and Linneg (bottom), and thus allow assessment of the contribution of each marker to the purification of the HSC population. (C) Cytospin showing morphology of Linneg and Linlo HSC sorted from WT and H2K-_BCL_-2–transgenic mice. May-Grünwald/Giemsa stain. (D) Expression of the H2K-_BCL_-2 transgene in HSC from three different founderlines. Bone marrow was simultaneously stained for Thy1.1FITC, LinCy5, Sca-1TXR, c-KitAPC, and BCL-2PE, and analyzed using a modified FACS® Vantage. The histograms depict BCL-2 staining in cells within the LT-HSC gate (top) and ST-HSC gates (bottom). Gray-filled histogram depicts staining in wild-type cells, open histograms in cells from founderlines 1038, 1043, and 1053.
Figure 2.
HSC numbers in bone marrow from H2K-_BCL_-2 and wild-type mice. Staining profiles showing Lin versus c-Kit staining for wild-type (A) and transgenic (B) WBM. The boxed areas indicate HSC gates for these markers for LT-HSC (left) and ST-HSC (right). (C) LT-HSC numbers in bone marrow from wild-type and H2K-_BCL_-2–transgenic mice. Open symbols represent wild-type mice, closed symbols H2K-_BCL_-2–transgenic mice. Circles represent founderline 1038, squares founderline 1053. Averages are indicated by the horizontal bars. (D) Same as in B, but showing ST-HSC numbers.
Table 1.
HSC Numbers in Wild-Type and H2K-BCL-2 Bone Marrow, Shown as Average ± SD
| Percentage of WBM | |||||
|---|---|---|---|---|---|
| Linneg | Linlo | Linneg/lo | Experiments | Mice | |
| n | n | ||||
| Wild-type | 0.018 ± 0.012 | 0.082 ± 0.038 | 0.101 ± 0.044 | 26 | 36 |
| H2K-_BCL-_2 | 0.038 ± 0.030 | 0.127 ± 0.055 | 0.165 ± 0.074 | 21 | 25 |
| P | 0.0032 | 0.0018 | 0.0006 |
Less HSC Are in Cycle in H2K-BCL-2–transgenic Mice.
BCL-2 has been reported to decrease the level of proliferation of cells overexpressing it 22. Since H2K-_BCL_-2–transgenic mice overexpress BCL-2 in HSC, it was investigated whether this affects their cell cycle status. At any given time, only a small percentage of LT-HSC are in the S/G2/M phases of the cell cycle (has >2n DNA content), while the majority are in G0 or G1, which cannot be distinguished by measuring the DNA content of the cells. However, it has recently been established that in steady state hematopoiesis there is no true resting population that stays in G0 for prolonged periods of time. Over a period of ∼30 d, all HSC can be expected to go through a cell division at least once 1 2. Less HSC in the bone marrow of H2K-_BCL_-2–transgenic mice are in the S/G2/M phases of the cell cycle than are seen in wild-type mice (Fig. 3, relative data, and Table , actual percentages). This is true both for LT-HSC (0.6× wild-type levels) and ST-HSC (0.7× wild-type levels). There is no difference in this respect between the three founderlines used in these studies (Fig. 3). Although less than observed for HSC populations, there is also a difference in the percentage of cells in S/G2/M in whole bone marrow (WBM). H2K-_BCL_-2–transgenic mice have 0.8× wild-type levels of cells with >2n DNA content (Table ) in WBM. A difference in cell cycle status is not apparent for all cell populations. Transgenic splenocytes do not differ significantly from those of wild-type littermates in this respect (data not shown), but the percentage of cells with >2n DNA is also significantly reduced in transgenic thymocytes when compared with those of wild-type mice. When plotting the percentage of HSC against the percentage of cells in S/G2/M, there is no inverse correlation, suggesting that the decrease in cycling HSC is not the consequence of increased numbers of HSC (Fig. 3C and Fig. D).
Figure 3.
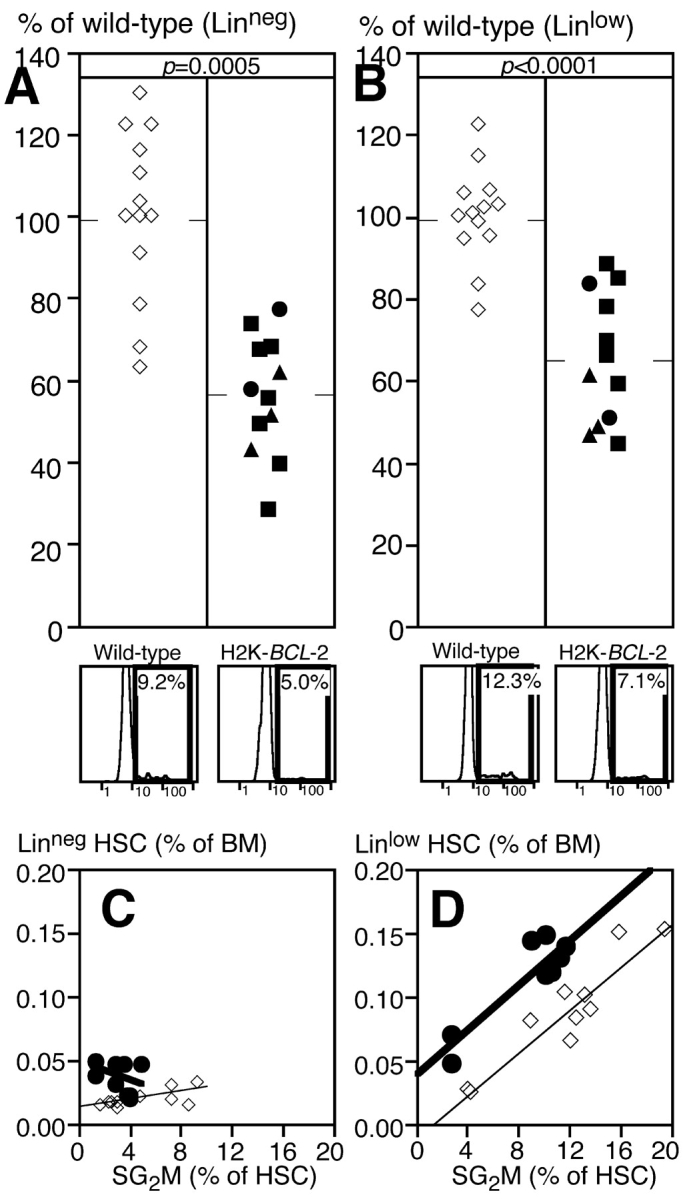
Cell cycle status of H2K-_BCL_-2–transgenic HSC. (A) Percentage of LT-HSC in bone marrow from wild-type and H2K-_BCL_-2–transgenic mice that is in the S/G2/M phases of the cell cycle. Open symbols represent wild-type mice, closed symbols H2K-_BCL_-2–transgenic mice. Circles represent founderline 1038, triangles founderline 1043, and squares founderline 1053. Data from 12 transgenic and 13 wild-type mice, averages are indicated by the horizontal bars. At the bottom are representative plots showing Hoechst staining of bone marrow cells within the LT-HSC gates for wild-type (left) and transgenic (right) mice. (B) Same as A, but showing ST-HSC. (Bottom) Relationship between HSC numbers and cell cycle status for LT-HSC (C) and ST-HSC (D).
Table 2.
Cell-Cycle Status of HSC in Wild-Type and H2K-BCL-2 Bone Marrow, Shown as Average ± SD
| >2n DNA (percentage of population) | |||||
|---|---|---|---|---|---|
| Linneg | Linlo | Linneg/lo | WBM | Mice | |
| n | |||||
| Wild-type | 7.9 ± 3.6 | 13.2 ± 5.6 | 12.5 ± 4.9 | 13.1 ± 1.8 | 13 |
| H2K-_BCL-_2 | 4.1 ± 1.8 | 8.5 ± 3.2 | 7.7 ± 2.8 | 10.2 ± 1.3 | 12 |
| P | 0.0035 | 0.0104 | 0.0049 | <0.0001 |
HSC Overexpressing BCL-2 Have Increased Plating Efficiency In Vitro and Are Protected against Death Induced by Growth Factor Deprivation.
To investigate whether apoptosis plays a role in determining plating efficiency, HSC from H2K-_BCL_-2–transgenic mice were sorted as either LT- or ST-HSC. Single cells were plated on AC11 bone marrow stroma cells using the FACS® Vantage single-cell deposition unit. The wells were evaluated after 14 d for the presence of colonies of hematopoietic cells. Under these conditions (stroma feeder cells and medium with 5% FCS, but no added growth factors), ∼30–50% of wild-type HSC plated will form hematopoietic colonies. As shown in Fig. 4 A, HSC from H2K-_BCL_-2–transgenic mice outperformed wild-type HSC in this assay. The plating efficiency of LT-HSC increases by ∼20%, that of ST-HSC by ∼70%. Similar results were obtained when sorted HSC were plated in methylcellulose in the presence of a cocktail of hematopoietic growth factors (IL-3, IL-6, GM-CSF, SF, and Epo). As shown in Fig. 4 B, the plating efficiency of H2K-_BCL_-2–transgenic HSC is increased over that of wild-type HSC in this assay.
Figure 4.
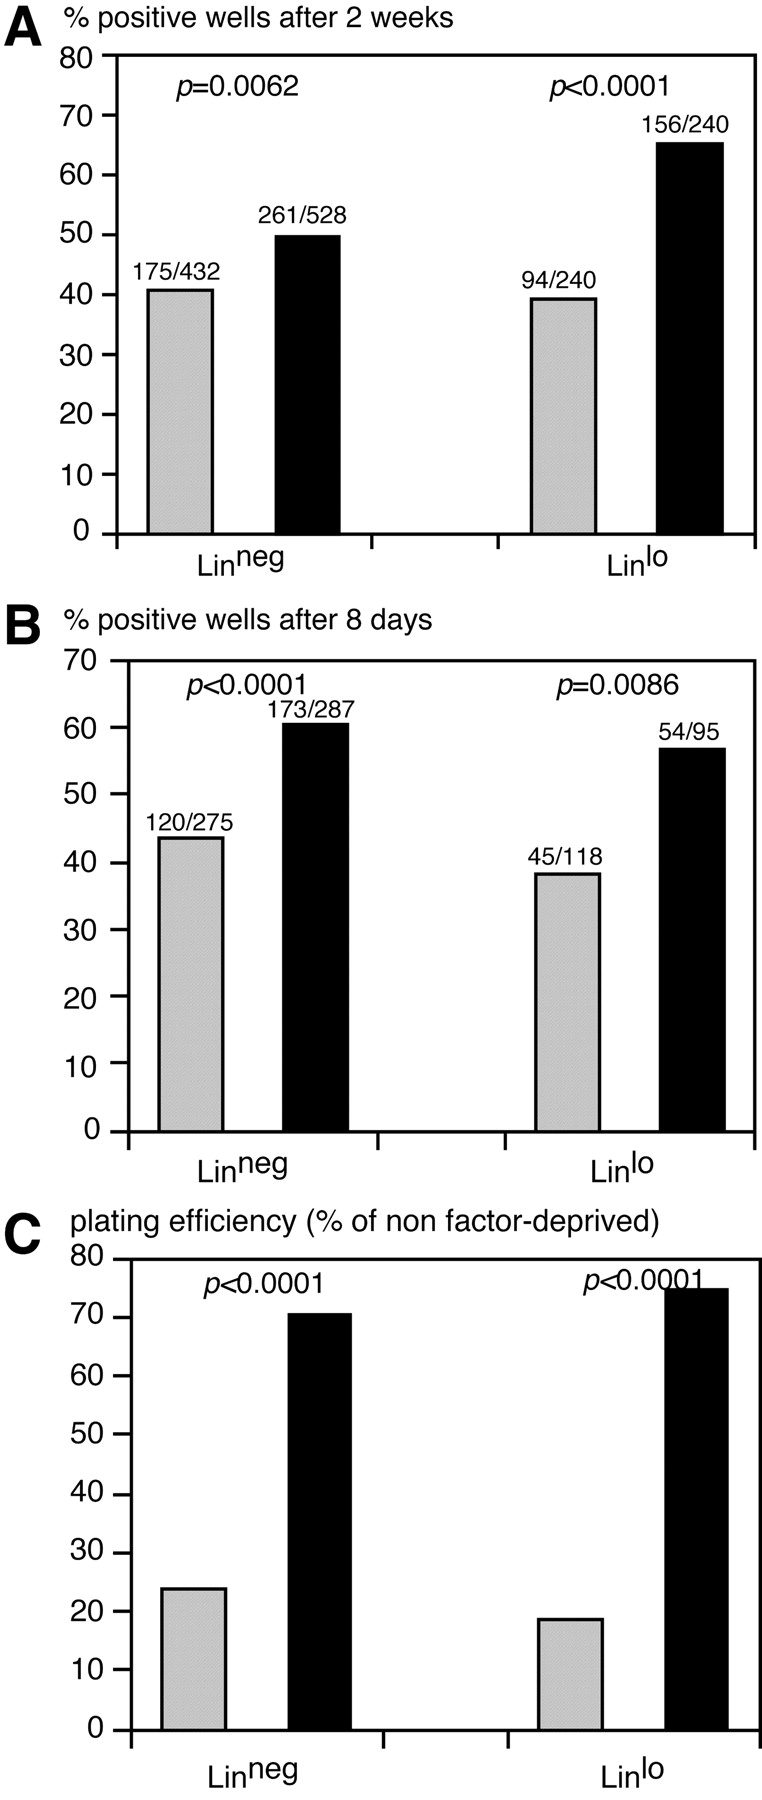
In vitro plating of HSC from H2K-_BCL_-2–transgenic and wild-type mice. (A) Colony formation at 2 wk after plating of single HSC in 96-well plates with confluent, irradiated, AC11 stroma cells. Solid black bars represent H2K-_BCL_-2, gray bars wild-type HSC. (Left) Data for LT-HSC; (right) data for ST-HSC. Combined data from three experiments using founderlines 1038 and 1053. (B) Colony formation after plating of single sorted HSC in methylcellulose with IL-3, IL-6, SF, GM-CSF, and erythropoietin. Wells containing colonies of more than 50 cells were counted 8 d after plating. (C) Survival of growth factor-deprived HSC from wild-type (gray bars) and H2K-_BCL_-2 (solid bars) HSC. Single HSC were clones, sorted into Terasaki wells containing myelocult M5300 medium without factors. SF, Flt3L, IL-6, and Tpo were added after 70 h. The graph shows the surviving (proliferating) cells as a percentage of the plating efficiency of nonstarved cells, to compensate for the initial difference in plating efficiency (as illustrated in A and B). One representative experiment is shown with data on 150 plated cells per genotype for each cell type. Statistical analysis using Fisher's Exact test.
To directly demonstrate that HSC from H2K-_BCL_-2–transgenic mice are protected against apoptosis, growth factors (SF, Flt3L, IL-6, and Tpo) were added after a 70-h delay to HSC plated as single cells in Terasaki wells, and the proliferative response was compared with that of cells plated under the same conditions, but with the factors added at the time of plating, to compensate for the increased plating efficiency of transgenic cells (see above). As shown in Fig. 4 C, overexpression of BCL-2 protects HSC against cell death induced by growth factor deprivation.
H2K-BCL-2 Cells Have a Competitive Advantage In Vivo.
In steady state hematopoiesis, the numbers of HSC and more mature progenitors are carefully maintained. This can be accomplished by regulating proliferation, the decision between self-renewal or differentiation and apoptosis. To test the importance of apoptosis in regulating the compartment sizes of hematopoietic stem and progenitor cells, competitive reconstitutions of LT-HSC from H2K-_BCL_-2–transgenic and wild-type mice were performed at various ratios, ranging from 1:50 to 1:2. By using HSC that differ at the CD45 allele (H2K-_BCL_-2 mice are CD45.2, wild-type mice CD45.1), the fate of both can be followed in the same host. The HSC are used to reconstitute an F1 host that expresses both CD45.2 and CD45.1, which allows the distinction of residual host cells from donor-derived hematopoietic cells (Fig. 5 A). The contribution of both types of HSC to hematopoiesis is measured at various times after reconstitution by determining their ratio in peripheral blood. While BCL-2 overexpression can greatly increase the life span of especially resting lymphocytes in vivo, this is not the case for myeloid cells, which are short-lived, even when overexpressing BCL-2 33. Their ratio thus is a good indication for relative stem cell activity, even when comparing transgenic and wild-type mice. As shown in Fig. 5 B, the contribution of H2K-_BCL_-2 HSC–derived cells to the total blood cell pool is higher than expected from the input ratio of HSC. In addition, the contribution of H2K-BCL_-2–derived cells to the peripheral blood pool increases over time. Fig. 5 B (right) shows that the same is true for myeloid cells (Gr-1+, Mac-1+) in peripheral blood. If wild-type and H2K-BCL_-2–transgenic CD45.2 HSC are compared for their ability to compete against wild-type CD45.1 HSC in vivo, the transgenic, but not wild-type, CD45.2 cells have a competitive advantage (Fig. 5 C). Again, this is both true when looking at total white blood cells (left) and at myeloid cells (right) in peripheral blood. This difference is highly significant. When the results of three experiments are combined, the CD45.2/CD45.1 ratio of myeloid cells at 12–14-wk post-reconstitution does not differ from the input ratio when both are wild-type (P = 0.4334, n = 10), but it does increase when the CD45.2 cells are H2K-_BCL_-2 derived (P = 0.0041, n = 23).
Figure 5.
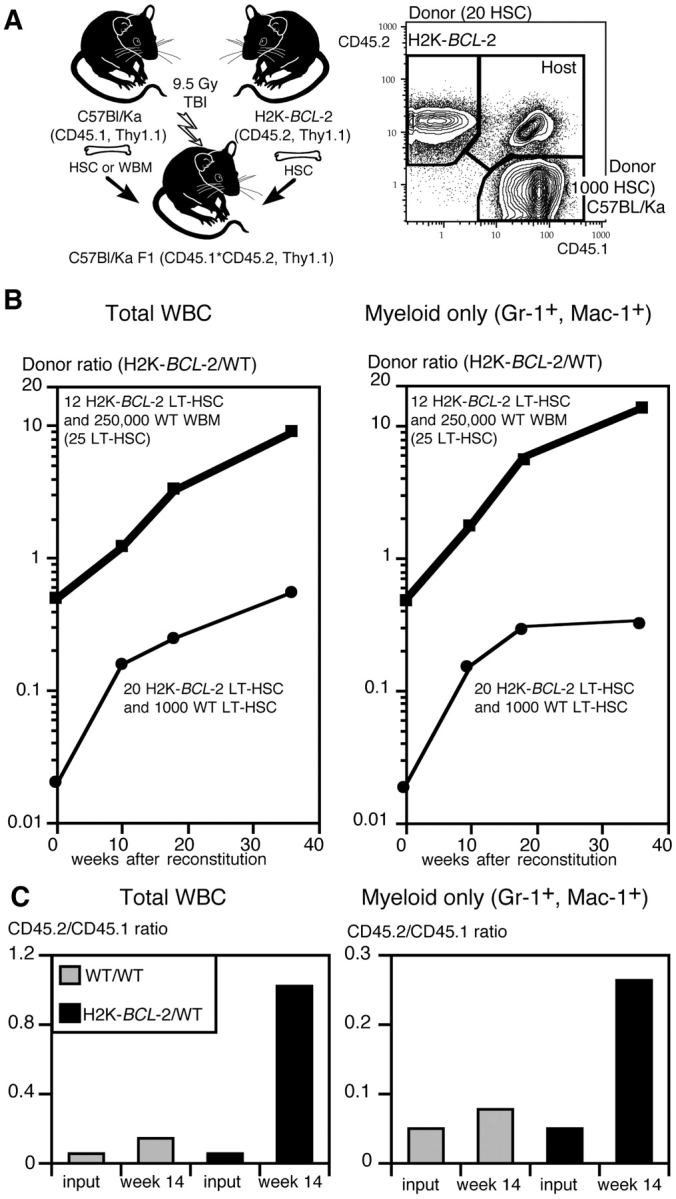
Competitive repopulation in vivo using LT-HSC from H2K-_BCL_-2–transgenic and wild-type mice. (A) Experimental model that allows differential monitoring of wild-type and H2K-_BCL_-2–transgenic donor cells and host cells. Donor cells are either CD45.2 (H2K-_BCL_-2) or CD45.1 (wild-type), host cells are CD45.1×CD45.2. All three populations can easily be distinguished in the blood of reconstituted animals (right plot). (B) Ratio in blood of total donor-derived cells in animals reconstituted with two different combinations of wild-type and transgenic cells, as indicated in the figure. The t = 0 time point shows the HSC ratio used to reconstitute lethally irradiated animals. Peripheral blood data are shown for 10, 18, and 36 wk after reconstitution. (Left) Ratios for total white blood cells; (right) ratios for myeloid cells. Data points from 12 animals total. (C) Experimental set-up as in B, except that CD45.2 HSC are either wild-type or H2K-_BCL_-2 transgenic. (Left) Donor ratios for total white blood cells 14 wk after reconstitution with 50 CD45.2 HSC (wild-type or transgenic), 1,000 CD45.1 HSC (wild type) and 3 × 10⁵ F1 bone marrow cells. (Gray bars) Wild-type CD45.2 HSC; (black bars) H2K-_BCL_-2–transgenic CD45.2 HSC. (Right) Ratio of myeloid (Gr-1+, Mac-1+) donor-derived cells in the same animals. Data are from seven reconstituted animals.
Competitive Advantage after Reconstitution Includes HSC.
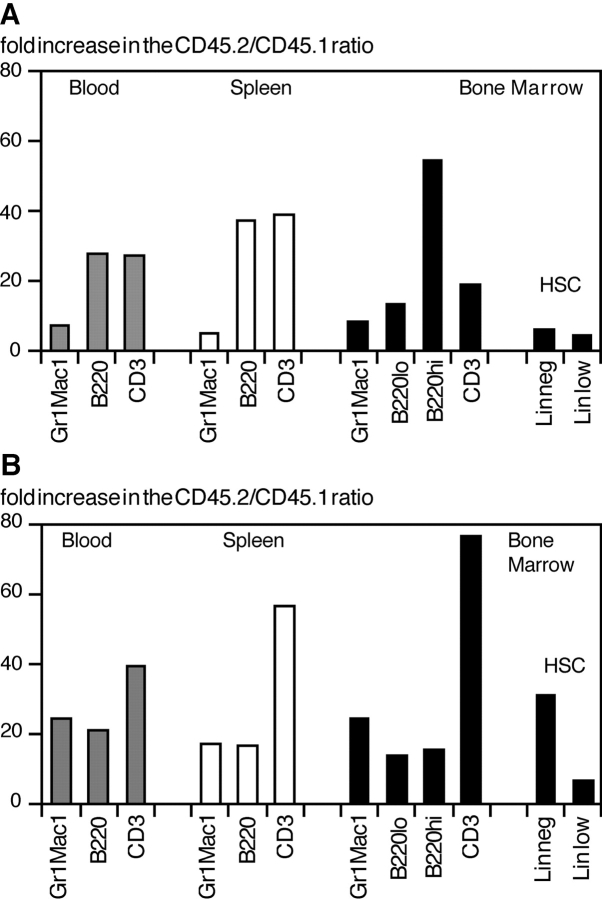
To determine directly whether the increase in H2K-_BCL_-2 HSC–derived hematopoietic cells seen after competitive reconstitution reflects an increase in transgenic HSC in the bone marrow, the ratio of transgenic versus wild-type donor-derived cells was determined for various cell populations, including HSC, in reconstituted animals. The results for two representative animals are shown in Fig. 6. Fig. 6 A shows the increase in transgenic/wild-type ratio (input ratio is arbitrarily set at 1) in an F1 (CD45.1×CD45.2) mouse 13 wk after reconstitution with 50 H2K-_BCL_-2 LT-HSC and 1,000 wild-type (WT) LT-HSC. Fig. 6 B shows these data for a F1 mouse 60 wk after reconstitution with 12 H2K-_BCL_-2–transgenic LT-HSC and 250,000 WT WBM cells. As expected in both mice, the skewing of the donor cell ratio in favor of H2K-_BCL_-2 HSC–derived cells is seen most strongly in lymphoid populations. This reflects the activity of BCL-2 in lymphoid cells, similar to what is seen in other transgenic models 4 5 6. In both mice, the ratio of donor myeloid cells is skewed toward overrepresentation of transgenic cells, as is the case for HSC. Myeloid cells and HSC are skewed to approximately the same extent, confirming that myeloid cells are a good indicator of stem cell activity. In this respect, there are no major differences between myeloid cells from peripheral blood, spleen, or bone marrow.
Figure 6.
Comparative increase in H2K-_BCL_-2/wild-type donor ratio in different cell populations, including HSC. Experimental set-up as in Fig. 5. The input (HSC) ratio was set as 1. (A) The overrepresentation of cells derived from H2K-_BCL_-2 HSC in a mouse reconstituted with 12 H2K-_BCL_-2–transgenic LT-HSC and 250,000 WT WBM cells 60 wk after reconstitution. (B) The same data for an animal reconstituted with 50 H2K-_BCL_-2–transgenic LT-HSC and 1,000 WT LT-HSC ∼14 wk after reconstitution. In both animals, the increased ratio of HSC mirrors that of myeloid cells, while the increase is much stronger for lymphoid cells.
BCL-2 Overexpression Does Not Increase the Life Span of ST-HSC–derived Clones.
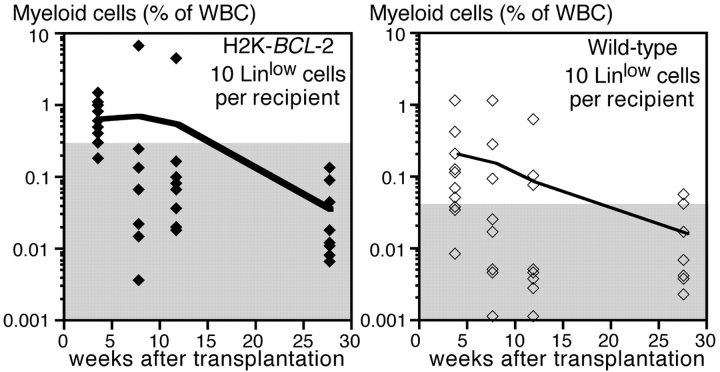
HSC can be functionally divided in cells with the ability to self-renew and reconstitute all hematopoietic lineages for the life of an animal (LT-HSC) and cells that can do this only for limited periods of time (ST-HSC). To see whether overexpression of BCL-2 in ST-HSC can expand the functional life span of ST-HSC–derived clones, F1 mice (with respect to the CD45.1 and CD45.2 alleles) were reconstituted with 10 wild-type and 10 H2K-_BCL_-2–transgenic ST-HSC. The Gr-1+, Mac-1+ myeloid cells derived from the different HSC were followed using the CD45 markers, as discussed above. As depicted in Fig. 7, transient reconstitution with myeloid cells from wild-type and transgenic HSC is seen in the reconstituted mice. Reconstitution levels are higher (4-wk time point) for H2K-_BCL_-2–derived cells, but both transgenic and wild-type clones have a limited life span and few ST-HSC–derived myeloid cells can be seen after more than 12 wk.
Figure 7.
Competitive repopulation in vivo using ST-HSC from H2K-_BCL_-2–transgenic and wild-type mice. Markers as in Fig. 5. Lethally irradiated CD45.1×CD45.2 host animals were reconstituted with 10 transgenic ST-HSC (CD45.2), 10 wild-type ST-HSC (CD45.1), and 250,000 whole bone marrow cells from a CD45.1×CD45.2 mouse. The figure shows, as a percentage of nucleated blood cells, the myeloid cells derived from transgenic ST-HSC (left) and wild-type ST-HSC (right). Data from 10 reconstituted animals, the line shows the average reconstitution at each time point, the symbols show the data for individual animals. The gray areas indicate the background staining in nonreconstituted CD45.1×CD45.2 mice. The difference in background levels is caused by different staining characteristics of the CD45.1 and CD45.2 antibody conjugates used. One representative experiment (out of three) is shown.
Discussion
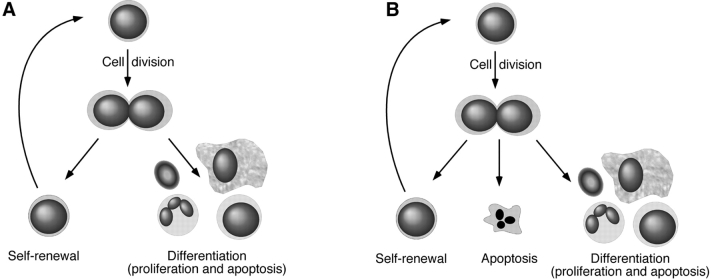
While the concepts of apoptotic versus necrotic cell death have been formulated a long time ago, the more recent molecular characterization of the genes and proteins involved has led to a major increase in the appreciation of their importance during normal and pathological development. Apoptosis plays an important role in hematopoiesis, and various transgenic animal models have been generated to study aspects of this. We have generated a transgenic mouse that overexpresses BCL-2, the archetypal protein that protects against different forms of apoptosis, in all hematopoietic cells, including HSC. This was previously demonstrated for radiation-induced cell death 30, and is extended in this paper to cell death induced by growth factor deprivation; HSC from H2K-_BCL_-2–transgenic mice are protected. We have used this transgenic model to study the role of apoptosis in the maintenance of HSC in vivo. To guide the discussion of our finding that HSC have among their options programmed cell death, Fig. 8 is provided.
Figure 8.
Model for regulation of HSC numbers. (A) HSC homeostasis through balancing self-renewal and differentiation. (B) HSC homeostasis by balancing self-renewal, differentiation, and apoptosis.
The cell surface markers that are used to delineate HSC, such as Thy-1.1low, Linneg/low, Sca-1high, and c-Kithigh are not essential for HSC function, nor are they invariably associated with it. Under specific conditions (e.g., during development) 34, or after 5-FU treatment 32, changes occur in these staining profiles. Similar changes cannot be excluded in transgenic mice. However, transplantation experiments show that the cells with HSC surface markers in H2K-_BCL_-2–transgenic mice are indeed HSC, and that they are at least as efficient on a per-cell basis in repopulating lethally irradiated hosts as wild-type HSC.
BCL-2 overexpression in transgenic mice has been shown to increase population sizes of various cell types. This was initially demonstrated for lymphocytes 4 5 6, but has been expanded to other cell populations, such as monocytes 7 and neurons 35. The expansions tend to be most dramatic in resting cells. This would be in line with the expansion in transgenic HSC. Most stem cells are in the G1/G0 phases of the cell cycle. The implication of this observation is that HSC under steady state conditions are subject to regulation by apoptosis.
The inability to maintain and expand long-term multilineage reconstituting HSC as such in vitro, despite all the factors and culture systems available, has led to the hypothesis that such maintenance in vivo is strictly dependent on particular microenvironments, and that the number of HSC reflects the number of microenvironments. The limited increase in HSC in the bone marrow of H2K-_BCL_-2–transgenic mice indicates that HSC, despite their resistance to apoptosis, are not simply accumulating in ever larger numbers, but are still subject to regulation. Also, the variation in bone marrow HSC numbers between animals is larger in transgenic than in wild-type animals. This indicates that additional events play a role in determining HSC numbers. Since BCL-2 overexpression by itself does not prevent differentiation in hematopoietic progenitor cells in vitro 24, the limits on the increase of HSC numbers probably reflect a limit in the HSC-supporting microenvironment. The variation in HSC numbers observed between different transgenic animals may reflect variations in the number of niches available. However, it remains unclear what the regulatory events are that set these limits. More insights may come from some of the genetic analyses that are currently being undertaken (reviewed in reference 8). The fact that ST-HSC from H2K-_BCL_-2–transgenic mice have a limited life span similar to that of wild-type HSC shows that the functional life span of short-term stem cells is not limited seriously by apoptosis. Commitment to further differentiation, rather than apoptosis, seems to limit clonal life span.
At each HSC cell division, the two daughter cells choose their cell fate, self-renewal or differentiation. This can be done symmetrically (both cells adopt the same fate) or asymmetrically (different fates). The balance determines the number of stem cells. The cells that start differentiation regulate their cell numbers by extensive proliferation and apoptosis 36. Cell death rates seem to be higher at earlier stages of differentiation (CFU-S level) than at later stages (CFC) 37. Progress in characterizing the signaling pathways involved in differentiation has been made; e.g., the notch family of receptors 38 39 40. However, it is still unclear what determines whether a HSC self-renews or undergoes differentiation. In traditional models of hematopoiesis, with most HSC quiescent and only one or a few actively contributing, limited regulation is necessary. However, more recent insights into HSC dynamics [all HSC are cycling, albeit slowly 1 2, and all can be made to cycle rapidly under certain conditions such as mobilization 41] means that the fate of HSC has to be decided continuously. Under steady state conditions, ∼8% of the LT-HSC in C57Bl/Ka mice complete cell division every day 2. Assuming 3 × 10⁸ bone marrow cells per mouse, and 0.01–0.02% 31 (Table ) of these cells are LT-HSC, this means that, every day, 2–5 × 10³ LT-HSC complete cell division, producing 4–10 × 103 cells. Under steady state conditions, half of these remain LT-HSC, the remaining 2–5 × 10³ cells either differentiate or undergo apoptosis. The regulation of HSC numbers (the decision to self-renew) has to be strictly regulated and enforced to prevent an unwanted expansion of HSC, with all the risks of transformation that entails. In this paper, we demonstrate that in addition to self-renewal and differentiation, a third option is open to HSC under steady state conditions in vivo: apoptosis.
It should be pointed out that while _BCL_-2 is a proto-oncogene 42 43 44, the increase in HSC frequency in H2K-_BCL_-2–transgenic mice (Fig. 2, Table ) and the increased competitive reconstitution of transgenic HSC upon transfer to irradiated hosts, did not result from the expansion of malignant clones; no stem-cell leukemias have been seen in these mice. However, in line with other _BCL_-2–transgenic mouse models, some of the H2K-_BCL_-2–transgenic mice do develop myeloid or lymphoid leukemias late in life.
BCL-2 overexpression increases the length of the G1 phase of the cell cycle 22 45. In H2K-_BCL_-2–transgenic mice a similar phenomena is seen when transgenic HSC are compared with wild-type HSC with respect to the number of cells with >2n DNA. 5-Bromo-2′-deoxyuridine labeling experiments in vivo confirm that HSC in H2K-_BCL_-2–transgenic mice cycle more slowly (Cheshier, S.H., J. Domen, and I.L. Weissman, manuscript in preparation). The decrease in the percentage of HSC undergoing cell division is accompanied by increased numbers of HSC, thus increasing the number of HSC offspring to slightly greater than wild-type levels. This could indicate a homeostatic adaptation, assuming that all dividing HSC contribute to the peripheral pool, an assumption supported by the observation that donor ratios in HSC and peripheral myeloid cells are similar. However, the fact that the proliferative potential present in even a fraction of the normal HSC number is sufficient to produce all the mature cells necessary would seem to argue against the need for such a feedback. Also, as shown, there is no inverse correlation between the percentage of HSC with >2n DNA and the percentage of HSC in bone marrow in either transgenic or wild-type mice that would be expected if such a feedback existed. If anything, especially in ST-HSC, the reverse is true. One study addressing the correlation between progenitor cell cycle kinetics and HSC numbers between different mouse strains fails to find a clear correlation for HSC, but reports a negative correlation for progenitors 46. However, this may differ from regulation of numbers within an inbred strain. The reduction in cycling cells in tissues such as thymus in the transgenic mice is similar to other transgenic models 45.
The difference in engraftment between H2K-_BCL_-2–transgenic and wild-type HSC in competitive repopulations shows that transgenic stem cells have a competitive advantage. The peripheral expansion of transgenic cells seen in reconstituted animals reflects increased survival of both HSC and more differentiated cells. However, direct determination of HSC ratios in reconstituted animals shows that the increase, and competitive advantage, starts at the level of HSC. This relative increase in BCL-2 overexpressing HSC does not only occur in the immediate post-reconstitution expansion period, when HSC are expanding rapidly, but continues gradually over a prolonged period of time. While there are minor antigenic differences between the CD45-congenic strains that are used for these competitive reconstitutions, the fact that this increase is not seen when wild-type CD45.2 cells are competed against wild-type CD45.1 cells argues strongly against the selective advantage being at this level. Consequently, overexpression of BCL-2, and thus protection against apoptosis, causes this expansion. This demonstrates that, after reconstitution, apoptosis plays an important role in regulating and limiting stem cell numbers. The main remaining challenge in this and other systems is the identification of the signals that control cell fate decisions of HSC.
Acknowledgments
We acknowledge Libuse Jerabek for excellent laboratory management, Veronica Braunstein for preparing many of the antibodies used, and Lu Hidalgo and Bert Lavarro for animal care and management.
Parts of this work were supported by fellowship grants from the Dutch Cancer Society/Koningin Wilhelmina Fonds (J. Domen) and the Medical Scientist Training Program Grant 5T32GM07365 at Stanford University School of Medicine (S.H. Cheshier). The major part of this work was supported by a grant from Systemix Inc. and by United States Public Health Service grant CA42551.
Footnotes
Abbreviations used in this paper: HSC, hematopoietic stem cell(s); LT-HSC, long-term hematopoietic stem cell(s); ST-HSC, short-term hematopoietic stem cell(s); WBM, whole bone marrow; WT, wild-type.
References
- Bradford G.B., Williams B., Rossi R., Bertoncello I. Quiescence, cycling, and turnover in the primitive hematopoietic stem cell compartment. Exp. Hematol. 1997;25:445–453. [PubMed] [Google Scholar]
- Cheshier S.H., Morrison S.J., Liao X., Weissman I.L. In vivo proliferation and cell cycle kinetics of long-term hematopoietic stem cells. Proc. Natl. Acad. Sci. USA. 1999;96:3120–3125. doi: 10.1073/pnas.96.6.3120. [DOI] [PMC free article] [PubMed] [Google Scholar]
- Morrison S.J., Wandycz A.M., Akashi K., Globerson A., Weissman I.L. The aging of hematopoietic stem. Nat. Med. 1996;9:1011–1016. doi: 10.1038/nm0996-1011. [DOI] [PubMed] [Google Scholar]
- McDonnell T.J., Deane N., Platt F.M., Nunez G., Jaeger U., McKearn J.P., Korsmeyer S.J. bcl-2-Immunoglobulin transgenic mice demonstrate extended B cell survival and follicular lymphoproliferation. Cell. 1989;57:79–88. doi: 10.1016/0092-8674(89)90174-8. [DOI] [PubMed] [Google Scholar]
- Strasser A., Harris A.W., Cory S. bcl-2 transgene inhibits T cell death and perturbs thymic self-censorship. Cell. 1991;67:889–899. doi: 10.1016/0092-8674(91)90362-3. [DOI] [PubMed] [Google Scholar]
- Sentman C.L., Shutter J.R., Hockenbery D., Kanagawa O., Korsmeyer S.J. bcl-2 inhibits multiple forms of apoptosis but not negative selection in thymocytes. Cell. 1991;67:879–888. doi: 10.1016/0092-8674(91)90361-2. [DOI] [PubMed] [Google Scholar]
- Lagasse E., Weissman I.L. Enforced expression of Bcl-2 in monocytes rescues macrophages and partially reverses osteopetrosis in op/op mice. Cell. 1997;89:1021–1031. doi: 10.1016/s0092-8674(00)80290-1. [DOI] [PubMed] [Google Scholar]
- Domen J., Weissman I.L. Self-renewal, differentiation or deathregulation and manipulation of hematopoietic stem cell fate. Mol. Med. Today. 1999;5:201–208. doi: 10.1016/S1357-4310(99)01464-1. [DOI] [PubMed] [Google Scholar]
- Chao D.T., Korsmeyer S.J. BCL-2 familyregulators of cell death. Annu. Rev. Immunol. 1998;16:395–419. doi: 10.1146/annurev.immunol.16.1.395. [DOI] [PubMed] [Google Scholar]
- Ashkenazi A., Dixit V.M. Death receptorssignaling and modulation. Science. 1998;281:1305–1308. doi: 10.1126/science.281.5381.1305. [DOI] [PubMed] [Google Scholar]
- Adams J.M., Cory S. The Bcl-2 protein familyarbiters of cell survival. Science. 1998;281:1322–1326. doi: 10.1126/science.281.5381.1322. [DOI] [PubMed] [Google Scholar]
- Vaux D.L., Korsmeyer S.J. Cell death in development. Cell. 1999;96:245–254. doi: 10.1016/s0092-8674(00)80564-4. [DOI] [PubMed] [Google Scholar]
- Bakhshi A., Jensen J.P., Goldman P., Wright J.J., McBride O.W., Epstein A.L., Korsmeyer S.J. Cloning the chromosomal breakpoint of t(14;18) human lymphomasclustering around JH on chromosome 14 and near a transcriptional unit on 18. Cell. 1985;41:899–906. doi: 10.1016/s0092-8674(85)80070-2. [DOI] [PubMed] [Google Scholar]
- Cleary M.L., Smith S.D., Sklar J. Cloning and structural analysis of cDNAs for bcl-2 and a hybrid bcl-2/immunoglobulin transcript resulting from the t(14;18) translocation. Cell. 1986;47:19–28. doi: 10.1016/0092-8674(86)90362-4. [DOI] [PubMed] [Google Scholar]
- Tsujimoto Y., Croce C.M. Analysis of the structure, transcripts, and protein products of bcl-2, the gene involved in human follicular lymphoma. Proc. Natl. Acad. Sci. USA. 1986;83:5214–5218. doi: 10.1073/pnas.83.14.5214. [DOI] [PMC free article] [PubMed] [Google Scholar]
- Vaux D.L., Cory S., Adams J.M. Bcl-2 gene promotes haemopoietic cell survival and cooperates with c-myc to immortalize pre-B cells. Nature. 1988;335:440–442. doi: 10.1038/335440a0. [DOI] [PubMed] [Google Scholar]
- Vaux D.L., Aguila H.L., Weissman I.L. Bcl-2 prevents death of factor-deprived cells but fails to prevent apoptosis in targets of cell mediated killing. Int. Immunol. 1992;4:821–824. doi: 10.1093/intimm/4.7.821. [DOI] [PubMed] [Google Scholar]
- Sutton V.R., Vaux D.L., Trapani J.A. Bcl-2 prevents apoptosis induced by perforin and granzyme B, but not that mediated by whole cytotoxic lymphocytes. J. Immunol. 1997;158:5783–5790. [PubMed] [Google Scholar]
- Reap E.A., Felix N.J., Wolthusen P.A., Kotzin B.L., Cohen P.L., Eisenberg R.A. bcl-2 transgenic Lpr mice show profound enhancement of lymphadenopathy. J. Immunol. 1995;155:5455–5462. [PubMed] [Google Scholar]
- Strasser A., Harris A.W., Huang D.C., Krammer P.H., Cory S. Bcl-2 and Fas/APO-1 regulate distinct pathways to lymphocyte apoptosis. EMBO (Eur. Mol. Biol. Organ) J. 1995;14:6136–6147. doi: 10.1002/j.1460-2075.1995.tb00304.x. [DOI] [PMC free article] [PubMed] [Google Scholar]
- Traver D., Akashi K., Weissman I.L., Lagasse E. Mice defective in two apoptosis pathways in the myeloid lineage develop acute myeloblastic leukemia. Immunity. 1998;9:47–57. doi: 10.1016/s1074-7613(00)80587-7. [DOI] [PubMed] [Google Scholar]
- Mazel S., Burtrum D., Petrie H.T. Regulation of cell division cycle progression by bcl-2 expressiona potential mechanism for inhibition of programmed cell death. J. Exp. Med. 1996;183:2219–2226. doi: 10.1084/jem.183.5.2219. [DOI] [PMC free article] [PubMed] [Google Scholar]
- Brady H.J., Gil-Gomez G., Kirberg J., Berns A.J. Bax alpha perturbs T cell development and affects cell cycle entry of T cells. EMBO (Eur. Mol. Biol. Organ) J. 1996;15:6991–7001. [PMC free article] [PubMed] [Google Scholar]
- Fairbairn L.J., Cowling G.J., Reipert B.M., Dexter T.M. Suppression of apoptosis allows differentiation and development of a multipotent hemopoietic cell line in the absence of added growth factors. Cell. 1993;74:823–832. doi: 10.1016/0092-8674(93)90462-y. [DOI] [PubMed] [Google Scholar]
- Kondo M., Akashi K., Domen J., Sugamura K., Weissman I.L. Bcl-2 rescues T lymphopoiesis, but not B or NK cell development, in common gamma chain-deficient mice. Immunity. 1997;7:155–162. doi: 10.1016/s1074-7613(00)80518-x. [DOI] [PubMed] [Google Scholar]
- Akashi K., Kondo M., von Freeden-Jeffry U., Murray R., Weissman I.L. Bcl-2 rescues T lymphopoiesis in interleukin-7 receptor-deficient mice. Cell. 1997;89:1033–1041. doi: 10.1016/s0092-8674(00)80291-3. [DOI] [PubMed] [Google Scholar]
- Maraskovsky E., O'Reilly L.A., Teepe M., Corcoran L.M., Peschon J.J., Strasser A. Bcl-2 can rescue T lymphocyte development in interleukin-7 receptor-deficient mice but not in mutant rag-1−/− mice. Cell. 1997;89:1011–1019. doi: 10.1016/s0092-8674(00)80289-5. [DOI] [PubMed] [Google Scholar]
- Bauman J.G., de Vries P., Pronk B., Visser J.W. Purification of murine hemopoietic stem cells and committed progenitors by fluorescence activated cell sorting using wheat germ agglutinin and monoclonal antibodies. Acta Histochem. Suppl. 1988;36:241–253. [PubMed] [Google Scholar]
- Spangrude G.J., Scollay R. Differentiation of hematopoietic stem cells in irradiated mouse thymic lobes. Kinetics and phenotype of progeny. J. Immunol. 1990;145:3661–3668. [PubMed] [Google Scholar]
- Domen J., Gandy K.L., Weissman I.L. Systemic overexpression of BCL-2 in the hematopoietic system protects transgenic mice from the consequences of lethal irradiation. Blood. 1998;91:2272–2282. [PubMed] [Google Scholar]
- Morrison S.J., Weissman I.L. The long-term repopulating subset of hematopoietic stem cells is deterministic and isolatable by phenotype. Immunity. 1994;1:661–673. doi: 10.1016/1074-7613(94)90037-x. [DOI] [PubMed] [Google Scholar]
- Randall T.D., Weissman I.L. Phenotypic and functional changes induced at the clonal level in hematopoietic stem cells after 5-fluorouracil treatment. Blood. 1997;89:3596–3606. [PubMed] [Google Scholar]
- Lagasse E., Weissman I.L. bcl-2 inhibits apoptosis of neutrophils but not their engulfment by macrophages. J. Exp. Med. 1994;179:1047–1052. doi: 10.1084/jem.179.3.1047. [DOI] [PMC free article] [PubMed] [Google Scholar]
- Morrison S.J., Hemmati H.D., Wandycz A.M., Weissman I.L. The purification and characterization of fetal liver hematopoietic stem cells. Proc. Natl. Acad. Sci. USA. 1995;92:10302–10306. doi: 10.1073/pnas.92.22.10302. [DOI] [PMC free article] [PubMed] [Google Scholar]
- Farlie P.G., Dringen R., Rees S.M., Kannourakis G., Bernard O. bcl-2 transgene expression can protect neurons against developmental and induced cell death. Proc. Natl. Acad. Sci. USA. 1995;92:4397–4401. doi: 10.1073/pnas.92.10.4397. [DOI] [PMC free article] [PubMed] [Google Scholar]
- Necas E., Sefc L., Brecher G., Bookstein N. Hematopoietic reserve provided by spleen colony-forming units (CFU-S) Exp. Hematol. 1995;23:1242–1246. [PubMed] [Google Scholar]
- Necas E., Sefc L., Sulc K., Barthel E., Seidel H.J. Estimation of extent of cell death in different stages of normal murine hematopoiesis. Stem Cells. 1998;16:107–111. doi: 10.1002/stem.160107. [DOI] [PubMed] [Google Scholar]
- Moore K.A., Pytowski B., Witte L., Hicklin D., Lemischka I.R. Hematopoietic activity of a stromal cell transmembrane protein containing epidermal growth factor-like repeat motifs. Proc. Natl. Acad. Sci. USA. 1997;94:4011–4016. doi: 10.1073/pnas.94.8.4011. [DOI] [PMC free article] [PubMed] [Google Scholar]
- Varnum-Finney B., Purton L.E., Yu M., Brashem-Stein C., Flowers D., Staats S., Moore K.A., Le Roux I., Mann R., Gray G. The notch ligand, Jagged-1, influences the development of primitive hematopoietic precursor cells. Blood. 1998;91:4084–4091. [PubMed] [Google Scholar]
- Jones P., May G., Healy L., Brown J., Hoyne G., Delassus S., Enver T. Stromal expression of Jagged 1 promotes colony formation by fetal hematopoietic progenitor cells. Blood. 1998;92:1505–1511. [PubMed] [Google Scholar]
- Morrison S.J., Wright D.E., Weissman I.L. Cyclophosphamide/granulocyte colony-stimulating factor induces hematopoietic stem cells to proliferate prior to mobilization. Proc. Natl. Acad. Sci. USA. 1997;94:1908–1913. doi: 10.1073/pnas.94.5.1908. [DOI] [PMC free article] [PubMed] [Google Scholar]
- Yang E., Korsmeyer S.J. Molecular thanatopsisa discourse on the BCL2 family and cell death. Blood. 1996;8:386–401. [PubMed] [Google Scholar]
- Ekert P.G., Vaux D.L. Apoptosis, haemopoiesis and leukaemogenesis. Baillieres Clin. Haematol. 1997;10:561–576. doi: 10.1016/s0950-3536(97)80026-1. [DOI] [PubMed] [Google Scholar]
- Cory S., Vaux D.L., Strasser A., Harris A.W., Adams J.M. Insights from Bcl-2 and Mycmalignancy involves abrogation of apoptosis as well as sustained proliferation. Cancer Res. 1999;59:1685s–1692s. [PubMed] [Google Scholar]
- O'Reilly L.A., Huang D.C., Strasser A. The cell death inhibitor Bcl-2 and its homologues influence control of cell cycle entry. EMBO (Eur. Mol. Biol. Organ.) J. 1996;15:6979–6990. [PMC free article] [PubMed] [Google Scholar]
- de Haan G., Van Zant G. Intrinsic and extrinsic control of hemopoietic stem cell numbersmapping of a stem cell gene. J. Exp. Med. 1997;186:529–536. doi: 10.1084/jem.186.4.529. [DOI] [PMC free article] [PubMed] [Google Scholar]
