Germinal Center Formation and Local Immunoglobulin E (IgE) Production in the Lung after an Airway Antigenic Challenge (original) (raw)
Abstract
Airway inflammation plays a central role in the pathogenesis of asthma. However, the precise contribution of all cell types in the development and maintenance of airway hyperreactivity and histopathology during allergic inflammation remains unclear. After sensitization of mice in the periphery, challenge by multiple intratracheal (i.t.) instillations of ovalbumin (OVA) results in eosinophilia, mononuclear cell infiltration, and airway epithelial changes analogous to that seen in asthma (Blyth, D.I., M.S. Pedrick, T.J. Savage, E.M. Hessel, and D. Fattah. 1996. Am. J. Respir. Cell Mol. Biol. 14:425–438). To investigate further the nature of the cellular infiltrate, lungs from OVA-versus saline-treated mice were processed for histology and immunohistochemistry. One of the most striking features observed was the formation of germinal centers within the parenchyma of the inflamed lungs. In addition, follicular dendritic cells (FDCs) bearing OVA on their plasma membranes appeared and, adjacent to these sites, OVA-specific IgG1-, IgE-, and IgA-producing plasma cells emerged. To confirm that antigen-specific immunoglobulins (Ig) were being produced within the parenchyma, plasma cell number and antibody production were quantitated in vitro after isolation of cells from the lung. These assays confirmed that the isotypes observed in situ were a secreted product. As IgE-dependent mechanisms have been implicated as being central to the pathogenesis of bronchial asthma, airway hyperresponsiveness was evaluated. The mice undergoing lung inflammation were hyperresponsive, while the control group remained at baseline. These data demonstrate that antigen-driven differentiation of B cells via induction of an FDC network and germinal centers occurs in the parenchyma of inflamed lungs. These germinal centers would then provide a local source of IgEsecreting plasma cells that contribute to the release of factors mediating inflammatory processes in the lung.
Germinal centers are unique microenvironments in which affinity maturation of the antibody response occurs (2, 3). In addition, in these sites, Ig rearrangement of heavy chains is facilitated, resulting in the production of switched Ig isotypes (4, 5). B cells that exit the germinal center response are either preplasma cells that finish their differentiation elsewhere or memory cell clones (6, 7).
Germinal center reactions are usually studied within secondary lymphoid tissues such as tonsils, lymph nodes, and spleens. However, an extensive network of lymphoid tissue can also be observed along the digestive and respiratory tract, referred to as gut-associated lymphoid tissue (GALT1, which includes the Peyer's patches) and bronchus-associated lymphoid tissue (BALT; 8). BALT consists of follicular aggregates of lymphocytes in which high endothelial venules are present (9). These are constitutive structures in certain species, such as rats and rabbits (10). However, in other species such as humans and pigs, the development of BALT appears to be dependent on antigenic challenges such as bacterial infections (11–13). The role of germinal centers in BALT during inflammatory conditions as a protective versus pathogenic entity remains to be determined.
One of the key elements in experimental models of allergy and asthma is IgE (14). Mast cells, monocytes, macrophages, eosinophils, basophils, and bronchopulmonary dendritic cells are induced to mediate mechanisms of inflammation via the high affinity receptor for IgE (15, 16). In sensitized individuals, both blood serum and lung lavage fluids contain large quantities of allergen-specific IgE (17–19). Although the source of these antibodies is assumed to be generated solely in lymph nodes draining the lung, large numbers of cells also infiltrate the parenchyma (20).
In an attempt to define further the nature of these cellular infiltrates and determine whether a local source of IgE is produced, a mouse model of allergic pulmonary inflammation was employed. Mice primed parenterally with OVA in the absence of adjuvant were then intratracheally (i.t.) challenged with saline or OVA (20a). 3 d after the final i.t. provocation, blood serum Ig levels were quantitated and the histological changes within the lungs evaluated. The results demonstrate that germinal centers within BALT arise after exposure to airway antigen. Furthermore, antigenspecific IgE-secreting plasma cells were detected in the adjacent infiltrate. Local germinal center reactions via the ability to induce antigen-specific IgE-secreting preplasma cells may then contribute ultimately to the pathology of allergic asthma.
Materials and Methods
Sensitization and Intratracheal Challenge with Ovalbumin.
Sensitization was performed using the method of Hessel and colleagues (21). 8-wk-old female BALB/c mice (Centre d'Elevage Janvier, Le Genest Saint-Isle, France) were immunized by either i.p. or s.c. injections of 10 μg OVA (A-5503, Sigma Chemical Corp., St. Louis, MO) in 0.1 ml NaCl (0.9% wt/vol) every other day for 14 d. Sham-sensitized mice received 0.1 ml of NaCl using the same protocol.
On day 40 after the beginning of parenteral sensitization, mice were challenged by i.t. instillation of OVA. For this, mice were anesthetized i.p. with 0.2 ml of Saffan anesthesia (Vet Drug, Ltd., Dunnington, York, UK), OVA (20 μg in 10 μl saline) was delivered i.t. using the method of Ho and Furst (22). Sham-challenged mice received 10 μl saline. A second control group involved challenging the OVA-sensitized mice with saline. The effects of treatment were studied after three challenges, each 3 d apart. 3 d after the final provocation, groups of mice were killed and lungs processed for the various assays.
Measurement of OVA-specific Serum and Supernatant Igs.
OVAspecific IgE, IgG1, IgG2a, and IgG2b antibody titers were measured in the serum samples obtained 3 d after the final i.t. treatment using a standard ELISA protocol. In addition, supernatants from the culture of cells isolated to determine the number of antibody-producing cells present in the lung were also tested (see Isolation of Lung Cells). For the ELISAs, 96-well microtiter plates (Maxisorp; Nunc Life Technologies, Basel, Switzerland) were coated with OVA (20 μg/ml; diluted in NaHCO3 buffer, pH 9.6). After overnight incubation at 4°C, plates were washed and blocked with PBS containing 10% FCS for 30 min at room temperature. Serum samples were diluted in blocking buffer. Twofold serial dilutions were prepared and incubated overnight at 4°C. After washing, either peroxidase-conjugated polyclonal sheep anti–mouse IgG1, IgG2a, or IgG2b (Binding Site, Birmingham, UK) or a monoclonal rat anti–mouse IgE, EM95 (23), diluted in PBS containing 0.1% Tween buffer were added for an additional 1 h. The rat anti–mouse IgE, EM95, was followed by a peroxidase-conjugated mouse anti–rat IgG (Jackson Immunoresearch Laboratories, West Grove, PA). The reaction was developed and the plates read with a microplate autoreader (MR 5000; Dynatech, Embrach-Embraport, Switzerland).
Evaluation of Allergen-induced Airway Hyperresponsiveness.
Airway responsiveness was measured by recording respiratory pressure curves by whole body plethysmography (Buxco®, EMKA Technologies, Paris, France) in response to inhaled methacholine at 3 × 10⁻² M, for 20 s (Aldrich-Chemie, Steinhein, Germany). This method allows measurements of spontaneous breathing in a nonrestrained mouse. The airway reactivity was expressed in enhanced pause (Penh), a calculated value that correlates with measurement of airway resistance, impedance, and intrapleural pressure in the same mouse. Penh = (Te/Tr-1) × Pef/Pif (Te, expiration time; Tr, relaxation time; Pef, peak expiratory flow; Pif, peak inspiratory flow) (24).
Lung Histopathology.
Whole lungs were washed with PBS and inflated by instillation of OCT compound (Tissue-tek®; Miles Inc, Elkhart, IN) via the trachea. The tissue was then removed and snap-frozen. 8–10 μm cryosections were fixed in methanol at 20°C for 2.5 min and either stained with Giemsa (Fluka Chemika, Buchs, Switzerland) for light microscopic examination or processed for immunohistochemistry. After rehydration in PBS, sections were incubated for 30 min at 20°C with fluorescein-conjugated goat antibodies directed against mouse IgG1 or IgA (Southern Biotechnology Associates, Inc., Birmingham, AL) or rat anti–mouse IgE (EM95), anti-FDC (FDC-M1), followed by fluorescein-conjugated mouse F(ab′)2 anti–rat IgG antibodies (Southern Biotechnology Associates, Inc.). Germinal center B cells were identified using biotinylated peanut agglutinin (PNA; Vector Laboratories, Inc., Burlingame, CA) and plasma cells revealed using biotinylated Syndecan-1 (PharMigen, San Diego, CA), each followed by streptavidin–Texas red (Southern Biotechnology Associates, Inc.). OVA-specific antibodies were detected using biotinylated OVA followed by streptavidin–Texas red.
Isolation of Lung Cells.
3 d after the final provocation, lungs were perfused with PBS containing 100 U/ml of heparin through the circulatory system to remove residual blood. Pulmonary and other regional lymph nodes were dissected away from the lungs and discarded. The lungs were then enzyme digested with 0.8 mg/ml collagenase IV (Worthington Biochemical, Freehold, NJ) and DNAse 0.1% (Sigma) in IMDM (GIBCO BRL, Basel, Switzerland). The single cell suspension was then fractionated using a continuous Percoll gradient. The low buoyant density cells were obtained and generally represented between 25 and 50% of the total population. These cells were then washed and either cultured (3 × 10⁵ cells per well in 100 μl of IMDM containing 5% FCS and antibiotics) for 7 d for harvesting of supernatants to detect secreted antibody by an ELISA or prepared for the ELISPOT assays.
ELISPOT Assays.
Isolated low buoyant density lung cells were distributed in triplicate (105 cells per well in 100 μl of IMDM containing 5% FCS and antibiotics) into 96-well nitrocellulose-based microplates (Millipore Corp., Bedford, MA) that were precoated with OVA (20 μg/ml) and incubated at 37°C, 5% CO2. The next day, the wells were processed for identification of isotype-specific antibodies. After 3 h incubation at 37°C with alkaline phosphatase–conjugated goat anti–mouse IgM, IgG2a, IgG2b, IgG1, and IgA antibodies (Southern Biotechnology Associates, Inc.), the plates were washed and incubated with the developing substrate 5-bromo-chloro-3-indolphosphate (Boehringer) in 0.1 M Tris (pH 9.5), 0.1 M NaCl, and 5 mM MgCl.
Results
Immunization of Mice and Serum Antibody Titers.
In this model of lung inflammation, three different treatments were performed. The experimental group consisted of mice sensitized with injections of OVA either i.p. or s.c. followed by OVA being placed i.t. As no differences were observed between these two routes of immunization, these data are represented together as the OVA/OVA experimental group. The control immune group, OVA/NaCl, received i.p. or s.c. injections of OVA followed by NaCl i.t. Finally, a sham control group, NaCl/NaCl, received NaCl in the periphery for priming and NaCl i.t.
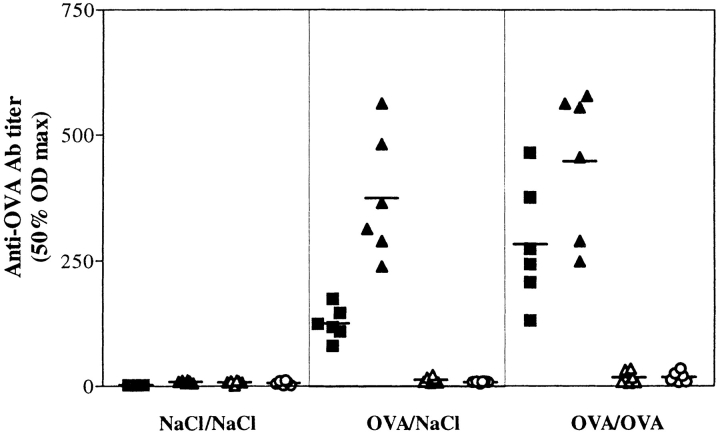
3 d after the final i.t. challenge, blood was obtained from mice in each group and the titer of OVA-specific antibody quantitated (Fig. 1). As expected, the sera of the sham control mice contained no anti-OVA antibodies, while both groups of mice primed in the periphery produced significant amounts of antigen-specific Ig. The isotypes of these anti-OVA antibodies were restricted to IgM (data not shown), IgG1, and IgE, as no IgG2a or IgG2b were detected. These results demonstrate that in the circulation, anti-OVA antibodies are present in both the immune control and experimental groups of mice.
Figure 1.
OVA-specific Ig serum titers are elevated in OVA sensitized mice. Serum samples were taken 3 d after the final i.t. challenge. The NaCl/NaCl group is the sham-treated mice, OVA/NaCl is the group primed to OVA but given NaCl in the trachea, and OVA/OVA is the experimental group. Anti-OVA IgE (▪), IgG1 (▴), IgG2a (▵), and IgG2b (○) were measured by ELISA. The 50% OD maximums were calculated from the titration curves of each sample.
Presence of BALT and OVA specific IgG1, IgA, and IgE.
To assess the cellular changes occuring in situ, cryosections were prepared from the lungs. Fig. 2 shows the differences observed between lungs from the OVA/NaCl- (A and B) versus OVA/OVA-treated (C–F) mice. Fig. 2 A is a low power magnification of a primary bronchus with several branching points. As seen in the higher magnification in Fig. 2 B, there is no evidence of cellular infiltrates or epithelial pertubations in the OVA/NaCl controls. In contrast, in Fig. 2, C and E, two types of areas are indicated (arrows) in which cells accumulate after antigen challenge in the trachea (i.e., OVA/OVA treated). Fig. 2 D, a higher magnification of C, contains a spherical infiltrate resembling a lymphoid follicle adjacent to the epithelial surface. Note also the changes occurring at the epithelial surface. Fig. 2 F, a higher magnification of E, presents a more diffuse infiltrate occuring between blood vessels and airways. The histology of the NaCl/NaCl-treated group was similar to the OVA/NaCl group and therefore not shown.
Figure 2.
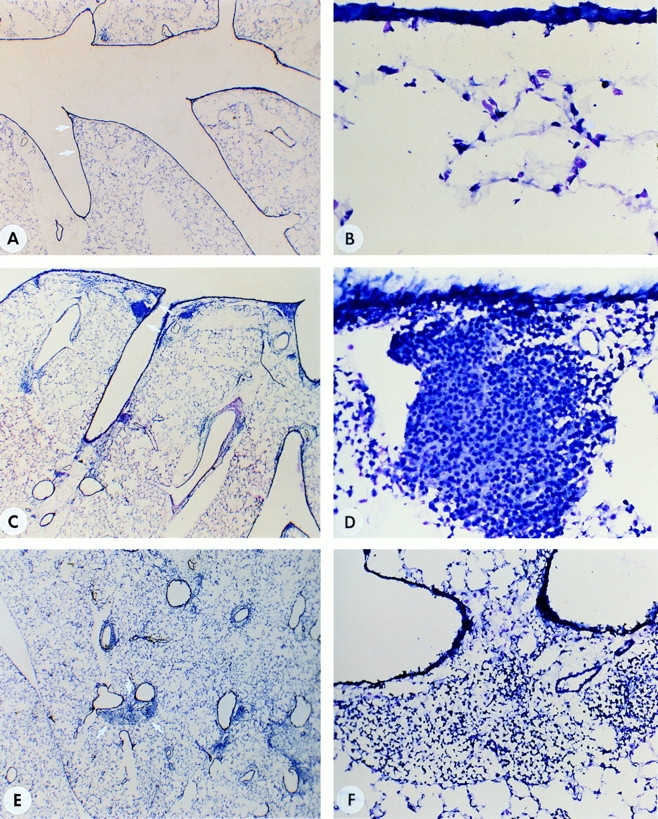
Histological evaluation of lungs. (A and B [controls]) Cryosections of lung tissue stained with Giemsa from a mouse primed with OVA but challenged intratracheally with NaCl (OVA/NaCl). B is a higher magnification of the area indicated by arrows in A. (C and D) Cryosections of tissue from the lung of a mouse primed and challenged intratracheally with OVA (OVA/OVA). Note the formation of BALT in the vicinity where the primary bronchus branches (C, arrows). D is a higher magnification of the BALT. Note the change in the epithelium (as compared with B) as well as the organization of cells in a follicle. (E and F) Cryosections of tissue from lung of another OVA/OVA-treated mouse, this time concentrating on the appearance of cellular infiltrates within the parenchyma. F is a higher magnification of the infiltrate indicated by arrows in E. Original magnifications, (A, C, E) ×30; (B and D) ×400; (F) ×200.
To determine the nature of these infiltrates, immunohistochemistry was performed. The components present in the follicular-like structures are shown in Fig. 3, A–D and those of the diffuse aggregates in Fig. 3, E–K. As can be seen in Fig. 3 A, PNA-binding cells (in red), representative of germinal center B cells, were present. In addition, FDCM1-positive FDCs were identified (green; Fig. 3, A–D). In the adjacent section to Fig. 3, A and B, the FDC-M1-positive cells shown as green in C also bore anti-OVA antibodies as revealed using double immunolabeling (D) with biotinylated OVA and avidin–Texas red.
Figure 3.
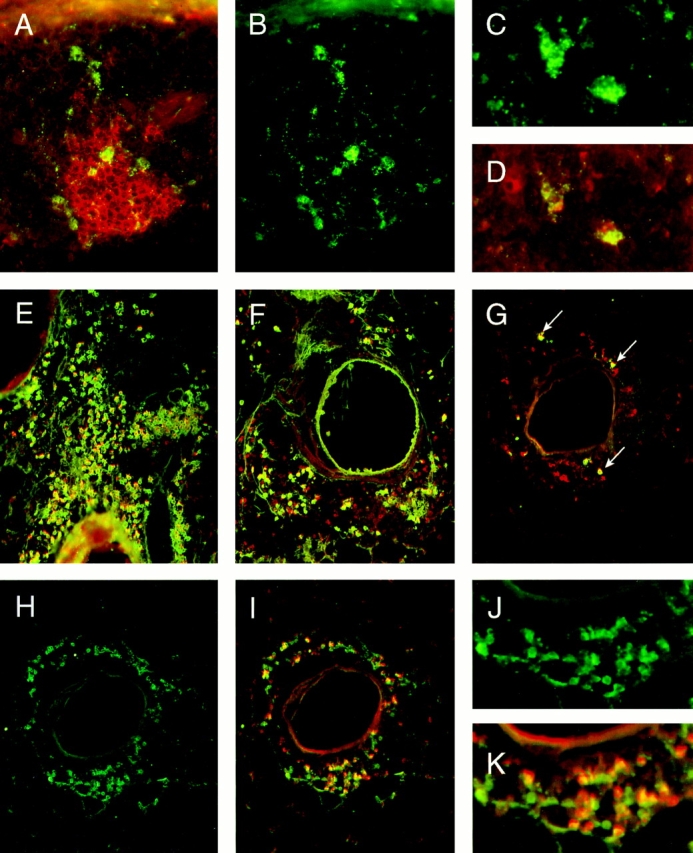
Immunohistochemical evaluation of lungs from OVA/OVA-treated mice. A–D reveal the presence of germinal centers and FDCs in the BALT of OVA/OVA-treated mice. E–K focus on the nature of the IgG-, IgA-, and IgE-positive cells within the diffuse infiltrates. A shows the double immunolabeling of FDC-M1-positive cells (green) and PNA binding cells (red). B shows only the FDC-M1 positive cells (green) of the same section to identify more clearly the FDC network within the tissue. C again is the single fluorescence of FDC-M1 positive cells (green) in the adjacent section to A and B. D shows by double immunolabeling the binding of biotinylated OVA (revealed by Texas red) to anti-OVA antibodies present on these FDC-M1-positive cells shown in C (the green plus red produces yellow). E–G show by double immunolabeling the isotype of OVA-binding cells present within the diffuse infiltrates. Using FITC-conjugated anti-IgG1 (E), anti-IgA (F), or anti-IgE (G), reagents in combination with biotinylated OVA followed by avidin Texas red revealed the presence of many OVA-specific antibody-positive cells (G, double positive cells are in yellow; arrows). In an adjacent section to G (H–K are all the same section), the presence of plasma cells were confirmed using the rat monoclonal antibody, Syndecan-1, followed by a secondary FITC-conjugated mouse anti–rat Ig antibody. H reveals only the Syndecan-1-positive cells (green), while I demonstrates by double immunolabeling (yellow) the capacity of many of these cells to bind OVA (using the above mentioned biotinylated OVA and avidin Texas red) indicating their antigen specificity. J and K are included as higher magnifications of H and I, respectively, to demonstrate that all OVA binding cells are double positive (orange–yellow), while some Syndecan-1 positive cells are only single positive. Original magnifications (A and B) ×80; (C and D) ×200; (E_–_I) ×50; (J and K) ×150.
Using anti-Ig isotype-specific reagents, IgG1 (Fig. 3 E), IgA (F) and IgE (G) positive cells (in green) were detected within the diffuse aggregates. In addition, double immunolabeling with biotinylated OVA (revealed in red by avidin– Texas red) demonstrated that many of these cells were producing anti-OVA antibodies (Fig. 3, E–G; the combination of OVA and anti-Ig isotype binding produces the yellow). To confirm that these were plasma cells producing antigenspecific antibody, adjacent sections were incubated with Syndecan-1 (a monoclonal antibody that recognizes plasma cells) and biotinylated OVA. Fig. 3 H (and a higher magnification shown in J) revealed that many of the cells were Syndecan-1 positive (green). Analyzing the green Syndecan-1 together with the binding of the biotinylated OVA (red) (Fig. 3 I, and its higher magnification in K) demonstrated that all the cells binding OVA also were Syndecan-1 positive (orange–yellow color). However, not all Syndecan-1 positive cells bound OVA (Fig. 3 K, some are green only), indicating that plasma cells producing antibodies of other specificities were present. Immunolabeling for CD4+ T cells revealed their presence mainly in the diffuse infiltrates, although a few were scattered within the lymphoid follicle (micrograph not shown).
Quantitation of Anti-OVA Plasma Cells.
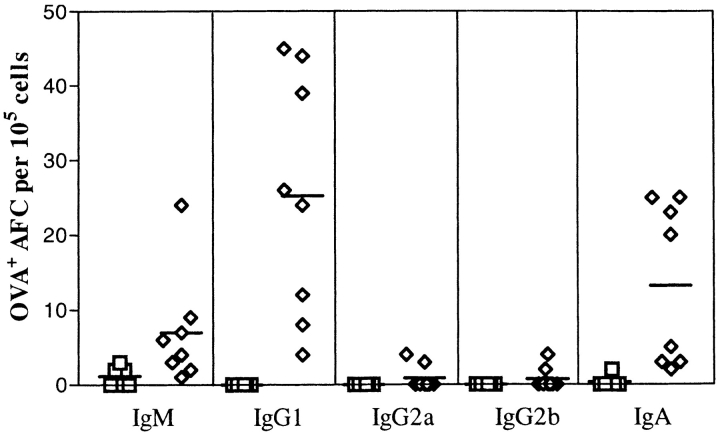
To determine the number of anti-OVA-producing cells present within the lung, an ELISPOT assay was utilized. The cells were obtained as outlined in Materials and Methods from enzymedigested lungs that had been prelavaged with saline. An enrichment step was introduced in order to concentrate the frequency of low buoyant density cells using sedimentation gradients. As can be seen in Fig. 4, only the lungs of mice that had received OVA in the trachea contained anti-OVAforming cells (AFCs). Their presence could not be attributed to a contaminating contribution from the residual blood of the lung, as no AFCs were detected in the OVAprimed but NaCl-challenged mice (OVA/NaCl groups). The isotypes again were restricted, as only IgM, IgG1, and IgA were detected and not IgG2a and IgG2b.
Figure 4.
Quantification of the number of anti-OVA plasma cells isolated from lung. The low buoyant density cells prepared from lungs of control mice, NaCl/NaCl, OVAip/NaCl, and OVAsc/NaCl (squares) and of experimental mice, OVAip/OVA, and OVAsc/OVA (diamonds) were incubated on OVA-coated wells before identification of the Ig isotype. Results are plotted as the number of OVA-specific antibody-forming cells (AFC) identified per 105 low buoyant density cells. Each data point represents the mean of triplicate wells for cells from an individual mouse.
Detection of IgE-specific Anti-OVA.
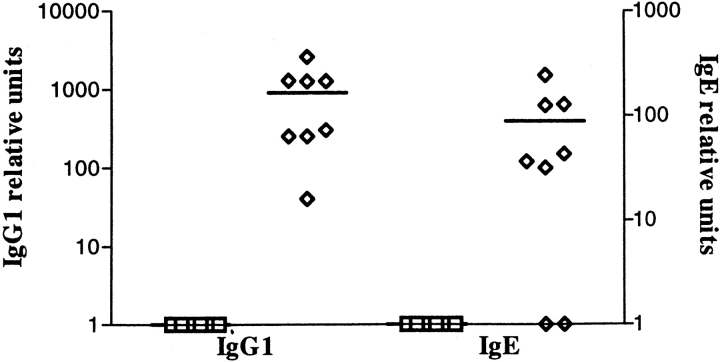
Interestingly, only an occasional anti-OVA-producing cell of the IgE isotype was detectable by the ELISPOT technique. We reasoned based on the immunohistology that the number of IgE-secreting cells was at least 10- to 20-fold lower than IgG1 and might be at the limit of detection in the assay. To confirm the production of antigen-specific IgE from the cells of the lung, the low buoyant density cells were also placed in culture for 7 d and the supernatants analyzed for the presence of OVA-specific IgG1 and IgE. As shown in Fig. 5, these cells producing IgE were present, but at an ∼10-fold lower frequency as compared with the IgG1-producing cells.
Figure 5.
Anti-OVA titers in supernatants of cells isolated from lung tissue. The same low buoyant density cells obtained in Fig. 4 were cultured for 7 d and the supernatants harvested. OVA-specific IgG1 and IgE titers were measured by ELISA. As in Fig. 4, square symbols represent titers of Igs detected in cell supernatants prepared from lungs of control mice, NaCl/NaCl, OVAip/NaCl, and OVAsc/NaCl, and the diamond symbols represent Ig titers detected in cell supernatants prepared from lungs of experimental mice, OVAip/OVA, and OVAsc/OVA. The results represent the mean of triplicate wells from an individual mouse.
Airway Hyperresponsiveness in the Lung.
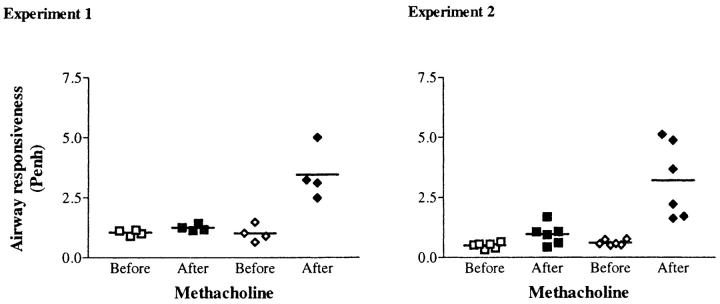
To determine whether the changes occuring histologically were associated with alterations in airway responsiveness, the spontaneous breathing patterns of nonrestrained mice in response to methacholine were monitored. From the respiratory pressure curves recorded, values for the Penh were calculated and plotted in Fig. 6. The two graphs shown represent independent experiments demonstrating that an increase in the Penh value occurs in OVA/OVA mice after exposure to nebulized methacholine. Baseline measurements in OVAsensitized mice challenged with OVA or NaCl were not significantly different (Penh = 1.01 ± 0.34, 1.04 ± 0.11, n = 4, and 0.51 ± 0.11, 0.61 ± 0.11, n = 6, respectively). After methacholine aerosol, Penh values showed a 3.4 (n = 4) and 5.2 (n = 6) fold increase in OVA/OVA mice. This is in contrast with the OVA/NaCl-treated mice for which the Penh values remained at baseline level after methacholine aerosol (Penh = 1.24 ± 0.13, n = 4 and 0.96 ± 0.43, n = 6). These experiments documented that an increase in airway responsiveness occurs under conditions where germinal centers are also induced to form.
Figure 6.
Increased airway responsiveness to methacholine in OVAsensitized/OVA-challenged mice. Airway reactivity in response to methacholine (3 × 10⁻² M, for 20 s) was measured by whole-body plethysmography (Buxco®) in the control group OVA/NaCl (squares) versus the experimental group OVA/OVA (diamonds). This method allows measurements of spontaneous breathing in a nonanesthetized mice by recording respiratory pressure curves before (open symbols) and after (closed symbols) methacholine inhalation. From the curves, values for the enhanced pause (Penh) are calculated and used as an index of airway responsiveness.
Discussion
The findings presented here demonstrate that in response to an airway antigenic challenge, local histological changes occur that have a dramatic potential for exacerbating inflammatory processes. This includes the formation of germinal centers with antigen-retaining FDC as well as cellular infiltrates containing significant numbers of plasma cells (Fig. 3). The demonstration of BALT with germinal centers, which are sites of B cell Ig class switch and affinity maturation, provides evidence for local B cell activation and differentiation. The use of reagents, such as Syndecan-1 (Fig. 3), and the quantitation of isotype specific Ig by antibody capture assays (Figs. 4 and 5) confirm the presence in the lung parenchyma of plasma cells secreting IgG1, IgA, and IgE. Since cross-linking the high affinity IgE receptor via allergen triggers activation in many of the cell types responsible for inflammatory processes, these observations suggest a mechanism for promoting the ultimately detrimental extent of the reaction to an airborne protein.
Many studies have concentrated on the T cell component of lung inflammation (25, 26). These data demonstrate that there is a propensity to develop cells that secrete Th2 cytokines, such as IL-4 (27–29). This pattern of cytokine production also promotes T cell help for B cells (30, 31) and would be in line with our findings of local induction of B cell activation and differentiation towards IgG1 and IgE production. The ability to define plasma cells using Syndecan-1 proved to be an essential tool for demonstrating that the IgE-positive cells detected in the lung, reported here by us and elsewhere by others (32), are antibody-producing plasma cells and not IgE-binding inflammatory cells, which are also seen in the sections. Our demonstration of BALT containing germinal centers furthermore provides evidence of a local microenvironment for the preplasma cell induction.
The experimental murine model of lung inflammation presented here appears to be a reasonable choice, as recently Blyth and colleagues (1) have shown that it mimics many characteristic features found in asthma. Eosinophilia, activation of macrophages, recruitment of lymphocytes, neutrophils and monocytes, and changes in airway epithelium, including goblet cell hyperplasia with concurrent appearance of mucus plugs, occur in the lung. In addition, the T cells that infiltrate the lung are antigen specific and produce IL-4 when restimulated in vitro (Chvatchko, Y., T. Coyle, M. Kosco-Vilbois, J.P. Aubry, and J.Y. Bonnefoy, manuscript in preparation). In the present study, we were also able to document the development of airway hyperresponsiveness. As these features correlate well with the components of allergic asthma ascribed to patients, our observations of germinal center development in this experimental model are significant. IgE being a major mediator of inflammatory processes and germinal centers being a common site for Ig class switch imply a potential pathologic role for the formation of these microenvironments locally. Further identification of the factors controlling responses occuring within BALT and germinal centers may prove an effective approach for reducing the incidence of asthmatic attacks in airway-sensitized individuals.
The formation of BALT and its relationship to inflammatory processes has been a matter of speculation. It appears that in certain species, such as our observations presented here for mice and from other investigators concerning human lungs, report BALT is induced upon challenge with pathogens (9, 33, 34). While some argue the significance of BALT in adult tissue (10), investigators have clearly shown that in infants and children, BALT can more often be detected and again appears dependent upon antigenic stimulation (13, 35). Slavin and colleagues (36), for example, observed BALT in the lung biopsies obtained from a 13-yr-old patient suffering with allergic bronchopulmonary aspergillosis. Not long ago, after reviewing the current status of the field, Holt (37) suggested that protocols to induce immune deviation in children along mucosal surfaces may be an effective means to lessen the incidence of atopic allergy and asthma. In light of the fact that germinal centers form in mice rendered deficient for IL-4 (38) and deviate the production of isotypes towards IgG2a and IgG2b instead of IgG1 and IgE (39), such a strategy would appear reasonable. The protective component of mucosal germinal center responses would be maintained, while the arm contributing to the pathogenesis, i.e., IgE production, would be eliminated. The ability to skew the T cell response away from a Th2 phenotype is currently an intensely pursued area and, using the model presented here, we are also attempting to determine how this could be achieved locally in the BALT.
Footnotes
The authors wish to thank A.J. Coyle and C. Plater-Zyberk for helpful discussions in the preparation of this manuscript, D. Blyth for help in establishing the experimental murine model, and J. Knowles for continued support.
1 Abbreviations used in this paper: PNA, peanut agglutinin; FDC, follicular dendritic cell; GALT, gut-associated lymphoid tissue; BALT, bronchusassociated lymphoid tissue; i.t., intratracheal; Penh, enhanced pause.
Y. Chvatchko and M. Kosco-Vilbois contributed equally to this work.
References
- 1.Deleted in proof.
- 2.Kelsoe G. Life and death in germinal centers (redux) Immunity. 1996;4:107–111. doi: 10.1016/s1074-7613(00)80675-5. [DOI] [PubMed] [Google Scholar]
- 3.Rajewsky K. Clonal selection and learning in the antibody system. Nature (Lond) 1996;381:751–758. doi: 10.1038/381751a0. [DOI] [PubMed] [Google Scholar]
- 4.MacLennan IC. Germinal centers. Annu Rev Immunol. 1994;12:117–139. doi: 10.1146/annurev.iy.12.040194.001001. [DOI] [PubMed] [Google Scholar]
- 5.Liu Y-J, Malisan F, de Bouteiller O, Guret C, Lebecque S, Banchereau J, Mills FC, Max EE, Martinez-Valdez H. Within germinal centers, isotype switching of immunoglobulin genes occurs after the onset of somatic mutation. Immunity. 1996;4:241–259. doi: 10.1016/s1074-7613(00)80432-x. [DOI] [PubMed] [Google Scholar]
- 6.Tew JG, DiLosa RM, Burton GF, Kosco MH, Kupp LI, Masuda A, Szakal AK. Germinal centers and antibody production in bone marrow. Immunol Rev. 1992;126:99–112. doi: 10.1111/j.1600-065x.1992.tb00633.x. [DOI] [PubMed] [Google Scholar]
- 7.Gray D. Immunological memory. Annu Rev Immunol. 1993;11:49–77. doi: 10.1146/annurev.iy.11.040193.000405. [DOI] [PubMed] [Google Scholar]
- 8.Bienenstock, J. 1984. Immunology of the Lung and Upper Respiratory Tract. McGraw Hill, New York.
- 9.Pabst R, Tschernig T. Lymphocytes in the lung: an often neglected cell. Numbers, characterization and compartmentalization. Anat Embryol (Berl) 1995;192:293–299. doi: 10.1007/BF00710098. [DOI] [PubMed] [Google Scholar]
- 10.Pabst R. Is BALT a major component of the human lung immune system? . Immunol Today. 1992;13:119–122. doi: 10.1016/0167-5699(92)90106-H. [DOI] [PubMed] [Google Scholar]
- 11.Pabst R, Gehrke I. Is the bronchus-associated lymphoid tissue (BALT) an integral structure of the lung in normal mammals, including humans? . Am J Respir Cell Mol Biol. 1990;3:131–135. doi: 10.1165/ajrcmb/3.2.131. [DOI] [PubMed] [Google Scholar]
- 12.Delventhal S, Hensel A, Petzoldt K, Pabst R. Effects of microbial stimulation on the number, size and activity of bronchus-associated lymphoid tissue (BALT) structures in the pig. Int J Exp Pathol. 1992;73:351–357. [PMC free article] [PubMed] [Google Scholar]
- 13.Gould SJ, Isaacson PG. Bronchus-associated lymphoid tissue (BALT) in human fetal and infant lung. J Pathol. 1993;169:229–234. doi: 10.1002/path.1711690209. [DOI] [PubMed] [Google Scholar]
- 14.Coyle AJ, Wagner K, Bertrand C, Tsuyuki S, Bews J, Heusser C. Central role of immunoglobulin (Ig) E in the induction of lung eosinophil infiltration and T helper 2 cell cytokine production: Inhibition by a non-anaphylactogenic anti-IgE antibody. J Exp Med. 1996;183:1303–1310. doi: 10.1084/jem.183.4.1303. [DOI] [PMC free article] [PubMed] [Google Scholar]
- 15.Drazen JM, Arm JP, Austen KF. Sorting out the cytokines of asthma. J Exp Med. 1996;183:1–15. doi: 10.1084/jem.183.1.1. [DOI] [PMC free article] [PubMed] [Google Scholar]
- 16.Semper AE, Hartley JA, Tunon-de-Lara JM, Bradding P, Redington AE, Church MK, Holgate ST. Expression of the high affinity receptor for immunoglobulin E (IgE) by dendritic cells in normals and asthmatics. Adv Exp Med Biol. 1995;378:135–138. doi: 10.1007/978-1-4615-1971-3_29. [DOI] [PubMed] [Google Scholar]
- 17.Burrows B, Martinez FD, Halonen M, Barbee RA, Cline MG. Association of asthma with serum IgE levels and skin-test reactivity to allergens. N Engl J Med. 1989;320:271–277. doi: 10.1056/NEJM198902023200502. [DOI] [PubMed] [Google Scholar]
- 18.Ricci M, Rossi O. Dysregulation of IgE responses and airway allergic inflammation in atopic individuals. Clin Exp Allergy. 1990;20:601–609. doi: 10.1111/j.1365-2222.1990.tb02698.x. [DOI] [PubMed] [Google Scholar]
- 19.Sears MR, Burrows B, Flannery EM, Herbison GP, Hewitt CJ, Holdaway MD. Relation between airway responsiveness and serum IgE in children with asthma and in apparently normal children. N Engl J Med. 1991;325:1067–1071. doi: 10.1056/NEJM199110103251504. [DOI] [PubMed] [Google Scholar]
- 20.Bentley AM, Maestrelli P, Saetta M, Fabbri LM, Robinson DS, Bradley BL, Jeffery PK, Durham SR, Kay AB. Activated T-lymphocytes and eosinophils in the bronchial mucosa in isocyanate-induced asthma. J Allergy Clin Immunol. 1992;89:821–829. doi: 10.1016/0091-6749(92)90437-7. [DOI] [PubMed] [Google Scholar]
- 20a.Blyth DI, Pedrick MS, Savage TJ, Hessel EM, Fattah D. Lung inflammation and epithelial changes in a murine model of atopic asthma. Am J Respir Cell Mol Biol. 1996;14:425–438. doi: 10.1165/ajrcmb.14.5.8624247. [DOI] [PubMed] [Google Scholar]
- 21.Hessel EM, Van Oosterhout AJM, Garsen J, Van Loveren H, Savelkoul HFJ, Nijkamp FP. Immediate asthmatic reactions and changes in airway responsiveness after single versus chronic ovalbumin inhalation in sensitized mice. Eur J Allergy Clin Immunol. 1993;48:101–108. [Google Scholar]
- 22.Ho W, Furst A. Intratracheal instillation method for mouse lungs. Oncology. 1973;27:385–393. doi: 10.1159/000224748. [DOI] [PubMed] [Google Scholar]
- 23.Baniyash M, Eshhar Z. Inhibition of IgE binding to mast cells and basophils by monoclonal antibodies to murine IgE. Eur J Immunol. 1984;14:799–807. doi: 10.1002/eji.1830140907. [DOI] [PubMed] [Google Scholar]
- 24.Schwarze, J., E. Hamelmann, G. Larsen, and E.W. Gelfand. 1996. Whole body plethysmography (WBP) in mice detects airways sensitization through changes in lower airway function. Am. Acad. Allergy Asthma Immunol. (Abstr.)
- 25.Azzawi M, Johnston PW, Majumdar S, Kay AB, Jeffery PK. T lymphocytes and activated eosinophils in airway mucosa in fatal asthma and cystic fibrosis. Am Rev Respir Dis. 1992;145:1477–1482. doi: 10.1164/ajrccm/145.6.1477. [DOI] [PubMed] [Google Scholar]
- 26.Walker C, Kaegi MK, Braun P, Blaser K. Activated T cells and eosinophilia in bronchoalveolar lavages from subjects with asthma correlated with disease severity. J Allergy Clin Immunol. 1991;88:935–942. doi: 10.1016/0091-6749(91)90251-i. [DOI] [PubMed] [Google Scholar]
- 27.Robinson DS, Hamid Q, Ying S, Tsicopoulos A, Barkans J, Bentley AM, Corrigan C, Durham SR, Kay AB. Predominant TH2-like bronchoalveolar T-lymphocyte population in atopic asthma. N Engl J Med. 1992;326:298–304. doi: 10.1056/NEJM199201303260504. [DOI] [PubMed] [Google Scholar]
- 28.Del Prete GF, De Carli M, D'Elios MM, Maestrelli P, Ricci M, Fabbri L, Romagnani S. Allergen exposure induces the activation of allergen-specific Th2 cells in the airway mucosa of patients with allergic respiratory disorders. Eur J Immunol. 1993;23:1445–1449. doi: 10.1002/eji.1830230707. [DOI] [PubMed] [Google Scholar]
- 29.Corry DB, Folkesson HG, Warnock ML, Erle DJ, Matthay MA, Wiener-Kronish JP, Locksley RM. Interleukin 4, but not interleukin 5 or eosinophils, is required in a murine model of acute airway hyperreactivity. J Exp Med. 1996;183:109–117. doi: 10.1084/jem.183.1.109. [DOI] [PMC free article] [PubMed] [Google Scholar]
- 30.Geha RS. Regulation of IgE synthesis in humans. J Allergy Clin Immunol. 1992;90:143–150. doi: 10.1016/0091-6749(92)90064-9. [DOI] [PubMed] [Google Scholar]
- 31.Steele DJR, Laufer TM, Smiley ST, Ando Y, Grusby MJ, Glimcher LH, Auchincloss HJ. Two levels of help for B cell alloantibody production. J Exp Med. 1996;183:699–703. doi: 10.1084/jem.183.2.699. [DOI] [PMC free article] [PubMed] [Google Scholar]
- 32.Thepen T, McMenamin C, Girn B, Kraal G, Holt PG. Regulation of IgE production in pre-sensitized animals: in vivo elimination of alveolar macrophages preferentially increases IgE responses to inhaled allergen. Clin Exp Allergy. 1992;22:1107–1114. doi: 10.1111/j.1365-2222.1992.tb00137.x. [DOI] [PubMed] [Google Scholar]
- 33.Nicholson AG, Wotherspoon AC, Diss TC, Hansell DM, Du Bois R, Sheppard MN, Isaacson PG, Corrin B. Reactive pulmonary lymphoid disorders. Histopathology. 1995;26:405–412. doi: 10.1111/j.1365-2559.1995.tb00247.x. [DOI] [PubMed] [Google Scholar]
- 34.Wallace WAH, Howie SEM, Krajewski AS, Lamb D. The immunological architecture of B-lymphocyte aggregates in cryptogenic fibrosing alveolitis. J Pathol. 1996;178:323–329. doi: 10.1002/(SICI)1096-9896(199603)178:3<323::AID-PATH467>3.0.CO;2-7. [DOI] [PubMed] [Google Scholar]
- 35.Kracke, A., A. Hiller, M. Kasper, and R. Pabst. 1996. Mucosa-associated lymphoid tissue in the larynx and lung of young children possesses the cellular basis for initiating a respiratory mucosal immune response. 12th Int. Conf. Lymph. Tissue Germ. Cent. Immune React. 141:5.18(Abstr.)
- 36.Slavin RG, Gleich GJ, Hutcheson PS, Kephart GM, Knutsen AP, Tsai CC. Localization of IgE to lung germinal lymphoid follicles in a patient with allergic bronchopulmonary aspergillosis. J Allergy Clin Immunol. 1992;90:1006–1008. doi: 10.1016/0091-6749(92)90479-l. [DOI] [PubMed] [Google Scholar]
- 37.Holt PG. Immunoprophylaxis of atopy: light at the end of the tunnel? . Immunol Today. 1994;15:484–489. doi: 10.1016/0167-5699(94)90194-5. [DOI] [PubMed] [Google Scholar]
- 38.Kopf M, Le Gros G, Coyle AJ, Kosco-Vilbois M, Brombacher F. Immune response of IL-4, IL-5, IL-6 deficient mice. Immunol Rev. 1995;148:45–69. doi: 10.1111/j.1600-065x.1995.tb00093.x. [DOI] [PubMed] [Google Scholar]
- 39.Kopf M, Le Gros G, Bachmann M, Lamers MC, Bluethmann H, Kohler G. Disruption of the murine IL-4 gene blocks Th2 cytokine responses. Nature (Lond) 1993;362:245–258. doi: 10.1038/362245a0. [DOI] [PubMed] [Google Scholar]
