Gene expression profile of the nucleus accumbens of human cocaine abusers: evidence for dysregulation of myelin (original) (raw)
. Author manuscript; available in PMC: 2008 Jan 28.
Abstract
Chronic cocaine abuse induces long-term neural adaptations as a consequence of alterations in gene expression. This study was undertaken to identify those transcripts differentially regulated in the nucleus accumbens of human cocaine abusers. Affymetrix microarrays were used to measure transcript abundance in 10 cocaine abusers and 10 control subjects matched for age, race, sex, and brain pH. As expected, gene expression of cocaine- and amphetamine-regulated transcript (CART) was increased in the nucleus accumbens of cocaine abusers. The most robust and consistent finding, however, was a decrease in the expression of a number of myelin-related genes, including myelin basic protein (MBP), proteolipid protein (PLP), and myelin-associated oligodendrocyte basic protein (MOBP). The differential expression seen by microarray for CART as well as MBP, MOBP, and PLP was verified by RT–PCR. In addition, immunohistochemical experiments revealed a decrease in the number of MBP-immunoreactive oligodendrocytes present in the nucleus accumbens and surrounding white matter of cocaine abusers. These findings suggest a dysregulation of myelin in human cocaine abusers.
Keywords: cocaine, human, microarray, myelin basic protein, nucleus accumbens, post-mortem
Drug addiction, which constitutes a serious threat to public health, is a multifaceted disorder involving tolerance, dependence, craving, and relapse (Nestler 2002). A better understanding of the molecular mechanisms underlying drug addiction would presumably facilitate the development of more successful treatment strategies. Although the molecular basis of drug abuse is not fully understood, more is known about the neural systems subserving this disorder. In particular, animal studies have identified the nucleus accumbens as a brain region that plays a critical role in addiction (Dackis and O’Brien 2001; Everitt and Wolf 2002). Furthermore, in animal models, chronic exposure to cocaine induces structural and functional changes in the nucleus accumbens that are presumably mediated by altered gene expression (Toda et al. 2002; Norrholm et al. 2003).
Although animal models continue to advance our understanding of the neurobiological underpinnings of drug abuse, it is difficult to model some uniquely human aspects of cocaine abuse, namely the spontaneous self-administration of cocaine, most often in a binging pattern of abuse, over a period of years or decades. Analysis of post-mortem brain provides a unique opportunity to examine changes in gene expression in the human drug abuser (Hurd and Herkenham 1993; Segal et al. 1997; Bannon et al. 2002). Recently, microarray technology has been employed to analyze gene expression in complex brain disorders (Mirnics et al. 2001). In the present study, we used DNA microarrays to investigate changes in gene expression in the nucleus accumbens of chronic cocaine abusers relative to carefully matched control subjects.
Materials and methods
Tissue acquisition and subject characterization
Brain specimens were collected as part of the routine autopsy process under a protocol approved by Wayne State University’s Human Investigation Committee, as previously described (Bannon et al. 1992, 2002). Cocaine users (n = 10) exhibited a positive toxicology for cocaine and/or its metabolites. Control subjects (n = 10) were matched pair-wise with cocaine users for manner of death, age, gender, and race (Table 1). Of the 20 subjects, two cocaine and two control subjects tested positive for subintoxicating doses of alcohol (g/dL ≤ 0.07) but did not exhibit common signs of chronic alcohol abuse, and alcohol did not have predictive value in hierarchical clustering of subjects based on gene expression (data not shown). Subjects tested negative for other common drugs of abuse including opiates, barbiturates, benzodiazepines, and phencyclidine.
Table 1.
Characteristics of study subjects and subject-derived samples
| Pair | Drug group | Age | Race | Gender | Brain pH | 3′/5′-GAPDHratio | Cause of death |
|---|---|---|---|---|---|---|---|
| 1 | CON | 50 | B | F | 6.46 | 1.11 | HT, thyroiditis |
| COC | 50 | B | F | 6.45 | 1.07 | Cocaine abuse | |
| 2 | CON | 50 | B | M | 6.60 | 1.15 | HT |
| COC | 46 | B | M | 6.53 | 1.11 | Cocaine abuse, ASCVD, Acute aortic dissection | |
| 3 | CON | 35 | B | M | 6.35 | 1.29 | GSW, Complication ASCVD |
| COC | 36 | B | M | 6.73 | 1.28 | Cocaine abuse, Dilated cardiomyopathy | |
| 4 | CON | 39 | B | F | 6.42 | 1.00 | HT |
| COC | 42 | B | F | 6.46 | 1.23 | Cocaine abuse | |
| 5 | CON | 48 | W | M | 6.21 | 1.07 | Myocardial infarction, HT and ASCVD |
| COC | 41 | W | M | 6.4 | 1.23 | Cocaine abuse, HT and ASCVD | |
| 6 | CON | 34 | B | M | 6.63 | 1.24 | GSW |
| COC | 35 | B | M | 6.53 | 1.24 | GSW | |
| 7 | CON | 34 | B | M | 6.55 | 1.11 | GSW |
| COC | 34 | B | M | 6.73 | 1.26 | GSW | |
| 8 | CON | 25 | B | M | 6.46 | 1.01 | GSW |
| COC | 25 | B | M | 6.51 | 1.29 | GSW | |
| 9 | CON | 41 | B | M | 6.49 | 1.01 | GSW |
| COC | 47 | B | M | 6.32 | 1.64 | GSW | |
| 10 | CON | 36 | B | M | 6.54 | 1.10 | GSW |
| COC | 38 | B | M | 6.32 | 1.36 | GSW |
Sample preparation
Coronal sections measuring 2–3 cm were taken throughout the rostrocaudal extent of the basal ganglia; hemispheres were randomly assigned to RNA or immunohistochemical analysis. For RNA analysis, the nucleus accumbens was dissected as previously described (Bannon et al. 2002), flash-frozen in isopentane cooled in liquid nitrogen and stored at −80°C. Frozen tissue was rapidly homogenized by Polytron in 10× w/v Tri Reagent (Sigma, St Louis, MO, USA), RNA extracted with 1× w/v chloroform and 0.5 mL isopropanol per ml supernatant, precipitated, and reconstituted in 100 μL 1 mM sodium citrate, pH 6.4 (Ambion, Austin, TX, USA). Contaminating DNA was eliminated using a Qiagen RNeasy Mini Kit (Qiagen, Valencia, CA, USA). The mean RNA yield was 0.43 μg/mg tissue with the predicted OD260/280 ratio of 1.80 in water (Okamoto and Okabe 2000). The Agilent 2100 Bioanalyzer (RNA Nano LabChip Kit, Agilent Technologies, Palo Alto, CA, USA) was used to verify RNA abundance and sample quality (as indicated by a 2:1 ratio of 28S to 18S rRNA and the absence of DNA and degraded RNA species).
Microarray experiments
Affymetrix oligonucleotide arrays (Affymetrix, Santa Clara, CA, USA) were used in all studies. The quality of all RNA samples was initially verified by test array hybridization. The 3′/5′ ratios of glyceraldehyde-3-phosphate dehydrogenase (GAPDH) were generated from these test chips as a measure of sample quality and efficiency of the RT–PCR and in vitro transcription (IVT). According to Affymetrix quality control parameters, this ratio should be < 3.0. For subsequent full-scale analysis, samples were hybridized to both Human U133A and U133B arrays, representing over 39 000 transcripts. In addition, half of the sample pairs were interrogated with the Affymetrix Human U95A, U95B, and U95C arrays providing an additional level of confirmation prior to RT–PCR of selected transcripts of interest. All sample labeling, hybridization and scanning followed the Affymetrix GeneChip® Expression Analysis Technical Manual (http://www.affymetrix.com).
Microarray data analysis
Data were analyzed with the Affymetrix Microarray Suite 5.0 software package. Images were scaled for signal intensity to account for any differences between hybridization efficiencies. Subjects were analyzed in pairs, comparing each cocaine sample with its matched control. Significant differences between subject pairs were calculated using the Wilcoxon signed rank test (p ≤ 0.05); marginal calls were considered non-significant. For purposes of the present study, transcripts increased or decreased in the majority (≥ 6 of 10) of pairs, representing only 0.2% of the total transcripts, were considered differentially expressed. Transcripts meeting this criterion were examined posthoc for statistical significance using Mann–Whitney _U_-tests (p ≤ 0.05). Functional groups were created using information provided by Affymetrix.
RT–PCR
RNA from all 20 subjects was used for verification of the microarray data. RT was performed (Sensiscript RT Kit, Qiagen) using random hexamers while the PCR used sequence-specific primers (amplicons: MBP 70–126, PLP 573–635, MOBP 164–215, CART 189–237 and β-actin 2366–2631). For myelin-related transcripts, PCR was performed in the LightCycler version 3.3 with the Qiagen SYBR Green PCR Kit (Roche, Indianapolis, IN, USA). Equivalent amounts of RNA from each subject were pooled to create standard curves (input RNA 1.25–10 ng) and assayed in parallel with replicate samples (5 ng RNA) from individual subjects. A standard curve was created from which transcript concentrations were calculated. Because of the lower basal transcript abundance and greater inducibility of CART, 15 ng input RNA was used for the RT reaction, PCR was performed using the Qiagen HotStarTaq Master Mix Kit, and transcript abundance was quantified using an Agilent DNA 500 LabChip Kit on the Agilent Bioanalyzer 2100. For sample normalization, individual transcript values were divided by the subject’s β-actin values determined using the same method. β-Actin transcript levels did not differ between cocaine abusers and control subjects, as determined by either RT–PCR (p = 0.6468) or microarray (p = 0.6641).
Immunohistochemistry
Fresh-frozen thaw-mounted tissue sections from four representative subject pairs were fixed in 3% paraformaldehyde, washed in phosphate-buffered saline (PBS), post-fixed in cold methanol, washed again in PBS with 0.25% Triton X-100 (PBST), then blocked in PBST containing 2.5% normal goat serum, 1% normal donkey serum, 1% normal horse serum, and 2% bovine serum albumin. Sections were then incubated 48 h at 4°C with monoclonal antibody to MBP (SMI 94; Sternberger Monoclonal Incorporated, Lutherville, MA, USA; 1 : 500), washed in PBST, incubated 3 h in anti-mouse IgG (H + L; 1:1000; Vector Laboratories, Burlingame, CA, USA), then washed in PBS. After incubation in Vectastain elite ABC for 1 h, MBP-immunoreactivity was visualized with 3,3′-diaminobenzidine as chromagen (Sigma). Representative fields were captured on a Zeiss Axioskop (Carl Zeiss, Inc., Thornwood, NY, USA) running Image-Pro Plus software version 4.5 (Media Cybernetics, Silver Springs, MD, USA) using the SPOT RT Slider Color digital camera with SPOT RT software version 3.2.4 (Diagnostic Instruments, Inc., Sterling Heights, MI, USA).
Results
Quality control experiments
The quality of the post-mortem samples used in these experiments was initially assessed by brain pH (the most reliable indicator of RNA quality and stability; Kingsbury et al. 1995) followed by spectrophotometric and electro-pherographic RNA analysis (Table 1; data not shown). The 3′/5′-GAPDH ratios of all samples, obtained from hybridization to Affymetrix oligonucleotide test arrays (not shown) and U133 arrays (ratios of 1.0–1.6; Table 1), documented the quality of input RNA as well as efficiency of the RT–PCR and IVT reactions preceding hybridization to microarrays. Thus all samples passed multiple quality measures before inclusion in the subsequent analyses. No significant differences were found between groups in terms of brain pH, 3′/5′-GAPDH ratios, tissue weight, RNA yield, or 260/280 ratios (Table 1; data not shown). Another quality control microarray experiment involved splitting a human nucleus accumbens RNA sample into two aliquots used several months apart for separate RT, PCR, and IVT reactions and hybridization onto two individual U95Av2 arrays. The reproducibility of the entire procedure was demonstrated by the significant correlation in the abundance of present transcripts (n = 5558, r = 0.98, p = 0.002).
Microarray analysis and validation of results
Only 49 of the 44 928 DNA probes (0.1%) on the U133 microarrays detected nucleus accumbens transcripts that were present in all pairs, differentially expressed in the majority of cocaine users relative to their matched controls, and were annotated (Table 2). An equivalent number of cocaine-regulated but unannotated expressed sequence tags or hypothetical proteins were detected (complete list available upon request). Table 2 reports the signal log ratio (fold change expressed in log2) for differentially expressed, annotated transcripts across the 10 matched pairs of subjects. Post-hoc examination confirmed the statistical significance of differential expression for the majority of transcripts (Mann–Whitney _U_-test, p ≤ 0.05; data not shown). Transcripts were assigned to functional categories. In most cases, there was no overall pattern of change in gene expression by category (Table 2).
Table 2.
Transcripts differentially expressed in the majority of cocaine users
| Signal Log Ratio (fold change log2) | ||||||||||
|---|---|---|---|---|---|---|---|---|---|---|
| 1 | 2 | 3 | 4 | 5 | 6 | 7 | 8 | 9 | 10 | |
| Signal Transduction | ||||||||||
| ↓ AK1 adenylate kinase 1 | 0.05 | −0.19 | −0.30 | 0.15 | −0.42 | 0.82 | −0.31 | −0.34 | −0.47 | −0.32 |
| ↓ HPCAL1 hippocalcin-like 1 | 0.17 | −0.42 | 0.13 | −0.02 | −0.76 | 0.30 | −0.38 | −0.31 | −0.24 | −0.53 |
| ↓ NTRK2 neurotrophic tyrosine kinase receptor type 2 (trkB) | −0.29 | 0.52 | −0.63 | −0.32 | −0.40 | −0.40 | −0.43 | 0.29 | 0.46 | −1.00 |
| ↓ NUCKS similar to rat ubiquitous casein kinase 2 | −0.39 | −0.28 | 0.08 | −0.62 | −0.28 | −0.57 | 0.17 | −0.17 | 0.97 | −1.23 |
| ↑ APP amyloid beta precursor protein | 0.23 | 0.42 | 0.27 | −0.03 | −0.10 | −0.33 | 0.53 | 0.40 | 0.42 | 0.36 |
| ↑ CNK2 connector enhancer of KSR2 | 0.61 | −0.11 | 0.64 | 1.10 | 1.06 | 0.07 | 0.43 | 0.01 | −0.17 | 0.55 |
| ↑ ENPP5 ectonucleotide pyrophosphatase/phosphodiesterase 5 | 1.16 | −0.69 | −0.04 | 0.94 | 0.43 | −0.16 | 0.39 | 0.42 | 0.12 | 0.30 |
| ↑ GEM GTP binding protein overexpressed in skeletal muscle | 1.58 | 0.41 | −0.47 | −0.24 | −0.25 | 0.20 | 0.79 | 0.74 | 0.43 | 0.71 |
| ↓ PPP2R2C protein phosphatase 2, regulatory subunit B, gamma isoform | −1.21 | −0.23 | 0.58 | −0.23 | −0.32 | −0.46 | −0.57 | −0.48 | 0.07 | −0.87 |
| Translation/Transcription/RNA Processing | ||||||||||
| ↓ DEAF1 deformed epidermal autoregulatory factor 1 | −0.66 | −0.47 | 0.13 | 0.07 | −0.57 | −0.30 | −0.67 | −0.45 | 0.14 | −0.55 |
| ↓ EEF1G eukaryotic translation elongation factor 1, gamma | 0.24 | −0.40 | −0.42 | −0.18 | −0.20 | −0.08 | −0.46 | −0.27 | −0.21 | −0.69 |
| ↓ RPS10 ribosomal protein S10 | 0.13 | −0.44 | −0.39 | −0.13 | −0.27 | −0.41 | −0.33 | −0.18 | 0.14 | −0.53 |
| ↓ RPS9 ribosomal protein S9 | −0.10 | −0.03 | −0.39 | −0.13 | −0.47 | 0.21 | −0.54 | −0.54 | −0.45 | −0.53 |
| ↑ EIF5A eukaryotic translation initiation factor 5A | −0.35 | −1.26 | 0.84 | −0.23 | −1.02 | −0.91 | −0.78 | −0.02 | −0.78 | −2.01 |
| ↑ EYA1 eyes absent homolog 1 | −0.59 | 0.88 | 0.75 | 0.29 | 2.33 | −1.25 | 0.18 | 0.41 | 1.01 | 0.68 |
| ↑ NEDD4L downregulated 4-like | 0.28 | 0.39 | 0.37 | 0.47 | 0.79 | 0.57 | 0.68 | −0.85 | −0.61 | 0.39 |
| ↑ TMEPAI transmembrane, prostate androgen induced | 0.63 | 0.23 | 0.28 | 0.26 | 0.98 | 0.54 | 0.26 | 0.36 | 0.22 | 0.46 |
| ↑ TMEPAI transmembrane, prostate androgen induced | 0.80 | 0.27 | 0.22 | 0.73 | 0.85 | −0.01 | 0.08 | 0.30 | 0.46 | 0.51 |
| Neurotransmission/Synaptic Function/Membrane Recycling | ||||||||||
| ↓ AP2S1 Adaptor related protein complex 2, sigma 1 subunit | 0.11 | −0.15 | 0.12 | −0.05 | −0.44 | 0.09 | −0.49 | −0.60 | −0.42 | −0.91 |
| ↓ CLTB clathrin, light polypeptide | 0.24 | −0.35 | 0.31 | 0.07 | −0.46 | 0.28 | −0.43 | −0.34 | −0.54 | −0.39 |
| ↑ CART cocaine- and amphetamine-regulated transcript | 0.09 | −0.12 | 0.62 | 1.12 | 0.39 | 0.38 | −0.10 | 0.67 | 0.40 | 0.79 |
| ↑ NETO2 neuropilin (NRP) and tolloid (TLL)-like2 | 0.45 | 0.15 | 0.63 | 0.89 | 1.29 | −0.02 | 0.24 | −0.10 | −0.93 | 0.45 |
| ↑ PDYN prodynorphin | −0.31 | 0.02 | 0.35 | 0.29 | 1.12 | 0.37 | 0.56 | 0.53 | −0.06 | 0.22 |
| ↓ PCSK1N proprotein convertase subtilisin/kexin type 1 inhibitor | 0.27 | −0.39 | 0.06 | 0.18 | −0.45 | 0.35 | −0.40 | −0.22 | −0.42 | −0.41 |
| Glial | ||||||||||
| ↓ MBP myelin basic protein | −1.38 | 0.08 | −0.78 | −1.45 | −1.14 | −1.01 | −1.30 | −0.53 | 0.07 | −1.94 |
| ↓ MBP* myelin basic protein | −0.90 | 0.14 | −0.40 | −0.72 | −0.64 | −0.79 | −0.60 | −0.14 | 0.34 | −0.97 |
| ↓ MOBP myelin-associated oligodendrocyte basic protien | −1.85 | −0.23 | −0.24 | −1.06 | −1.61 | −0.48 | −1.11 | −0.18 | 0.21 | −1.48 |
| ↓ PLP1 proteolipid protein 1 | −1.43 | −0.73 | 0.23 | −0.93 | −0.27 | −0.32 | 0.20 | 0.07 | 0.15 | −0.66 |
| ↓ CRYAB crystallin, alpha B | 1.44 | −0.59 | −0.36 | 0.42 | −0.35 | −0.45 | −0.40 | −0.11 | 0.50 | −0.55 |
| ↑ MAL2 mal, T-cell differentiation protein 2 | 0.90 | 0.25 | 0.64 | 0.69 | 1.29 | −0.39 | −0.04 | 0.48 | −0.02 | 0.58 |
| Structural/Cell Adhesion | ||||||||||
| ↓ CRYBB2 crystallin, beta B2 | −0.76 | −1.90 | 0.46 | −1.44 | −1.39 | −0.32 | 1.05 | −0.53 | 0.48 | −1.15 |
| ↓ PNUTL2 peanut-like 2 | −0.98 | −0.08 | −0.04 | −0.78 | −0.83 | −0.49 | −0.47 | −0.02 | −0.11 | −0.94 |
| ↓ SPTBN1 beta II spectrin | −0.17 | −0.38 | −0.56 | −0.11 | −0.71 | −0.30 | −0.23 | −0.26 | −0.43 | −0.61 |
| ↑ ACTN2 actinin, alpha 2 | 0.04 | −0.03 | 0.15 | 0.43 | 1.60 | 0.63 | 0.52 | 0.66 | 0.70 | 0.33 |
| ↑ ICAP-1A integrin cytoplasmic domain-associated protein 1 | 0.91 | 0.35 | 0.88 | −0.87 | 1.18 | −0.97 | −0.08 | −0.56 | 1.41 | 0.54 |
| Other | ||||||||||
| ↓ C14orf52 chromosome 14 open reading frame 52 | 0.46 | −0.36 | −0.94 | 0.93 | −1.85 | −0.29 | −1.03 | 0.71 | −1.22 | 1.04 |
| ↓ NDRG2 NDRG family member 2 | −0.38 | 0.08 | −0.40 | −0.17 | −0.49 | −0.46 | −0.44 | −0.26 | −0.03 | −0.63 |
| ↓ NDRG2* NDRG family member 2 | −0.56 | 0.00 | −0.46 | −0.94 | −0.96 | −0.68 | −0.37 | −0.35 | −0.05 | −0.85 |
| ↑ KL klotho | 0.76 | 0.74 | 0.33 | 1.34 | 0.81 | −1.51 | −0.37 | 0.24 | 0.51 | 0.58 |
| Receptors/Transporters/Ion Channels | ||||||||||
| ↓ EDG2 endothelial differentiation, lysophosphatidic acid G-proteincoupled receptor, 2 | −0.34 | 0.21 | −0.44 | −1.58 | −0.84 | −0.79 | −0.56 | 0.18 | 0.43 | −1.07 |
| ↑ TFRC transferrin receptor | 0.66 | 1.59 | −0.17 | −1.60 | 0.49 | −0.29 | 0.40 | 0.01 | 1.12 | 0.30 |
| ↑ MSCP mitochondrial solute carrier protein | 0.60 | 0.36 | 0.61 | 0.77 | 0.80 | 0.39 | −0.03 | 0.04 | −0.27 | −0.05 |
| Immune/Stress Response/Chaperones | ||||||||||
| ↓ C20orf110 chromosome 20 open reading frame 110 | −0.99 | 0.38 | −0.19 | −1.20 | −1.24 | −0.41 | −0.40 | −0.27 | 0.34 | −1.09 |
| ↓ IBA2 ionized calcium binding adaptor molecule 2 | −1.63 | −0.18 | 0.22 | −0.77 | −0.65 | −0.44 | 0.13 | 0.38 | 0.45 | −0.51 |
| ↑ HSPA5 heat shock 70kDa protein 5 | 0.41 | −0.24 | −0.68 | 1.02 | 0.54 | 0.24 | −0.25 | 0.39 | −0.47 | 0.52 |
| Cell Cycle/Cell Growth | ||||||||||
| ↓ RCL putative c-myc-responsive | −0.49 | −0.24 | −0.15 | −0.07 | −0.36 | 0.22 | −0.40 | −0.20 | −0.31 | −0.27 |
| ↓ TOB1 transducer of ERBB2, 1 | −0.54 | −1.43 | −0.42 | 0.53 | −1.10 | 2.10 | 0.31 | −0.77 | −1.15 | −0.72 |
| ↑ CUL4B cullin 4B | 0.25 | −0.04 | 0.03 | 0.34 | 0.45 | 0.47 | 0.60 | 0.09 | −0.01 | 0.28 |
| Protein Processing/Degradation/Modification | ||||||||||
| ↓ UBE2M ubiquitin-conjugating enzyme E2M | −0.43 | −0.32 | 0.10 | −0.03 | −0.52 | −0.14 | −0.94 | −0.74 | −0.24 | −1.02 |
| ↑ PA200 proteasome activator 200 kDa | 0.50 | 0.03 | 0.28 | 0.42 | 0.74 | −0.13 | 0.34 | 0.05 | 0.69 | 0.61 |
| Lipid-Related | ||||||||||
| ↓ OSBPL1A oxysterol binding protein-like 1A | −0.30 | −0.39 | −0.72 | −0.75 | −0.44 | 0.09 | −0.34 | −0.06 | −0.34 | −0.82 |
| ↑ UGCG UDP-glucose ceramide glucosyltransferase | 0.38 | −0.03 | 0.61 | 0.30 | 0.69 | 0.56 | 0.57 | 0.16 | 0.57 | 0.18 |
It is interesting to note that CART transcript levels were increased in the nucleus accumbens of human cocaine abusers (Table 2). These transcript changes were confirmed using a second distinct (U95) array and by RT–PCR (data not shown). CART represents a gene whose expression is induced in rodents by cocaine administration (Douglass et al. 1995). Some of the gene expression changes seen in the cocaine-exposed human brain therefore are consonant with previous animal model data.
A compelling benefit of microarray studies, however, is the ability to investigate global changes in gene expression unfettered by a priori hypotheses. In the present experiments, the most robust (and unanticipated) changes were seen in the expression of numerous myelin-related genes, including MBP, PLP, MOBP, and myelin and leukocyte T-cell differentiation protein 2 (MAL2; Table 2). Specifically, two representations of MBP transcripts were significantly decreased in cocaine abusers (p = 0.002, p = 0.01), as were MOBP (p = 0.004) and PLP (p = 0.05), while MAL2 expression was increased (p = 0.05; Mann–Whitney _U_-test). Similar changes in myelin-related transcript abundance were confirmed when RNA aliquots from one-half of the subject pairs were evaluated using the U95 microarray series (not shown). Logistic regression analysis revealed that the relative abundance of MBP transcripts alone was sufficient to classify with 80% accuracy the subjects as either cocaine abusers or controls (χ2(2) = 8.007, p = 0.018), reflecting the robustness of cocaine-related changes in MBP gene expression. No such predictive value was seen with a randomly chosen set of transcripts (data not shown).
Confirmation of changes in the more abundant myelin-related transcripts was obtained using quantitative real-time RT–PCR (QRT–PCR). Cocaine abusers who by microarray analysis exhibited decreases in MBP, MOBP, and PLP gene expression relative to their controls were also found to have decreases in these mRNAs by QRT–PCR (Fig. 1). There was a significant correlation between the subject pairs’ QRT–PCR and microarray data for all transcripts (MBP: r = 0.94, p = 0.0001; PLP: r = 0.91, p = 0.0003; MOBP: r = 0.72, p = 0.0191).
Fig. 1.
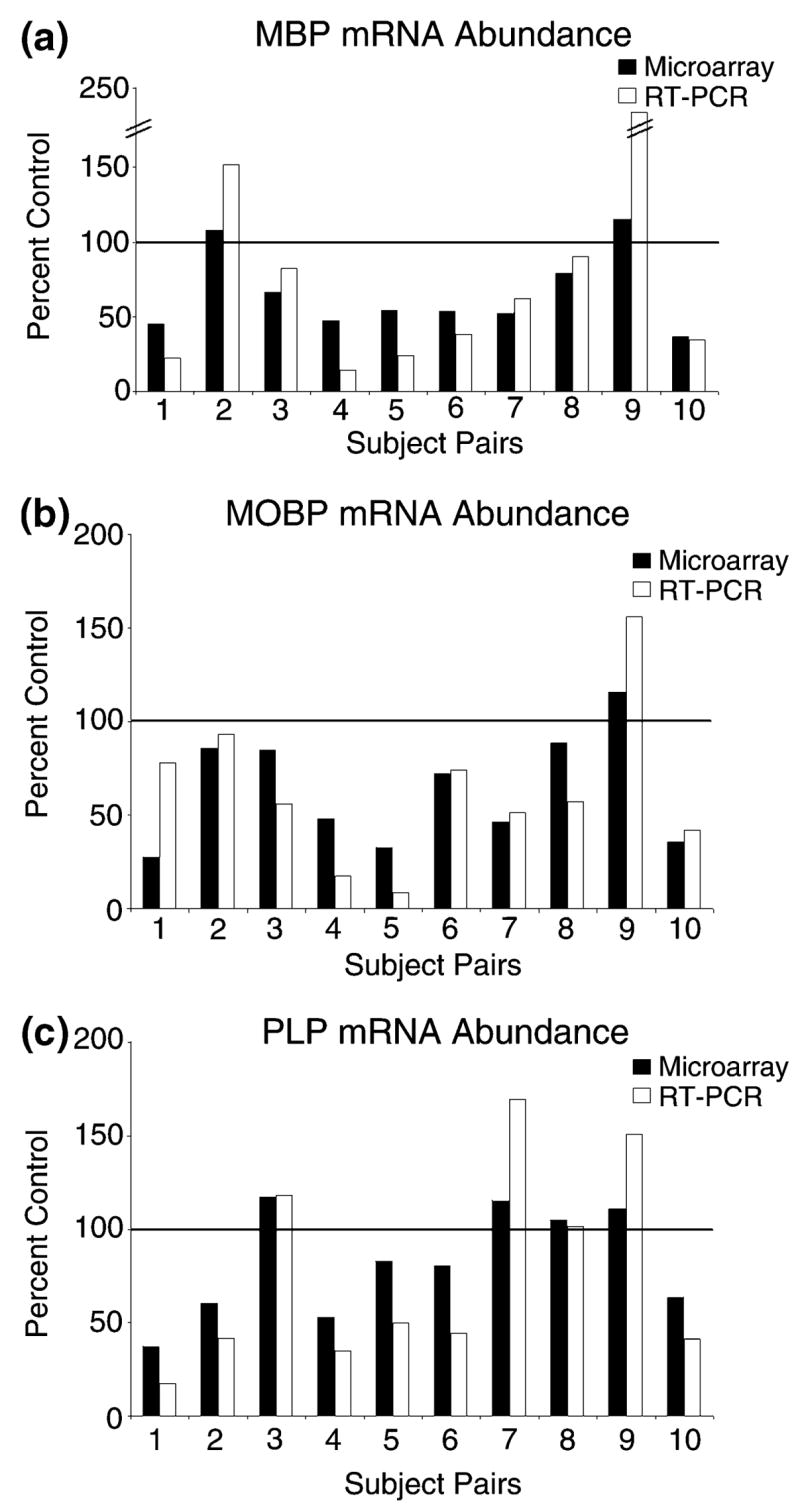
Decreased expression of myelin-related genes in cocaine users. Transcript abundance was determined by both microarray (■) and quantitative real-time RT–PCR (□, RT–PCR) for (a) myelin basic protein (MBP), (b) myelin-associated oligodendrocyte basic protein (MOBP), and (c) proteolipid protein (PLP) as describe in Materials and methods. The MBP microarray data are averaged values from two independent representations of MBP on the array.
To assess potential myelin-related changes at the protein level, tissue sections from representative subject pairs were processed for MBP immunohistochemistry. In keeping with the diminished abundance in MBP mRNA (Table 2; Fig. 1), we observed a substantial decrease in the number of MBP-immunoreactive oligodendrocytes within the gray matter and myelinated fiber bundles of the nucleus accumbens (Fig. 2).
Fig. 2.
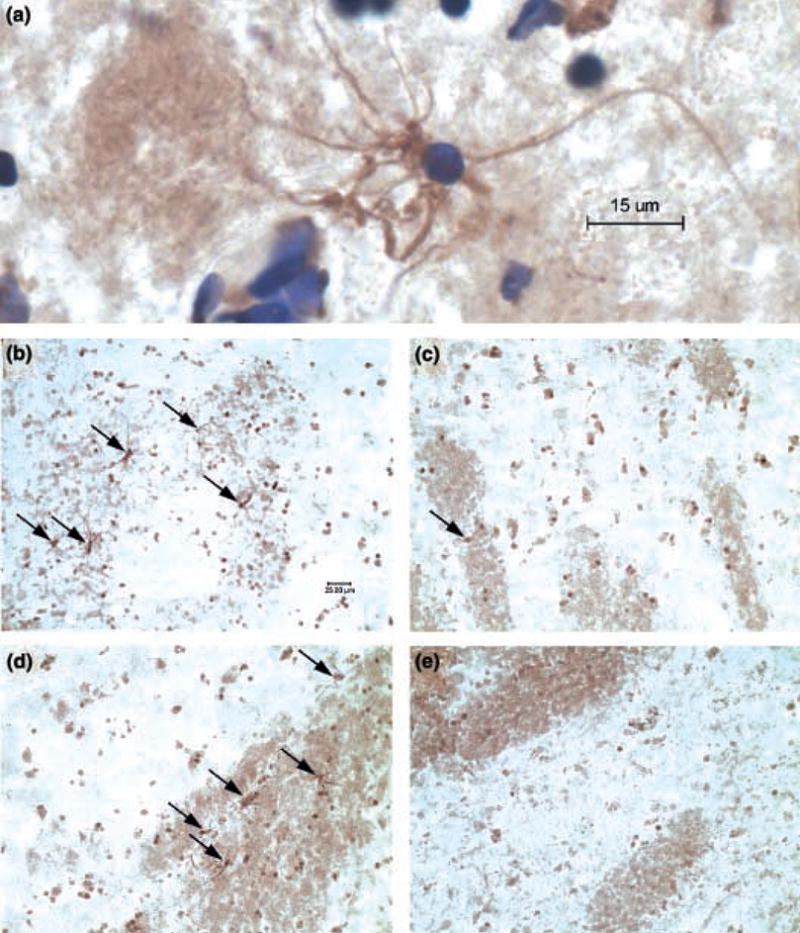
Decreased abundance of MBP-immunoreactive oligodendrocytes in cocaine abusers’ nucleus accumbens. (a) High magnification view of a single MBP-positive oligodendrocyte counterstained with cre-syl violet. Note the contact with an MBP-positive fiber bundle in the left-hand portion of the figure. MBP-positive oligodendrocytes (indicated by arrows) were evident throughout the gray matter and fiber bundles of control subjects (b and d, respectively) but were rarely seen in the nucleus accumbens of matched cocaine abusers (c and e, respectively).
Discussion
Human cocaine abusers typically self-administer cocaine in a binging pattern over a period of years or decades. To the extent that animal models fail to completely duplicate these and other aspects of human cocaine abuse, they may fall short in revealing some relevant changes in gene expression. In the present study therefore we chose to investigate gene expression changes in human post-mortem brain using microarrays. This unbiased approach allowed us fully to explore differences in the nucleus accumbens of human cocaine abusers unconstrained by a priori hypotheses. Previous studies have demonstrated the stability of human brain RNA post-mortem (Perrett et al. 1988; Kobayashi et al. 1990; Bannon et al. 1992) and, more recently, its suitability for use with microarray platforms (Mirnics et al. 2001; Vawter et al. 2002). In the present experiments, subject pairs were carefully matched and the quality of each sample was confirmed by multiple measures (brain pH, RNA characterization, and test array hybridization).
We found that the abundance of a relatively small number of nucleus accumbens transcripts was differentially expressed in human cocaine users. Among these was CART, which is also altered in animal models of cocaine administration. CART is expressed in the shell region of the human ventral striatum (nucleus accumbens), the area most affected by addictive drugs (Hurd and Fagergren 2000). These CART-immunoreactive neurons receive synaptic input from TH-positive terminals (Smith et al. 1999), providing the anatomical substrate for CART induction by cocaine (which increases extracellular dopamine through inhibition of dopamine transport). Basal levels of CART in the rat and human nucleus accumbens are extremely low prior to induction by cocaine (Douglass et al. 1995; Hurd and Fagergren 2000). We observed an upregulation of CART gene expression in the nucleus accumbens of cocaine abusers, as determined by microarray and RT–PCR analyses. Following the completion of these experiments, Hemby and colleagues (Tang et al. 2003), using macroarrays, reported increased CART mRNA levels in the midbrain of cocaine abusers, although CART-producing cells have not been previously reported in the midbrain.
The major finding of this study is a striking dysregulation of myelin-related gene expression in the nucleus accumbens of human cocaine abusers. The abundance of MBP, PLP, and MOBP transcripts was significantly lower in cocaine users than matched control subjects, as determined by both microarray and RT–PCR (Table 2; Fig. 1). In addition, fewer MBP-immunoreactive oligodendrocytes were evident in the nucleus accumbens (Fig. 2) and in surrounding white matter (data not shown). Together, MBP and PLP constitute ~80% of CNS myelin protein and serve as major structural components of the myelin membrane. MBP plays a role in myelin compaction, while PLP seems to form a stabilizing membrane junction after compaction (for a review, see Baumann and Pham-Dinh 2001). Recent data suggest that various products of these genes subserve other biological functions, including transcriptional regulation, signal transduction, vesicular transport, and neuronal viability (Campagnoni and Skoff 2001). Although the precise function of MOBP is unknown, it is a component of the myelin sheath that has been posited to play an MBP-like role in myelin compaction (Baumann and Pham-Dinh 2001). Microarray data (Table 2) suggest that two other genes associated with oligodendrocytes and myelin (namely MAL2 and alpha B crystallin) may be differentially expressed in cocaine abusers’ nucleus accumbens, although these data await experimental validation. In aggregate, these microarray, RT–PCR and immunohistochemical data strongly suggest a significant dysregulation of myelin-related proteins in human cocaine abusers.
Our observations find support in several studies suggesting that drug administration in animals or humans may change myelin expression (Volkow et al. 1988b; Wiggins and Ruiz 1990; Kittler et al. 2000; Mayfield et al. 2002). While this manuscript was in preparation, Lehrmann et al. (2003) reported changes in PLP mRNA levels in the dorsolateral pre-frontal cortex of human cocaine abusers. In neuroimaging studies, white matter hyperintensities and chemical changes indicative of white matter pathology are often seen in cocaine abusers (Chang et al. 1997; Bartzokis et al. 1999a, 1999b; Chang et al. 1999). More recently, two studies have demonstrated a loss of white matter volume (Bartzokis et al. 2002) and microstructure integrity (Lim et al. 2002) in chronic human cocaine abusers.
One possible cause of these documented white matter changes might be the vasoconstrictive effects of cocaine (Kaufman et al. 1998). The normal adult human brain contains oligodendrocyte progenitors with the capacity for extensive continued myelination through the fourth decade of life (Chang et al. 2000; Bartzokis et al. 2001). Cerebral vasoconstriction has been linked to hypoperfusion, which in turn has been shown to decrease MBP over time (Kurumatani et al. 1998). It is possible that the vascular effects of cocaine could interfere with the continued myelination in adult brain, accounting for our findings of decreased myelin-related transcripts and decreased MBP-immunoreactive oligodendrocytes.
Alternatively, the effects of cocaine on myelin-related gene expression may be directly related to the substantial increases in extracellular dopamine (DA) that cocaine is known to elicit in the nucleus accumbens (Pettit and Justice 1989; Hemby et al. 1997). Oligodendrocytes express D2 and D3 DA receptors (Howard et al. 1998; Bongarzone et al. 1998), and DA receptor stimulation decreases the conversion from immature to mature oligodendrocytes (Bongarzone et al. 1998). It is plausible that in the DA-rich nucleus accumbens, cocaine diminishes generation of mature myelin-producing oligodendrocytes through over-stimulation of oligodendrocyte DA receptors. The extent to which these effects are localized to the nucleus accumbens is unknown, as we also observed an apparent decrease in MBP-immunoreactive oligodendrocytes in the white matter immediately surrounding the nucleus accumbens of cocaine abusers (data not shown). Further studies are warranted to differentiate between these possibilities.
Although the literature connecting myelin and cocaine is relatively modest, perhaps reflective of the unexpectedness of the association, a link between altered myelination and the cognitive and motoric deficits associated with cocaine abuse (Bauer 1996; Strickland et al. 1998; Robinson et al. 1999; Fillmore and Rush 2002) has face validity. It has been reported that the majority of long-term cocaine users have focal perfusion defects, a subtle form of cerebrovascular dysfunction, which have been associated with moderate to severe cognitive impairment (Holman et al. 1991; Volkow et al. 1988a; Strickland et al. 1993). Both the cognitive and focal vascular defects reportedly persist in periods of abstinence, suggesting they are more permanent events occurring beyond acute intoxication. It is worth noting that, in mice, genetic disruption of the genes encoding myelin proteins generally results in animals with subtle pathological changes but grossly normal phenotype (Baumann and Pham-Dinh 2001; Campagnoni and Skoff 2001). This is consistent with the notion that cocaine affects expression of myelin-related genes without inducing an obvious demyelinating disease phenotype.
We have demonstrated that cocaine abuse decreases the expression of numerous myelin-related genes in the human nucleus accumbens, accompanied by an apparent loss of MBP-positive oligodendrocytes. These myelin-related findings were the most robust and consistent findings from our study, cross-validated with different microarray types, and multiple experimental techniques. Although a causal relationship and the functional significance of the findings have yet to be determined, investigation of this association is warranted and may well contribute to the understanding of the molecular processes underlying addiction.
Acknowledgments
The authors would like to extend their gratitude to Drs John Kamholz, Robert Skoff, Anthony Campagnoni, Robin Fisher, Sharon K. Michelhaugh and Cynthia Arfken for consultations. We would also like to thank Dr Susan Land, Daniel Lott, Tara Twomey, Bin Yao and Dan Liu at Wayne State University’s Applied Genomics Technology Center, and Shirley Liu for technical assistance. This work was supported by NIDA grants DA13753 and DA06470.
Abbreviations used
CART
cocaine- and amphetamine-regulated transcript
GAPDH
glyceraldehyde-3-phosphate dehydrogenase
IVT
in vitro transcription
MAL2
myelin and leukocyte T-cell differentiation protein 2
MBP
myelin basic protein
MOBP
myelin associated oligodendrocyte basic protein
PBS
phosphate-buffered saline
PBST
phosphate-buffered saline with 0.25% Triton X-100
PLP
proteolipid protein
QRT–PCR
quantitative real-time RT–PCR
TH
tyrosine hydroxylase
References
- Bannon MJ, Poosch MS, Haverstick DM, Mandall A, Xue IC-H, Shibata K, Dragovic LJ. Preprotachykinin gene expression in the human basal ganglia: characterization of mRNAs and pre-mRNAs produced by alternate RNA splicing. Mol Brain Res. 1992;12:225–231. doi: 10.1016/0169-328x(92)90088-s. [DOI] [PubMed] [Google Scholar]
- Bannon MJ, Pruetz B, Manning-Bog AB, Whitty CJ, Michelhaugh SK, Sacchetti P, Granneman JG, Mash DC, Schmidt CJ. Decreased expression of the transcription factor NURR1 in dopamine neurons of cocaine abusers. Proc Natl Acad Sci USA. 2002;99:6382–6385. doi: 10.1073/pnas.092654299. [DOI] [PMC free article] [PubMed] [Google Scholar]
- Bartzokis G, Beckson M, Hance DB, Lu PH, Foster JA, Mintz J, Ling W, Bridge P. Magnetic resonance imaging evidence of ‘silent’ cerebrovascular toxicity in cocaine dependence. Biol Psychiatry. 1999a;45:1203–1211. doi: 10.1016/s0006-3223(98)00228-5. [DOI] [PubMed] [Google Scholar]
- Bartzokis G, Goldstein IB, Hance DB, Beckson M, Shapiro D, Lu PH, Edwards N, Mintz J, Bridge P. The incidence of T2-weighted MR imaging signal abnormalities in the brain of cocaine-dependent patients is age-related and region-specific. Am J Neuroradiol. 1999b;20:1628–1635. [PMC free article] [PubMed] [Google Scholar]
- Bartzokis G, Beckson M, Lu PH, Nuechterlein KH, Edwards N, Mintz J. Age-related changes in frontal and temporal lobe Volumes in men. Arch Gen Psychiatry. 2001;58:461–465. doi: 10.1001/archpsyc.58.5.461. [DOI] [PubMed] [Google Scholar]
- Bartzokis G, Beckson M, Lu PH, Edwards N, Bridge P, Mintz J. Brain maturation may be arrested in chronic cocaine addicts. Biol Psychiatry. 2002;51:605–611. doi: 10.1016/s0006-3223(02)01315-x. [DOI] [PubMed] [Google Scholar]
- Bauer LO. Resting hand tremor in abstinent cocaine-dependent, alcohol-dependent, and polydrug-dependent patients. Alcohol Clin Exp Res. 1996;20:1196–1201. doi: 10.1111/j.1530-0277.1996.tb01111.x. [DOI] [PubMed] [Google Scholar]
- Baumann N, Pham-Dinh D. Biology of oligodendrocyte and myelin in the mammalian central nervous system. Physiol Rev. 2001;81:871–927. doi: 10.1152/physrev.2001.81.2.871. [DOI] [PubMed] [Google Scholar]
- Bongarzone ER, Howard SG, Schonmann V, Campagnoni AT. Identification of the dopamine D3 receptor in oligodendrocyte precursors: potential role in regulating differentiation and myelin formation. J Neurosci. 1998;18:5344–5353. doi: 10.1523/JNEUROSCI.18-14-05344.1998. [DOI] [PMC free article] [PubMed] [Google Scholar]
- Campagnoni AT, Skoff RP. The pathobiology of myelin mutants reveal novel biological functions of the MBP and PLP genes. Brain Pathol. 2001;11:74–91. doi: 10.1111/j.1750-3639.2001.tb00383.x. [DOI] [PMC free article] [PubMed] [Google Scholar]
- Chang L, Mehringer CM, Ernst T, Melchor R, Myers H, Forney D, Satz P. Neurochemical alterations in asymptomatic abstinent cocaine users: a proton magnetic resonance spectroscopy study. Biol Psychiatry. 1997;42:1105–1114. doi: 10.1016/s0006-3223(97)00135-2. [DOI] [PubMed] [Google Scholar]
- Chang L, Ernst T, Strickland T, Mehringer CM. Gender effects on persistent cerebral metabolite changes in the frontal lobes of abstinent cocaine users. Am J Psychiatry. 1999;156:716–722. doi: 10.1176/ajp.156.5.716. [DOI] [PubMed] [Google Scholar]
- Chang A, Nishiyama A, Peterson J, Prineas J, Trapp BD. NG2-positive oligodendrocyte progenitor cells in adult human brain and multiple sclerosis lesions. J Neurosci. 2000;20:6404–6412. doi: 10.1523/JNEUROSCI.20-17-06404.2000. [DOI] [PMC free article] [PubMed] [Google Scholar]
- Dackis CA, O’Brien CP. Cocaine-dependence: a disease of the brain’s reward centers. J Subst Abuse Treat. 2001;21:111–117. doi: 10.1016/s0740-5472(01)00192-1. [DOI] [PubMed] [Google Scholar]
- Douglass J, McKinzie AA, Couceyro P. PCR differential display identifies a rat brain mRNA that is transcriptionally regulated by cocaine and amphetamine. J Neurosci. 1995;15:2471–2481. doi: 10.1523/JNEUROSCI.15-03-02471.1995. [DOI] [PMC free article] [PubMed] [Google Scholar]
- Everitt BJ, Wolf ME. Psychomotor stimulant addiction: a neural systems perspective. J Neurosci. 2002;22:3312–3320. doi: 10.1523/JNEUROSCI.22-09-03312.2002. [DOI] [PMC free article] [PubMed] [Google Scholar]
- Fillmore MT, Rush CR. Impaired inhibitory control of behavior in chronic cocaine users. Drug Alcohol Department. 2002;66:265–273. doi: 10.1016/s0376-8716(01)00206-x. [DOI] [PubMed] [Google Scholar]
- Hemby SE, Co C, Koves TR, Smith JE, Dworkin SI. Differences in extracellular dopamine concentrations in the nucleus accumbens during response-dependent and response-independent cocaine administration in the rat. Psychopharmacology. 1997;133:7–16. doi: 10.1007/s002130050365. [DOI] [PubMed] [Google Scholar]
- Holman BL, Carvalho PA, Mendelson JH, Teoh SK, Nardin R, Hallgring E, Hebben N, Johnson KA. Brain perfusion is abnormal in cocaine-dependent polydrug users: a study using technetium-99m-HMPAO and ASPECT. J Nucl Med. 1991;32:1206–1210. [PubMed] [Google Scholar]
- Howard S, Landry C, Fisher R, Bezouglaia O, Handley V, Campagnoni A. Post-natal localization and morphogenesis of cells expressing the dopaminergic D2 receptor gene in rat brain: Expression in non-neuronal cells. J Comp Neurol. 1998;391:87–98. doi: 10.1002/(sici)1096-9861(19980202)391:1<87::aid-cne8>3.0.co;2-n. [DOI] [PubMed] [Google Scholar]
- Hurd YL, Fagergren P. Human cocaine- and amphetamine-regulated transcript (CART) mRNA is highly expressed in limbic-and sensory-related brain regions. J Comp Neurol. 2000;425:583–598. doi: 10.1002/1096-9861(20001002)425:4<583::aid-cne8>3.0.co;2-#. [DOI] [PubMed] [Google Scholar]
- Hurd YL, Herkenham M. Molecular alterations in the neostriatum of human cocaine addicts. Synapse. 1993;13:357–369. doi: 10.1002/syn.890130408. [DOI] [PubMed] [Google Scholar]
- Kaufman MJ, Levin JM, Ross MH, Lange N, Rose SL, Kukes TJ, Mendelson JH, Lukas SE, Cohen BM, Renshaw PF. Cocaine-induced cerebral vasoconstriction detected in humans with magnetic resonance angiography. JAMA. 1998;279:376–380. [PubMed] [Google Scholar]
- Kingsbury AE, Foster OJF, Nisbet AP, Cairns N, Bray L, Eve DJ, Lees AJ, Marsden CD. Tissue pH as an indicator of mRNA preservation in human post-mortem brain. Mol Brain Res. 1995;28:311–318. doi: 10.1016/0169-328x(94)00219-5. [DOI] [PubMed] [Google Scholar]
- Kittler JT, Grigorenko EV, Clayton C, Zhuang S-Y, Bundey SC, Trowler MM, Wallace D, Hampson R, Deadwyler S. Large-scale analysis of gene expression changes during acute and chronic exposure to Δ9-THC in rats. Physiol Genomics. 2000;3:175–185. doi: 10.1152/physiolgenomics.2000.3.3.175. [DOI] [PubMed] [Google Scholar]
- Kobayashi H, Sakimura K, Kuwano R, Sato S, Ikuta F, Takahashi Y, Miyatake T, Tsuji S. Stability of messenger RNA in postmortem human brains and construction of human brain cDNA libraries. J Mol Neurosci. 1990;2:29–34. doi: 10.1007/BF02896923. [DOI] [PubMed] [Google Scholar]
- Kurumatani T, Kudo T, Ikura Y, Takeda M. White matter changes in the gerbil brain under chronic cerebral hypoperfusion. Stroke. 1998;29:1058–1062. doi: 10.1161/01.str.29.5.1058. [DOI] [PubMed] [Google Scholar]
- Lehrmann E, Oyler J, Vawter MP, Hyde TM, Kolachana B, Kleinman JE, Huestis MA, Becker KG, Freed WJ. Transcriptional profiling in the human prefrontal cortex: evidence for two activational states associated with cocaine abuse. The Pharmacogenomics J. 2003;3:27–40. doi: 10.1038/sj.tpj.6500146. [DOI] [PMC free article] [PubMed] [Google Scholar]
- Lim KO, Choi SJ, Pomara N, Wolkin A, Rotrosen JP. Reduced frontal white matter integrity in cocaine dependence: a controlled diffusion tensor imaging study. Biol Psychiatry. 2002;51:890–895. doi: 10.1016/s0006-3223(01)01355-5. [DOI] [PubMed] [Google Scholar]
- Mayfield RD, Lewohl JM, Dodd PR, Herlihy A, Liu J, Harris RA. Patterns of gene expression are altered in the frontal and motor cortices of human alcoholics. J Neurochem. 2002;81:802–813. doi: 10.1046/j.1471-4159.2002.00860.x. [DOI] [PubMed] [Google Scholar]
- Mirnics K, Middleton FA, Lewis DA, Levitt P. Analysis of complex brain disorders with gene expression microarrays: schizophrenia as a disease of the synapse. Trends Neurosci. 2001;24:479–486. doi: 10.1016/s0166-2236(00)01862-2. [DOI] [PubMed] [Google Scholar]
- Nestler EJ. From neurobiology to treatment: progress against addiction. Nat Neurosci. 2002;5:1076–1079. doi: 10.1038/nn945. [DOI] [PubMed] [Google Scholar]
- Norrholm SD, Bibb JA, Nestler EJ, Ouimet CC, Taylor JR, Greengard P. Cocaine-induced proliferation of dendritic spines in nucleus accumbens is dependent on the activity of cyclin-dependent kinase 5. Neuroscience. 2003;116:19–22. doi: 10.1016/s0306-4522(02)00560-2. [DOI] [PMC free article] [PubMed] [Google Scholar]
- Okamoto T, Okabe S. Ultraviolet absorbance at 260 and 280 nm in RNA measurement is dependent on measurement solution. Int J Mol Med. 2000;5:657–659. doi: 10.3892/ijmm.5.6.657. [DOI] [PubMed] [Google Scholar]
- Perrett CW, Marchbanks RM, Whatley SA. Characterization of messenger RNA extracted post-mortem from the brains of schizophrenic, depressed and control subjects. J Neurol Neurosurg Psychiatry. 1988;51:325–331. doi: 10.1136/jnnp.51.3.325. [DOI] [PMC free article] [PubMed] [Google Scholar]
- Pettit HO, Justice JB., Jr Dopamine in the nucleus accumbens during cocaine self-administration as studied by in vivo microdialysis. Pharmacol Biochem Behav. 1989;34:899–904. doi: 10.1016/0091-3057(89)90291-8. [DOI] [PubMed] [Google Scholar]
- Robinson JE, Heaton RK, O’Malley SS. Neuropsychological functioning in cocaine abusers with and without alcohol dependence. J Int Neuropsychol Soc. 1999;5:10–19. doi: 10.1017/s1355617799511028. [DOI] [PubMed] [Google Scholar]
- Segal DM, Moraes CT, Mash DC. Upregulation of D3 dopamine receptor mRNA in the nucleus accumbens of human cocaine fatalities. Mol Brain Res. 1997;45:335–339. doi: 10.1016/s0169-328x(97)00025-9. [DOI] [PubMed] [Google Scholar]
- Smith Y, Kieval J, Couceyro PR, Kuhar MJ. CART peptide-immunoreactive neurons in the nucleus accumbens in monkeys: ultrastructural analysis, co-localization studies, and synaptic interactions with dopaminergic afferents. J Comp Neurol. 1999;407:491–511. doi: 10.1002/(sici)1096-9861(19990517)407:4<491::aid-cne3>3.0.co;2-0. [DOI] [PubMed] [Google Scholar]
- Strickland TL, Mena I, Villanueva-Meyer J, Miller BL, Cummings J, Mehringer CM, Satz P, Myers H. Cerebral perfusion and neuropsychological consequences of chronic cocaine use. J Neuropsychiatry Clin Neurosci. 1993;5:419–427. doi: 10.1176/jnp.5.4.419. [DOI] [PubMed] [Google Scholar]
- Strickland TL, Miller BL, Kowell A, Stein R. Neurobiology of cocaine-induced organic brain impairment: contributions from functional neuroimaging. Neuropsychol Rev. 1998;8:1–9. doi: 10.1023/a:1025613322003. [DOI] [PubMed] [Google Scholar]
- Tang W-X, Fasulo WH, Mash DC, Hemby SE. Molecular profiling of midbrain dopamine regions in cocaine overdose victims. J Neurochem. 2003;85:911–924. doi: 10.1046/j.1471-4159.2003.01740.x. [DOI] [PMC free article] [PubMed] [Google Scholar]
- Toda S, McGinty JF, Kalivas PW. Repeated cocaine administration alters the expression of genes in corticolimbic circuitry after a 3-week withdrawal: A DNA macroarray study. J Neurochem. 2002;82:1290–1299. doi: 10.1046/j.1471-4159.2002.01083.x. [DOI] [PubMed] [Google Scholar]
- Vawter MP, Crook JM, Hyde TM, Kleinman JE, Weinberger DR, Becker KG, Freed WJ. Microarray analysis of gene expression in the prefrontal cortex in schizophrenia: a preliminary study. Schizophr Res. 2002;58:11–20. doi: 10.1016/s0920-9964(01)00377-2. [DOI] [PubMed] [Google Scholar]
- Volkow ND, Mullani N, Gould KL, Adler S, Krajewski K. Cerebral blood flow in chronic cocaine users: a study with positron emission tomography. Br J Psychiatry. 1988a;152:641–648. doi: 10.1192/bjp.152.5.641. [DOI] [PubMed] [Google Scholar]
- Volkow ND, Valentine A, Kulkarni M. Radiological and neurological changes in the drug abuse patient: a study with MRI. J Neuroradiol. 1988b;15:288–293. [PubMed] [Google Scholar]
- Wiggins RC, Ruiz B. Development under the influence of cocaine. II Comparison of the effects of maternal cocaine and associated undernutrition on brain myelin development in the offspring. Metab Brain Dis. 1990;5:101–109. doi: 10.1007/BF01001050. [DOI] [PubMed] [Google Scholar]