Quantitative Analysis of Mitochondrial Ca2+ Uptake and Release Pathways in Sympathetic Neurons: Reconstruction of the Recovery after Depolarization-Evoked [Ca2+]i Elevations (original) (raw)
Abstract
Rate equations for mitochondrial Ca2+ uptake and release and plasma membrane Ca2+ transport were determined from the measured fluxes in the preceding study and incorporated into a model of Ca2+ dynamics. It was asked if the measured fluxes are sufficient to account for the [Ca2+]i recovery kinetics after depolarization-evoked [Ca2+]i elevations. Ca2+ transport across the plasma membrane was described by a parallel extrusion/leak system, while the rates of mitochondrial Ca2+ uptake and release were represented using equations like those describing Ca2+ transport by isolated mitochondria. Taken together, these rate descriptions account very well for the time course of recovery after [Ca2+]i elevations evoked by weak and strong depolarization and their differential sensitivity to FCCP, CGP 37157, and [Na+]i. The model also leads to three general conclusions about mitochondrial Ca2+ transport in intact cells: (1) mitochondria are expected to accumulate Ca2+ even in response to stimuli that raise [Ca2+]i only slightly above resting levels; (2) there are two qualitatively different stimulus regimes that parallel the buffering and non-buffering modes of Ca2+ transport by isolated mitochondria that have been described previously; (3) the impact of mitochondrial Ca2+ transport on intracellular calcium dynamics is strongly influenced by nonmitochondrial Ca2+ transport; in particular, the magnitude of the prolonged [Ca2+]i elevation that occurs during the plateau phase of recovery is related to the Ca2+ set-point described in studies of isolated mitochondria, but is a property of mitochondrial Ca2+ transport in a cellular context. Finally, the model resolves the paradoxical finding that stimulus-induced [Ca2+]i elevations as small as ∼300 nM increase intramitochondrial total Ca2+ concentration, but the steady [Ca2+]i elevations evoked by such stimuli are not influenced by FCCP.
Keywords: mitochondria, calcium, neurons, Ca2+ uniporter, mitochondrial Na+/Ca2+ exchanger
INTRODUCTION
Ionized free calcium (Ca2+) is an important signal that links a variety of extracellular stimuli to their intracellular effectors. Since Ca2+ accomplishes this function by interacting with Ca2+ binding proteins, the cellular effects of Ca2+ depend critically on the dynamics of Ca2+ concentration ([Ca2+]). One of the central goals in the study of calcium signaling is to understand the basis of [Ca2+] dynamics. This is complicated by several factors: (a) Ca2+ is present in multiple membrane-delimited intracellular compartments, each of which employs distinctive Ca2+ transport systems; (b) Ca2+ may be distributed in a spatially nonuniform manner within these compartments; (c) the rate of Ca2+ transport between compartments can exhibit a complex nonlinear dependence on free Ca concentration.
We have studied how mitochondrial Ca2+ transport contributes to the redistribution of intracellular Ca2+ during and after depolarization-evoked Ca2+ entry in sympathetic neurons. Here, the rise in cytosolic free Ca2+ concentration ([Ca2+]i) is initiated by Ca2+ entry but is strongly influenced by Ca2+ uptake and release by organelles such as mitochondria and the endoplasmic reticulum (ER). We simplified the analysis of [Ca2+] dynamics by inhibiting SERCA Ca2+ pumps to minimize Ca2+ accumulation by the ER, and by focusing on the slow recovery that follows repolarization, a period during which the spatial distribution of [Ca2+]i is approximately uniform. Analysis of this case is relevant to slow changes in [Ca2+] that occur in the aftermath of depolarizing stimuli, and is a logical step in understanding the more complex case where [Ca2+] undergoes rapid, spatially nonuniform changes within multiple intracellular compartments.
In the preceding study, the total Ca2+ flux during the recovery after depolarization was dissected into three components, one representing net Ca2+ extrusion across the plasma membrane, the others representing mitochondrial Ca2+ uptake and release via the uniporter and Na+/Ca2+ exchanger. In this study, these flux components are described analytically to determine if they are sufficient to account for the time course of the [Ca2+]i recovery after weak and strong stimuli, and the effects of mitochondrial Ca2+ transport inhibitors on these recoveries. It is found that they are. Moreover, the results are in general quantitative agreement with the dynamics of total mitochondrial Ca concentration deduced from x-ray microanalysis under the same conditions of stimulation. The results provide a conceptual framework for describing how mitochondrial Ca transport operates in the context of intact cells.
MATERIALS AND METHODS
Preparation of cells and measurement of [Ca2+]i and Ca2+ fluxes follow the procedures described in the preceding paper. Empirical rate equations for net plasma membrane Ca2+ transport and for mitochondrial Ca2+ uptake and release were obtained by fitting equations to flux data obtained from [Ca2+]i recordings that were smoothed 1–2 times with a binomial filter. The rate equations were then incorporated into a system of differential equations that was solved numerically using a 4th-order Runge-Kutta routine (Boyce and DiPrima 1969) written in Igor Pro (Wavemetrics, Inc.). Step size was 50 ms; further reductions in step size did not noticeably alter the results. Cells were pretreated with thapsigargin (Tg) to minimize contributions from ER Ca transport, so the model does not include this organelle. The details of the model and the underlying assumptions are described in the .
RESULTS
Quantitative Description of the Flux Components
We begin with analytical descriptions of the three components of the total Ca2+ flux. In each case, rate equations will be used that are motivated by known properties of plasma membrane and mitochondrial Ca2+ transport. It is then asked if the quantitative properties of the individual fluxes are sufficient to account for the kinetic properties of the [Ca2+]i recovery. For this purpose, the equations may be regarded as completely empirical. However, in the Discussion, the equations and parameters describing mitochondrial Ca2+ transport will be considered in light of information obtained from previous studies of isolated organelles.
The [Ca2+]i -dependent Fluxes: Jpm and Juni
Fig. 1 A shows how the rate of net Ca2+ extrusion across the plasma membrane (Jpm) depends on [Ca2+]i during the recovery after high K+ depolarization, averaged over 10 cells (solid symbols). The smooth curve is a plot of (see ) that describes the net flux generated by a linear leak operating in parallel with a saturable extrusion system. According to this equation, Jpm increases monotonically with [Ca2+]i, crossing zero at a (stable) resting level (50 nM). regards Jpm as an instantaneous function of [Ca2+]i, conforming with the observed properties of this flux (see Figure 2 B of preceding study). While there is evidence for distinct components of Jpm that are differentially sensitive to extracellular Na+ and La3+ (Friel, D.D., unpublished observations), lumps together all energetically uphill Ca2+ transport into a single equation and should therefore be regarded as an empirical description of the measured flux. Clearly, the [Ca2+]i dependence of Jpm is adequately described by for [Ca2+]i up to 800 nM. Similar results were obtained from three cells studied under voltage clamp (open symbols).
Figure 1.

Quantitative description of the [Ca2+]i-dependent transport pathways: Jpm and Juni. (A) [Ca2+]i dependence of Jpm. Mean Jpm from ten cells plotted against [Ca2+]i (solid symbols). The total Ca2+ flux during the recovery was measured after 50 mM K+ depolarization in the presence of FCCP (1 μM). Jpm can be described by (smooth curve) with: k leak = 3.7 × 10⁻⁷ s−1, Vmax,extru = 28.3 nM/s, EC50,extru = 378.8 nM and n extru = 1.8. This equation also describes mean Jpm from three cells studied under voltage clamp after adjusting for differences in resting [Ca2+]i by subtracting a small constant leak flux (−5 nM/s, open symbols). (B) [Ca2+]i dependence of Juni. Mean Juni from three cells studied under voltage clamp plotted against [Ca2+]i (open symbols). Cells were depolarized from −70 to −10 mV before and after exposure to FCCP (1 μM) and Juni was calculated as the difference between the net Ca2+ fluxes at corresponding values of [Ca2+]i during the recovery. Pipette solutions contained no added Na+ to inhibit mitochondrial Ca2+ release via the Na+/Ca2+ exchanger. Data are described by (smooth curve) with kmax,uni = 75.9 s−1, EC50,uni = 10 μM and nuni = 2, which also provides a good description of Juni after 50 mM K+ depolarization (filled symbols, mean Juni from ten cells measured for [Ca2+]i up to ∼500 nM).
Fig. 1 B shows the [Ca2+]i dependence of Juni based on collected results from three cells studied under voltage clamp (open symbols). Juni increases steeply and monotonically with [Ca2+]i in a manner that can be described by a modified sigmoidal function of [Ca2+]i (). According to this equation, Juni depends on [Ca2+]i but not [Ca2+]m, consistent with the finding that Juni exhibits the same [Ca2+]i dependence after stimuli that are expected to produce very different mitochondrial Ca2+ loads (see Figure 7, D and E, of preceding study). There is no indication that Juni saturates over this [Ca2+]i range, so no attempt was made to estimate a limiting slope (kmax,uni) or a [Ca2+]i level where activation is half-maximal (EC50,uni). However, Hill plot analysis provides an estimate of the Hill coefficient (nuni = 1.93 ± 0.18) that is quite insensitive to these parameters (Gunter and Gunter 1994; see also Scarpa and Graziotti 1973). The smooth curve shows the result of fitting to the flux data with EC50,uni held at 10 μM (Gunter and Pfeiffer 1990) and nuni = 2, yielding kmax,uni = 75.9. With the same parameters, also provides a good description of mean Juni from 10 cells measured after high K+ depolarization (solid symbols).
Ca2+ Release via the Mitochondrial Na+/Ca2+ Exchanger
In the preceding study, it was shown that JNa/Ca exhibits an apparent U-shaped dependence on [Ca2+]i. Although JNa/Ca varies with [Ca2+]i, it is not clear that JNa/Ca actually depends on [Ca2+]i (i.e., is a function of [Ca2+]i). Previous studies of isolated mitochondria have shown that with constant extramitochondrial Na+ and Ca2+ concentrations, the rate of Ca2+ release via the Na+/Ca2+ exchanger is a saturable function of the intramitochondrial free Ca concentration ([Ca2+]m; Wingrove and Gunter 1986). To examine the dependence of JNa/Ca on intramitochondrial Ca levels, cells were depolarized for increasing periods of time to produce graded mitochondrial Ca2+ loads, and the components of the net mitochondrial Ca2+ flux during the subsequent recoveries were compared. Specifically, it was asked if JNa/Ca increases saturably with the depolarization-evoked mitochondrial Ca load.
Fig. 2 A shows [Ca2+]i responses from an exemplar cell elicited by four 50 mM K+ depolarizations of different duration. While the rise in [Ca2+]i during the depolarizations and the initial recovery after repolarization were similar in each case (see inset), the subsequent phases of recovery depended strongly on stimulus duration. In particular, the slow plateau phase became longer as the duration of the preceding depolarization was increased, as described previously (Friel and Tsien 1994). For example, the time required for [Ca2+]i to fall below 25% of its value at the instant of repolarization increased from 79 to 256 s as the depolarization length increased from 3.3 to 20.7 s. There was also a small increase in the plateau level (see Fig. 2A and Fig. B). B shows the recoveries from A aligned in time. Beneath the [Ca2+]i records are time plots of the net mitochondrial Ca2+ flux (Jmito; see Fig. 2 C), integrated Jmito (ΔCa2+ m i t, D), and the Na+/Ca2+ exchanger flux ( JNa/Ca, E). As discussed in the preceding study, ΔCa2+ m i t provides a measure of the mitochondrial Ca2+ concentration at time t relative to its basal value, referred to the effective cytosolic volume. For each stimulus duration, the initial rapid decline in [Ca2+]i is coincident with a large outward net mitochondrial Ca2+ flux (Fig. 2 C), an increase in mitochondrial Ca concentration (D) and an increase in the magnitude of JNa/Ca (E). In contrast, the plateau phase of recovery is associated with net mitochondrial Ca2+ release, a decline in mitochondrial Ca concentration, and a nearly constant inward flux via the Na+/Ca2+ exchanger, each of which becomes more prolonged as the stimulus length is increased. Note that the initial value of ΔCa2+ m i(i.e., the value at the end of the depolarization) is proportional to stimulus duration when the stimulus lasts at least 7.5 s (Fig. 2 D, inset). Using the measured ratio of mitochondrial and cytosolic volumes (0.1) and the estimated ratio of total and free cytosolic Ca concentration in sympathetic neurons (∼200; Friel, D.D., and S.B. Andrews, unpublished observations), the proportionality constant (71 nM/s) converts to (71)(200/0.1) = 142 μM/s, in reasonable agreement with the rate at which total mitochondrial Ca concentration rises during 50 mM K+ depolarization in these cells as determined from electron probe microanalysis (184 μM/s; Pivovarova et al. 1999).
Figure 2.
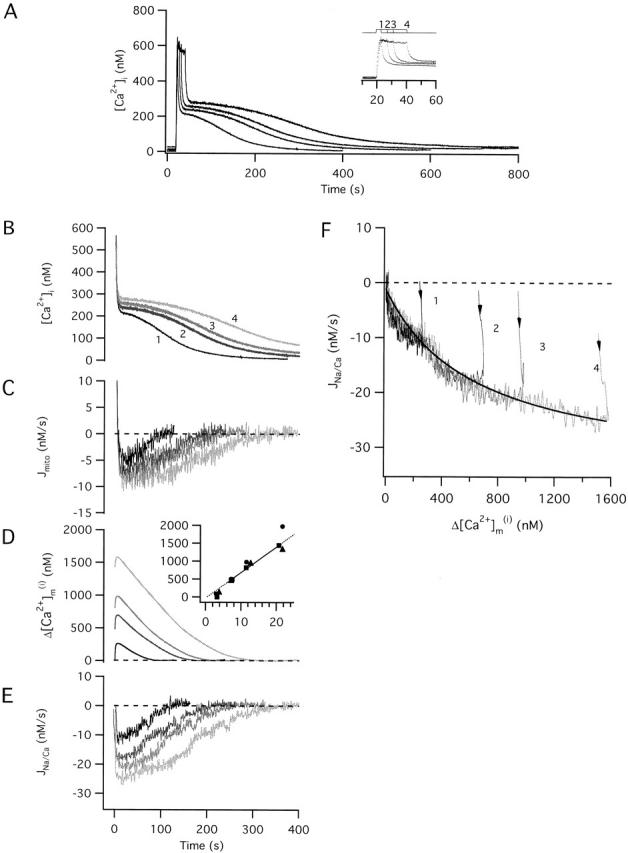
Quantitative description of JNa/Ca (A) Comparison between four responses elicited by 50 mM K+ depolarizations of increasing duration from the same cell (sc0e22). Durations were (1–4, in s): 3.2, 7.5, 11.5, and 20.7. Inset shows the initial portion of the responses on an expanded time scale. (B) [Ca2+]i recoveries from A are aligned in time and coded by intensity (briefest stimulus = darkest trace). (C) Time course of the net mitochondrial Ca2+ flux, Jmito calculated as the difference between the total flux in the presence and absence of FCCP (1 μM) at corresponding values of [Ca2+]i. (D) Time course of the integrated net mitochondrial Ca2+ flux ΔCa2+ m ias a measure of changes in mitochondrial Ca concentration from its resting level. ΔCa2+ m i _t_rises during the initial rapid phase of recovery and then declines more slowly with a half time that increases with stimulus duration. Inset shows the relationship between ΔCa2+ m ijust after repolarization and stimulus duration for this cell (squares). Dashed trace shows best fit line for the last three points (slope: 71 nM/s, y-intercept: −7 nM). Results from two other cells are also shown (circles, triangles). (E) Time course of JNa/Ca showing the initial increase during the rapid phase of recovery and the subsequent decline that parallels the slow plateau phase of the [Ca2+]i recovery. Peak JNa/Ca increases sublinearly with stimulus duration. JNa/Ca was calculated as the component of the total flux during the recovery that was sensitive to CGP (4 μM). (F) Plot of JNa/Ca versus ΔCa2+ m i _t_for each of the recoveries along with a fit (smooth curve) based on with A = −34.8 nM/s, B = 615 nM, and C = 0.03. See text for description of parameters.
Importantly, Jmito and its inward component JNa/Ca are both limited as the stimulus duration increases. For example, increasing the stimulus length from 11.5 to 20.7 s nearly doubles the mitochondrial Ca load, but has relatively little effect on the peak magnitude of JNa/Ca (Fig. 2, compare D with E). Saturation of JNa/Ca can be seen more clearly by plotting JNa/Ca versus ΔCa2+ m iduring the recovery for each stimulus duration (F). In each case, JNa/Ca increases saturably with ΔCa2+ m iin a manner that is described by over most of the ΔCa2+ m irange (see smooth curve). This equation, which assumes that JNa/Ca depends on intramitochondrial Ca2+ concentration but not [Ca2+]i, provides a simple description of the measured flux over all but the initial phase of recovery. Estimating the ratio of mitochondrial and cytoplasmic effective volumes (γ) as 2 (see previous study) gives Δ[Ca2+]m = ΔCa2+ m i/2 (), Vmax,Na/Ca = −34.8 nM/s, EC50,Na/Ca = 307.5 nM and [Ca2+]m(∞) = 9.2 nM. Results from two other cells were similar except that Vmax,Na/Ca was somewhat larger (∼ −75 nM/s).
While the rate of mitochondrial Ca2+ release is described quite well by during most of the recovery, it deviates systematically from this description during the initial phase when [Ca2+]i highest. During this phase, the rapid decline in [Ca2+]i is accompanied by a similarly rapid rise in JNa/Ca (Fig. 2E and Fig. F arrows). The basis for this deviation, which is relevant to the apparent U-shaped [Ca2+]i dependence of JNa/Ca (see preceding study, Fig. 7 and Fig. 8) is not certain. However, previous studies have shown that the mitochondrial Na+/Ca2+ exchanger is inhibited by extramitochondrial Ca2+ (Hayat and Crompton 1982). A modified rate law that includes [Ca2+]i-dependent inhibition of the exchanger at high [Ca2+]i () provides a reasonable description of the results during the entire recovery (not shown). However, it will be shown below that the observed attenuation of JNa/Ca at high [Ca2+]i is not expected to influence recovery kinetics very much since under these conditions Juni is the dominant component of the mitochondrial Ca2+ flux and JNa/Ca represents only a small fraction of the total flux.
Figure 7.
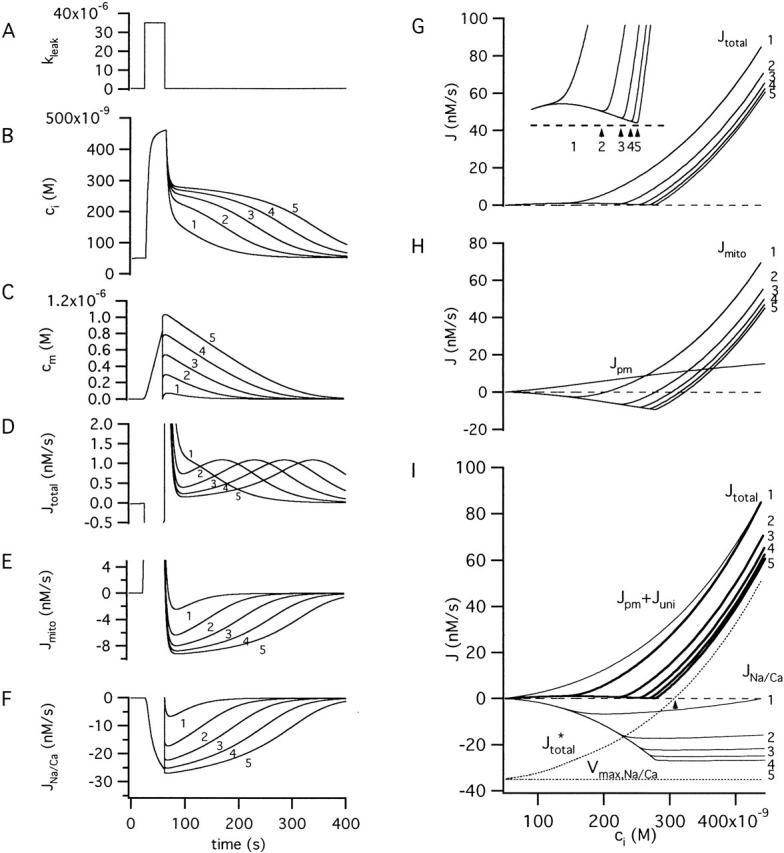
Basis of the Ca2+ plateau level and its limiting value. Simulated responses to a step increase in kleak (A) showing how relaxations of ci (B) and cm (C) are influenced by the initial value of cm at the beginning of the recovery. Also shown are time plots of Jtotal (D), Jmito (E) and JNa/Ca (F). (G) Plot of Jtotal versus ci. Inset shows flux minima (arrows 2–5) on an expanded scale. There is no Jtotal minimum during recovery 1, and the minima during recoveries 2–5 occur at progressively higher ci as the initial value of cm is increased. (H) Plot showing the components of Jtotal (Jmito and Jpm) versus ci during the recovery for responses 1-5. (I) Plots of Jtotal (thick traces) and an alternative set of components (Jpm + Juni), which depends only on ci, and JNa/Ca which depends on cm (thin traces). Dotted traces show Vmax,Na/Ca and Jtotal* = (Jpm + Juni) + Vmax,Na/Ca. Note that the value of ci where Jtotal * is zero represents a stable steady-state (see arrow). The initial value of cm when the recovery began was 0 for trace 1 and was incremented by 250 nM for each of the successive responses (2–5). Horizontal dashed traces in G–I indicate zero net flux.
Figure 8.

Simulated effect of graded inhibition of the Na+/Ca2+ exchanger. Family of ci and cm responses simulated using a fixed stimulus but different values of Vmax,Na/Ca to examine the effect of partial inhibition of the Na+/Ca2+ exchanger on response kinetics. When Vmax,Na/Ca is 35 nM/s, cm declines rapidly during the recovery, the ci plateau is high and the duration of the slow phase of recovery is brief. Reducing Vmax,Na/Ca stepwise progressively slows the cm recovery and lowers and prolongs the ci plateau. When Vmax,Na/Ca is zero, there is no plateau phase of the ci recovery and cm remains high; the slow increase in cm represents Ca2+ uptake via the (unopposed) Juni pathway.
Below, we examine the behavior of a model in which plasma membrane Ca2+ transport is described by , mitochondrial Ca2+ uptake is described by , and mitochondrial Ca2+ release is described by or , with parameter values obtained directly from the experimental data presented above. It is found that the model accounts very well for most of the features of [Ca2+]i recovery kinetics in sympathetic neurons.
Simulated Changes in Intracellular Ca2+ Concentration Induced by Ca2+ Entry
To determine if the quantitative properties of Jpm, Juni, and JNa/Ca are sufficient to account for [Ca2+]i dynamics during the recovery, the rate equations described above were taken as the flux definitions in a previous model of Ca dynamics in sympathetic neurons (Friel and Tsien 1994). In this model, mitochondria contain Ca2+ at concentration cm and are exposed to cytosolic Ca2+ at concentration ci (Fig. 3 A, left). It is assumed that ci is spatially uniform within the cytosol, which is a reasonably accurate description of [Ca2+]i during the recovery since [Ca2+]i gradients dissipate rapidly (∼1 s) after repolarization (Hernandez-Cruz et al. 1990; Hua et al. 1993). With regard to the spatial distribution of intramitochondrial Ca, reversible formation of Ca- and P-rich intramitochondrial inclusions has been observed under these conditions of stimulation (Pivovarova et al. 1999), but there is no evidence that the distribution of intramitochondrial free Ca outside the inclusions is spatially heterogeneous. Therefore, it will be assumed for simplicity that cm is spatially uniform within the mitochondrial compartment.
Figure 3.
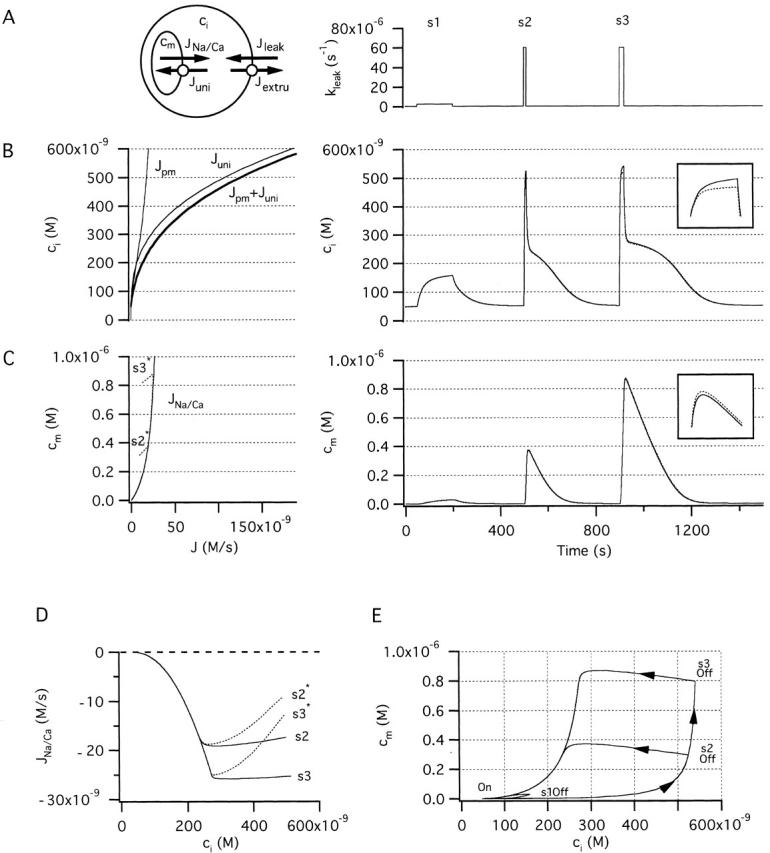
Simulated changes in cytosolic and mitochondrial Ca2+ concentration during and after stimulated Ca entry. (A, left) Schematic of the model used in the simulations indicating compartments (with Ca2+ concentration ci and cm) and pathways for Ca2+ movement between compartments. The net plasma membrane Ca2+ flux, Jpm is the sum of Jleak and Jextru, and the net mitochondrial Ca2+ flux is the sum of Juni and JNa/Ca. (Right) Ca2+ entry was stimulated by increasing the plasma membrane leak rate constant (k leak). (B, left) ci-dependent components of the total Ca2+ flux: Jpm, Juni and Jpm + Juni. Note that Jpm is calculated using the basal Ca2+ entry rate constant and therefore does not apply during stimulation. (Right) Simulated changes in ci during and after each stimulus. Solid curves show simulated ci values in the case where JNa/Ca depends only on cm (), dotted curves illustrate the case where JNa/Ca depends on both cm and ci (). Inset shows on an expanded scale the small effect of including the ci-dependent inhibitory factor in the definition of JNa/Ca; inset represents a 100 nM range of ci around the peak of the response to stimulus s3. (C, left) JNa/Ca and its dependence on cm according to (solid trace) or on cm and ci according to (dotted trace). (Right) Simulated changes in cm during and after each stimulus; solid and dotted curves as in B (right). The weak stimulus (s1) elicits a small ci increase and therefore only activates Juni weakly so that cm undergoes a small rise. The larger stimuli (s2, s3) raise ci sufficiently to activate Juni strongly and elevate cm to a level that depends on stimulus duration. Including the inhibitory term in the definition of JNa/Ca has little effect on the time courses of ci and cm (compare solid and dotted traces). (D) Variation of JNa/Ca with ci during the recovery after s2 and s3 for comparison with the experimentally observed [Ca2+]i dependence of JNa/Ca. (E) Plot of cm vs ci for each of the responses illustrated in B and C (right). Unless indicated otherwise, parameter values in this and the following figures are: k leak = 3.7 × 10⁻⁷ s−1, Vmax,extru = 28.3 nM/s, EC50,extru = 378.8 nM, n extru = 1.8, kmax,uni = 80 s−1, EC50,uni = 10 μM, nuni = 2, Vmax,Na/Ca = −35 nM/s, EC50,Na/Ca = 307 nM, co = 0.002 and γ = 2. Parameters describing inhibition of JNa/Ca are n inhib = 6 and Kinhib = 500 nM.
In the model, Ca2+ extrusion across the plasma membrane occurs at rate Jextru and passive Ca2+ entry occurs at rate Jleak. These two fluxes define the net Ca2+ flux across the plasma membrane (Jpm). Mitochondrial Ca2+ uptake is described by Juni and Ca2+ release is described by JNa/Ca; these two fluxes define the net mitochondrial Ca2+ flux. Since Jpm and Juni are both defined by ci, they are plotted together against ci in B (left) along with their sum (thick trace). JNa/Ca is plotted both versus cm (Fig. 3 C, left, shown as a positive flux for simplicity) and versus ci (D) for comparison with the results in the preceding study (e.g., Fig. 7 and Fig. 8); solid traces describe the case where JNa/Ca depends only on cm and dotted traces illustrate the case where this flux depends on both cm and ci.
Simulated changes in ci and cm after step increases in the rate constant of Ca2+ entry (Fig. 3 A, right) are plotted in B and C (right); note that the ci- and cm-dependent fluxes can be read from the corresponding plots at left. During a small stimulus (s1) that elevates ci to a low level (∼160 nM, Fig. 3 B, right), Juni is only weakly activated (B, left) so that cm increases to a low level (<50 nM, C right). In this case, when the stimulus ends, the net mitochondrial Ca2+ flux is small compared with Jpm so the ci recovery is dominated by Ca2+ extrusion across the plasma membrane, accounting for the simple recovery kinetics. With a stronger stimulus (s2) that raises ci to a higher level, Juni is activated more strongly, causing robust Ca2+ accumulation and a rapid rise in cm. Due to its steep ci dependence, Juni is nearly four times larger than JNa/Ca at the highest ci levels achieved during stimulation, setting the stage for continuous mitochondrial Ca2+ accumulation. When this stimulus ends, continued Ca2+ accumulation contributes to a rapid rise in cm and decline in ci (Fig. 3 E; see Fig. 5 C from Babcock et al. 1997). This decline in ci, in turn, deactivates Juni and shifts the balance from mitochondrial Ca2+ accumulation to net release, which initiates the slow plateau phase of recovery. Finally, as ci approaches its resting level, net Ca2+ extrusion across the plasma membrane dominates. A longer stimulus (s3) raises ci to about the same level but for a longer period of time, leading to a larger increase in cm. As a result, the ci recovery is even more prolonged. Overall, the recovery kinetics are very similar to those observed experimentally in terms of sensitivity to stimulus strength and duration, the four distinct phases of recovery, and the level of the plateau (Friel and Tsien 1994; see Fig. 2 A of this study).
Figure 5.
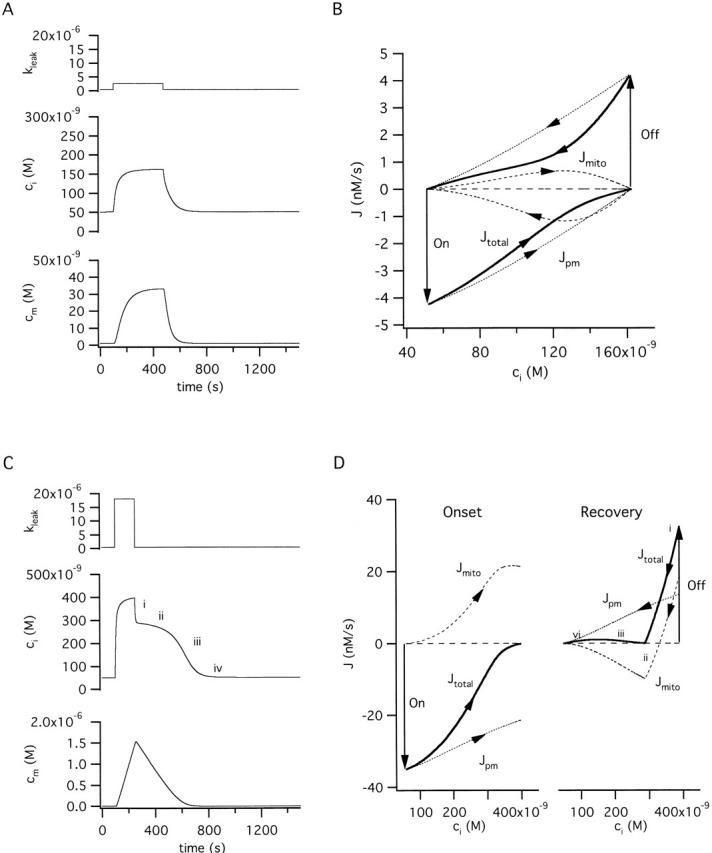
Comparison between responses to weak and strong stimulation (A) Simulated ci and cm responses elicited by a weak stimulus that raises ci and cm to new steady-state levels. (B) Ca2+ fluxes responsible for changes in ci and cm in A. The total cytosolic Ca2+ flux (Jtotal) is shown (thick trace) along with its components Jpm (dotted trace) and Jmito (dashed trace). The downward arrow (On) indicates when the stimulus begins, and the upward Off arrow indicates when the stimulus ends. Inward fluxes are negative and outward fluxes are positive. (C) Simulated ci and cm responses elicited by a strong stimulus. (D) The Ca2+ fluxes underlying the changes in ci and cm are shown separately in C during the onset (left) and the recovery (right). As with the measured fluxes Jtotal and Jmito, the simulated fluxes during the recovery are biphasic and exhibit minima during the plateau phase. See text for details.
If the rate description of JNa/Ca is modified to include inhibition by ci, JNa/Ca is no longer completely defined by cm and is depressed during the initial rapid phase of recovery when ci is high, showing an apparent U-shaped dependence on ci like the measured flux (dotted curves s2*, s3* in Fig. 3C and Fig. D). However, the time courses of ci and cm are nearly unchanged (see dotted curves in B and C right, insets). The explanation is simple: JNa/Ca constitutes only a small fraction of the total mitochondrial Ca2+ flux over the ci range where inhibition occurs, so that inhibition has little impact on the total flux. Since inhibition of JNa/Ca during the initial phase the recovery does not appreciably influence the dynamics of ci or cm, for simplicity, it will be ignored in the following, and it will be assumed that JNa/Ca depends only on cm.
Responses to Stimuli of Variable Magnitude and Duration
Fig. 4 A illustrates responses to stimuli of fixed duration and increasing strength. Weak stimuli that raise ci to low levels barely activate the uniporter so that mitochondrial Ca2+ accumulation is slow. Thus, when the stimulus ends, Ca2+ uptake and release rates are low, so the recovery kinetics depend almost entirely on Ca2+ extrusion across the plasma membrane. Stronger stimuli that raise ci to higher levels increasingly activate the uniporter, causing Ca2+ accumulation at progressively higher rates (see Fig. 4 A, bottom). During each stimulus, ci and the rate of mitochondrial Ca2+ accumulation both approach steady values, and when the stimulus ends, continued mitochondrial Ca accumulation speeds the initial ci decline. This leads to partial deactivation of the uniporter, causing Ca2+ accumulation to give way to net release, which then slows the ci recovery. As discussed in the next section, when the mitochondrial Ca2+ load is large, the rate of Ca2+ release via the Na+/Ca2+ exchanger, and the rate of net mitochondrial Ca2+ release, are both nearly constant, causing ci to hang up at an elevated plateau level until cm falls and saturation of the exchanger is relieved. The ci plateau level, defined as the ci level where the recovery rate reaches a minimum, increases with stimulus strength and appears to approach a limiting value where ci declines at a vanishingly slow rate (see below).
Figure 4.

Simulated responses to stimuli of graded intensity and duration. (A) Changes in ci and cm elicited by 110 s stimuli of graded intensity. During weak stimulation, ci and cm approach new elevated steady state values, while during the stronger stimuli ci approaches a steady elevated level and cm rises linearly with time. After the stronger stimuli, ci falls to a plateau level and then recovers with a time course much like that observed experimentally. (B) Changes in ci and cm elicited by stimuli of fixed magnitude equal to the strongest stimulus in A but of variable duration. With increasing stimulus duration, ci approaches a steady elevated level where cm increases in proportion to stimulus length (compare with Fig. 2 D, inset). After the stimulus ends, the rapid decline in ci is accompanied by a rise in cm, and during the plateau phase cm falls at a nearly constant rate, causing ci to remain elevated at a nearly constant level that increases saturably with mitochondrial Ca2+ load.
Fig. 4 B illustrates responses to stimuli of fixed magnitude and variable duration. In this case, the briefest stimulus raises ci sufficiently to activate the uniporter, and increasing the stimulus duration increases the mitochondrial Ca2+ load. As the stimulus length increases, ci approaches a steady elevated level and cm rises linearly with time (compare with Fig. 2 D, inset). When the stimulus ends, ci undergoes a rapid decline to a plateau level that depends on stimulus duration (compare with Fig. 2 A) and eventually recovers to basal levels.
Comparison between Simulated Responses to Weak and Strong Stimulation: Analysis of the Underlying Fluxes
Mitochondrial Ca2+ uptake has often been viewed as a low-affinity process that is only important when [Ca2+]i rises to high levels, either in microdomains near mitochondria during physiological stimulation (Rizzuto et al. 1998), or after Ca2+ overload under extreme conditions (Moravec and Bond 1992; Horikawa et al. 1998). One reason is that the EC50 for the uniporter is high (∼10–20 μM; Gunter and Pfeiffer 1990). How is mitochondrial Ca concentration expected to change during stimulation that raises [Ca2+]i only slightly above the resting level? A simulated response to a long, weak stimulus is shown in Fig. 5 A. During the stimulus, both ci and cm rise to new steady state levels (cm < ci) and return to their prestimulation values after the stimulus ends. The changes in ci and cm can be understood by considering the underlying fluxes (Fig. 5 B). Before stimulation, there is a steady state distribution of Ca2+, and the total cytosolic Ca2+ flux (Jtotal) and its components Jpm and Jmito, are all zero. When the stimulus begins (On arrow), Jtotal (thick trace) suddenly becomes an inward flux so that ci rises and then gradually declines toward zero as ci approaches a new elevated steady state level. When the stimulus ends, Jtotal suddenly becomes an outward flux (Off arrow), which causes ci to return to its basal level. Note that during the onset, Jpm includes contributions from both basal and stimulated Ca2+ entry as well as Ca2+ extrusion.
The changes in Jtotal can be understood by examining the component fluxes. With the onset of stimulation, the rate of Ca2+ entry suddenly increases, creating an imbalance between Ca2+ entry and extrusion which causes Jpm (dotted trace), and therefore Jtotal, to suddenly become inwardly directed (On arrow). As ci rises, the rate of Ca2+ extrusion increases, eventually equaling the rate of Ca2+ entry, so that Jpm declines to zero. The rise in ci also creates an imbalance between mitochondrial Ca2+ uptake and release, leading to net mitochondrial Ca2+ accumulation (Jmito positive, dashed trace) which slows the rise in ci. As cm rises, Ca2+ release eventually balances uptake and Jmito falls to zero. Termination of the stimulus creates a sudden imbalance between Ca2+ entry and extrusion which causes Jpm (and Jtotal) to become outward fluxes (Off arrow) so that ci declines. As the rate of Ca2+ extrusion approaches the rate of entry, Jpm approaches zero. The decline in ci also creates an imbalance between mitochondrial Ca2+ uptake and release, leading to net Ca2+ release (Jmito negative, dashed trace), which slows the ci recovery. As ci and cm return to their resting levels, the rates of Ca2+ uptake and release both decline and Jpm and Jmito approach zero. Thus, a weak stimulus leads to a reversible transition between two steady states in which all intercompartmental net fluxes are zero.
Strong stimuli produce qualitatively different responses (Fig. 5C and Fig. D). For clarity, the fluxes underlying the response onset and recovery are shown separately (Fig. 5 D, left and right, respectively). When the stimulus begins, Jtotal instantly becomes a large inward flux (Fig. 5 D left, thick trace, On arrow) and then declines to zero as ci stabilizes at a new elevated level. However, in this case, Jtotal approaches zero not because the component fluxes individually fall to zero, but because the outward flux Jmito eventually balances the inward flux Jpm. This occurs when ci is so high that Juni exceeds the maximal rate of Ca2+ release via the Na+/Ca2+ exchanger, setting the stage for continuous mitochondrial Ca2+ accumulation at a rate that equals the rate of net Ca2+ entry. When the stimulus ends, Jtotal suddenly becomes a large outward flux (Fig. 5 D right, thick trace, Off arrow) which causes ci to fall rapidly. However, Jtotal does not decline continuously, but instead reaches a minimum and then rises again to reach a maximum before finally approaching zero. Jtotal is biphasic because it is the sum of Jpm, which increases montonically with ci, and Jmito, which is biphasic, representing an initial phase of Ca2+ accumulation and a late phase of net Ca2+ release. The similarity between the simulated and measured fluxes during the recovery is clear (compare with Fig. 3 D in the preceding study).
The interplay between the components of the total flux explains the four phases of the ci recovery (Fig. 5C and Fig. D right). During phase i, both Jmito and Jpm are positive, accounting for the initial rapid ci decline. The reduction in ci causes partial deactivation of Juni and a reduction in the rate of mitochondrial Ca2+ accumulation. When the rates of Ca2+ uptake and release are equal, Jmito is zero, but the decline in ci continues because of ongoing net Ca2+ extrusion. Further deactivation of Juni causes mitochondrial Ca2+ accumulation to give way to net release (phase ii) which slows the recovery. However, as cm falls, the rate of Ca2+ release declines so that Jmito approaches zero. As a result, Jtotal rises, accounting for the accelerated recovery during phase iii. Finally, as Jmito approaches zero, the recovery is dominated by net Ca2+ extrusion across the plasma membrane (phase iv).
Simulated Effects of CGP on Responses to Weak Stimulation
In the preceding study, it was shown that despite being largely insensitive to FCCP, [Ca2+]i responses elicited by weak depolarization are strongly depressed by CGP. This makes sense in light of the preceding discussion. After inhibiting mitochondrial Ca2+ release, weak stimuli that would otherwise lead to transient mitochondrial Ca2+ accumulation are expected to cause continuous accumulation and depressed [Ca2+]i elevations, as in the strong stimulus regime described above. Fig. 6 shows simulated responses to a long, weak stimulus that under control conditions raises ci to a steady state level of ∼230 nM and cm to ∼100 nM. To model the actions of CGP, Vmax,Na/Ca was set to zero. In this case (JNa/Ca = 0), the same stimulus elicited a smaller steady rise in ci that was accompanied by a continuous rise in cm. Vmax,uni was then set to zero to model the additional effects of FCCP (Juni = 0). This abolished the stimulus-evoked rise in cm and speeded the elevation in ci, reversing the simulated actions of CGP. Moreover, after inhibiting uptake, ci rose to the same steady state level during stimulation as it did in the control. These simulations reproduce the observed effects of CGP and FCCP on steady [Ca2+]i elevations elicited by weak depolarization (see Figure 9 D of the preceding study; Friel and Tsien 1994).
Figure 6.
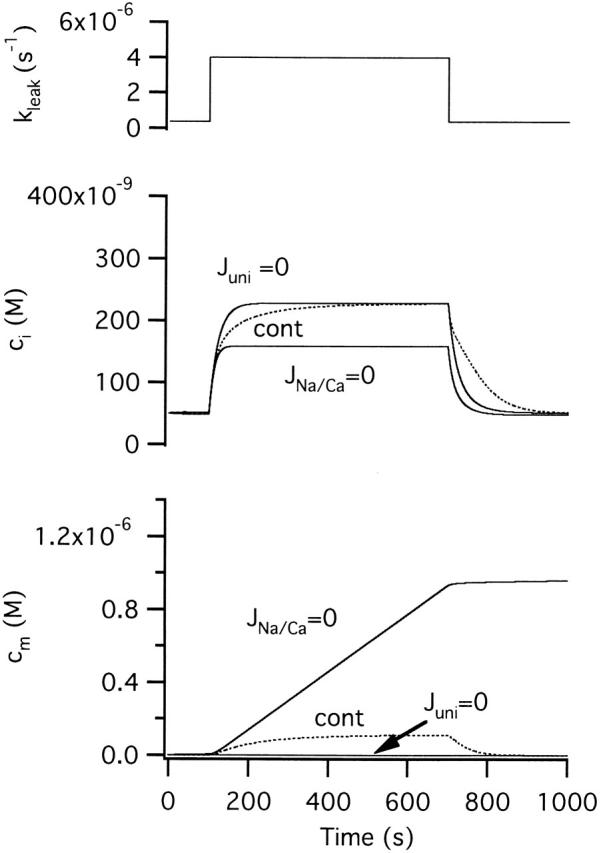
Simulated effects of treatment with CGP and FCCP on responses to weak depolarization. Responses to a long weak stimulus before (cont) and after setting Vmax,Na/Ca to zero to model the actions of CGP at a saturating concentration; kmax,uni was set to zero to model the actions of FCCP. When the release pathway is inhibited (Vmax,Na/Ca = 0) mitochondria accumulate Ca2+ continuously during stimulation so that ci stabilizes before reaching the steady-state level observed under control conditions. This can be explained by the underlying fluxes (see Fig. 5 B) in the case where the net mitochondrial Ca2+ flux is given by Juni. In that case, the value of ci where Jtotal is zero is shifted to a lower value where Jpm is negative. If uptake in then inhibited (kmax,uni = 0), cm does not increase in response to the stimulus and ci changes more rapidly, and the steady-state ci level attained during stimulation is restored to the control level.
The Basis for the Plateau Level and Its Relationship to the Mitochondrial Ca2+ Set Point
Previous studies have identified the [Ca2+]i plateau level with the mitochondrial Ca2+ set point (Thayer and Miller 1990) but the actual relationship between these two quantities has not been described. In the preceding study, the plateau level was defined as the ci level where Jtotal reaches a minimum during the recovery. As shown in Fig. 5 (D, right), Jtotal reaches a minimum when the rate of mitochondrial Ca2+ release is nearly maximal (and Jmito is close to its minimal value). From the family of responses shown Fig. 4 A, it is apparent that the plateau level approaches a limiting value as the stimulus raises cm to progressively higher levels, and that the rate of recovery at the plateau approaches zero. The basis for the plateau level and its limiting value is examined in Fig. 7. Fig. 7B and Fig. C, show simulated ci and cm responses elicited by the same strong stimulus (A) with the initial value of cm set at the beginning of the recovery to different levels. Also shown are the time courses of Jtotal (D), Jmito (E), and JNa/Ca (F).
If the recovery begins with cm equal to zero (Fig. 7 C, trace 1), cm never reaches a very high level and the rate of net mitochondrial Ca2+ release is low during the entire recovery (E). In this case, Jtotal does not exhibit a minimum (Fig. 7 D) so there is no ci plateau (B). With larger initial values of cm (Fig. 7 C, traces 2–5), Jtotal passes through a minimum that approaches zero (D) and the ci plateaus become increasingly flat (B). Another way to visualize how the Jtotal minimum is influenced by mitochondrial Ca2+ load is to plot this flux against ci during each of the recoveries (Fig. 7 G). As shown in the inset, the magnitude of Jtotal at the minimum approaches zero, and the value of ci where the minimum occurs approaches a limiting value. In each case, the Jtotal minimum occurs near the ci level where Jmito is minimal (Fig. 7, compare G with H) and the magnitude of JNa/Ca is maximal.
The basis for the plateau and its limiting level finally becomes clear when Jtotal for each of the five recoveries (Fig. 7 I, thick traces 1–5) is separated into its ci-dependent component (Jpm + Juni) and the remaining (cm-dependent) component, JNa/Ca. During each recovery, (Jpm + Juni) (thin trace) declines montonically with a stereotyped ci dependence. In contrast, the rate of Ca2+ release ascends to a peak during phase i of the recovery as ci falls and cm rises, and then descends as cm declines, having an initial value that depends on cm (Fig. 7, thin traces 1–5); the peak is sharper if the rate equation for JNa/Ca includes inhibition by cytosolic Ca2+ (see Fig. 3 D). In terms of the model, it is the JNa/Ca peak that is responsible for the Jmito and Jtotal minima, and therefore the ci plateau. As the initial mitochondrial Ca2+ load increases, the release pathway nears saturation, the magnitude of JNa/Ca during the initial phase of recovery approaches Vmax,Na/Ca (horizontal dotted line) and the plateau level approaches a limiting value. This is the (stable) steady state value of ci that would be reached if cm were clamped at such a high value that the rate of Ca2+ release is maximal (JNa/Ca ∼ Vmax,Na/Ca) and ci were allowed to relax from its initial value at the end of the stimulus. In this case, Jtotal would be described by Jtotal* = (Jpm + Juni) + Vmax,Na/Ca (dotted curve), which crosses the zero-net flux axis at the limiting plateau level (Fig. 7 I, up arrow). Here, the outward flux (Jpm + Juni) and the inward flux Vmax,Na/Ca are in balance. Of course, if cm is free to change, the limiting plateau level is never attained because the mitochondrial pool is finite and cm and JNa/Ca ultimately decline.
Therefore, the limiting plateau level depends not only on the properties of mitochondrial Ca2+ release but also on uptake (Nicholls 1985) and on plasma membrane Ca2+ transport. Increasing the release rate, either by increasing mitochondrial Ca2+ load or raising Vmax,Na/Ca, would shift the plateau level to higher ci, while increasing either Juni or Jpm would shift it to lower values (Fig. 7 I). This illustrates how the effect of mitochondrial Ca2+ transport on intracellular Ca2+ dynamics depends not only on properties of the Ca2+ uptake and release pathways but also on the cellular context in which they operate.
Graded Inhibition of JNa/Ca: Comparison with the Actions of CGP
It has been proposed that the [Ca2+]i plateau is caused by mitochondrial Ca2+ release via the Na+/Ca2+ exchanger (Thayer and Miller 1990). However, it was shown above that according to the model, the limiting ci plateau level is influenced by both mitochondrial and nonmitochondrial Ca2+ transport. To examine how the Na+/Ca2+ exchanger influences ci recovery kinetics, simulations were carried out after reducing Vmax,Na/Ca stepwise (Fig. 8). This yielded a family of ci responses whose recoveries show a similar initial rapid phase but progressively lower and longer plateaus. When Vmax,Na/Ca is large (e.g., 35 nM/s), cm declines at a rapid, nearly constant rate during the plateau phase, causing ci to hang up at an elevated level just below 300 nM until cm falls and saturation of the release pathway is relieved. When Vmax,Na/Ca is small (e.g., 3.5 nM/s), cm declines at a much slower rate, leading to a lower and more prolonged plateau that appears as a slow ci tail like that seen during recoveries in the presence of CGP at nearly saturating concentrations (see preceding study, Figure 4 A). In each case, it is as if during the plateau phase Ca2+ was injected into the cytoplasm at a nearly constant rate, causing ci to be elevated to an extent that varies directly with the rate of injection. However, since the exchanger is not completely saturated and the mitochondrial pool is exhaustible, ci is not a constant during the plateau phase but instead declines. The response onset is less sensitive to changes in Vmax,Na/Ca than the recovery because JNa/Ca constitutes a smaller fraction of the total net Ca2+ flux when ci is high. The simulated responses can be compared with responses elicited during treatment with CGP at subsaturating concentrations (see Figure 4 B of accompanying study).
Effect of Graded Changes in Vmax,uni: Comparison with the Effects of FCCP
It was shown above that disabling mitochondrial Ca2+ accumulation only slightly modifies responses to weak stimuli, in agreement with the observed effects of FCCP (see Fig. 6). In that simulation, Ca2+ accumulation was inhibited by setting kmax,uni to zero. Fig. 9 illustrates how graded changes in kmax,uni influence responses to strong stimuli. When uptake is completely inhibited (kmax,uni = 0) ci responses resemble those seen in the presence of FCCP. As kmax,uni is increased, mitochondrial Ca2+ accumulation proceeds at progressively higher rates so that cm rises more rapidly and reaches higher levels by the end of the stimulus. This is accompanied by a slower and smaller rise in ci during the stimulus, and a modified recovery marked by a faster phase i and a slower phase ii with lower plateau level. When kmax,uni = 80 s−1, ci responses resemble [Ca2+]i responses elicited by depolarization in the absence of FCCP.
Figure 9.

Sensitivity of stimulus-evoked changes in ci and cm to the strength of the Ca2+ uptake pathway. Family of responses simulated with increasing values of kmax,uni to illustrate how the rate of Ca2+ uptake via the uniporter influences ci and cm dynamics. kmax,uni was increased from zero to 0.5, 1, 2, 4, and 8 s−1 and thereafter in increments of 8 s−1 up to 80 s−1. Raising kmax,uni increases the rate of Ca2+ accumulation during stimulation so that cm rises more rapidly and ci rises more slowly to approach a lower steady level. After the stimulus ends, the initial rapid decline in ci becomes faster, the plateau is lower and the overall recovery is prolonged. See text for explanation.
The effects of increasing kmax,uni can be explained as follows. The plateau level is lowered because the maximal rate of net mitochondrial Ca2+ release during the recovery is reduced owing to stronger Ca2+ uptake at each value of ci; the lower rate of net Ca2+ release also causes the recoveries to be more prolonged. Net mitochondrial Ca2+ release is slower in spite of increased mitochondrial Ca2+ loads, which by themselves would tend to increase JNa/Ca. This is because the release pathway is nearly saturated, and the rate of release is low compared with uptake over this range of concentrations.
Effect of Graded Changes in Ca2+ Extrusion Rate: Relationship between the Plateau Level and the Mitochondrial Ca2+ Set Point
The mitochondrial set point concept provides an elegant explanation of the ability of isolated mitochondria to maintain the extramitochondrial Ca concentration at a fixed value when the intramitochondrial Ca2+ concentration is high. As described previously, the basis of the set point lies in the relationship between mitochondrial Ca2+ uptake and release pathways: if intramitochondrial Ca2+ concentration is high enough that the rate of release is constant, then uptake by the uniporter will maintain the extramitochondrial steady state Ca2+ concentration at a fixed level (Nicholls and Akerman 1982; Crompton 1985; Hansford 1985). While this applies to isolated mitochondria in a closed system, it does not adequately describe mitochondrial Ca2+ transport in intact cells. It was shown above that the limiting plateau level, when the mitochondrial Ca2+ load is large, depends not only on mitochondrial Ca2+ transport but also on the rate of Ca2+ extrusion. Simulations shown in Fig. 10 illustrate how the plateau level is influenced by the rate of Ca2+ extrusion under conditions where the Na+/Ca2+ is not completely saturated. As Vmax,extru is lowered, ci declines more slowly, which increases the activity of the uniporter and thereby lowers the rate of net mitochondrial Ca2+ release. These two factors elevate and prolong the plateau. In the limiting case where Vmax,extru is zero and the plasma membrane is impermeable to Ca2+, the model describes the properties of Ca2+ transport by isolated mitochondria in a closed system; in this case, ci ultimately stabilizes at the set point.
Figure 10.

Role of Ca2+ extrusion during the plateau phase of the recovery. Family of responses elicited by a fixed stimulus with progressively lower rates of plasma membrane Ca2+ extrusion. As Vmax,extru is lowered, ci and cm both recover more slowly, indicating that the recovery is ultimately dependent on Ca2+ extrusion. As Vmax,extru approaches zero, the model cell approximates a closed system like classical preparations of isolated mitochondria in which Ca2+ transport only occurs between mitochondria and the extramitochondrial solution. In this limiting case, when the mitochondrial Ca2+ load is large enough to saturate the release pathway, extramitochondrial Ca2+ is maintained at a set point that depends on properties of the Ca2+ uptake and release pathways. For each simulation, Vmax,extru was initially set to 28.3 nM/s and was changed when the stimulus began. In the case Vmax,extru = 0, kleak was set to zero at the end of the stimulus to render the plasma membrane impermeable to Ca2+.
Simulated Responses to Brief and Long Periodic Stimulus Trains
It was shown previously that after brief trains of stimulated action potentials that elevate [Ca2+]i to ∼300 nM, [Ca2+]i recovers with a kinetically simple time course, while after longer trains that raise [Ca2+]i to levels approaching ∼500 nM, the recovery is kinetically complex, much like the recovery that follows a strong, steady depolarization (Friel and Tsien 1994). Fig. 11 (left) compares simulated responses to repetitive stimulus trains of short and long duration. Since the interval between stimuli is too short to permit complete recovery, ci undergoes temporal summation (see initial portion of the response to the longer stimulus train on an expanded time scale, right). As ci rises, the rate of mitochondrial Ca2+ accumulation also rises (right, bottom). The properties of the recovery depend on the initial value of ci and cm, which in turn depend on stimulus duration. These simulations reproduce the differential effects of brief and long trains of evoked action potentials on [Ca2+]i in these cells (Friel and Tsien 1994).
Figure 11.

Responses to brief and long periodic stimulus trains. Comparison between the effects of brief and long periodic stimuli on ci and cm. When stimulus frequency is high enough so that recovery between individual stimuli is incomplete, temporal summation of ci occurs. With a brief stimulus train, ci does not rise high enough to produce appreciable mitochondrial Ca2+ accumulation so that the ci recovery is largely unaffected by mitochondrial Ca2+ release. With a longer stimulus train that raises ci to a level that causes significant mitochondrial Ca2+ accumulation, the rise in ci is depressed and the recovery that follows the end of stimulation is marked by a prolonged multiphase recovery.
DISCUSSION
Summary of Main Findings
Mitochondrial Ca2+ uptake and release pathways have been characterized in isolated mitochondria, but to our knowledge, the activity and [Ca2+] dependence of these transporters has not been described in intact cells. Such information is important because transport by isolated mitochondria may differ from that in situ, and because mitochondrial Ca2+ transport occurs within a system of transporters that must be taken into consideration.
This study extends to intact cells several general conclusions that have been drawn from studies of isolated mitochondria (Nicholls and Akerman 1982; Hansford 1985; Crompton 1985, Crompton 1999). First, mitochondria are expected to accumulate Ca2+ even in response to weak stimuli that elevate [Ca2+]i only slightly above resting levels. Second, there are two qualitatively different stimulus regimes. Weak stimuli raise [Ca2+]i to a level where the rate of Ca2+ uptake is lower than the maximal rate of release via the Na+/Ca2+ exchanger. Such stimuli would be expected to raise [Ca2+]i and [Ca2+]m to new steady state levels where the net Ca2+ flux across the plasma membrane and the net mitochondrial Ca2+ flux are both zero. Since the steady state value of [Ca2+]i should not be influenced by mitochondrial Ca2+ transport, inhibitors of mitochondrial Ca2+ uptake (e.g., FCCP) should not affect this level; such inhibitors would, however, speed onset and recovery kinetics. This explains, at least in part, the paradoxical observation that although weak depolarizations increase total mitochondrial Ca concentration (Pivovarova et al. 1999) the steady [Ca2+]i elevations they cause are not very sensitive to FCCP or CCCP (Friel and Tsien 1994; Herrington et al. 1996). Strong stimuli, in contrast, raise [Ca2+]i to levels where mitochondrial Ca2+ uptake exceeds the maximal rate of release so that a steady state is impossible. In this case, an apparent steady state can be reached where mitochondrial Ca2+ accumulation balances net Ca2+ entry across the plasma membrane. In this state, [Ca2+]i is steadily elevated and mitochondria accumulate Ca2+ continuously, as seen during maintained depolarization (Pivovarova et al. 1999). Under these conditions of stimulation, inhibitors of mitochondrial Ca2+ uptake (e.g., FCCP) would shift the [Ca2+]i level where Jtotal is zero to a higher level, accounting for the observation that strong depolarizations elicit larger [Ca2+]i elevations after treatment with protonophores (Thayer and Miller 1990). Interestingly, after blocking mitochondrial Ca2+ release, weak stimuli elicit responses like those produced by strong stimuli before block, characterized by continuous mitochondrial Ca2+ accumulation and a depressed steady [Ca2+]i rise that is sensitive to Ca2+ uptake inhibitors.
Third, the [Ca2+]i plateau level cannot be equated with the mitochondrial set point observed in studies of isolated mitochondria, since it depends jointly on mitochondrial and nonmitochondrial Ca2+ transport. Only in the limiting case where the plasma membrane is an impenetrable barrier to net Ca2+ transport can the plateau level be identified with the set point: in this case the model describes mitochondrial Ca2+ transport in a closed system like those used in studies of isolated mitochondria.
Finally, since [Ca2+]i dynamics depends on a system of Ca2+ transport pathways, there are multiple sites for potential modulation of intracellular Ca2+ signals and the processes they control. For example, the simulations indicate that properties of the [Ca2+]i recovery are jointly regulated by the mitochondrial Na+/Ca2+ exchanger, Ca2+ uniporter and plasma membrane Ca2+ transport systems; they would also be influenced by ER Ca2+ transport if it were enabled (not shown).
Simplifications Used in the Analysis
Cells were studied under conditions that simplified the analysis of Ca2+ dynamics. Thapsigargin was used to inhibit Ca2+ transport by SERCA pumps, making it possible to study the interplay between Ca2+ transport across the plasma membrane and uptake and release by mitochondria in isolation from ER Ca2+ transport. Analysis was restricted to the recovery after depolarization-induced [Ca2+]i elevations, after spatial [Ca2+]i gradients are largely dissipated, so that the free Ca concentration within each cellular compartment is approximately uniform spatially. Extension of the analysis to include the ER will require quantitative information about its Ca2+ uptake and release pathways, while treating the initial period of stimulation, when Ca2+ is distributed non-uniformly, will require detailed information about the spatial distribution of mitochondria and its dynamics.
For the model simulations, Ca2+ entry was evoked by a step increase in plasma membrane Ca2+ permeability. This leads to an instantaneous increase in the rate of Ca2+ entry across the plasma membrane to a level that depends on both Ca2+ permeability and the difference between internal and external Ca2+ concentrations (see ). During stimulation, Ca2+ permeability was assumed to be constant, so time-dependent Ca2+ channel activation and inactivation were not taken into consideration. As a result, the simulated time courses of ci and cm during a depolarizing stimulus are not expected to follow precisely the changes in [Ca2+]i and [Ca2+]m that occur in situ. Information about the rate of Ca2+ entry during the stimulus should facilitate extension of the analysis to the period of depolarization.
Properties of Mitochondrial Ca2+ Uptake and Release in Intact Neurons
The equations describing mitochondrial Ca2+ uptake and release were motivated by results from studies of isolated mitochondria, so it is logical to compare, where possible, parameters of the equations with those describing transport by the isolated organelles. For Juni, reliable estimates of kmax,uni and EC50,uni were not possible given the limited [Ca2+]i range over which our measurements were made. However, it was possible to estimate the Hill coefficient (nuni ∼2) which agrees with measurements from isolated mitochondria (Scarpa and Graziotti 1973; Gunter and Pfeiffer 1990). For JNa/Ca we obtained estimates of Vmax,Na/Ca that ranged from ∼35–75 nM/s. This can be compared with the maximal rate of Na+-dependent Ca2+ release by isolated heart and brain mitochondria (∼10 and 30 nmol/mg prot/min; Hayat and Crompton 1982; Gunter and Gunter 1994), which convert to ∼ 63–188 nmol/li cytosolic volume/s, values that are in reasonable agreement. The estimated value of [Ca2+]m at which the rate of release is half maximal (∼307 nM) is smaller than values obtained from studies of isolated mitochondria: ∼1–10 μM (Gunter and Pfeiffer 1990). With the estimated parameter values, the equations for Juni and JNa/Ca together provide estimates of total mitochondrial Ca transport rates that agree with measured values. For example, with kmax,uni = 80 s−1 and EC50,uni = 10 μM, can be evaluated at [Ca2+]i = 554 nM (the mean peak [Ca2+]i level during steady 50 mM K+ depolarization), to give Juni ∼ 134 nM/s. This converts to a total mitochondrial Ca flux of (134)(200)/0.1 = 267 μM/s; after subtracting the (maximal) rate of Ca release (35 nM/s)(200)/0.1 = 70 μM/s gives a net flux (197 μM/s) that is similar to the measured rate of mitochondrial total Ca accumulation during exposure to 50 mM K+, 184 μM/s (Pivovarova et al. 1999).
During all but the initial rapid phase of recovery, JNa/Ca depends on ΔCa2+ m iin way that is consistent with previous studies (Wingrove and Gunter 1986). However, during the initial phase, JNa/Ca increased in a way that could not be explained simply in terms of the accompanying rise in ΔCa2+ m i,suggesting that the rate of mitochondrial Ca2+ release depends on other factors as well. Since previous work shows that JNa/Ca can be inhibited by high [Ca2+]i, the rate equation for JNa/Ca was modified to include an inhibitory term, after which it described JNa/Ca during the entire recovery. However, the steep [Ca2+]i dependence of inhibition that was required seemed unrealistic (Hill coefficient ∼6). This suggests that yet other variables may contribute to the depression of JNa/Ca under these conditions, for example, intramitochondrial Na concentration (Pivovarova et al. 1999). Therefore, the inhibitory factor should be regarded as an empirical description of the deviation of JNa/Ca from the simple rate equation. In any case, since simulated ci and cm dynamics were not modified appreciably by this factor, the depression of JNa/Ca during phase i of the recovery was not considered further.
Saturation of JNa/Ca strongly influences the way ci and cm change during and after stimulation. It sets the stage for continuous mitochondrial Ca2+ accumulation when ci is high during stimulation, and it is responsible for a nearly constant rate of net Ca2+ release during phase ii of the recovery, which generates the ci plateau. Ca2+ release could also occur at constant rate even when the release pathway is not saturated if Ca phosphate (CaP) formation effectively clamps intramitochondrial free Ca2+ concentration at a constant level (Nicholls and Akerman 1982). This has been proposed to account for limited elevations in [Ca2+]m during continuous electrical stimulation in nerve terminals (David 1999). While such complexes form reversibly under the conditions of stimulation described in this study, and appear to play an important role in intramitochondrial Ca2+ buffering (Pivovarova et al. 1999), we did not see JNa/Ca fall abruptly from a ceiling during the recovery, arguing that such a mechanism is not responsible for the complex recovery kinetics described in this and the preceding study.
Mitochondrial Ca2+ Transport during Repetitive Electrical Activity
Based on the model simulations, the effect of repetitive stimulation on [Ca2+]i and [Ca2+]m would depend critically on stimulus frequency. If the interval between individual stimuli or bursts of stimuli is long enough to permit complete recovery, then [Ca2+]i and [Ca2+]m would change periodically. If the intervals are brief enough so that recovery is incomplete, both [Ca2+]i and [Ca2+]m would be expected to undergo temporal summation, ultimately oscillating about an elevated mean that increases with frequency. This could provide a mechanism by which fluctuations in [Ca2+]i are translated into more steady elevations in [Ca2+]m. Indeed, this has been argued for the heart (Crompton 1999). If a periodic stimulus causes average [Ca2+]i to exceed the level where Ca2+ uptake by the uniporter is faster than the maximal rate of release, [Ca2+]m will increase continuously, raising the possibility that there are distinct low and high frequency stimulus regimes analogous to the weak and strong regimes described above. Finally, slow net mitochondrial Ca2+ release in the aftermath of action potential-induced Ca2+ entry could provide a mechanism by which stimulus history influences responses to subsequent stimuli (Tang and Zucker 1997).
Acknowledgments
This work was supported by grants from the American Heart Association (96011490) and from the National Institutes of Health (NS 33514-03).
Equations Used to Describe the Components of the Total Ca2+ Flux
Ca2+ extrusion across the plasma membrane
Jpm was described by the sum of a linear leak flux (Jleak) and a saturable extrusion flux:
 |
1 |
|---|
where k leak describes the Ca2+ permeability of the plasma membrane, [Ca2+]o is the extracellular free Ca concentration, Vmax,extru is the maximal rate of Ca extrusion, EC50,extru is the [Ca2+]i concentration where the Ca2+ extrusion rate is half maximal, and n extru describes how steeply the extrusion rate increases with [Ca2+]i. Although the equation for the leak pathway does not explicitly include the voltage dependence of Ca2+ entry, it is consistent with the Goldman-Hodgkin-Katz flux equation if membrane potential is constant and the permeant ion is present at a much higher concentration in the extracellular solution than the intracellular solution. Note that according to this description, extrusion and leak fluxes are of opposite sign as long as [Ca2+]i < [Ca2+]o and that Jpm is zero when the magnitudes of the component fluxes are equal.
Mitochondrial Ca2+ uptake
Juni Mitochondrial Ca2+ uptake was described by:
 |
2 |
|---|
where k uni,max is the limiting slope at high [Ca2+]i, EC50,uni is the value of [Ca2+]i where activation of uptake is half-maximal and nuni is a Hill coefficient. would describe the total Ca2+ flux carried by a population of channels whose open probability increases with [Ca2+]i and which, when open, permit Ca2+ to flow unidirectionally at a rate that depends on [Ca2+]i and the magnitude of a constant electric field. This conforms with expectations from the Goldman-Hodgkin-Katz flux equation under conditions where mitochondrial membrane potential is constant, intramitochondrial Ca2+ concentration is low compared with [Ca2+]i, and the permeation pathway is far from saturation. In this case, k uni,max would depend on mitochondrial membrane potential. Since there was no indication that Juni was limited over the range [Ca2+]i < 1 μM, parameters for were estimated as follows. nuni was determined as the slope of a line fitted to a plot of log(k uni,max [Ca2+]i/Juni − 1) vs log([Ca2+]i). This provided estimates of nuni that were quite insensitive to k uni,max over the range (10 − 1000 s−1). After determining nuni, k uni,max was determined by fitting to Juni data while holding nuni constant and setting EC50,uni to 10 μM (Gunter and Pfeiffer 1990).
Mitochondrial Ca2_+_ release: JNa/Ca
The rate of Ca release via the Na+/Ca2+ exchanger was described by a saturable function of [Ca2+]m:
 |
3 |
|---|
where Vmax,Na/Ca is the maximal rate of Ca2+ release and EC50,Na/Ca is the value of [Ca2+]m at which release rate is half maximal. The Na+ concentration is not explicitly taken into consideration since changes in [Na+]i and [Na+]m induced by depolarizations up to ∼20 s are small (Pivovarova et al. 1999). Therefore, Vmax,Na/Ca is regarded as a constant that depends on both [Na+]i and [Na+]m and possibly membrane potential (Jung et al. 1995). was expressed in terms of the measured integrated net mitochondrial Ca2+ flux ΔCa2+ m i:
 |
4 |
|---|
This was done by writing [Ca2+]m in terms of ΔCa2+ m ias follows ():
 |
5 |
|---|
where [Ca2+]m(∞) is the resting value of [Ca2+]m and γ is the ratio of effective mitochondrial and cytosolic volumes. Substituting into gives ():
 |
6 |
|---|
This equation can be written as a function of ΔCa2+ m iand three parameters:
 |
7 |
|---|
where A = Vmax,Na/Ca, B = γEC50,Na/Ca, and C = [Ca2+]m(∞)/EC50,Na/Ca. was fit to data shown in 2 F during the plateau phase of the recovery to obtain estimates of Vmax,Na/Ca and the lumped parameters γEC50,Na/Ca and [Ca2+]m(∞)/EC50,Na/Ca. The steep decline in JNa/Ca at high ΔCa2+ m ican be described by multiplying by an inhibitory factor to give JNa/Ca ′:
 |
8 |
|---|
where ()
 |
9 |
|---|
where K d,inhib is the concentration for half maximal inhibition by cytosolic Ca2+ and n inhib describes the steepness of inhibition by [Ca2+]i.
Description of the Model
The experimentally determined rate laws for Jpm, Juni, and JNa/Ca provided all the flux definitions for a one-pool model of Ca2+ dynamics (Friel and Tsien 1994). Dynamics of the free Ca2+ concentration within the cytosol (ci) and the mitochondrial pool (cm) were described by the following differential equations ( and ):
 |
10 |
|---|
 |
11 |
|---|
where the concentration fluxes (nM/s, referred to cytosolic effective volume) are ( ):
 |
12 |
|---|
 |
13 |
|---|
 |
14 |
|---|
 |
15 |
|---|
 |
16 |
|---|
 |
17 |
|---|
 |
18 |
|---|
where k leak, Vmax,extru, EC50,extru, n extru, k max,uni, EC50,uni, n uni, Vmax,Na/Ca, and EC50,Na/Ca are constants described above, and co is the (constant) extracellular Ca2+ concentration. Note that describe concentration fluxes that can be interpreted as the rate of Ca2+ delivery by the individual transport systems (e.g., J̃pm) divided by the effective cytoplasmic volume (e.g., Jpm=J̃pmviκi T) where vi is the cytoplasmic volume and κi Tis the ratio of (infinitesimal) changes in total to free Ca concentration. This model does not explicitly include a description of mitochondrial membrane potential (Δψ) dynamics and applies to the case where Δψ is constant (see Magnus and Keizer 1997 for a description of the more general case).
To simulate the effects of membrane depolarization, k leak was increased by Δ_k_ leak. According to , this would instantaneously increase the rate of Ca2+ entry by Δ_k_ leak(ci − co). For example, this could describe rapid activation of non-inactivating Ca2+ channels in the case where permeation occurs at steady membrane potential and conforms with constant field theory with ci << co (Friel 1995). In this case, Δ_k_ leak would depend on membrane potential. To include inhibitory effects of cytosolic Ca2+ on JNa/Ca, was modified as follows:
 |
19 |
|---|
where δ(ci) is given by :
 |
20 |
|---|
Footnotes
Abbreviations used in this paper: ER, endoplasmic reticulum; Tg, thapsigargin.
References
- Babcock D.F., Herrington J., Goodwin P.C., Park Y.B., Hille B. Mitochondrial participation in the intracellular Ca2+ network. J. Cell Biol. 1997;136:833–844. doi: 10.1083/jcb.136.4.833. [DOI] [PMC free article] [PubMed] [Google Scholar]
- Boyce W.E., DiPrima R.C. Elementary differential equations 1969. John Wiley & Sons, Inc; New York, NY: pp. 353–357 [Google Scholar]
- Crompton M. The regulation of mitochondrial calcium transport in heart. Curr. Top. Memb. Trans. 1985;25:231–276. [Google Scholar]
- Crompton M. The mitochondrial permeability transition pore and its role in cell death. Biochem. J. 1999;341:233–249. [PMC free article] [PubMed] [Google Scholar]
- David G. Mitochondrial clearance of cytosolic Ca2+ in stimulated lizard motor nerve terminals proceeds without progressive elevation of mitochondrial matrix [Ca2+] J. Neurosci. 1999;19:7495–7506. doi: 10.1523/JNEUROSCI.19-17-07495.1999. [DOI] [PMC free article] [PubMed] [Google Scholar]
- Friel D.D. [Ca2+]i oscillations in sympathetic neuronsan experimental test of a theoretical model. J. Biophys. 1995;68:1752–1766. doi: 10.1016/S0006-3495(95)80352-8. [DOI] [PMC free article] [PubMed] [Google Scholar]
- Friel D.D., Tsien R.W. An FCCP-sensitive Ca2+ store in bullfrog sympathetic neurons and its participation in stimulus-evoked changes in [Ca2+]i . J. Neurosci. 1994;14:4007–4024. doi: 10.1523/JNEUROSCI.14-07-04007.1994. [DOI] [PMC free article] [PubMed] [Google Scholar]
- Gunter K.K., Gunter T.E. Transport of calcium by mitochondria. J. Bioenerg. Biomem. 1994;26:471–485. doi: 10.1007/BF00762732. [DOI] [PubMed] [Google Scholar]
- Gunter T.E., Pfeiffer D.R. Mechanisms by which mitochondria transport calcium. Am. J. Physiol. 1990;258:C755–C786. doi: 10.1152/ajpcell.1990.258.5.C755. [DOI] [PubMed] [Google Scholar]
- Hansford R.G. Relation between mitochondrial calcium transport and control of energy metabolism. Rev. Physiol. Pharmacol. 1985;102:1–72. doi: 10.1007/BFb0034084. [DOI] [PubMed] [Google Scholar]
- Hayat L.H., Crompton M. Evidence for the existence of regulatory sites for Ca2+ on the Na+/Ca2+ carrier of cardiac mitochondria. Biochem. J. 1982;202:509–518. doi: 10.1042/bj2020509. [DOI] [PMC free article] [PubMed] [Google Scholar]
- Herrington J., Park Y.B., Babcock D.F., Hille B. Dominant role of mitochondria in clearance of large Ca2+ loads from rat adrenal chromaffin cells. Neuron. 1996;16:219–228. doi: 10.1016/s0896-6273(00)80038-0. [DOI] [PubMed] [Google Scholar]
- Hernandez-Cruz A., Sala F., Adams P.R. Subcellular calcium transients visualized by confocal microscopy in a voltage-clamped vertebrate neuron. Science. 1990;247:858–862. doi: 10.1126/science.2154851. [DOI] [PubMed] [Google Scholar]
- Horikawa Y., Goel A., Somlyo A.P., Somlyo A.V. Mitochondrial calcium in relaxed and tetanized myocardium. Biophys. J. 1998;74:1579–1590. doi: 10.1016/S0006-3495(98)77869-5. [DOI] [PMC free article] [PubMed] [Google Scholar]
- Hua S.Y., Nohmi M., Kuba K. Characteristics of Ca2+ release induced by Ca2+ influx in cultured bullfrog sympathetic neurons. J. Physiol. 1993;464:245–272. doi: 10.1113/jphysiol.1993.sp019633. [DOI] [PMC free article] [PubMed] [Google Scholar]
- Jung D.W., Baysal K., Brierly G.P. The sodium-calcium antiport of heart mitochondria in not electroneutral. J. Biol. Chem. 1995;270:672–678. doi: 10.1074/jbc.270.2.672. [DOI] [PubMed] [Google Scholar]
- Magnus G., Keizer J. Minimal model of β-cell mitochondrial Ca2+ handling. Am. J. Physiol. 1997;273:C717–C733. doi: 10.1152/ajpcell.1997.273.2.C717. [DOI] [PubMed] [Google Scholar]
- Moravec C.S., Bond M. Effect of inotropic stimulation on mitochondrial calcium in cardiac muscle. J. Biol. Chem. 1992;267:5310–5316. [PubMed] [Google Scholar]
- Nicholls D.G. A role for the mitochondrion in the protection of cells against calcium overload. Prog. Brain Res. 1985;63:97–106. doi: 10.1016/S0079-6123(08)61978-0. [DOI] [PubMed] [Google Scholar]
- Nicholls D., Akerman K. Mitochondrial calcium transport. Biochim. Biophys. Acta. 1982;683:57–88. doi: 10.1016/0304-4173(82)90013-1. [DOI] [PubMed] [Google Scholar]
- Pivovarova N.B., Hongpaisan J., Andrews S.B., Friel D.D. Depolarization-induced mitochondrial Ca accumulation in sympathetic neuronsspatial and temporal characteristics. J. Neurosci. 1999;19:6372–6384. doi: 10.1523/JNEUROSCI.19-15-06372.1999. [DOI] [PMC free article] [PubMed] [Google Scholar]
- Rizzuto R., Pinton P., Carrington W., Fay F.S., Fogarty K.E., Lifshitz L.M., Tuft R.A., Pozzan T. Close contacts with the endoplasmic reticulum as determinants of mitochondrial Ca2+ responses. Science. 1998;280:1763–1766. doi: 10.1126/science.280.5370.1763. [DOI] [PubMed] [Google Scholar]
- Scarpa A., Graziotti P. Mechanisms for intracellular calcium regulation in heart. J. Gen. Physiol. 1973;62:756–772. doi: 10.1085/jgp.62.6.756. [DOI] [PMC free article] [PubMed] [Google Scholar]
- Tang Y., Zucker R.S. Mitochondrial involvement in post-tetantic potentiation of synaptic transmission. Neuron. 1997;18:483–491. doi: 10.1016/s0896-6273(00)81248-9. [DOI] [PubMed] [Google Scholar]
- Thayer S.A., Miller R.J. Regulation of the intracellular free calcium concentration in single rat dorsal root ganglion neurones in vitro. J. Physiol. 1990;425:85–115. doi: 10.1113/jphysiol.1990.sp018094. [DOI] [PMC free article] [PubMed] [Google Scholar]
- Wingrove D.E., Gunter T.E. Kinetics of mitochondrial calcium transport. J. Biol. Chem. 1986;261:15166–15171. [PubMed] [Google Scholar]