Single Channel Properties of Rat Acid–sensitive Ion Channel-1α, -2a, and -3 Expressed in Xenopus Oocytes (original) (raw)
Abstract
The mammalian nervous system expresses proton-gated ion channels known as acid-sensing ion channels (ASICs). Depending on their location and specialization some neurons express more than one type of ASIC where they may form homo- or heteromeric channels. Macroscopic characteristics of the ASIC currents have been described, but little is known at the single channel level. Here, we have examined the properties of unitary currents of homomeric rat ASIC1α, ASIC2a, and ASIC3 expressed in Xenopus oocytes with the patch clamp technique. We describe and characterize properties unique to each of these channels that can be used to distinguish the various types of ASIC channels expressed in mammalian neurons. The amplitudes of the unitary currents in symmetrical Na+ are similar for the three types of channels (23–18 pS) and are not voltage dependent. However, ASIC1α exhibits three subconductance states, ASIC2a exhibits only one, and ASIC3 none. The kinetics of the three types of channels are different: ASIC1α and ASIC2a shift between modes of activity, each mode has different open probability and kinetics. In contrast, the kinetics of ASIC3 are uniform throughout the burst of activity. ASIC1α, ASIC2a, and ASIC3 are activated by external protons with apparent pH50 of 5.9, 5.0, and 5.4, respectively. Desensitization in the continual presence of protons is fast and complete in ASIC1α and ASIC3 (2.0 and 4.5 s−1, respectively) but slow and only partial in ASIC2a (0.045 s−1). The response to external Ca2+ also differs: μM concentrations of extracellular Ca2+ are necessary for proton gating of ASIC3 (EC50 = 0.28 μM), whereas ASIC1α and ASIC2a do not require Ca2+. In addition, Ca2+ inhibits ASIC1α (KD = 9.2 ± 2 mM) by several mechanisms: decrease in the amplitude of unitary currents, shortening of the burst of activity, and decrease in the number of activated channels. Contrary to previous reports, our results indicate that the Ca2+ permeability of ASIC1α is very small.
Keywords: ASIC, calcium, pH, protons, kinetics
INTRODUCTION
Six different acid-sensing ion channel (ASIC)* cDNAs have been cloned from the rat nervous system: ASIC1α (García-Añoveros et al., 1997; Waldmann et al., 1997a), ASIC1β (Chen et al., 1998), ASIC2a (García-Añoveros et al., 1997; Price et al., 1996), ASIC2b (Lingueglia et al., 1997), ASIC3 (Waldmann et al., 1997b), and ASIC4 (Akopian et al., 2000). ASIC1α and ASIC1β are two spliced variants of the same gene (Chen et al., 1998; Bässler et al., 2001) that differ in the first 172 amino acids. ASIC1β is expressed exclusively in neurons from dorsal root ganglia (DRG), whereas ASIC1α is expressed in both peripheral and central nervous systems. DRG neurons express all the ASICs so far identified. However, the distribution of the proteins varies in populations of small, medium, and large diameter cells (Waldmann and Lazdunski, 1998; García-Añoveros et al., 2001; Price et al., 2001; Alvarez de la Rosa et al., 2002).
ASIC1, -2, and -3 are gated by external protons whereas ASIC4 is not (Gründer et al., 2000). Gating by protons and expression in DRG have prompted the proposal that ASIC1 and ASIC3 may be involved in acid sensing (Waldmann and Lazdunski, 1998; Sutherland et al., 2001) and that they may constitute a class of nociceptors distinct from the vallinoid receptor (Caterina et al., 1997). The role of the ASICs in the central nervous system has not been satisfactorily explained, although recently it was shown that mice with inactivation of the ASIC1 gene had a mild deficit in spatial memory and impaired eyeblink conditioning (Wemmie et al., 2002). So far, a search for other potential agonists of the ASICs has revealed that the neuropeptide FMRFamide slows slightly the inactivation rate of ASIC1α (KD 33 μM) (Askwith et al., 2000). Divalent cations such as Zn2+ were found to shift the pH dependence of heteromeric ASIC1α/ASIC2a channels, but not of homomeric ASIC1α (Baron et al., 2001).
The purpose of this work is to characterize the unitary currents from homomeric ASICs and to identify properties that might be used to distinguish these channels in neurons from the peripheral and central nervous systems. This is an important issue because the main criterion for assigning a specific function to the ASICs has been localization in a particular subset of DRG neurons (nociceptor and/or mechanoreceptor). However, sensory neurons express more than one type of ASIC and the different ASICs can associate to form various types of heteromeric channels. At least in vitro, it has been shown that ASIC1 with ASIC2 (Waldmann and Lazdunski, 1998) and ASIC2 with ASIC3 (Babinski et al., 2000; Zhang and Canessa, 2001) form functional heteromeric channels. Moreover, most combinations of ASICs, independent of their putative function, mechanoreceptor versus nociceptor, are activated by low pHo. Together, these findings further indicate that measurements of whole-cell currents are insufficient to unequivocally distinguish the ASICs that generate proton-gated currents in neurons. To complicate the issue even more, species-specific differences have been found in the properties of the ASICs between rat, mouse, and human (Babinski et al., 2000; Benson et al., 2002).
Here we have used Xenopus oocytes injected with cRNAs from rat ASIC1α, ASIC2a, or ASIC3 to examine the properties of the unitary and macroscopic currents from these three homomeric channels using the patch clamp technique in the outside-out configuration and whole-cell currents with the two-electrode voltage clamp.
MATERIALS AND METHODS
Isolation and Injection of Xenopus Oocytes
Channels were expressed in stage V and VI Xenopus laevis oocytes injected with 2 ng of rat ASIC1α, ASIC2a, or ASIC3 cRNA. cRNAs were synthesized with T7 RNA polymerase from linearized plasmids containing the full-length cDNAs. Oocytes were incubated at 19°C for 2–3 d before experiments. Before patching, oocytes were placed in a hypertonic solution for several minutes and the vitelline membrane was removed manually with fine forceps.
Single-channel Recordings
Unitary currents were recorded using the outside-out configuration of the patch-clamp technique. Channels were activated by rapidly moving squared-glass tubes (ID 0.7 mm) delivering solutions of desired pHos in front of the tip of the patch pipette. The delivery device achieves complete solution changes within 20 ms (SF-77B, Perfusion Fast-Step; Warner Instrument Corp.). Pipettes were pulled from borosilicate glass (LG16; Dagan Corporation) using a micropipette puller (PP-83, Narishige; Scientific Instrument Lab) and fire polished to a final tip diameter of 1 μm. When pipettes were filled with solutions they had resistances of 5–10 MΩ. Single-channel currents were recorded with an Axopatch-200B amplifier (Axon Instruments, Inc.) using a DigiData 1200 series interface and pClamp 8.0 software both from Axon Instruments, Inc. The data were collected at 10 kHz, filtered at 1 kHz, and stored on a computer for analysis. For display, data were filtered with a digital Gaussian filter to 0.5 kHz.
All experiments were performed at room temperature. The composition of the solutions is given in mM. Incubation solution for oocytes: 96 NaCl, 2 KCl, 1 MgCl2, 5 HEPES, adjusted to pH 7.4. Hyperosmolar solution to remove vitelline membrane: 220N-methyl-D-glucamine, 220 aspartic acid, 2 MgCl2, 10 EGTA, 10 HEPES, adjusted to pH 7.4 with KOH. Solution in the recording chamber: 150 NaCl, 1 CaCl2, 10 MES-TRIS, adjusted to pH 7.4. For activation of ASICs, outside-out patches were perfused with solutions of composition identical to the extracellular bath but buffered to a lower pH, either 6.0, 5.0, or 4.0 or as indicated in the experiment. To examine the effects of Ca2+, it was added only to the perfusion solutions to the desired concentrations. Pipette solution: 150 NaCl, 5 EDTA, HEPES, adjusted to pH 7.4 with KOH.
Whole-cell Recordings
For two-microelectrode recordings (TEVC), current and voltage electrodes were pulled from borosilicate glass and filled with 3 M KCl. The resistance was kept in the range of 0.5 to 1 MΩ. Currents were recorded with an Oocyte Clamp OC-725B (Warner Instrument Corp.), digitized at sampling rate of 100 Hz (ITC-16; HEKA) and the data stored in a computer. The oocyte chamber (volume 400 μl) was continuously perfused at a rate of 1–2 ml/min. Composition of the standard bath solution (mM): 150 NaCl, 1 KCl, 1 CaCl2, 10 HEPES/MES adjusted to pH 7.4 or to 6.0, 5.0, or 4.0. To examine the apparent Ca2+ inhibition constant or EC50 for activation, the external solution contained variable CaCl2 (0, 0.1, 0.3, 1, 5, 20, 40, and 75). Each of the Ca2+ solutions was buffered at pH 7.4 and 5.0.
Data Analysis
Only patches containing a single channel were included in the analyses of the amplitude of subconductance states and of the modes of activity. All points amplitude histograms were binned into equally spaced bins and fitted with the sum of several Gaussian components using the maximal likelihood method of least-squares minimization. Lists of the duration of single-channel events were generated using the half-amplitude threshold criterion. Histograms of the distribution of open and closed dwell times were plotted as the logarithm of the dwell-time duration, and fitted with the sum of two exponential components.
Rates of desensitization were calculated by fitting the sum of unitary currents obtained from at least 12–14 independent patches to Eq. 1:
 |
(1) |
|---|
where A represents the offset of the currents (pA), B the peak (pA) current and λ the rate constant (s−1).
Normalized peak whole-cell currents elicited by changes in pHo from 7.4 to 5.0 were used to calculate the apparent Ca2+ EC50 according to Eq. 2:
 |
(2) |
|---|
where D is the concentration of Ca2+ and KD is the half-maximal inhibition constant. The apparent pH50 was calculated from peak currents elicited by rapid changes in pHo. Values were normalized to the maximal current obtained at pHo 4.0 and the data were fitted to Eq. 2.
Apparent inhibition constant of Ca2+ was calculated with the following equation:

The results are presented as mean ± SD of n independent experiments. For each experiment the n is given in the figure legend.
Online Supplemental Material
Additional representative examples of outside-out patches expressing ASIC1α, ASIC2a, or ASIC3 are presented in this section to illustrate the presence and characteristics of subconductance states and Modes of activity of the ASICs. ASIC1α#1,2,3 and ASIC1α#4,5,6,7; ASIC2a#1,2,3,4,5 and ASIC2a#6,7,8,9,10; and ASIC3#1,2,3,4,5,6 show examples of outside-out patches from oocytes examined in 150 mM symmetrical Na+ and −60 mV membrane potential. Channels were activated by lowering the pHo as indicated by the bar above the traces. Modes of activity are indicated by bars under the traces and sublevels are indicated by arrows. Online supplemental figures are available at http://www.jgp.org/cgi/content/full/jgp.20028574/DC1.
RESULTS
Unitary Currents from Homomeric ASIC Channels
Unitary currents from homomeric ASIC-1α, -2a, and -3 channels were examined in outside-out patches from plasma membranes of oocytes injected with cRNAs from each of the three ASICs. Rapid perfusion of the tip of the patch-pipette with solutions of pHo 5.0 activated the channels, whereas no effect was detected in patches from noninjected oocytes. Fig. 1 A illustrates examples of each of the three types of ASIC channels examined. All the recordings were performed under identical conditions: activation by a change in external pHo from 7.4 to 5.0, 150 mM symmetrical Na+, 1 mM external Ca2+ and pipette voltage of −60 mV. The three different types of channels open upon exposure to low pHo but the channel kinetics during the burst of activity and the desensitization rates are different for each type of ASIC. Note that ASIC2a does not show any desensitization over a period of 5 s.
Figure 1.
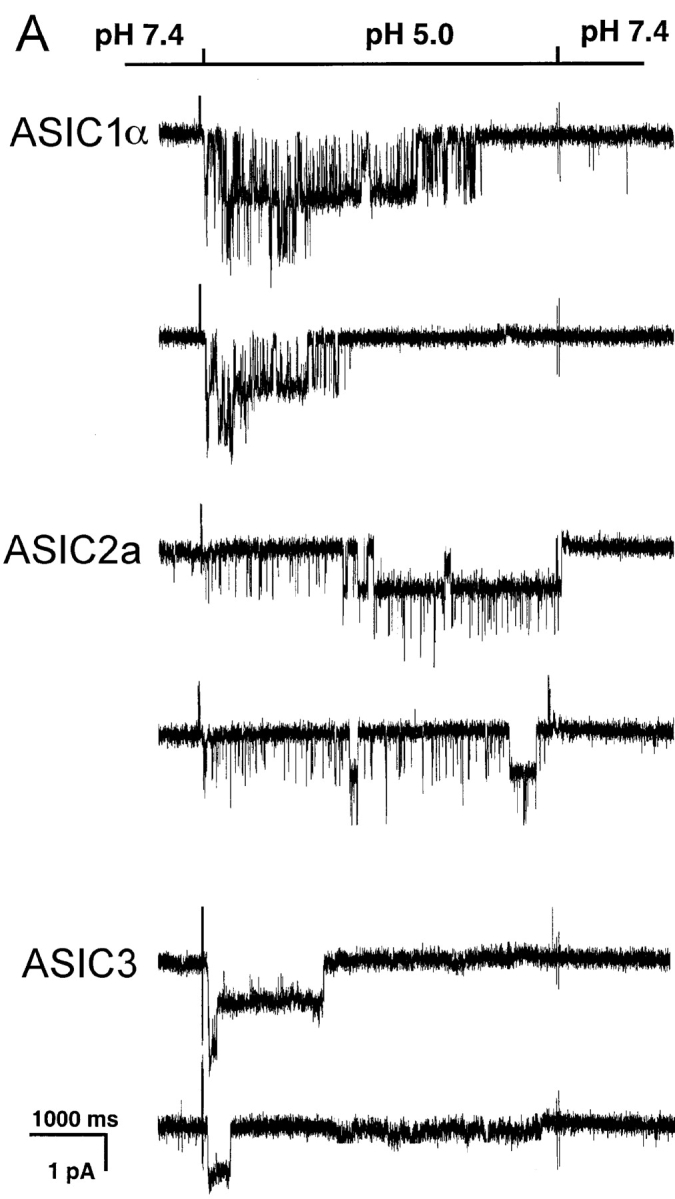
(A**)** Representative examples of homomeric ASIC1α, ASIC2a, and ASIC3 channels recorded from outside-out patches of injected oocytes. Activation of channels was achieved by rapid changes of the solution bating the tip of the patch pipette from pHo 7.4 to 5.0 according to the protocol shown on the bar above the channel traces. The spikes in the records are noise introduced by the change in solution. The three types of channels open rapidly upon lowering the pHo to 5.0. ASIC1α and ASIC3 channels close in the continual presence of external protons, whereas ASIC2a remain open during the 5-s period of application of pHo 5.0. Recordings were performed with symmetrical 150 mM Na+, 1 mM Ca2+ in the outside solution and 0 mM Ca2+ plus 1 mM EDTA in the pipette. Membrane voltage was −60 mV in the pipette. The scale bars indicate the time and current amplitude for all the records shown. (B) Whole-cell currents from oocytes injected with ASIC1α, ASIC2a, or ASIC3 were recorded with the TEVC in the presence of 150 mM Na+ and 1 mM Ca2+ and at a membrane potential of −60 mV. Currents were activated by rapid changes in pHo from 7.4 to 5.0 as indicated by the bar above the traces. Desensitization in the continual presence of protons is faster for ASIC3>ASIC1α>>>ASIC2a. The scale bars indicate the time and current amplitude; notice that for ASIC2a the time scale is 10-fold larger.
Fig. 1 B shows whole-cell currents of oocytes expressing ASIC-1α, -2a, or -3 recorded with TEVC. Experiments were performed under the same conditions as the ones used in the outside-out patch recordings. These traces are shown to compare with previously published whole-cell currents and to demonstrate that the single channel properties of each type of channel generate the characteristic shape of the corresponding whole-cell currents.
The amplitudes of the unitary currents of the three types of ASIC channels shown in Fig. 1 A are similar. To determine the conductance of these channels we generated I-V curves from unitary currents in the presence of symmetrical 150 mm Na+. The I-V curves from the three channels are linear and almost overlapping (Fig. 2) . Cord conductances calculated from −100 mV to −20 mV are 23, 22.5, and 18.5 pS for ASIC1α, ASIC2a, and ASIC3, respectively.
Figure 2.

Current-voltage relationships of unitary currents from ASIC1α, ASIC2a, and ASIC3 channels recorded in symmetrical 150 mM Na+ and 1 mM Ca2+ only in the outside solution. Channels were activated by solutions of pHo 5.0. All three channels exhibit linear I-V curves at negative voltages and the amplitudes of the unitary currents are similar for the three channels although, slightly smaller for ASIC3.
ASICs Exhibit Subconductance States
Close inspection of records of unitary currents from the ASICs revealed the presence of subconductance states in ASIC1α and ASIC2a but not in ASIC3. To increase the amplitude of the unitary currents and facilitate identification of subconductances, we examined ASIC1α channels in the presence of 150 mM external Na+ and 150 mM K+ in the pipette, pNa+/pK+ = 13 (Waldmann et al., 1997a). Four distinct current levels were identified in ASIC1α. The largest current level corresponds to the fully open channel and the sublevels correspond to three different subconductance states (S1, S2, and S3), indicated by the dashed lines on the traces of Fig. 3. Fig. 3 A shows two examples of ASIC1α channels activated by pHo 5.0 (top trace) and 6.0 (bottom trace). There are many partial openings throughout the records. They can be seen better in the higher time resolution displays from the regions indicated by the bars. Most of the subconductances are short-lived, lasting a few milliseconds, but occasionally they last tens of milliseconds, facilitating their identification and measurement of amplitudes. The amplitudes of sublevels were calculated by all-points histograms show at the bottom of Fig. 3 A. The data were fitted to four Gaussian components. The average amplitudes were −2 pA for the fully open channel, and for the sublevels S1 and S2 the amplitudes were −0.6 and −1.1, respectively (measured at −60 mV in the pipette). The amplitude of sublevel S3, 1.7 pA, was calculated from traces similar to the one shown in Fig. 3 B, right. All channels do not open first to the fully open state, but instead to one of the sublevels. Fig. 3 B shows two examples of channels opening first to S1. Sublevels also occur at the end of the burst of activity when channels are closing. Fig. 3 C shows examples of desensitization proceeding through several sublevels before the closed state is reached.
Figure 3.


Subconductances of ASIC1α. (A) Unitary currents from ASIC1α activated by pHo 6.0 and 5.0 from outside-out patches. For each example, low (500 ms) and high (50 ms) time resolution displays are shown. The dotted lines indicate current levels: a full open state (O) and three subconductance states S1, S2, and S3.. (B) Channels opening first to sublevel S1 and then to the fully open state. The example on the right shows also a transition to S3 with amplitude of 1.8 pA. (C) Examples of channel desensitization proceeding through several subconductances before the closed state is reached. (D) All points histogram of the amplitude of sublevels (in pA): S1 = 0.55, S2 = 1.0, and O = 2.0. The line represents the fit with four Gaussian components Currents were recorded with 150 mM Na+ and 0 mM Ca2+ in the outside solution and 150 mM K+ in the pipette. Pipette voltage was −60 mV. Bars indicate time and amplitude scales. For display data were filtered at 0.5 kHz.
Sublevels were also detected in ASIC2a, but they were rarely seen. Only one sublevel of 0.4 pA was consistently detected in ASIC2a traces obtained at pHo 5.0 or 4.0.
Activation and Desensitization of the ASICs by External Protons
All three ASICs are activated by external protons, but the EC50 varies according to the composition of the channel. Fig. 4 shows the responses of ASIC1α, -2a, and -3 to increasing concentrations of external protons measured with TEVC. The protocol shown for ASIC1α consists of exposure to a low pHo test solution followed by return to pHo 7.4 for 25 s after each test solution to allow complete recovery of the channels from desensitization. The apparent pH50 was calculated by measuring peak currents obtained at each pHo and fitting the normalized data to the value obtained at pHo 4.0 with Eq. 1 (insets in Fig. 4). The calculated pH50 for ASIC1α was 5.9 ± 0.3. In the lower trace from Fig. 4 A, the oocyte was exposed sequentially to pHo 6.0 and 5.0. Under this condition, ASIC1α fails to activate, indicating that the channels are refractory to activation by protons.
Figure 4.
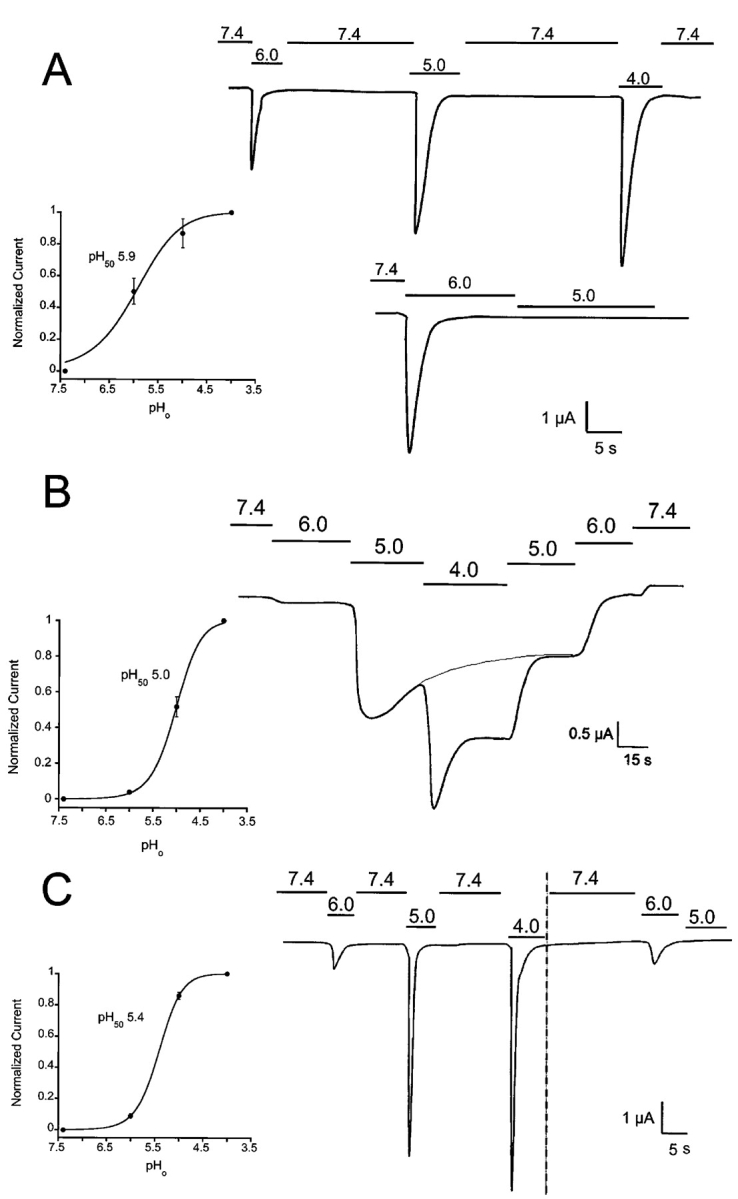
Activation and desensitization of ASIC whole-cell currents by external protons. Currents from oocytes injected with ASIC1α, ASIC2, or ASIC3 were examined with the TEVC in the presence of 150 mM Na+, 1 mM Ca2+ at −60 mV of membrane potential. In the upper trace from A an oocyte expressing ASIC1α was activated by sequential exposure to solutions of pHo 6.0, 5.0, and 4.0. Between each test solution, the bath was returned to 7.4 for 25 s. Peak currents were normalized to the value obtained at pHo 4.0 and the data were fitted with the equation I = Imax/1 + pH50/[pHo], and apparent pH50 of 5.85 ± 0.25. The lower trace shows activation of currents with pHo 6.0 but no effect if the pHo is changed directly to pHo 5.0. (B) Activation of ASIC2a channels by sequential exposure to progressively lower pHos without returning to pHo 7.4. The desensitization rate is pHo dependent being faster at pHo 4.0 than 5.0. The dotted line indicates desensitization at pHo 5. Peak currents obtained at each pHo were used to calculate the apparent pH50, 5.0 ± 0.12. (C) Oocyte expressing ASIC3 was exposed to a protocol similar to the one in A. Indicated in the second part of the experiment, after the vertical dotted line, changes in pHo from 6.0 to 5.0 failed to activate channels. The value of the apparent pH50 was 5.4 ± 0.2. Scales of time and current amplitude are indicated by the bars in each panel. The pH50 ± SD for each type of channel was calculated from five to eight oocytes.
Fig. 4 B shows an example of whole-cell currents from an oocyte expressing ASIC2a. Channels were activated according to the protocol shown above the current trace. In contrast to ASIC1α channels, ASIC2a are less sensitive to the preconditioning pHo since substantial activation of channels occurs when the pHo is changed from 5.0 to 4.0. The example also shows that the desensitization rate of ASIC2a is slow and pHo dependent, being faster at pHo 4.0 than at 5.0. In addition, desensitization is incomplete, leaving a substantial level of sustained current in the continual exposure to protons. When the bath solution is changed stepwise from pHo 4.0 to 7.4, the level of current returns to the predicted value after desensitization has taken place as indicated by the exponential, gray line indicated in Fig. 4 B.
Peak currents of ASIC2a at each pHo were normalized to the value obtained at pHo 4.0 to calculate the apparent pH50, 5.0 ± 0.12, mean ± SD of five independent oocytes.
Fig. 4 C shows whole-cell current traces from an oocyte expressing ASIC3. These channels inactivate rapidly and completely in the continual exposure to protons, and they are sensitive to the preconditioning pHo as indicated by the second part of the experiments, after the dotted line. The calculated apparent pH50 value for ASIC3 was 5.4 ± 0.13, mean ± SD of six independent oocytes.
The rates of desensitization of the three types of ASIC channels were calculated by adding the unitary currents of 12–14 patches and fitting the resulting curves to a single exponential. The solid lines on the curves in Fig. 5 represent the fit of the data with calculated values for the desensitization rates of 2.0, 0.045, and 4.5 s−1 for ASIC1α, ASIC2a, and ASIC3, respectively. For each type of channel we show three of the patches included in the calculations. Notice the different time scale for ASIC2a, 1,000 ms versus 200 ms. In the three examples, ASIC2a channels remain open for the 5-s period shown in Fig. 5, whereas ASIC1α and ASIC3 channels desensitize much faster. These desensitization rates were obtained at pHo 5.0; lower pHo results in faster desensitization.
Figure 5.

Desensitization rates of ASIC1α (A), ASIC2a (B), and ASIC3 (C). (A) Unitary currents from ASIC1α, ASIC2a, or ASIC3 channels activated by pHo 5.0 were added and the resulting currents were fitted with a single exponential, Eq. 1, with calculated desensitization rates of 2 s−1, 0.045 s−1 and 4.5 s−1, respectively. On the right side of the figure there are shown 3 out of 12–14 patches used to generate the desensitization curves. Time and amplitude are indicated by the scale bars.
Nonstationary Kinetics of ASIC1α and ASIC2a
Records from ASIC1α and ASIC2a exhibit sudden changes in kinetics throughout the period of activity induced by low pHo. These marked changes in kinetics were observed with all the tested pHos (6.0, 5.0, and 4.0).
Two kinetic modes were readily identified in ASIC1α based on Po, frequency, and duration of closures and the presence of subconductance states. Fig. 6 A shows traces from three independent single channels activated by pHo 5.0 that illustrate the modes of activity. In the top and bottom examples, immediately after lowering the pHo, channels open to a high Po mode rarely interrupted by complete closures (Mode 1). Closures in Mode 1 are partial, they correspond mainly to level S3, and less frequently to S1 and S2. The average Po of Mode 1 is high, 0.92 ± 0.07. In these two examples the channels suddenly changed kinetics to a second mode (Mode 2) that has a flickering appearance due to the presence of frequent and short closures. The frequent closures give to Mode 2 a lower Po, 0.47 ± 0.08, than Mode 1. Subconductance states are also seen in Mode 2, primarily S1 and S2, that are prominent at the end of the burst of activity as indicated in the examples. The middle trace shows a channel that opens and remains in Mode 2 during the whole period of activity.
Figure 6.


(A) Representative examples of kinetic modes of ASIC1α unitary currents. The bars under the traces indicate the modes of activity: Mode 1 and Mode 2. Upon exposure to pHo 5.0 channels first open to a high Po mode with few brief closures (Mode 1). Activity suddenly changes to Mode 2, which has lower Po and frequent closures, giving a flickering appearance to the records. Many subconductances are detected in Mode 2 in particular, before entering the desensitized state. (B) ASIC2a exhibits two modes of activity that can be distinguished by their different Po. Mode 1 is characterized by high Po (0.74) and long open events, whereas Mode 2 has a much lower Po (0.073), openings are very brief and closures are long. Bars indicate time and amplitude scales. (C) Dwell-time histograms of open and closed events from each of the two modes of activity of ASIC1α. Records of single channel patches were visually inspected to select segments with typical modal behavior that serve for the generation of histograms. Lines represent the fit of the data to two exponentials. The mean time constant (ms) and relative area (parentheses) are: Mode 1, τo 1.0 (0.29) and 52.5 (0.71), τc 0.8 (0.9) and 10.6 (0.1); Mode 2, τo 3.0 (0.72) and 17.2 (0.28), τc 1.4 (0.78), and 10.6 (0.22). (D) Dwell-time histograms of open and closed events from each of the two modes of activity of ASIC2a. The mean time constant (ms) and relative area (parentheses) are: Mode 1, τo 58.07 (0.517) and 3.86 ms (0.483), and τc 17.95 ms (0.25) and 0.99 ms (0.75). Mode 2, τo 6.32 ms (0.124) and 1.45 ms (0.876), and τc 159 ms (0.432) and 1.2 ms (56.8).
Histograms of open and shut events were constructed from segments of single channel records displaying the mentioned characteristics of the two modes (open bars underneath traces). Mode 1 exhibits two open states with mean duration of 1.1 and 52.8 ms and relative frequencies of 0.3 and 0.7, respectively. Mode 1 has also two populations of shut events, a short one of 0.85 ms that is the most frequent (0.9) and a longer and less frequent closure of 10 ms (0.1). Mean duration and frequency of open states (τo) from Mode 2 are 3.0 (0.72) and 17.2 (0.28), and of shut states (τc) are 1.4 (0.78) and 10.6 (0.22). Mode 2 exhibits many subconductance states that are particularly prominent at the end of the burst of activity as indicated by the traces in Fig. 6 A.
Although not all activity from ASIC1α channel could be classified according to the modes, at least one mode was identified in most of the ASIC1α records. Out of 40 single channel patches examined for modes, three patches exhibited only Mode 1 and two patches only Mode 2. The large majority of channels had mixtures of more than a single mode (35/40). The most frequent sequence was a progression from Mode 1 to Mode 2 as indicated by the examples of Fig. 5 A, whereas we reverse sequence was not observed.
ASIC2a also exhibits sudden changes in kinetics that can be classified according to Po and kinetics into Mode 1 and Mode 2. Fig. 6 C shows three examples of ASIC2a channels activated by pHo 5.0 with bars underneath the traces indicating the modes of activity (Mode 1 and Mode 2). Activity in Mode 1 has a Po of 0.74 ± 0.12 and long open events, whereas Mode 2 has much lower Po, 0.073 ± 0.025, short opening and long closures. Dwell time histograms constructed from segments displaying high or low Po revealed the presence of two opened and two closed states in each of the modes (Fig. 6 D). In Mode 1, one of the open states exhibits long duration, 58.07 ms (0.517), whereas the other open state is much shorter, 3.86 ms (0.483). The mean duration of the closed states in Mode 1 are 17.95 ms (0.25) and 0.99 ms (0.75). The open states in Mode 2 are short with mean duration of 6.32 ms (0.124) and 1.45 ms (0.876). The closed states in Mode 2 are 159 ms (0.432) and 1.2 ms (56.8).
In contrast to ASIC1α, which first opens to a high Po mode, ASIC2a switches from high to low Po modes throughout the period of activity.
Single channel kinetics of ASIC3 are different from ASIC1α and ASIC2a primarily because the bursts of activity induced by low pHo are shorter and the openings are very rarely interrupted by closures. These properties are illustrated in the examples from Fig. 1 A.
Requirement of External Ca2+ for Activation of the ASICs
Previous publications have reported stimulatory and inhibitory effects of external Ca2+ on the activity of the ASICs. For instance, de Weilli reported increase in ASIC1α activity with concentrations of Ca2+ up to 5 mM and inhibition at higher concentrations (de Weille and Bassilana, 2001). In contrast, Waldmann indicated that external Ca2+ was a blocker (KD ∼1.3 mM), and Berdiev and colleagues, in studies performed with ASIC1α reconstituted in lipid bilayers, reported that μM concentrations of external Ca2+ inhibited ASIC1α, an effect that was released by protons (Berdiev et al., 2001).
We first examined the requirement of external Ca2+ for proton-gating of the ASICs measuring whole-cell currents of oocytes expressing each of the homomeric ASIC channels with the TEVC. The external solution contained 150 mM Na+ and either 1 or 0 mM Ca2+. Oocytes were voltage clamped at −60 mM and channels were activated by a rapid change of the pHo in the bath from 7.4 to 5.0. Fig. 7 shows activation of ASIC1α and ASIC2a with 0 mM Ca2+ solutions but not of ASIC3, which required external Ca2+ with an apparent KD of 0.28 mM (inset Fig. 6 C).
Figure 7.

Effect of external Ca2+ on the activation of homomeric ASIC channels. Whole cell currents from oocytes injected with ASIC1α (A), ASIC2 (B), or ASIC3 (C) were activated by pHo 5.0 in the presence of absence of 1 mM Ca2+ in the bath solution. Only ASIC3 requires external Ca2+ for activation by protons with an apparent CE50 of 0.28 mM (inset in C). Recordings were performed with TEVC, 150 mM Na+ in the bath and −60 mV membrane potential. Time and amplitude are indicated by the scale bars.
Since these experiments were performed in nominal Ca2+-free solutions (no Ca2+ added), it is possible that sub μM concentrations of Ca2+ from impurities of the reagents are present in the solutions and thus able to inhibit ASIC1α as was suggested by Berdiev et al. (2001). We then added 1 mM EDTA to the external solution to remove all Ca2+ from the perfusate and examined the effects of Ca2+-free solutions in outside-out patches. Fig. 8 shows two independent patches containing ASIC1α exposed to Ca2+-free solutions. The channels remain closed at pHo 7.4 but are activated by pHo 5.0, demonstrating that recombinant ASIC1α expressed in the plasma membrane of oocytes is activated by low pHo, but not by removal of external Ca2+. These experiments also confirm the results obtained with the TEVC shown in Fig. 7.
Figure 8.

Two examples of ASIC1α outside-out patches activated by exposure to Ca2+-free solution (no added Ca2+ plus 1 mM EDTA) buffered at pHo 5.0. Notice that at pHo 7.4 in the Ca2+-free solution, no channel activity is detected.
Effects of Extracellular Ca2+ on the Conductance of ASIC1α
Waldmann reported that ASIC1α was highly permeable to Ca2+, but also was strongly blocked by Ca2+ (Waldmann et al., 1997a). This apparently contradictory response could be explained by anomalous mole fraction effect that reflects the interaction of ions arranged in single file in the channel pore (Hille, 2001). When Na+ and Ca2+ are present, the two ions compete for binding in the pore decreasing Na+ conductance (blocking effect of Ca2+). When only Ca2+ is present, it binds to the pore with high affinity but because two or more ions interact with each other in close proximity, the electrostatic effects contribute to rapid unbinding; hence, the conductance of Ca2+ is high. We tested this hypothesis by measuring the amplitude of unitary current at various molar concentrations of Na+ and Ca2+. The molar ratios of Na+ and Ca2+ were varied from 150 mM Na+ and 0 mM Ca2+ to 0 mM Na+ and 75 mM Ca2+. Channels were activated by changes in the pHo from 7.4 to 5.0. Increasing Ca2+ concentrations progressively decreased ASIC1α currents until all Na+ was replaced by 75 mM Ca2+. The graph in Fig. 9 A plots the amplitude of currents versus the molar ratio of Na+ and Ca2+. The data points do not exhibit a nadir followed by an increase in conductance as predicted by anomalous mole fraction effect.
Figure 9.

(A) Effects of varying the molar ratio of Na+ and Ca2+ on the conductance of ASIC1α. The Na+/Ca2+ molar ratios of the external solutions were (in mM): 150/0, 140/5, 130/10, 110/20, 50/50, and 0/75. (B) Current-voltage relationship of unitary currents of ASIC1α in symmetrical 150 NaCl and either 0 (filled circles) or 10 mM Ca2+ (clear circles). Each data point represents the mean ± SD of four to five patches.
We next examined the effect of external Ca2+ on the I-V curve of ASIC1α unitary currents in symmetrical 150 mM Na+ but with Ca2+ in the perfusate. Inward currents were smaller with 10 mM Ca2+ in the outside solution than with 0 mM Ca2+. However, the reversal potential in either nominal 0 mM Ca2+ (no EDTA added) or with 10 mM Ca2+ remained close to 0 mV, indicating small Ca2+ permeability in the presence of 150 mM Na+ (Fig. 9 B).
Inhibitory Effects of Ca2+ on ASIC1α
The previous experiments indicate that external Ca2+ inhibits ASIC1α by decreasing the amplitude of the unitary currents. However, the magnitude of the block is not enough to account for a KD of ∼1.3 mM (Waldmann et al., 1997a), suggesting that other mechanisms may participate in the Ca2+-induced inhibition of ASIC1α. To further investigate this issue we examined the effect of Ca2+ on the kinetics of single channels. The top trace of Fig. 10 A shows a patch containing three channels (O1, O2, and O3) activated by pHo 5.0 in the presence of 0 mM. The bottom trace is from the same patch activated in the presence of 10 mM external Ca2+. Besides reducing the conductance, Ca2+ also affects the kinetics of ASIC1α. In this example, three channels open in 0 mM Ca2+, whereas only one channel opens in 10 mM Ca2+ and it remains active for a shorter time. Although ASIC1α exhibits usage-dependent inactivation, the effect shown in Fig. 10 A was not due to this phenomenon because performing the experiment in the opposite order, 10 mM Ca2+ first followed by 0 mM Ca2+, produced the same result. The number of activated channels were reduced when the concentration of Ca2+ was progressively increased, from a mean of 2.6 ± 0.4 in 0 mM Ca2+ to 2.2 ± 0.3 and 1.9 ± 0.3 in 5 and 10 mM Ca2+, respectively.
Figure 10.


Effects of external Ca2+ on the activity of ASIC1α unitary currents. (A) Activation of a multichannel patch with pHo 5.0 and 0 mM Ca2+ (top trace) followed by recovery at pHo 7.4 and reactivation with pHo 5.0 in the presence of 10 mM Ca2+ (bottom trace). External Ca2+ reduced the amplitude of the unitary currents, decreased the number of activated channels in the patch from three to one, and shortened the length of the burst of activity. (B) Histograms of bursts duration of ASIC1α in the presence of increasing concentrations of Ca2+. Patches were activated by pHo 5.0 solutions containing increasing concentrations of Ca2+: 0 mM, 5.0 mM or ≥10 mM (10, 20, 50, 75). Length of bursts were computed and sorted for the generation of histograms. The number of patches examined were: 83 with 0 mM Ca2+, 21 with 5 mM, and 62 with ≥10 mM. (C) Apparent half maximal inhibition of ASIC1α whole-cell currents by Ca2+. Currents from oocytes were activated by changes in pHo from 7.4 to 5.0 in the presence of 150 mM NaCl and increasing concentrations of external Ca2+. Measurements were obtained with TEVC at −60 mV. The line represents the fit of the data to Eq. 2 with KD value of 9.2 ± 0.22 mM. Each data point is the mean ± SD of five oocytes.
External Ca2+ also shortens the length of the bursts of activity. We measured the duration of the bursts, defined as the time encompassed from the first opening upon activation by pHo 5.0 until the final closure before desensitization, of patches exposed to increasing Ca2+ concentrations. Fig. 10 B shows histograms of burst duration, with 0 mM Ca2+ bursts lasted up to 10 s, whereas with concentrations >10 mM, they lasted <1 s, indicating that the desensitization rate is also Ca2+ dependent.
To evaluate the overall effect of the various inhibitory mechanisms of Ca2+ on ASIC1α activity, we measured the apparent KD of whole-cell currents with the TEVC. The external solution contained 150 mM Na+ and increasing concentrations of Ca2+. For each Ca2+ concentration, oocytes were preconditioned at pHo 7.4 and activated by identical solutions buffered at pHo 5.0. Peak currents were normalized to the value obtained with 0 mM Ca2+. The line in Fig. 10 C represents the fit of the data with Eq. 2 and KD value of 9.8 ± 2 mM. For comparison with the original report (Waldmann et al., 1997a) the plot is drawn in a linear scale. Even at very high Ca2+ concentrations the currents are not completely blocked.
DISCUSSION
In this work we have examined unitary and whole cell currents from recombinant homomeric ASIC channels in order to establish their properties. The goal of these studies was not to perform an extensive analysis of the mechanisms underlying each of these properties, but was intended as a first step on the functional characterization of the unitary currents of the ASICs. Many of the properties described in this work are unique for each type of channel and, from a practical view, they can serve as fingerprints to distinguish the ASICs in neurons from the mammalian peripheral and central nervous systems.
Subconductance States of the ASICs
Here, we report and characterize the presence of subconductance states in homomeric ASIC1α and ASIC2a channels but not in ASIC3. ASIC1α exhibits three subconductance states (S1, S2, and S3) and a fully open state, whereas ASIC2a exhibits only one sublevel (S1). The frequency of sublevels was higher in ASIC1a than in ASIC2a, thus making this property a useful feature to distinguish ASIC1α channels.
It is possible that a larger number of sublevels exist, but we could not resolve them with the resolution of our system. Evidence supporting the interpretation that the sublevels represent partially open states and not independent channels is that the smaller conductances were never seen superimposed on the fully open state in <80 single channel patches examined in this work. An alternative explanation for the sublevels is that they represent partial blocking events induced by Ca2+ or Mg2+. This possibility is unlikely because the sublevels remained when divalent cations were removed and EDTA was added to the perfusate. An additional argument against the blocking mechanism was the absence of voltage dependence in the frequency or duration of the sublevels.
Sublevels were present through the burst of activity, including the initial opening and final closure; therefore, we do not believe they represent intermediate steps in the activation or inactivation processes (Zheng and Sigworth, 1998). It is tempting to postulate that the sublevels in ASIC1α reflect a conformational state from each of the subunits reflecting a tetrameric structure. The notion is consistent with the proposed stoichiometry for other members of the ENaC/DEG family (Coscoy et al., 1998; Firsov et al., 1998).
Single Channel Kinetics of the ASICs
Inspection of single channel records revealed marked differences in kinetics among the ASICs. The most significant and readily recognizable differences were the rate of desensitization and the overall appearance of the kinetics of single channels. The rates of desensitization were faster in the order ASIC3>ASIC1α>> ASIC2a. Most significant, the rate of desensitization of ASIC2a was not only slower but also incomplete, leaving active channels on the continual exposure to low pHo. In contrast, protons rapidly and completely desensitized ASIC1α and ASIC3, making the patches quiescent a few seconds after the change to low pHo.
Openings of ASIC1α and ASIC2a were frequently interrupted by closures, and ASIC1α and ASIC2a exhibit sudden changes in kinetics given rise to modes of activity with different Po and kinetics. According to these criteria, two modes of activity were identified: Mode 1 and Mode 2. We do not know the mechanisms underlying the modes of activity; although, they likely reflect entering of channels into a particular subset of states from the overall kinetic scheme. The progressive decrease in Po and the faster kinetics from Mode 1 to Mode 2 observed in ASIC1α suggest that the modes may be linked to the desensitization process of this channel. However, the same interpretation cannot be applied to ASIC2a because this channel exhibits sudden shifts from Mode 1 to Mode 2 and back to Mode 1 throughout the period of activity.
External Ca2+ Elicits Multiple Effects on ASICs
Elucidation of the effects of external Ca2+ is paramount to understand the consequences of ASIC activation in the nervous system. In particular, it is important to determine Ca2+ permeability because of the roles of Ca2+ on triggering cell death, synaptic plasticity, and long-term potentiation. The first publication after the cloning of ASIC1α reported that the channel was highly permeable to Ca2+ (Waldmann et al., 1997a). Later publications have not been able to confirm this result (Bässler et al., 2001; de Weille and Bassilana, 2001). Since Waldmann also reported a high degree of block of Na+ currents by Ca2+ (KD 1.8 mM), we sought to investigate the possibility of Na+ and Ca2+ interaction in the channel pore as an explanation to these two apparently contradictory results. However, we did not find evidence to support ion interaction in the pore, but our findings instead indicated that Ca2+ permeability is very small. Moreover, addition of 10 mM Ca2+ in the bath did not change the reversal potential of unitary ASIC1α currents. On the other hand, we found that Ca2+ inhibits ASIC1α by several mechanisms: reduction in the amplitude of unitary currents, decrease in the number of proton-gated channels, and increase in the desensitization rate. In spite of all these effects that together suppress ASIC1α activity, the KD for inhibition of macroscopic currents was found to be 9.2 ± 2 mM, a value that is too high for considering Ca2+ as a physiological modulator of ASIC1α. In this regard, our result is consistent with a report by de Weille and Bassilana who found 50% inhibition with 12 mM Ca2+ (de Weille and Bassilana, 2001).
On the other hand, Berdiev had suggested that activation of ASIC1α by protons is mediated by the release of Ca2+ inhibition that normally occurs at pHo 7.4 (Berdiev et al., 2001). Our results from experiments performed with EDTA in the external solution did not confirm this mechanism; although the differences in results may be attributed to the different experimental systems: patches from the plasma membrane of X. oocytes injected with cRNAs versus extraction and reconstitution of ASIC1α in lipid bilayers.
The effects of external Ca2+, however, are not equal in the three types of ASIC channels. We found that ASIC3 requires small concentrations of external Ca2+ to be gated by protons. Whether Ca2+ is important in the physiological modulation of ASIC3 activity is an open question. The range of Ca2+ concentrations (EC50 0.28 mM) that affect the activation of this channel is low in comparison to the free Ca2+ concentration in plasma or the cerebrospinal fluid (1.8 mM). It is conceivable that local acidosis and chelation of Ca2+ by lactate may decrease the concentration of free Ca2+ sufficiently to differentially modulate ASIC3 activity and not of ASIC1α or ASIC2a. These results are different from the ones reported by Immke and McCleskey (2001), who found that lactate increases ASIC3 currents by a mechanism consistent with chelation of divalent ions, Ca2+ and/or Mg2+. However, the currents they showed as belonging to ASIC3 did not conform to the rapid desensitization and the low apparent pH50 characteristic of the rat ASIC3 channel. It is possible that in neurons from DRG other ASIC currents, perhaps from herteromeric channels, were responsible for the lactate response.
How to Distinguish the ASICs
Northern blot analysis and in situ hybridization studies have demonstrated the presence of mRNA from several of the ASICs in the neurons from the nervous system, indicating that many cells express more than one type of ASIC. It is therefore desirable to distinguish the various proton-gated currents arisen from these proteins. Our analysis of the single channel properties of homomeric ASIC1α, ASIC2a, and ASIC3 provides some functional criteria to differentiate these channels.
ASIC1α and ASIC3 share several properties, mainly a fast and complete desensitization after exposure to external protons. These channels are therefore refractory to stimulation by a new pulse of low pHo. Although the desensitization rate is faster in ASIC3 than in ASIC1α, the difference is not large enough to readily distinguish the two populations of channels expressed in the same cell. However, these channels can be distinguished by measuring proton-gated currents in the presence or absence of small concentrations of Ca2+ in the activating solution (∼1 mM Ca2+). This simple maneuver silences ASIC3 without affecting ASIC1α channels. Additionally, ASIC1α and ASIC3 can be distinguished at the single channel level by their kinetics. As we indicated, ASIC3 does not exhibit closures, sublevels, or modes of activity.
Identification of ASIC2a poses fewer difficulties because these channels desensitize at a much slower rate and exhibit a component of sustained current at low pHo that is absent in ASIC1α and ASIC3. A particularly useful property is the low sensitivity to preconditioning pHo; therefore, exposing the patch first to pHo 6.0 inactivates ASIC1α and ASIC3, leaving only ASIC2a channels for activation with further decreases in pHo. Table I summarizes the properties of the homomeric ASIC channels that distinguish them.
TABLE I .
Summary of the Properties of Homomeric ASIC1α, ASIC2a and ASIC3 Channels
| ASIC1α | ASIC2a | ASIC3 | |
|---|---|---|---|
| pH50 | 5.8 ± 0.25 | 5.0 ± 0.12 | 5.4 ± 0.13 |
| Inactivation rate(s−1) at pHo 5.0 | 2.0 | 0.045 | 4.5 |
| Inactivation | Complete | Incomplete | Complete |
| Subconductances | S1, S2, and S3 | S1 (rare) | No |
| Kinetics | Modes 1 and 2 | Modes 1 and 2 | No |
| EC50 of external Ca2+ | No | No | 0.28 mM |
In conclusion, identification and characterization of single channel properties of the ASICs not only provide useful tools to differentiate these channels but also improve our understanding of this new family of ligand-gated ion channels.
Supplemental Material
Supplemental Material Index
Acknowledgments
We thank Dr. Emile Boulpaep for reading the manuscript and for helpful comments.
This work was supported by grants from the National Institutes of Health (DK54062 and P50HL55007) to C.M. Canessa.
The online version of this paper contains supplemental material.
Footnotes
*
Abbreviations used in this paper: ASIC, acid-sensing ion channel; DRG, dorsal root ganglia.
References
- Alvarez de la Rosa, D., P. Zhang, D. Shao, F. White, and C.M. Canessa. 2002. Functional implications of the localization and activity of acid-sensitive channels in rat peripheral nervous system. Proc. Natl. Acad. Sci. USA. 99:2326–2331. [DOI] [PMC free article] [PubMed] [Google Scholar]
- Akopian, A.N., C.C. Chen, Y. Ding, P. Cesare, and J.N. Wood. 2000. A new member of the acid-sensing ion channel family. Neuroreport. 11:2217–2222. [DOI] [PubMed] [Google Scholar]
- Askwith, C.C., C. Cheng, M. Ikuma, C. Benson, M.P. Price, and M.J. Welsh. 2000. Neuropeptide FF and FMRFamide potentiate acid-evoked currents from sensory neurons and proton-gated DEG/ENaC channels. Neuron. 26:133–141. [DOI] [PubMed] [Google Scholar]
- Babinski, K., S. Catarsi, G. Biagini, and P. Séguéla. 2000. Mammalian ASIC2a and ASIC3 subunits co-assemble into heteromeric proton-gated channels sensitive to Gd3+. J. Biol. Chem. 275:28519–28525. [DOI] [PubMed] [Google Scholar]
- Baron, A., L. Schaefer, E. Lingueglia, G. Champigny, and M. Lazdunski. 2001. Zn2+ and H+ are coactivators of acid-sensing ion channels. J. Biol. Chem. 276:35361–35367. [DOI] [PubMed] [Google Scholar]
- Bässler, E.L., T.J. Ngo-Anh, H.S. Geisler, J.P. Ruppersberg, and S. Gründer. 2001. Molecular and functional characterization of acid-sensing ion channel (ASIC)1b. J. Biol. Chem. 276:33782–33787. [DOI] [PubMed] [Google Scholar]
- Benson, C.J., J. Xie, J.A. Wemmie, M.P. Price, J.M. Henss, M.J. Welsh, and P.M. Snyder. 2002. Heteromultimers of DEG/ENaC subunits form H+-gated channels in mouse sensory neurons. Proc. Natl. Acad. Sci. USA. 99:2338–2343. [DOI] [PMC free article] [PubMed] [Google Scholar]
- Berdiev, B.K., T.B. Mapstone, J.M. Markert, G.Y. Gillespie, J. Lockhart, C.M. Fuller, and D.J. Benos. 2001. pH alterations “reset” Ca2+ sensitivity of brain Na+ channel 2, a degenerin/epithelial Na+ ion channel, in planar lipid bilayers. J. Biol. Chem. 276:38755–38761. [DOI] [PubMed] [Google Scholar]
- Caterina, M.J., M.A. Schumacher, M. Tominaga, T.A. Rosen, J.D. Levine, and D. Julius. 1997. The capsaicin receptor: a heat-activated ion channel in the pain pathway. Nature. 389:816–824. [DOI] [PubMed] [Google Scholar]
- Chen, C., S. England, A.N. Akopian, and J.N. Wood. 1998. A sensory neuron-specific, proton-gated ion channel. Proc. Natl. Acad. Sci. USA. 95:10240–10245. [DOI] [PMC free article] [PubMed] [Google Scholar]
- Coscoy, S., E. Lingueglia, M. Lazdunski, and P. Barbry. 1998. The Phe-Met-Arg-Phe-amide-activated sodium channel is a tetrAm. J. Biol. Chem. 273:8317–8322. [DOI] [PubMed] [Google Scholar]
- de Weille, J., and F. Bassilana. 2001. Dependence of acid-sensitive ion channel, ASIC1a, on extracellular Ca2+ ions. Brain Res. 900:277–281. [DOI] [PubMed] [Google Scholar]
- Firsov, D., I. Gautschi, A.-M. Merillat, B.C. Rossier, and L. Schild. 1998. The heterotetrameric architecture of the epithelial sodium channel (ENaC). EMBO J. 17:344–352. [DOI] [PMC free article] [PubMed] [Google Scholar]
- García-Añoveros, J., B. Derfler, J. Neville-Golden, B.T. Hyman, and D.P. Corey. 1997. BNaC1 and BNaC2 constitute a new family of human neuronal sodium channels related to degenerins and epithelial sodium channels. Proc. Natl. Acad. Sci. USA. 94:1459–1464. [DOI] [PMC free article] [PubMed] [Google Scholar]
- García-Añoveros, J., T.A. Samad, L. Zuvela-Jelaska, C.J. Woolf, and D.P. Corey. 2001. Transport and localization of the DEG/ENaC ion channel BNaC1α to peripheral mechanosensory terminals of DRG neurons. J. Neurosci. 21:2678–2686. [DOI] [PMC free article] [PubMed] [Google Scholar]
- Gründer, S., H.-S. Geissler, E.-L. Bässler, and J.P. Ruppersberg. 2000. A new member of acid-sensing ion channels from pituitary gland. Neuroreport. 11:1607–1616. [DOI] [PubMed] [Google Scholar]
- Immke, D.C., and E.W. McCleskey. 2001. Lactate enhances the acid-sensing Na+ channel on ischemia-sensing neurons. Nature Neurosceince. 4:869–870. [DOI] [PubMed] [Google Scholar]
- Hille, B. 2001. Ion Channels of Excitable Membrane. 3rd ed. Sinauer Associates, Inc., Sunderland, MA. 486–497.
- Lingueglia, E., J.R. de Wielle, F. Bassilana, C. Heurteaux, H. Sakai, R. Waldmann, and M. Lazdunski. 1997. A modulatory subunit of acid sensing ion channels in brain and dorsal root ganglion ells. J. Biol. Chem. 272:29778–29783. [DOI] [PubMed] [Google Scholar]
- Price, M.P., S.L. McIIwrath, J. Xie, C. Cheng, J. Qiao, D.E. Tarr, K.A. Sluka, T.J. Brennan, G.R. Lewin, and M.J. Welsh. 2001. The DRASIC cation channel contributes to the detection of cutaneous touch and acid stimuli in mice. Neuron. 32:1071–1083. [DOI] [PubMed] [Google Scholar]
- Price, M.P., P.M. Snyder, and M.J. Welsh. 1996. Cloning and expression of a novel human brain Na+ channel. J. Biol. Chem. 271:7879–7882. [DOI] [PubMed] [Google Scholar]
- Sutherland, S.P., C.J. Benson, J.P. Adelman, and E.W. McCleskey. 2001. Acid-sensing ion channel 3 matches the acid-gated current in cardiac ischemia-sensing neurons. Proc. Natl. Acad. Sci. USA. 98:711–716. [DOI] [PMC free article] [PubMed] [Google Scholar]
- Waldmann, R., G. Champigny, F. Bassilana, C. Heurteux, and M. Lazdunski. 1997. a. A proton-gated cation channel involved in acid-sensing. Nature. 389:173–177. [DOI] [PubMed] [Google Scholar]
- Waldmann, R., F. Bassilana, J. de Weille, G. Champigny, C. Heurteaux, and M. Lazdunski. 1997. b. Molecular cloning of a non-inactivating proton-gated Na+ channel specific for sensory neurons. J. Biol. Chem. 272:20975–20978. [DOI] [PubMed] [Google Scholar]
- Waldmann, R., and M. Lazdunski. 1998. H+-gated cation channels:neuronal acid sensors in the NaC/DEG family of ion channels. Curr. Opin. Neurobiol. 8:418–424. [DOI] [PubMed] [Google Scholar]
- Wemmie, J.A., J. Chen, C.C. Askwith, A.M. Hruska-Hageman, M.P. Price, B.C. Nolan, P.G. Yoder, E. Lamani, T. Hoshi, J.H. Freeman, Jr., and M.J. Welsh. 2002. The acid-activated ion channel ASIC contributes to synaptic plasticity, learning, and memory. Neuron. 34:463–477. [DOI] [PubMed] [Google Scholar]
- Zhang, P., and C.M. Canessa. 2001. Single-channel properties of recombinant acid-sensitive ion channels formed by the subunits ASIC2 and ASIC3 from dorsal root ganglion neurons expressed in Xenopus oocytes. J. Gen. Physiol. 117:563–572. [DOI] [PMC free article] [PubMed] [Google Scholar]
- Zheng, J., and F.J. Sigworth. 1998. Intermediate conductances during deactivation of heteromultimeric Shaker potassium channels. J. Gen. Physiol. 112:457–474. [DOI] [PMC free article] [PubMed] [Google Scholar]
Associated Data
This section collects any data citations, data availability statements, or supplementary materials included in this article.
Supplementary Materials
Supplemental Material Index