Termination of Ca2+ release during Ca2+ sparks in rat ventricular myocytes (original) (raw)
Abstract
- Confocal Ca2+ imaging was used to measure spontaneous release events (Ca2+ sparks) in fluo-3-loaded isolated rat ventricular myocytes.
- The microscopic Ca2+ release flux underlying Ca2+ sparks was derived by adapting the methods used previously to describe macroscopic Ca2+ release from cell-averaged Ca2+ transients.
- The magnitude of the local release fluxes varied from 2 to 5 μm ms−1, depending on SR Ca2+ loading conditions. Following spontaneous activation, the release flux rapidly decayed (τ = 6–12 ms). The rate of termination of release flux was found to be directly related to the magnitude of the flux (_r_2 = 0.88).
- The rate of termination of local release flux was slowed in the presence of FK506, a compound that is known to reduce inactivation of SR Ca2+ channels in vitro.
- These results suggest that termination of release flux during sparks is not due to a spontaneous stochastic decay process or local depletion of Ca2+ from the SR, but rather involves an active extinguishing mechanism such as Ca2+-dependent inactivation or adaptation.
In mammalian cardiac myocytes, the process of excitation-contraction (E-C) coupling is mediated by Ca2+ influx from the extracellular medium triggering Ca2+-induced Ca2+ release (CICR) from the sarcoplasmic reticulum (SR) (Bers, 1991; Stern & Lakatta, 1992). In its simplest form, CICR should involve a positive feedback of released Ca2+ on further release, which should result in all-or-none regenerative release. In vivo, however, the Ca2+ release is tightly graded with the magnitude of the Ca2+ influx (Cannell, Berlin & Lederer, 1987; Beuckelmann & Wier, 1988). One suggested solution to this paradox is the existence of local subdomains in which the trigger and released Ca2+ are morphologically and/or functionally segregated (Stern, 1992; Györke & Palade, 1993). Recently, the idea of local control of release has received direct experimental support from the discovery of Ca2+ sparks (Cheng, Lederer & Cannell, 1993; Lipp & Niggli, 1994). A Ca2+ spark is a spontaneous local increase in [Ca2+] (Cheng et al. 1993) that appears to reflect activation of a regenerative cluster of Ca2+ release channels (Lipp & Niggli, 1996). A spark is well confined in space (< 3 μm) and time (< 50 ms) and reaches a peak amplitude of 100–500 nm, depending on SR Ca2+ loading conditions (Cheng et al. 1993). Thus, to understand the graded nature of CICR we have to define the factors that are responsible for the early termination of Ca2+ release during a spark and factors that prevent Ca2+ released during these events from activating adjacent release sites.
In principle, termination of Ca2+ release during a spark could be due to any of the following mechanisms: (1) Ca2+ release dying off spontaneously (stochastic attrition; Stern, 1992); (2) local depletion of Ca2+ in the SR; and (3) Ca2+-dependent inactivation/adaptation of release (Fabiato, 1985; Yasui, Palade & Györke, 1994). To address the question of which of these mechanisms is responsible for termination of release during sparks, we have derived the Ca2+ release flux underlying sparks and correlated the rate of termination of the release flux with the magnitude of the flux under various SR Ca2+ loading conditions. Our results show that the rate of decay of flux is directly dependent on the amount of Ca2+ released during the spark, and it can be modulated by agents that affect Ca2+ release channel closure. Based on these results, we conclude that decay of release during a spark is caused by inactivation or adaptation of Ca2+ release channels.
METHODS
Cell isolation and experimental solutions
Adult Sprague-Dawley rats (200–300 g) were killed by lethal injection of Nembutal (100 mg kg−1, i.p.; Abbott Laborotories, Chicago, IL, USA), and single ventricular myocytes were obtained by enzymatic dissociation as described previously (Györke, Lukyanenko & Györke, 1997). The cells were loaded with fluo-3 by a 20 min incubation with 5 μm fluo-3 AM (acetoxymethyl ester form; Molecular Probes) at room temperature.
The standard Tyrode solution contained (mm): 140 NaCl, 2 KCl, 0.5 MgCl2, 1 CaCl2, 10 Hepes, 0.25 NaH2PO4, 5.6 glucose, pH 7.3. Tetrodotoxin (Sigma), at 10 μm, was added to the bathing solution to avoid depolarization-induced Ca2+ release due to spontaneous action potentials. All experiments began in a bathing solution containing 1 mm Ca2+. Only cells that exhibited no spontaneous Ca2+ oscillations were selected for further measurements. To alter the SR Ca2+ load, extracellular [Ca2+] ([Ca2+]o) was varied between 1 and 10 mm. In the Na+-free solution, Na+ was replaced by Li+ and Ca2+ was omitted. FK506 (generous gift from Fujisawa, Deerfield, IL, USA) was added from a 10 mm stock solution in methanol at concentrations of 10–50 μm.
Confocal microscope
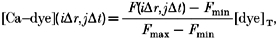
Experiments were performed using the linescan mode of an Olympus Laser Scanning Confocal Microscope (LSM-GB200) as described previously (Györke et al. 1997). Fluo-3 was excited by light at 488 nm (25 mW argon laser; intensity attenuated to 1–3%). Fluo-3 fluorescence was measured at wavelengths of > 515 nm. Images were acquired at a rate of 2.1 ms per scan with the confocal detector aperture set to 75% of maximum. An analog recording of fluorescence intensity was digitized into 640 pixels, giving a nominal pixel dimension of 0.41 μm. Image processing and analysis were performed by using NIH Image (NIH, Bethesda, MD, USA) and IDL software (Research Systems Inc., Boulder, CO, USA). The local, instantaneous concentration of the calcium-dye complex was derived from fluo-3 fluorescence according to the equation:
 |
(1) |
|---|
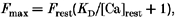
where F(i_Δ_r, j_Δ_t) is the fluorescence of pixel (i, j), Δ_r_ and Δ_t_ are the spatial and temporal resolution of the microscope. The spatial co-ordinate r is the distance along the line scan. [Dye]T is the total dye concentration. _F_min is essentially zero for fluo-3. _F_max was obtained from the resting level of fluorescence (_F_rest) according to the equation (Cheng et al. 1993):
 |
(2) |
|---|
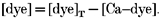
where _K_D (740 nm; Escobar, Cifuentes & Vergara, 1995) is the dissociation constant of the indicator-dye complex, and [Ca2+]rest is the resting value of calcium concentration (assumed to be 0.1 μm at 1 mm [Ca2+]o). The total fluo-3 concentration, ([dye]T ≈ 50 μm) was estimated fluorometrically by releasing the dye trapped in the cytosol with digitonin (50 μm) and extrapolation to an in vitro calibration curve. To identify Ca2+ sparks we used the following criteria (Györke et al. 1997): (a) the amplitude of the event had to be at least two times greater then the standard deviation of fluorescence intensity fluctuations measured in the neighbouring region (area ≈ 3 × 15 pixels); (b) the duration and image width of the Ca2+ signal (both measured at half-maximal amplitude) had to be within 10–100 ms and 0.5-3 μm, respectively. Averaged Ca2+ sparks for given experimental conditions were obtained by averaging linescan images of individual sparks synchronized at the time to half-maximal amplitude.
Calculation of the local release flux
The spatio-temporal distribution of the free cytoplasmic Ca2+ is described by the reaction-diffusion equation:
 |
(3) |
|---|
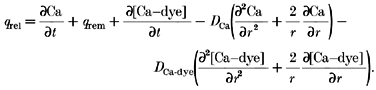
Here ∂Ca/∂t is the rate of change of cytosolic free Ca2+, _D_Ca is the diffusion coefficient of Ca2+, and ▿2Ca is the Laplacian, _q_rel is the release flux, _q_rem is the removal flux and _q_dye is the net rate of binding of calcium ion to the fluorescent indicator. For the binding of calcium to the dye complex, the kinetic expression is given by:
 |
(4) |
|---|
In this expression, _k_d,on and _k_d,off are the on- and off-rate constants, respectively, for binding to the dye. The instantaneous concentration of the free dye may be determined from the following conservation relation:
 |
(5) |
|---|
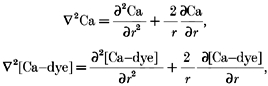
The spatio-temporal distribution of the calcium-dye complex is also given by the reaction-diffusion equation:
 |
(6) |
|---|
Within the myoplasm, spherically symmetrical diffusion of calcium and of the calcium-dye complex is assumed.
 |
(7) |
|---|
Substituting eqns (4), (5), (6) and (7) into eqn (3) and solving for the release flux yields the following expression:
 |
(8) |
|---|
Thus, the diffusion of both the free ion and complex are included. All the terms on the right-hand side can be measured experimentally, or computed from accepted kinetic expressions. The instantaneous local concentration of the fluo-3-calcium complex is obtained by measuring fluorescence intensity. The instantaneous local concentration of free Ca2+ is obtained by solving for it from eqn (6):
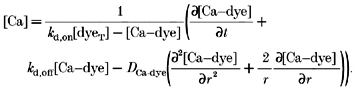 |
(9) |
|---|
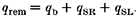
The removal flux consists of three contributions (Sipido & Wier, 1991).
 |
(10) |
|---|
The quantity _q_b is the removal by binding to soluble buffers, _q_SR is the removal by the Ca2+-ATPase of the sarcoplasmic reticulum, and _q_Sl is the removal by the Ca2+-ATPase and Na+-Ca2+ exchanger of the sarcolemma (SL). The fluxes transported by the Ca2+ pumps and Na2+-Ca2+ exchanger were calculated from expressions given by Tang & Othmer (1994). These are given below:
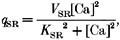 |
(11) |
|---|
 |
(12) |
|---|
V is the maximal capacity, and K is the calcium capacity at which the transport is half-maximal for a particular process. With regard to buffering, its flux was calculated from the following equation, which lumps all the buffers into a single pool:
 |
(13) |
|---|
The rate constants for binding and dissociation are given by _k_b,on and _k_b,off, respectively. [B]o is the total concentration of buffers, and [Ca-B] is the concentration of the calcium-buffer complexes. The latter is, itself, a function of time and is calculated from integration using a forward finite difference approximation.
 |
(14) |
|---|
Thus, all the quantities on the right side of eqn (8) were calculated from the experimental records. The values of the various parameters used in the calculations are given in Table 1. The equations were numerically discretized using finite differences. The time derivative was approximated by backward differences, while the first and second order spatial derivatives were approximated by central finite differences. The grid density corresponded to the resolution of our confocal microscope (Δ_t_ = 2.1 ms, Δ_r_ = 0.4 μm). The resulting set of discrete equations were coded in a three-dimensional spreadsheet in Microsoft Excel for numerical integration.
Table 1.
Parameters used to compute local SR Ca2+ fluxes associated with sparks
| Parameter | Value | Source |
|---|---|---|
| DyeT (nm) | 5 × 10⁴ | Experimental value |
| _K_D (nm) | 740 | Escobar, Cifuentes & Vergara (1995) |
| _k_d,on (nm−1 ms−1) | 2.4 × 10⁻⁴ | Escobar, Cifuentes & Vergara (1995) |
| _k_d,off (ms−1) | 1.8 × 10⁻² | Escobar, Cifuentes & Vergara (1995) |
| _V_SR (nm ms−1) | 2 × 10³ | Tang & Othmer (1994) |
| _K_SR (nm) | 120 | Tang & Othmer (1994) |
| _V_SL (nm ms−1) | 19 | Tang & Othmer (1994) |
| _K_SL (nm) | 60 | Tang & Othmer (1994) |
| _B_0 (nm) | 2.15 × 10⁵ | Hove-Madsen & Bers (1993) |
| _k_b,on (nm−1 ms−1) | 10−4 | Sipido & Wier (1991) |
| _k_b,off (ms−1) | 4 × 10⁻² | Sipido & Wier (1991) |
| _D_Ca-dye (μm2 ms−1) | 0.02 | Harkins, Kurebayashi & Baylor (1993) |
| _D_Ca (μm2 ms−1) | 0.3 | Kushmeric & Podolsky (1969) |
| Δ_t_ (ms) | 2.1 | Temporal resolution of confocal microscope |
| Δ_r_ (μm) | 0.4 | Spatial resolution of confocal microscope |
Filtering
Because of unavoidable random noise in experimental records the raw pixel intensities and the calculated free calcium from eqn (9) were filtered in the course of the calculations. The filtering algorithm averaged the raw value at a point with its eight adjacent neighbours. That is:
 |
(15) |
|---|
This allowed clear visualization of the peaks in release flux and other relevant quantities.
Model validation
To verify the accuracy of our algorithm for reconstruction of release fluxes, we compared our numerical approach to analytical expressions. First we confirmed that the time and space derivatives were accurately estimated using the grid density of our numerical discretization scheme (Δ_r_ = 0.4 μm; Δ_t_ = 2.1 ms). We compared the analytical derivatives of the solution presented by Stern (1992) (eqn (13)) for diffusion of calcium from a point source to our numerical estimates. The estimated time and spatial derivatives superimposed upon their analytical counterparts (not shown).
Next, we applied our analysis to several simulated calcium distributions arising from known release fluxes. A simple calcium distribution, C(t, r), with an exponentially decaying release flux is described in a sphere of radius a by the following system.
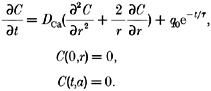 |
(16) |
|---|
The analytical solution to this system is given by Carslaw & Jaeger (1959). With the analytical solution contaminated with 10% noise, our analysis reconstructed an input time constant of 12 ms to within 5%, and an input time constant of 6 ms to within 20% (Fig. 1).
Figure 1. Reconstruction of Ca2+ release flux from simulated Ca2+ distributions arising from exponentially decaying release fluxes.
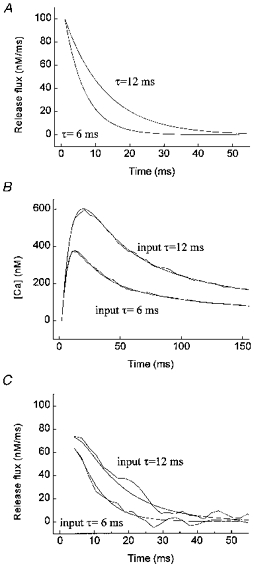
A, time courses of input release fluxes with time constants of 6 and 12 ms. B, calcium time courses resulting from input release fluxes in A, obtained by solving analytically eqn (16) (smooth lines, without noise; wavy lines, with noise and filtering). The grid density of the analytical solution was equal to the temporal and spatial resolution of the confocal microscope (Δ_t_ = 2.1 ms, Δ_r_ = 0.4 μm). Random noise equal to 10% of the local magnitude of the [Ca2+] was generated by adding a normally distributed random number to the [Ca2+] variable: C_noise(t,r) = C(t,r)(1 + 0.05_n), where n is a random number between −1 and +1; the [Ca2+] values were then filtered using our filtering algorithm (eqn (15)). C, time courses of recovered release fluxes without noise and with noise and filtering. The release flux was calculated by solving the numerically discretized eqn (16) for _q_rel, i.e. The reconstructed values of the release flux at r = a were fitted to the exponential decay function given in eqn (16). The following values for the parameters _q_0 and τ were obtained for the reconstructed release fluxes with noise and filtering. Input τ (ms): 6 and 12 ms; reconstructed τ, (ms): 6.09 (_r_2 = 0.873) and 12.58 (_r_2 = 0.891); input _q_0 (nm ms−1): 100 and 100; reconstructed _q_0 (nm ms−1): 62 and 75.
Lastly, we reconstructed a known Ca2+ release flux function giving rise to a simulated Ca2+ spark. The theoretical linescan image of a Ca2+ spark was kindly provided by Dr Michael Stern (NIH, Baltimore, MD, USA). This simulation included kinetics and diffusion of the dye complex, buffering, and re-uptake, but employed a different model from the inverted model employed in our analysis. Using our analysis program we were able to recover reasonably well the wave form of the input release signal (not shown). In view of the accuracy of the reconstructions, in the presence of noise and using a model different from the inverted analysis model, the algorithm was judged sufficiently accurate and robust for estimating release fluxes from experimental records.
RESULTS
Local release flux underlying Ca2+ sparks
To understand the behaviour of channels underlying sparks it was important to determine the Ca2+ release flux associated with the sparks. SR Ca2+ release flux was determined by applying the general approach used for calculating release flux from cell averaged Ca2+ transients in skeletal and cardiac muscle (Melzer, Rios & Schneider, 1987; Sipido & Wier, 1991). According to the basic equation of Melzer and co-authors:
 |
(17) |
|---|
where _q_rel is the Ca2+ release flux; q_rem is the Ca2+ removal flux due to binding to soluble buffers, extrusion by sarcolemmal pumps, and re-uptake by the sarcoplasmic reticulum; and d[Ca-dye]/d_t is the net rate of binding of Ca2+ to the fluorescent indicator. This formulation assumes spatially uniform concentrations of Ca2+ and buffers. To account for spatially heterogeneous release underlying Ca2+ sparks, eqn (17) was modified to include diffusion terms for Ca2+ and the Ca-dye complex.
 |
(8) |
|---|
Following Sipido & Wier (1991), Ca2+ removal flux was estimated based on the measured properties of the known cellular Ca2+ buffering, uptake and extrusion systems (Table. 1).
Examples of removal and release fluxes derived from a local fluorescence signal are shown in Fig. 2. The removal flux includes binding of Ca2+ to intracellular Ca2+ buffers and Ca2+ removal by the SR and sarcolemmal Ca2+-ATPase. These components contributed about 55, 44 and 1%, respectively, to the peak of the total removal flux (not shown). Local [Ca2+]i changes determined by taking into consideration the kinetics of the Ca2+ indicator and the diffusion of Ca2+ and the Ca-dye complex are also presented. It can be seen that a local [Ca2+]i elevation of ∼100 nm is produced by a release flux of ∼2000 nm ms−1. The local release flux is clearly more confined in both space and time than the resulting Ca2+ spark.
Figure 2. Calculation of Ca2+ release flux underlying Ca2+ release events.
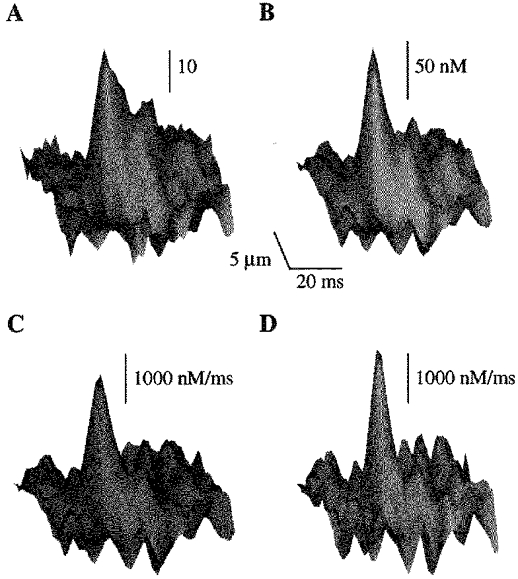
Surface plots of images of spontaneous Ca2+ sparks represented in arbitrary fluorescence units (A) and [Ca2+] (B) and their associated Ca2+ removal (C) and release fluxes (D). The images were obtained from a single release event measured in an extracellular solution containing 1 mm Ca2+. Background [Ca2+]i was assumed to be 100 nm.
A potential source of error in our estimation of release fluxes is that spatially heterogeneous Na+-Ca2+ exchanger flux was homogeneously lumped with the SL Ca2+-ATPase flux. To assess the extent to which the calculated Ca2+ release flux signal is affected by removal of Ca2+ by the Na+-Ca2+ exchanger we carried out experiments in zero-Na+ medium. We found no significant differences in the magnitude and rate of termination of release fluxes measured under control vs. zero-Na+ conditions (peak amplitude, 2632 ± 163 nm ms−1 vs. 2628 ± 161 nm ms−1 and τ = 9.5 ± 0.9 ms vs. 10.4 ± 1.3 ms; means ± s.e.m.; n = 30 and 19, respectively). Thus, our estimates of Ca2+ release fluxes were not affected significantly by a heterogeneous Na2+-Ca2+ exchanger.
In Fig. 2, it can be seen that the local release flux rapidly increases then it decays just as rapidly. Defining the mechanism of this decay was the main goal of the remainder of this study.
Dependency of the rate of decay on the magnitude of release
To understand the mechanism of termination of Ca2+ release underlying a spark it is important to determine the relationship between the rate of termination of the release flux and the amount of Ca2+ released. Release flux magnitude was varied by means of exposing the cells to different [Ca2+]o. Elevation of [Ca2+]o has been shown to increase the levels of SR Ca2+ content in cardiac myocytes. It has also been reported to increase the magnitude of Ca2+ sparks, presumably due to a greater Ca2+ gradient across the SR membrane and an increased duration of openings of ryanodine receptors (RyRs) at higher lumenal [Ca2+] (Lukyanenko, Györke & Györke, 1997).
Figure 3 illustrates images of Ca2+ sparks, and associated with them, Ca2+ release fluxes measured at low and high SR Ca2+ loading conditions (i.e. 1 and 5 mm [Ca2+]o). To quantify the effects of changing the SR Ca2+ load on the magnitude and duration of [Ca2+] and release flux signals, we measured the peak amplitude and time constant of decay of the signals (Fig. 3_C_). Figure 4_A_ and Table 2 summarize these measurements. It can be seen that the magnitude of the release fluxes gradually increased as [Ca2+]o was raised from 1 to 5 mm. Raising [Ca2+]o to 10 mm did not cause a further increase in the magnitude of the Ca2+ release flux. These results could be explained by a gradual increase in the SR Ca2+ content until a maximal load is reached at 5 mm. The [Ca2+]o dependence of the release flux decay is a mirror image of the [Ca2+]o dependence of the release flux magnitude: the time constant of decay first decreases and then levels off at 5 mm [Ca2+]o. These results suggest that there may be a correlation between the magnitude of Ca2+ release flux and its decay. Figure 4_B_ shows a linear relationship between the peak amplitude and time constant of decay of the local Ca2+ release flux signals. It can be seen that these two parameters are, indeed, highly correlated. To determine to what extent these results are influenced by selection of parameter values of the model, we examined the effects of variations of parameter values on the magnitude and rate of decay of the release flux. Changing values of resting [Ca2+]i (from 75 to 150 nm), [dye]T (from 20 to 100 μm), fluo-3 Ca2+ affinity (from 400 to 1000 nm), maximal SR Ca2+ pump rate (from 500 to 3000 nm ms−1) or cellular buffer concentration (from 150 to 300 μm) resulted in up to 2-fold changes in the absolute values of release flux amplitude, and decay rate. However, the relative increases in amplitude and rate of decay of flux upon elevation of SR Ca2+ load remained constant at all parameter values. Thus, the observed increase in the rate of Ca2+ flux decay at higher flux amplitudes is not affected by selection of parameter values. These results suggest that Ca2+ release during sparks is controlled by a negative control mechanism such as Ca2+-dependent inactivation or adaptation. Alternatively, Ca2+ termination of release fluxes could be attributed to depletion of Ca2+ from the SR
Figure 3. The effect of increasing SR Ca2+ load on Ca2+ sparks and the underlying Ca2+ release fluxes.
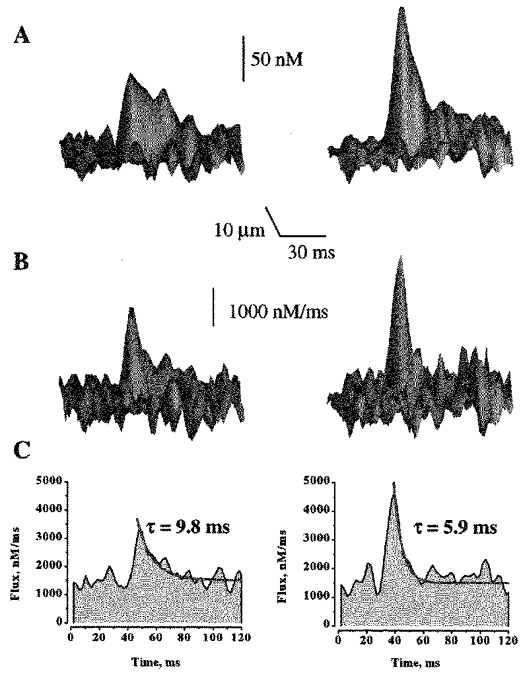
A and B, representative surface plots of Ca2+ sparks and associated Ca2+ release fluxes measured in the presence of 1 and 5 mm Ca2+ in the extracellular solution. The signals were obtained from single release events measured before and after raising [Ca2+]o from 1 to 5 mm in the same cell. C, line plots of Ca2+ release fluxes through the peaks of the signals shown in B. The release flux decays were best fitted by single exponentials functions (red lines). Background [Ca2+]i at 1 mm [Ca2+]i was assumed to be 100 nm; background [Ca2+]i at 5 mm [Ca2+]o was extrapolated to be 124 nm.
Figure 4. The effect of changing SR Ca2+ load on the magnitude and time constant of decay of local release fluxes.
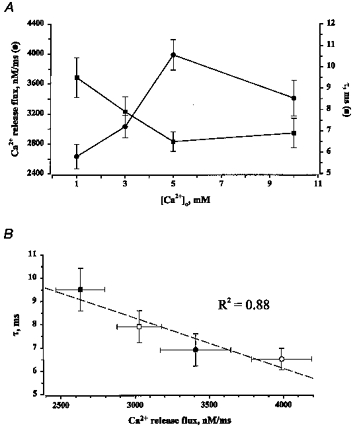
A, dependency of magnitude (•) and time of decay of local release fluxes (▪) on [Ca2+] in the extracellular solution. B, linear relationship between the peak amplitude of the release flux and time constant of its decay (_r_2 = 0.88) at various [Ca2+] (▪, 1 mm; □, 3 mm; ○, 5 mm; •, 10 mm). The values are means (±s.e.m.) obtained from 15–30 individual sparks.
Table 2.
The effects of [Ca2+]o and FK506 on the amplitude and decay of Ca2+ sparks and associated Ca2+ release fluxes
| [Ca2+]o (mm) | 1 | 3 | 5 | 10 | 5 | |
|---|---|---|---|---|---|---|
| FK506 (μm) | 0 | 0 | 0 | 0 | 50 | |
| [Ca2+] signal | Amplitude (nm) | 102 ± 5 | 126 ± 8 | 174 ± 12 * | 154 ± 13 * | 167 ± 12 |
| Decay time constant (ms) | 16.6 ± 3.6 | 14.7 ± 1.4 | 10.8 ± 1.0 * | 13.6 ± 1.2 | 29.5 ± 2.9 † | |
| Release flux | Amplitude (nm ms−1) | 2632 ± 163 | 3029 ± 150 | 3887 ± 202 | 3406 ± 236 * | 3519 ± 260 |
| Decay time constant (ms) | 9.5 ± 0.9 | 7.9 ± 0.7 | 6.5 ± 0.5 * | 6.9 ± 0.7 | 11.2 ± 1.0 † |
Effect of FK506
To evaluate the possibility that decay of Ca2+ release during sparks is caused by local depletion of SR Ca2+ we tested the effects of FK506 on release fluxes underlying sparks. FK506 has been shown to reduce the rate of closure of single RyRs in lipid bilayers and increase the duration of sparks in cardiac myocytes (Xiao, Valdivia, Bogdanov, Valdivia, Lakatta & Cheng, 1997). Examples of linescan images of Ca2+ sparks measured before and after addition of 50 μm FK506 are shown in Fig. 4_A_. It can be seen that the duration of sparks is increased dramatically.
The effects of FK506 on the spatio-temporal properties of sparks and associated release fluxes are illustrated in Fig. 5 and summarized in Table 2. It can be seen that the magnitudes of these signals are comparable to those under control conditions. At the same time, the duration of the [Ca2+] and release flux signals increased 2.6- and 1.7-fold, respectively. These experiments clearly show that normally not all the Ca2+ is released from the SR, and thus SR Ca2+ depletion is not the primary factor that determines termination of release during sparks.
Figure 5. The effect of FK506 on Ca2+ sparks and associated release fluxes.
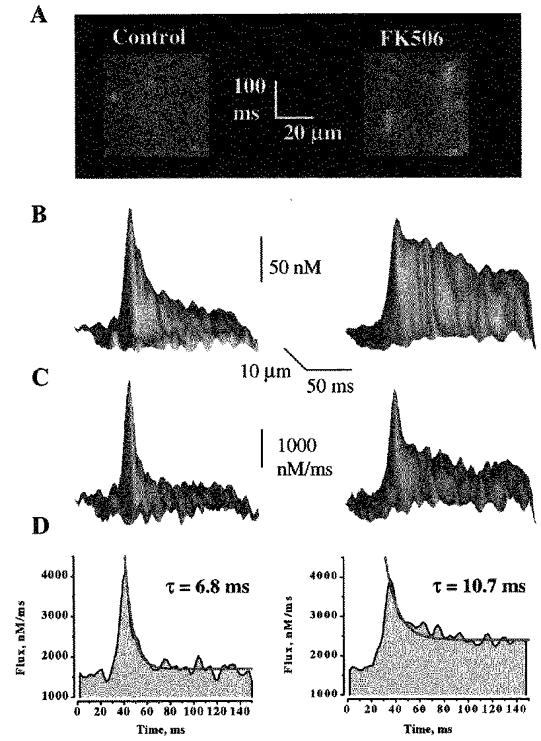
A, linescan images of Ca2+ sparks before and after administration to the bathing solution of 50 μm FK506. The horizontal and vertical calibration bars represent 20 μm and 100 ms, respectively. B and C, surface plots of Ca2+ sparks and underlying release fluxes measured in the presence and the absence of FK506. The signals were obtained by averaging 8 individual release events before and after administration of 50 μm FK506. D, time-dependent line plots of Ca2+ release fluxes through the peaks of the signals shown in C. The decays of the fluxes were best fitted by single exponential functions (red lines).
Interestingly, despite the significant increase in duration of the release flux, most sparks still remained spatially localized (Fig. 5_A_). Only in a few instances did prolonged sparks become initiation sites for propagating Ca2+ waves (not shown). These results suggest that rapid termination is not essential for spatial confinement of release.
DISCUSSION
Here we report on the first systematic attempt to investigate the mechanism responsible for termination of Ca2+ release during sparks in cardiac myocytes. Our principal finding is that the rate of decay of release flux underlying sparks is directly related to the amount of Ca2+ released and can be modulated pharmacologically by FK506, a compound that has been shown to alter inactivation properties of the Ca2+ release channel. These results suggest that termination of Ca2+ release during the local release events involves a negative control mechanism at the level of Ca2+ release channel gating.
The local Ca2+ release flux during Ca2+ sparks was derived by adapting the methods used to describe macroscopic Ca2+ release from cell-averaged Ca2+ transients in skeletal (Melzer et al. 1987) and cardiac muscle (Sipido & Wier, 1991). The main modification made to these previous methods was that in order to account for the spatial heterogeneity of the local Ca2+ release fluxes, we considered the diffusion of Ca2+ and Ca-dye complex. A similar approach was recently used to derive SR Ca2+ release fluxes associated with Ca2+ sparks in cat atrial myocytes (Blatter, Hüser & Rios, 1997). The obtained values of peak release fluxes (2–5 mm s−1) are comparable to those reported for cell-averaged Ca2+ transients in guinea-pig ventricular myocytes (2.7-9.5 mm s−1; Sipido & Wier, 1991) and for Ca2+ sparks in cat atrial cells (∼10 mm s−1; Blatter et al. 1997).
Ultrastructural evidence suggests that about twenty-two release channels are present in a typical SR junction cleft (based on an estimated average area of 0.02 μm2 for the junctional SR and a foot spacing of 30 nm; Protasi, Sun & Franzini-Armstrong, 1996). According to computations by Langer & Peskoff (1995), a Ca2+ influx of 9 mm s−1 (comparable to 5 mm s−1 found in this study) into the narrow diadic cleft increases [Ca2+] to 600 μm (cleft centre) −100 μm (cleft periphery). At these Ca2+ concentrations, all or most of the Ca2+ channels in the cleft should be activated. Activation of the cluster probably begins from a spontaneous opening of a single Ca2+ release channel, which activates a chain reaction of CICR involving the rest of the channels in the cleft (‘cluster bomb’ scenario; Stern, 1992).
After initial activation, the Ca2+ release flux rapidly decayed. Defining the mechanism of this decay constituted the main goal of the present study. As mentioned in the Introduction, there are three types of mechanism that could account for the termination of release flux: (1) stochastic attrition (Stern, 1992); (2) local depletion of Ca2+ from the SR; and, (3) an active extinguishing process involving alterations in channel gating. Stern (1992) has shown that stochastic attrition is very sensitive to the number of channels and to the amount of the positive feedback gain that sustains CICR in the regenerative cluster. Thus, greater SR Ca2+ fluxes would be expected to result in slower flux decays. In contrast to this expectation, our results clearly showed that termination of release flux is faster for large Ca2+ release fluxes than for small release fluxes. Therefore, our results are inconsistent with release termination being a result of a stochastic decay mechanism. The possibility that termination of release during sparks is primarily due to local depletion of Ca2+ in the SR is inconsistent with the results of our experiments with the RyR gating modulator, FK506. This compound significantly slowed down the rate of decay of the release flux, indicating that under control conditions not all available Ca2+ is released from the SR. However, we cannot rule out partial depletion as a contributing factor to the decay of the local release flux. Taken together, our results suggest that decay of release during a spark involves an extinguishing mechanism at the level of Ca2+ release channel gating. This mechanism could be Ca2+-dependent inactivation (Fabiato, 1985) or adaptation (Györke & Fill, 1993; Yasui et al. 1994). It also could involve the reported ability of the Ca2+ release channel to respond to changes in lumenal [Ca2+] (Sitsapeasan & Williams, 1994; Lukyanenko et al. 1997). Based on the present results, we cannot distinguish among these possibilities.
The increase in duration of sparks and associated release fluxes in the presence of FK506 is in agreement with the results of Xiao, Lakatta & Cheng (1996) regarding the effects of FK506 on Ca2+ sparks in rat ventricular myocytes, and are also consistent with the ability of the drug to reduce adaptive inactivation by RyRs in isolated vesicle preparations (Györke, Dettbarn & Palade, 1994) and in lipid bilayers (Xiao et al. 1997). These results support the possibility that termination of release flux during sparks involves adaptive inactivation of the release channels. McCall and co-workers (McCall, Satoh, Shannon, Blatter & Bers, 1996) found no significant effect of FK506 on duration of sparks, using of 10 μm of the drug. In our experiments, we routinely used 50 μm of FK506; however, in several preliminary experiments, 10 μm FK506 had a similar potentiating effect on spark duration. At the present time, we do not know the reason for these differences in results.
It has been suggested that Ca2+-dependent inactivation serves as a negative feedback control mechanism to prevent CICR from self-regeneration. Our experiments with FK506 showed that, despite the significant increase in time of decay of local release fluxes, most sparks remained localized and did not trigger release from adjacent release sites. Thus, it appears that the most important factor for preventing the spread of CICR is not inactivation, but spatial segregation of release sites, as suggested by Stern (1992). The role of release inactivation in suppressing regenerative release may become increasingly important under conditions of Ca2+ overload, when the tendency for generating propagating waves is augmented. This possibility is consistent with our preliminary results showing that, in Ca2+ overloaded myocytes, FK506 substantially increased the frequency of propagating and abortive Ca2+ waves. In addition, inactivation of release could play a role in preventing excessive Ca2+ loss from the SR during Ca2+ release and allowing the stores to be rapidly reloaded following release.
Acknowledgments
We are grateful to Dr Michael Stern for kindly providing us with a simulated calcium spark. We thank Drs R. Nathan and A. Neely for critical reading of the manuscript. This work was supported by the NIH (HL 52620). S. Györke is an Established Investigator of the American Heart Association.
References
- Bers DM. Excitation-Contraction Coupling and Cardiac Contractile Force. Dordrecht, The Netherlands: Kluwer Academic Publishers; 1991. [Google Scholar]
- Beuckelmann DJ, Wier WG. Mechanism of release of calcium from sarcoplasmic reticulum of guinea-pig cardiac cells. Journal of Physiology. 1988;405:233–255. doi: 10.1113/jphysiol.1988.sp017331. [DOI] [PMC free article] [PubMed] [Google Scholar]
- Blatter LA, Hüser J, Rios E. Sarcoplasmic reticulum Ca2+ release flux underlying Ca2+ sparks in cardiac muscle. Proceedings of the National Academy of Sciences of the USA. 1997;94:4176–4181. doi: 10.1073/pnas.94.8.4176. [DOI] [PMC free article] [PubMed] [Google Scholar]
- Cannell MB, Berlin JR, Lederer WJ. Effect of membrane potential changes on the calcium transient in single rat cardiac muscle cells. Science. 1987;238:1419–1423. doi: 10.1126/science.2446391. [DOI] [PubMed] [Google Scholar]
- Carslaw HS, Jaeger JC. Conduction of Heat in Solids. 2. Oxford, UK: Clarendon Press; 1959. p. 245. [Google Scholar]
- Cheng H, Lederer W, Cannell MB. Calcium sparks: elementary events underlying excitation-contraction coupling in heart muscle. Science. 1993;262:740–744. doi: 10.1126/science.8235594. [DOI] [PubMed] [Google Scholar]
- Escobar AL, Cifuentes F, Vergara JL. Detection of Ca2+-transients elicited by flash photolysis of DM-nitrophen with a fast calcium indicator. FEBS Letters. 1995;364:335–338. doi: 10.1016/0014-5793(95)00425-9. 10.1016/0014-5793(95)00425-9. [DOI] [PubMed] [Google Scholar]
- Fabiato A. Time and calcium dependence of activation and inactivation of calcium-induced calcium release of calcium from the sarcoplasmic reticulum of a skinned canine cardiac Purkinje cell. Journal of General Physiology. 1985;85:291–320. doi: 10.1085/jgp.85.2.291. 10.1085/jgp.85.2.291. [DOI] [PMC free article] [PubMed] [Google Scholar]
- Györke S, Dettbarn C, Palade P. FK-506 influences adaptive behavior of the SR ryanodine receptor. Biophysical Journal. 1994;66:A225. [Google Scholar]
- Györke S, Fill M. Ryanodine receptor adaptation: control mechanism of Ca2+-induced Ca2+ release in heart. Science. 1993;260:807–809. doi: 10.1126/science.8387229. [DOI] [PubMed] [Google Scholar]
- Györke S, Lukyanenko V, Györke I. Dual effects of tetracaine on spontaneous calcium release in rat ventricular myocytes. Journal of Physiology. 1997;500:297–309. doi: 10.1113/jphysiol.1997.sp022021. [DOI] [PMC free article] [PubMed] [Google Scholar]
- Györke S, Palade P. Role of local Ca2+ domains in activation of Ca2+-induced Ca2+ release in crayfish muscle. American Journal of Physiology. 1993;264:C1505–1512. doi: 10.1152/ajpcell.1993.264.6.C1505. [DOI] [PubMed] [Google Scholar]
- Harkins AB, Kurebayashi N, Baylor SM. Resting myoplasmic free calcium in frog skeletal muscle fibers estimated with fluo-3. Biophysical Journal. 1993;65:865–881. doi: 10.1016/S0006-3495(93)81112-3. [DOI] [PMC free article] [PubMed] [Google Scholar]
- Hove-Madsen L, Bers DM. Passive buffering and SR Ca uptake in permeabilized rabbit ventricular myocytes. American Journal of Physiology. 1993;264:C677–686. doi: 10.1152/ajpcell.1993.264.3.C677. [DOI] [PubMed] [Google Scholar]
- Langer GA, Peskoff AP. Calcium concentration and movement in the diadic cleft space of the cardiac ventricular cell. Biophysical Journal. 1996;70:1169–1182. doi: 10.1016/S0006-3495(96)79677-7. [DOI] [PMC free article] [PubMed] [Google Scholar]
- Lipp P, Niggli E. Modulation of Ca2+ release in cultured neonatal rat cardiac myocytes. Circulation Research. 1994;74:979–990. doi: 10.1161/01.res.74.5.979. [DOI] [PubMed] [Google Scholar]
- Lipp P, Niggli E. Submicroscopic calcium signals as fundamental events of excitation-contraction coupling in guinea-pig cardiac myocytes. Journal of Physiology. 1996;492:31–38. doi: 10.1113/jphysiol.1996.sp021286. [DOI] [PMC free article] [PubMed] [Google Scholar]
- Lukyanenko V, Györke I, Györke S. Regulation of calcium release by calcium inside the sarcoplasmic reticulum in ventricular myocytes. Pflügers Archiv. 1997;432:1047–1054. doi: 10.1007/s004240050233. [DOI] [PubMed] [Google Scholar]
- McCall E, Li L, Satoh H, Shannon TR, Blatter LA, Bers DM. Effects of FK-506 on contraction and Ca2+ transients in rat myocytes. Circulation Research. 1996;79:1110–1121. doi: 10.1161/01.res.79.6.1110. [DOI] [PubMed] [Google Scholar]
- Melzer W, Rios E, Schneider MF. A general procedure for determining the rate of calcium release from the sarcoplasmic reticulum in skeletal muscle fibers. Biophysical Journal. 1987;51:849–863. doi: 10.1016/S0006-3495(87)83413-6. [DOI] [PMC free article] [PubMed] [Google Scholar]
- Protasi F, Sun X-H, Franzini-Armstrong C. Formation and maturation of the calcium release apparatus in developing and adult avian myocardium. Developmental Biology. 1996;173:265–278. doi: 10.1006/dbio.1996.0022. [DOI] [PubMed] [Google Scholar]
- Sipido KR, Wier WG. Flux of Ca2+ across the sarcoplasmic reticulum of guinea-pig cardiac cells during excitation-contraction coupling. Journal of Physiology. 1991;435:605–630. doi: 10.1113/jphysiol.1991.sp018528. [DOI] [PMC free article] [PubMed] [Google Scholar]
- Sitsapeasan R, Williams AJ. Regulation of the gating of the sheep cardiac sarcoplasmic reticulum Ca2+-release channel by lumenal Ca2+ Journal of Membrane Biology. 1994;137:215–226. doi: 10.1007/BF00232590. [DOI] [PubMed] [Google Scholar]
- Stern MD. Theory of excitation-contraction coupling in cardiac muscle. Biophysical Journal. 1992;63:495–517. doi: 10.1016/S0006-3495(92)81615-6. [DOI] [PMC free article] [PubMed] [Google Scholar]
- Stern MD, Lakatta E. Excitation-contraction in the heart: the state of the question. FASEB Journal. 1992;6:3092–3100. doi: 10.1096/fasebj.6.12.1325933. [DOI] [PubMed] [Google Scholar]
- Tang Y, Othmer HG. A model of calcium dynamics in cardiac myocytes based on the kinetics of ryanodine-sensitive calcium channels. Biophysical Journal. 1994;67:2223–2235. doi: 10.1016/S0006-3495(94)80707-6. [DOI] [PMC free article] [PubMed] [Google Scholar]
- Xiao RP, Lakatta EG, Cheng H. Alteration of the elementary calcium release events by FK506 binding protein in cardiac myocytes. Biophysical Journal. 1996;70:A254. [Google Scholar]
- Xiao R-P, Valdivia HH, Bogdanov K, Valdivia C, Lakatta EG, Cheng H. The immunophilin FK506-binding protein modulates Ca2+-release channel closure in rat heart. Journal of Physiology. 1997;500:343–354. doi: 10.1113/jphysiol.1997.sp022025. [DOI] [PMC free article] [PubMed] [Google Scholar]
- Yasui K, Palade P, Györke S. Negative control mechanism with features of adaptation controls Ca2+ release in cardiac myocytes. Biophysical Journal. 1994;67:457–460. doi: 10.1016/S0006-3495(94)80501-6. [DOI] [PMC free article] [PubMed] [Google Scholar]