“Optical Patch-clamping”: Single-channel Recording by Imaging Ca2+ Flux through Individual Muscle Acetylcholine Receptor Channels (original) (raw)
Abstract
We describe an optical technique using total internal reflection fluorescence (TIRF) microscopy to obtain simultaneous and independent recordings from numerous ion channels via imaging of single-channel Ca2+ flux. Muscle nicotinic acetylcholine (ACh) receptors made up of αβγδ subunits were expressed in Xenopus oocytes, and single channel Ca2+ fluorescence transients (SCCaFTs) were imaged using a fast (500 fps) electron-multiplied c.c.d. camera with fluo-4 as the indicator. Consistent with their arising through openings of individual nicotinic channels, SCCaFTs were seen only when a nicotinic agonist was present in the bathing solution, were blocked by curare, and increased in frequency as roughly the second power of [ACh]. Their fluorescence amplitudes varied linearly with membrane potential and extrapolated to zero at about +60 mV. The rise and fall times of fluorescence were as fast as 2 ms, providing a kinetic resolution adequate to characterize channel gating kinetics; which showed mean open times of 7.9 and 15.8 ms when activated, respectively, by ACh or suberyldicholine. Simultaneous records were obtained from >400 channels in the imaging field, and we devised a novel “channel chip” representation to depict the resultant large dataset as a single image. The positions of SCCaFTs remained fixed (<100 nm displacement) over tens of seconds, indicating that the nicotinic receptor/channels are anchored in the oocyte membrane; and the spatial distribution of channels appeared random without evidence of clustering. Our results extend single-channel TIRFM imaging to ligand-gated channels that display only partial permeability to Ca2+, and demonstrate an order-of-magnitude improvement in kinetic resolution. We believe that functional single-channel imaging opens a new approach to ion channel study, having particular advantages over patch-clamp recording in that it is massively parallel, and provides high-resolution spatial information that is inaccessible by electrophysiological techniques.
INTRODUCTION
Recent developments in optical technology have made it possible to image the activity of individual ion channels (Zou et al., 1999, 2002, 2004a,b; Harms et al., 2001, 2003; Wang et al., 2001, 2004; Sonnleitner et al., 2002; Borisenko et al., 2003; Demuro and Parker, 2003, 2004, 2005; Sonnleitner and Isacoff, 2003; Peng et al., 2004a,b). Such approaches hold potential as a complement to the well-established patch-clamp technique for single-channel recording (Neher and Sakmann, 1976; Hamill et al., 1981), and have particular advantages over electrophysiological techniques in that they provide spatial information regarding channel locations, permit simultaneous recording from numerous channels, and are applicable to channels that are inaccessible to a patch-clamp pipette (Sonnleitner and Isacoff, 2003). However, optical imaging had not yet achieved a sufficient fidelity (temporal resolution and signal-to-noise ratio) to represent a practicable means for studying single channel kinetics.
The most immediately promising approach utilizes highly sensitive fluorescent Ca2+ indicator dyes to monitor SCCaFTs (single channel Ca2+ fluorescent transients) that arise from local elevations in cytosolic [Ca2+] around open Ca2+-permeable membrane channels (Zou et al., 1999, 2002, 2004a,b; Wang et al., 2001, 2004; Demuro and Parker, 2003, 2004, 2005; Peng et al., 2004a,b). Ca2+ concentration changes in the immediate vicinity of the channel mouth are expected to closely track the opening and closing of the channel, whereas signals at greater distances from the channel are slowed and reduced in amplitude owing to diffusion of Ca2+ and Ca2+-bound indicator away from the local microdomain (Shuai and Parker, 2005). Thus, kinetic resolution is enhanced by monitoring Ca2+-dependent fluorescence from very small cytosolic volumes immediately adjacent to the plasma membrane. Theoretical studies (Shuai and Parker, 2005) indicate that a sampling volume of around 0.1 fl should be optimal; providing fluorescence signals able to track the gating kinetics of a channel carrying a Ca2+ current as little as 0.1 pA with a time resolution approaching 1 ms and a signal-to-noise ratio >10. Although the kinetic resolution is predicted to improve with yet smaller volumes, they encompass so few dye molecules that the signal-to-noise ratio becomes seriously degraded.
Various optical techniques, including confocal (Demuro and Parker, 2003), multiphoton, and total internal reflection fluorescence microscopy (TIRFM) (Axelrod, 2003; Demuro and Parker, 2004, 2005), are capable of monitoring fluorescence from such subfemtoliter volumes within cells. Among these, we favor TIRFM for imaging the activity of plasma membrane channels (Demuro and Parker, 2004, 2005; Shuai and Parker, 2005), because the restriction in fluorescence excitation to a very thin (∼100 nm) evanescent wave resulting from total internal reflection at a refractive index boundary minimizes the sampling volume. Moreover, a two dimensional (x-y) image of this thin optical section can be recorded by a camera, rather than requiring the raster scanning of a confocal laser spot where mechanical constraints restrict the maximal imaging speed. We had previously demonstrated TIRFM images capturing the simultaneous activity of >100 individual voltage-gated N-type Ca2+ channels expressed in Xenopus oocytes. However, the time resolution was only 33 ms, limited by the frame rate of the video camera employed for those experiments (Demuro and Parker, 2004, 2005).
We now describe advances that greatly enhance the utility and resolution of this “optical patch-clamp” technique. Using an ultra-fast, high-sensitivity camera we achieve an order-of-magnitude improvement in temporal resolution to ∼2 ms. Moreover, by imaging the activity of muscle nicotinic acetylcholine receptor/channels (nAChR) expressed in Xenopus oocytes, we extend the applicability of TIRFM single-channel recording from voltage-gated Ca2+ channels to encompass the numerous types of ligand-gated ion channels in which only a small fraction of the total current is carried by Ca2+ ions.
MATERIALS AND METHODS
Oocyte Preparation and Electrophysiology
Experiments were performed on defolliculated stage VI oocytes obtained from Xenopus laevis (Demuro and Parker 2004). Plasmids containing cDNA clones coding for the muscle nicotinic receptor α, β, γ, and δ subunits were linearized and transcribed in vitro, and cRNAs (α, β, γ, and δ in a molar ratio 2:1:1:1) were mixed to a final concentration of 0.1–1 μg/μl and injected (50 nl) into oocytes (Demuro et al., 2001). After 3–5 d the expression of nAChR was monitored by recording currents evoked by bath application of ACh (300 nM). Oocytes showing currents >1 μA at a holding potential of −60 mV were selected for imaging and were injected with fluo-4-dextran (MW 10,000 D; low-affinity version, KD for Ca2+ ∼3 μM) to a final intracellular concentration of ∼40 μM. After transferring to a hypertonic “stripping” solution (composition in mM: K aspartate, 200; KCl, 20; MgCl2, 1; EGTA, 10; HEPES, 10; pH 7.2; cooled to 4°C), the vitelline envelope was carefully torn apart and removed using pairs of fine forceps (Methfessel et al., 1986). Oocytes were then placed animal hemisphere-down in a chamber whose base was formed by a fresh, ethanol-washed microscope cover glass (Fisherbrand, type-545-M), and were bathed in a high-Ca2+ Ringer's solution (composition in mM: NaCl, 110; CaCl2, 6; KCl, 2; HEPES, 5; at pH 7.2). A gravity-fed superfusion system permitted exchange of the Ringer's solution for addition of agonists and antagonists, and the superfusion was stopped after allowing sufficient time for equilibration in the recording chamber to avoid vibrations when imaging. The membrane potential was clamped using a two-electrode voltage clamp (Gene Clamp 500; Axon Instruments). The voltage was held at 0 or −20 mV between recordings so as to reduce Ca2+ influx through expressed nicotinic channels to undetectable levels (see Fig. 7 B), and was stepped to strongly negative potentials (usually −150 mV) to increase the electrochemical driving force for Ca2+ entry when imaging. Data were discarded if the voltage clamp error exceeded ∼5 mV during large agonist-evoked currents.
Figure 7.

(A and B) Voltage dependence of Ca2+ flux through nAChR. (A) Superimposed traces show SCCaFTs recorded simultaneously from 10 channels in the presence of 30 nM ACh while the membrane potential was pulsed to the voltages indicated. (B) Mean SCCaFT amplitude as a function of membrane potential. Data are from 29 channels in 2 oocytes. Regression line extrapolates to zero at a potential of about +60 mV. (C and D) Concentration dependence of nAChR opening derived from SCCaFT kinetics. (C) Representative traces show SCCaFTs evoked at 10 channel sites while an oocyte was polarized to −150 mV while successively superfusing 3, 10, and 30 nM ACh. (D) Relationship between [ACh] in the superfusate and channel open probability, as measured by the fraction of time individual channel sites displayed SCCaFTs. Data are from 43 channels (2 oocytes).
TIRFM Imaging
Imaging was accomplished using a home-built TIRF microscope system (Fig. 1 A) based around an Olympus IX 70 microscope equipped with an Olympus 60× TIRFM objective (NA = 1.45). Excitation light from the expanded beam of an argon ion laser (488 nm) was reflected by a dichroic mirror and brought to a focus at the rear focal plane of the objective. Translation of a focusing lens allowed the beam to be introduced either at the extreme edge of the objective aperture (for TIRF excitation) or more centrally (for “wide field” excitation). An adjustable rectangular aperture placed at a conjugate image plane in the excitation path restricted illumination to within the imaging field of the camera, and the aperture was overfilled by collimated laser light emerging from a 10× beam expander to provide Koehler illumination. Emitted fluorescence was collected through the same objective and passed through an Olympus fluorescence cube (490 nm dichroic, 510–600 nm band-pass barrier filter). A major improvement over our original system (Demuro and Parker, 2004) was the replacement of an intensified video camera by a cooled, back-illuminated c.c.d. camera with on-chip electron multiplication (Cascade 128+; Roper Scientific), which provides full frame (128 × 128 pixel; 1 pixel = 0.33 μm at the specimen) images at a rate of 500 s−1. For the experiment of Fig. 8 we replaced this with a Cascade 650, which provides a better spatial resolution (650 × 512 pixels; 1 pixel = 0.082 μm) at the expense of slower frame rate (50 fps). Image data were streamed to computer memory and then stored on disc for offline analysis using the MetaMorph software package (Universal Imaging). An electronic shutter blocked the laser beam except when imaging, and its opening was synchronized by a computer that also applied hyperpolarizing pulses via the voltage clamp.
Figure 1.
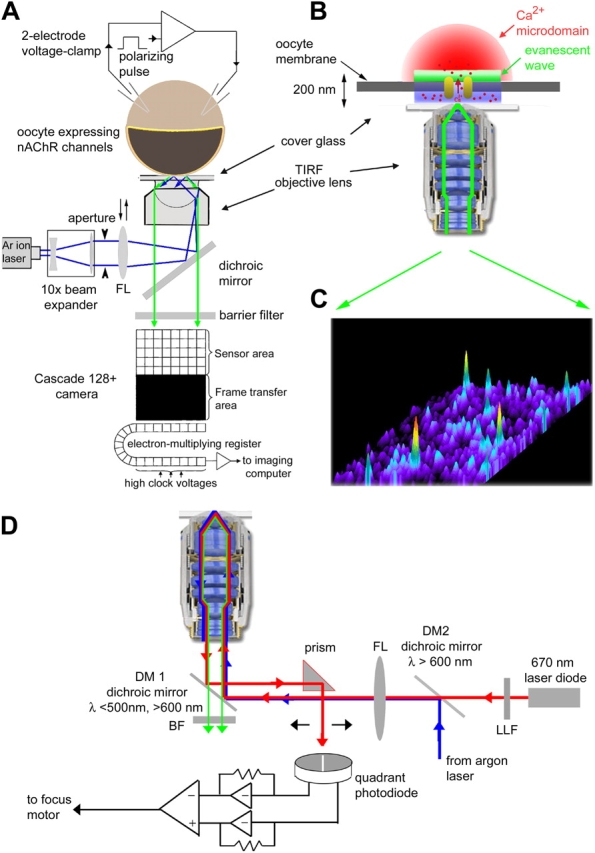
Schematic of the TIRFM imaging system for single-channel imaging. (A) Overview of the experimental system, constructed around an Olympus IX71 inverted microscope. For clarity, the schematic shows only the imaging light path, with the autofocus system omitted. The beam (488 nm) from a 50-mW argon ion laser passed through a 10× beam expander and was focused by a lens (FL; f = 150 mm) via a dichroic mirror (DM) to a spot at the back focal plane of the objective lens (Olympus TIRFM 60×, oil immersion, NA = 1.45). The focusing lens was mounted on a micrometer-driven translation stage, so that the laser beam could be adjusted to enter the periphery of the objective aperture so as to achieve total internal reflection at the interface between the cover glass and the aqueous bathing medium. An adjustable rectangular knife-blade aperture located at a conjugate image plane restricted excitation to the field imaged by the camera. Fluorescence excited in the specimen by the evanescent wave was collected through the objective lens, passed through the dichroic mirror and a barrier filter and was imaged by a Photometrics Cascade 128+ camera (Roper Scientific). The camera utilizes a back-illuminated frame transfer ccd with on-chip electron multiplication, and images (128 × 128 pixels; 0.33 μm per pixel) were captured at a frame rate of 500 s−1 with minimal dark and readout noise. An oocyte expressing nicotinic AChR channels was loaded with fluo-4 dextran, stripped of its vitelline envelope, and allowed to adhere (animal hemisphere down) to a coverglass forming the base of the imaging chamber. Its membrane potential was controlled by a two-electrode voltage clamp, and stepped to strongly negative potentials to enhance Ca2+ influx. (B) Enlarged view (not to scale) illustrating the imaging of near-membrane fluorescent signals from the Ca2+ microdomain (red) around a single open channel by the evanescent wave (green) formed by the TIRF objective lens. (C) Single image frame (2 ms exposure time) obtained by TIRFM illustrating Ca2+ signals from simultaneous opening of nAChR channels within a 40 × 40 μm patch of oocyte membrane. Increasing [Ca2+] is denoted both by “warmer” colors and by height. (D) Schematic of autofocus system. Light paths show: blue, 488 nm excitation beam; red, 670 nm guide beam; green, emitted fluorescence. Components include: 670 laser diode (4 mW; Edmund Optics); LLF, 670 nm laser line filter; DM2, dichroic mirror, 600 nm, to combine 670 and 488 nm laser beams; FL, focus lens; DM1, dichroic mirror transmitting between 500 and 600 nm; BF, barrier filter, sharp band pass between 510 and 600 nm to block 488- and 670-nm laser light from the imaging camera; quadrant photodetector module (Phresh Photonics). See text for further details.
Figure 8.

Lack of motility of nAChR expressed in the oocyte membrane. (A) Sequence of single image frames shows SCCaFTs evoked at a single site during successive recording periods at ∼10-s intervals. Crosshairs mark the centroid position of the first SCCaFT imaged. (B) Fluorescence traces measured from a 0.6 × 0.6 μm square region of interest centered on the crosshairs in A. The oocyte was repeatedly hyperpolarized (3-s pulses) to −150 mV in the continued presence of 300 nM ACh, and rest intervals of ∼5 s were allowed between each record. (C) Scatter plot shows the centroid positions of SCCaFTs evoked during these recordings. (D) Plot shows the displacement of SCCaFT centroid positions relative to their mean for all events as a function of time through the roughly 60-s total recording.
Autofocus System
We initially experienced considerable difficulties with focus drift while imaging, as the extremely narrow depth of field of the high aperture objective lens meant that a shift of only ∼100 nm produced unacceptable blurring. To mitigate this problem, we constructed an auotofocus system (Fig. 1 D). This was based on the principle that reflected light from the glass/water interface at the coverglass passing back through the objective lens undergoes a lateral shift with changing focus. We therefore introduced light from a red laser into the excitation light path to act as a guide beam, combining it with the expanded beam from the argon ion laser by means of a 600-nm dichroic mirror. After undergoing total internal reflection at the specimen, the “outgoing” red light from the objective was reflected by the primary dichroic and diverted by a small prism (positioned clear of the “incoming” laser beams) onto a quadrant photodiode. The difference signal between the left and right segments of the quadrant detector was then amplified and used to drive a motor attached through a reduction gear to the microscope fine focus control, thereby establishing a negative feedback loop that maintained focus despite temperature drifts and settling of the imaging chamber. The desired focus setting was established using a micrometer-driven translation stage to position the quadrant detector with respect to the reflected guide beam.
Image Processing and Analysis
All data presented here were processed as illustrated in Fig. 2 to correct for two distorting factors. First, the ‘raw’ magnitude of basal fluorescence and fluorescence during SCCaFTs differed between different locations in the imaging field, likely arising both because of inhomogeneities in the laser excitation light and from irregularities in the contact patch between the oocyte membrane and the cover glass. To normalize for this, we formed ratio images by dividing each black level-corrected “raw” frame in a record (Fig. 2 A) by an average of ∼100 frames acquired before applying a hyperpolarizing step (Fig. 2 B). The fluorescence signal at any pixel in the resulting image (Fig. 2 C) thus represents the change in fluorescence (ΔF) as a fraction of the resting fluorescence (Fo) at basal intracellular [Ca2+]. Second, the local fluorescence in the immediate vicinity of a channel responded not only to Ca2+ entering through that channel, but also showed smaller, slow changes owing to diffusive spread of Ca2+ from neighboring channels. To minimize this effect we formed a highly smoothed copy of each frame (Gaussian blur with width of 10 pixels; 3.3 μm; Fig. 2 D), and subtracted this from its original ratio image to form the final, corrected image sequence (Fig. 2 E). After processing in this way, measurements of fluorescence from small (∼0.6 × 0.6 μm) regions of interest centered on channels showed a more stable baseline (Fig. 2, compare F and G).
Figure 2.

Image processing. (A–E) Illustration of processing steps. (A) Example of a “raw,” unprocessed frame acquired during polarization to −150 mV in the presence of ACh, showing several SCCaFTs. (B) Averaged image of background fluorescence, formed by averaging 100 frames at a holding potential of 0 mV before the hyperpolarizing step was applied to induce SCCaFTs. (C) Ratio image formed by dividing A by B. (D) Heavily smoothed (10 × 10 pixel) image formed from C. (E) Final, corrected image formed by subtracting D from C. For clarity of presentation, contrast settings are individually adjusted for each panel. (F) Representative example of SCCaFTs at a single channel site, derived from a sequence of ratio images like that in C. The trace represents mean fluorescence ratio within a region of interest (0.6 × 0.6 μm) centered on a channel. (G) Corresponding record from the same channel, derived after frame-by-frame subtraction of a heavily smoothed copy of each image as illustrated in E.
Fluorescence traces such as those in Fig. 2 G showing SCCaFTs at individual channels were stored as ASCII text files, and were imported into Origin 6.0 (Microcal) for further analysis and plotting. The contour maps of Popen in Fig. 10 (E and F) were formed from a spreadsheet containing x,y coordinates and Popen values of 236 channels using the “convert to matrix” function in Origin, with gridding parameters of 60 × 60 matrix, search radius = 2, smoothness = 0.8. “Channel chip” representations of channel activity (Fig. 3 C and Fig. 10 A) were formed by importing ASCII text files of SCCaFT fluorescence into Image J (http://rsb.info.nih.gov/ij/) using the “text image” function.
Figure 10.
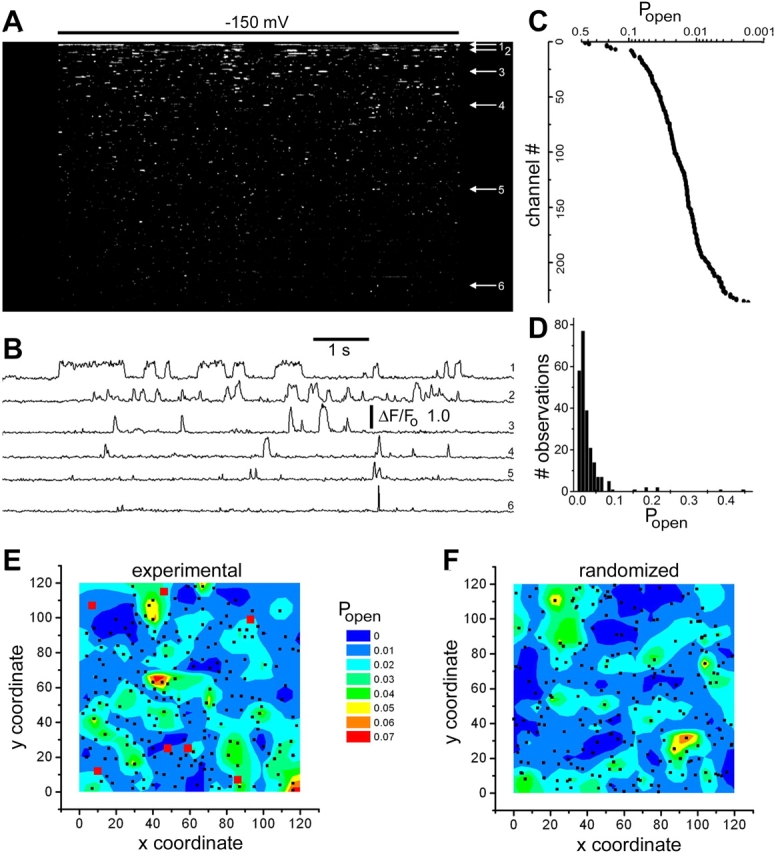
Spatial mapping of channel open probability. (A) Channel-chip representation, showing the simultaneous activity of 236 channels within a 40-μm square imaging field. The oocyte was continually exposed to 1 μM ACh, and the membrane potential was stepped from 0 to −150 mV for 7 s as indicated by the bar. The channels are arranged (from top to bottom) in order of decreasing open probability as calculated from the proportion of time during the hyperpolarizing pulse for which the SCCaFT amplitude exceeded one half of the mean maximal value for that channel. (B) Representative traces showing local fluorescence ratio measurements from the six channels marked by arrows in A. (C) Channel open probabilities (Popen, plotted on logarithmic scale) corresponding to the 236 channels depicted in A. Data points represent the proportion of time for which the fluorescence at that channel exceeded one half of the mean maximum during a single, 7-s hyperpolarizing step. (D) Histogram shows the distribution of open probabilities among the 236 channels. (E) Three-dimensional color contour plot showing the distribution of channel open probabilities throughout the imaging field. Same experiment as A–D. Contours depict mean Popen on a 30 × 30 grid matrix, with different colors corresponding to Popen values as indicated by the scale. Seven channels had Popen values >0.1 and were omitted from this analysis to avoid compressing the color scale. Their positions are marked by red squares, and black dots mark the positions of all other channels. (F) The same color contour analysis of Popen as shown in E, but after randomizing the x-y coordinates of the channels (indicated by black dots). Data in this figure are representative of three similar experiments.
Figure 3.

Recording and depicting the simultaneous activity of hundreds of individual nAChR channels. (A) Functional map showing the locations of 191 channels within a 40 × 40 μm membrane patch. The map was constructed by visually identifying the coordinates of SCCaFTs observed throughout an 8-s imaging period during which the oocyte was polarized to −150 mV in the presence of 100 nM suberyldicholine. (B) Examples of single-channel recordings obtained by monitoring fluorescence from regions of interest (1 μm square) centered on 28 of the channels mapped in A. Traces were acquired simultaneously and show SCCaFTs resulting from Ca2+ influx during channel openings when the membrane was hyperpolarized. (C) Channel-chip depiction of the activity of all channels mapped in A. Channel openings (SCCaFTs) are represented as white streaks, time runs from left to right, and different channels (n = 191) are depicted vertically in random order. (D) Enlarged view of the region of the channel-chip boxed in white in C, showing the activities of 51 channels (numbered along the ordinate) during a shorter time period.
Online Supplemental Material
Online supplemental videos (available at http://www.jgp.org/cgi/content/full/jgp.200509331/DC1) show short image sequences of SCCaFTs, derived by image processing as in Fig. 2. Both videos show the same data. In Video 1, increases in cytosolic [Ca2+] are depicted simply on a gray scale; in Video 2, [Ca2+] is encoded both by color and by the height of each pixel.
RESULTS
TIRFM Imaging of Xenopus Oocytes
Oocytes expressing nAChR were injected with fluo-4 dextran and stripped of their surrounding vitelline envelope as described in MATERIALS AND METHODS. A critical aspect for satisfactory TIRFM imaging was to ensure a uniform and undamaged “contact patch” between the oocyte membrane and the coverglass forming the base of the imaging chamber. To this end we carefully selected stage VI oocytes, which had lost most of the microvilli from the oocyte membrane surface (Dumont, 1972). Use of stage VI oocytes reduced damage during removal of the vitelline envelope and facilitated a close apposition of the oocyte membrane to the coverglass. Moreover, it minimized artifacts that appeared to arise owing to Ca2+ trapped in microvilli folded between the oocyte membrane and the coverglass. After allowing the oocyte to settle for a few minutes on a fresh coverglass it was impaled by two microelectrodes for voltage clamping, and we searched for regions near the edge of the contact patch that appeared of relatively uniform basal fluorescence when viewed by TIRFM (e.g., Fig. 2 B), avoiding bright areas indicative of damage and high resting [Ca2+]. Oocytes often showed a punctate background fluorescence that increased with time after dye injection, probably owing to compartmentalization or slow binding of the indicator to fixed cellular structures. This problem was minimized by use of dextran-conjugated Fluo-4, and by imaging within ∼100 min of dye loading. Furthermore, we were able to almost completely suppress this background signal by turning on the laser excitation for ∼30 s before imaging, to bleach immobilized indicator trapped within the evanescent field.
Simultaneous Functional Imaging of Hundreds of Ligand-gated Channels
TIRFM Ca2+ imaging of membrane regions in oocytes expressing nAChR revealed numerous transient fluorescence “flashes” (SCCaFTs) when the membrane was hyperpolarized in the presence of nicotinic agonists (Videos 1 and 2, available at http://www.jgp.org/cgi/content/full/jgp.200509331/DC1). Such events were absent in control (non-nAChR–expressing oocytes; n = 22), and in nAChR-expressing oocytes in the absence of agonist (n = 35). Based on these findings, together with other results presented below and previous observations of SCCaFTs mediated by expressed voltage-dependent Ca2+ channels (Demuro and Parker, 2004), we conclude that SCCaFTs reflect Ca2+ influx through individual nAChR channels as they open.
By marking the positions of all SCCaFTs observed throughout an extended imaging period we could thus map the locations of channels within a region of the membrane (Fig. 3 A). Moreover, fluorescence measurements from small (0.6 μm square) regions of interest centered on these sites could then be used to track channel openings and closings with high fidelity (Fig. 3 B). These traces are analogous to patch-clamp records of channel currents, excepting that Ca2+ flux, rather than total ionic current flow, is used as a reporter of channel gating; and that optical imaging can track simultaneously and independently the activity from hundreds of channels, rather than a single channel captured by a patch pipette.
The “Channel-chip”
The high information content provided by single channel imaging presents a difficulty in that whereas it is possible to display individual traces from a few tens of channels (e.g., Fig. 3 B), this becomes impracticable for hundreds of channels. We thus developed a novel representation (Fig. 3, C and D**)**, which we christen the “channel-chip” by analogy to gene-chip displays. Here, the activity of each channel is represented as a horizontal line, with channel openings (SCCaFTs) appearing as increased intensity, and successive channels are stacked vertically. Thus, the behavior of a large population of ion channels can be encapsulated in a single image, and intra- and inter-channel differences in gating or Ca2+-permeation properties become readily apparent. The channel-chip representation is especially informative as an interactive computer display, allowing zooming of selected regions to reveal gating characteristics at finer resolution (Fig. 3 D), and cursor selection of individual channels to display conventional “patch-clamp-like” traces (compare Fig. 3 B).
Applicability of TIRFM Imaging to Ligand-gated Channels
TIRFM is uniquely advantageous for imaging highly localized Ca2+ signals near individual plasmalemmal channels, but has an inherent drawback in that the cell membrane must lie within the evanescent field, so that only a thin (∼<100 nm) film of extracellular fluid remains between the membrane and coverglass. Restricted diffusional exchange of ions and molecules within this “trapped” layer might then be expected to introduce problems, including depletion of extracellular [Ca2+] during channel openings and restricted accessibility of extracellular ligands.
We first assayed the ability of bath-applied agents to reach channels within the contact patch between the oocyte and the coverglass by imaging a 60-μm square region close to the edge of the patch. Numerous SCCaFTs were observed in the continued presence of ACh, but these were abolished within 50 s of switching the bath superfusion to a solution including curare (a competitive antagonist), and subsequently recovered within a similar period after washing with ACh alone (Fig. 4 A). To obtain a better quantification of the rate of exchange in the extracellular fluid film, we then monitored fluorescence of a dye (calcium green) serving as an extracellular marker. Fig. 4 B shows the loss of fluorescence measured at increasing distances into the contact patch when dye in the bulk bathing fluid was abruptly washed out following prior incubation for several minutes. As expected for diffusional exchange, the washout became progressively slower further away from the edge of the patch (Fig. 4 C), but near-complete (>90%) exchange was still achieved within 1 min at distances up to 60 μm.
Figure 4.
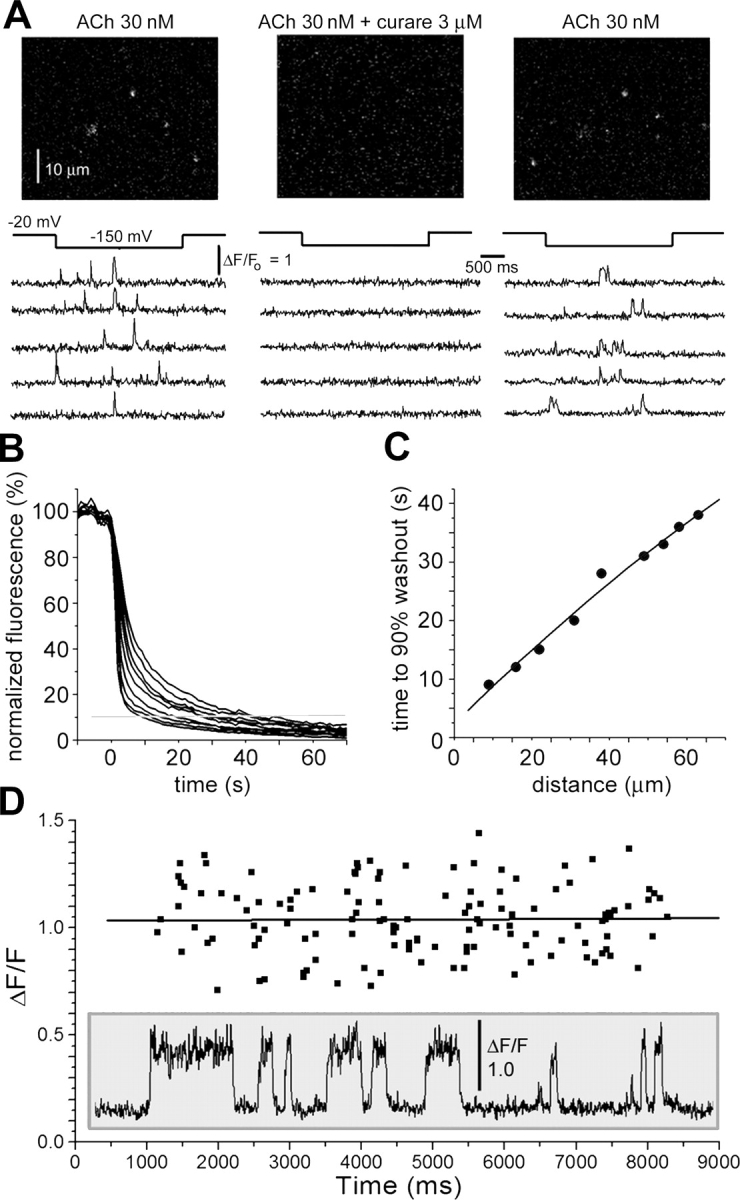
Exchange between extracellular fluid “trapped” beneath the plasma membrane and the bulk bathing fluid. (A) Reversible blocking of nAChR channel activity by bath-applied curare. Each panel shows a single TIRFM image frame, together with representative traces of SCCaFT activity. Control records (left) were obtained in the presence of 30 nM ACh. The bathing solution was then exchanged for one containing 3 μM curare together with 30 nM ACh, resulting in cessation of SCCaFT activity after ∼60 s (middle). Finally (right), SCCaFT activity resumed ∼10 s after washing with solution containing only 30 nM ACh. (B) Washout of extracellular dye from the fluid film trapped between the cell membrane and coverglass. An oocyte was bathed in extracellular solution containing 1 μM Calcium Green for several minutes, and the dye was then quickly washed out from the bulk bathing solution by bath superfusion. Superimposed traces show the resulting decline of normalized fluorescence measured from regions of interest (1 μm square) spaced at 10-μm increments inward from the edge of the contact patch between the oocyte and coverglass. (C) Time to 90% fall of extracellular fluorescence as a function of distance from the contact zone boundary. (D) The amplitude of SCCaFTs remained constant throughout the duration (7 s) of hyperpolarizing pulses, indicating minimal depletion of extracellular Ca2+. Scatter plot shows measurements of SCCaFT amplitudes from 37 channel records (representative example shown in inset) as a function of time during the hyperpolarizing pulse. Data points are measurements of individual SCCaFT amplitudes. A regression line is fitted to the data.
To investigate whether Ca2+ influx through open channels results in any appreciable depletion of extracellular [Ca2+] in the fluid film we chose a worst-case scenario, using relatively high concentrations of suberyldicholine to evoke prolonged and frequent openings of nAChR (Fig. 4 D, inset). Despite the scatter in SCCaFT amplitudes between events at a given channel and between channels, there was no consistent change throughout a 7-s hyperpolarizing pulse applied to induce Ca2+ influx (Fig. 4 D), whereas a decline would be expected if the local extracellular [Ca2+] in the vicinity of the channels were to have fallen.
Kinetic Resolution
Theoretical modeling studies (Shuai and Parker, 2005) indicate that TIRFM measurements of local Ca2+-dependent fluorescence signals should be able to track channel gating with a time resolution of better than 1 ms, but our previous experimental studies were limited by the frame rate (30 s−1) of the video camera (Demuro and Parker, 2004). By using a camera with much higher frame rate (500 s−1) we now demonstrate a dramatic (>10-fold) improvement in kinetic resolution of SCCaFTs (Fig. 5). In many cases, the rising and falling phases of SCCaFTs were substantially complete within one or two frames, providing an effective temporal resolution of ∼2 ms and suggesting that the camera frame rate, rather than the underlying fluorescence signal, remains the limiting factor. Fluorescence signals during longer openings displayed “rectangular” shapes, though with somewhat slower rising and falling phases, consistent with modeling studies (Shuai and Parker, 2005) showing that concentrations of calcium-bound fluo-4 in subfemtoliter volumes around a channel approach a plateau within a few tens of milliseconds as equilibration is reached between influx of Ca2+ ions through the channel and their subsequent buffering and diffusion into the bulk cytosol.
Figure 5.

SCCaFTs track channel gating with a temporal resolution of 2 ms. Upper trace shows local fluorescence monitored from a single nAChR (30 nM ACh, −150 mV) that displayed four SCCaFTs during a roughly 3-s period. Lower panels show selected SCCaFTs on an expanded time scale. Images were acquired at 500 frames s−1, and dots indicate successive 2-ms time points.
Optical Measurements of Channel Gating
TIRFM imaging of single-channel Ca2+ flux thus provides a temporal resolution adequate to characterize the gating kinetics of channels that have mean open times of a few milliseconds or longer (Fig. 6). SCCaFTs evoked through nicotinic channels using ACh as the agonist were relatively brief (Fig. 6 A) and, excepting a fall-off in events ≤4 ms, the distribution of SCCaFT durations was well fit by a single exponential with a time constant of 7.9 ms (Fig. 6 B). This value corresponds well to that expected from electrophysiological measures of mean channel open lifetime at strongly hyperpolarized potentials and in the presence of elevated extracellular [Ca2+] (Anderson and Stevens, 1973; Hille, 2001; unpublished data). The corresponding distribution of intervals between SCCaFTs (channel closed times) was best fit by double exponentials, with time constants of 70 and 474 ms. We also imaged SCCaFTs in the presence of the nAChR agonist suberyldicholine, which evokes channel openings (bursts) on average about twice as long as with ACh (Colquhoun and Sakmann, 1985; Hille, 2001). Consistent with this, suberyldicholine-evoked SCCaFTs were on average more prolonged than those with ACh (Fig. 6 D), and their distribution followed an exponential with a time constant of 15.8 ms (Fig. 6 E). The distribution of closed times followed two exponentials with time constants similar to ACh, though with different relative areas (Fig. 6 F).
Figure 6.

Optical measurement of nAChR channel open and closed time distributions during activation by two different agonists. (A–C) Data obtained in the presence of 30 nM ACh. (A) Representative records of SCCaFTs. (B) Distribution of SCCaFT durations evoked by ACh. Curve is a single exponential fit, with time constant = 7.9 ms. Data were derived from 1,700 SCCaFTs (280 channels; 3 oocytes). (C) Corresponding distribution of intervals between SCCaFTs (channel closed times). Data are fit by double exponentials, with time constants of 70 and 474 ms. (D–F) Corresponding measurements obtained in the presence of 1 μM suberyldicholine.
Voltage and Concentration Dependence of SCCaFTs
Fig. 7 A shows superimposed SCCaFTs recorded from several channels in the continued presence of ACh while the membrane potential was successively pulsed to increasingly negative voltages. As expected from the increased electrochemical driving force for Ca2+ entry, the mean SCCaFT amplitude grew with increasing hyperpolarization (Fig. 7 B). A linear extrapolation from the observed data indicates that signals would reduce to zero at a potential of about +60 mV; although in practice individual SCCaFTs could not clearly be resolved above the noise level at the holding potential of 0 mV.
We explored the dependence of channel gating on agonist concentration by imaging SCCaFTs while applying different concentrations of ACh by bath superfusion. As shown in Fig. 7 C, the frequency of SCCaFTs increased markedly after successively equilibrating solutions containing 3, 10, and 30 nM ACh, and measures of mean channel open probability were obtained from the proportion of the total time for which channel sites showed SCCaFTs. When plotted on double-logarithmic coordinates (Fig. 7 D) the open probability increased with increasing [ACh] following a power law relationship with a slope of ∼1.6; consistent with electrophysiological measurements (Hille, 2001) that report Hill coefficients ranging between 1.5 and 2.2.
Immobility of nAChR in the Oocyte Membrane
The observation that SCCaFTs could be monitored for many seconds from a small, fixed region of interest already suggested that the nAChR channels must remain at virtually fixed positions. To quantify the channel mobility, or lack thereof, we applied repeated hyperpolarizing pulses in the continued presence of ACh and tracked the positions of SCCaFTs at sites selected as being clearly distinct from their nearest neighbors. Fig. 8 A presents representative image frames capturing SCCaFTs at a site that showed continued activity throughout a roughly 1-min period (Fig. 8 B). The pattern of fluorescence in the SCCaFTs differed somewhat between frames and, probably owing to noise fluctuations, showed an irregular profile rather than being circularly symmetrical. Nonetheless, the centroid position of SCCaFTs as determined from thresholded images using the tracking function in MetaMorph fluctuated within a range of only about ±50 nm (Fig. 8 C). Moreover, we found no evidence for any systematic change in channel position throughout the 1-min recording beyond very small fluctuations that may be attributable to thermal drift in the microscope (Fig. 8 D).
Expressed AChR Channels Are Randomly Distributed in the Oocyte Membrane
The fixed positions of SCCaFTs allowed us to map the positions of numerous nAChR channels within an imaging field (Fig. 9 A). To then investigate whether these channels are distributed randomly, or in a clustered manner, we calculated the distances from every channel to every other channel. The red histogram bars in Fig. 9 C represent a distribution plot of channel–channel spacings, derived from three imaging fields (two oocytes), measuring 72 × 52 μm and each containing between 308 and 380 discrete SCCaFT sites. The observed distribution matches extremely well to that expected for a random distribution of channels (Fig. 9 B; distribution plotted as blue data points in Fig. 9 C). In particular, we did not find any excess observations at close (0.5–6 μm) spacings (Fig. 9 D), as would be expected if channels were closely clustered. Moreover, it appears unlikely that channels were even more tightly clustered at spacings below the limit of our resolution (∼1 μm), because we did not observe “double size” SCCaFTs as would be expected to occur from the chance simultaneous opening of closely adjacent channels.
Figure 9.

Muscle nicotinic AChR are randomly distributed in the oocyte membrane. (A) Representative map of nAChR channels distributed throughout a 60 × 60 μm imaging field, formed by manually plotting the locations of all (370) discrete SCCaFT sites observed during three 7-s recording periods in the presence of 30 nM ACh. (B) Example of a simulated random distribution, created by generating 370 random x-y coordinates within the same image field. (C) Histogram (red bars) shows the distribution of measured interchannel spacings. Data were obtained by calculating the separations between each channel and every other channel within the imaging field. Measurements were taken from three other membrane regions (550 × 400 pixel; 72 × 52 μm) like that illustrated in A, each of which contained 308–380 channels. The blue curve shows the distribution expected if channels with the same overall density as the experimental data were randomly arrayed. It was formed by averaging the interchannel distributions derived from 10 sets of randomly generated coordinates corresponding to each of the three experimental maps. (D) The same data as in C, replotted on an expanded scale to show the distribution of observed (red bars) and random (blue curve) interchannel spacings for spacings up to 6 μm.
Spatial Mapping of Channel Function
Because SCCaFTs provide functional information, it becomes possible to produce spatial maps representing various aspects of channel gating, rather than merely their locations. To illustrate the potentialities of this approach, we show in Fig. 10 a mapping of nAChR based on their open probabilities.
Fig. 10 A presents a channel-chip representation of 236 channels within a 40 × 40 μm membrane area, depicted from top to bottom in rank order of their open probability (Popen) throughout a single 7-s hyperpolarizing step. The overall mean Popen was 0.0289. However, values for individual channels varied enormously over a nearly 500-fold range, as illustrated by sample traces in Fig. 10 B, by the plot of Popen as a function of rank-ordered channel number in Fig. 10 C, and by the distribution histogram of single-epoch open probabilities in Fig. 10 D. To then investigate whether there was any colocalization of channels displaying high or low Popen we constructed a three-dimensional contour map, in which Popen values throughout the imaging field are depicted on a color-encoded scale (Fig. 10 E). In forming the map, we omitted seven channels that showed unusually high (>0.1) Popen, as they otherwise strongly biased the results, but their locations (red squares in Fig. 10 E) showed no obvious evidence of clustering. The Popen contour map derived from the remaining 229 channels showed irregular regions of elevated open probability, but it is likely that these arose simply from statistical variability, as a control map formed by assigning random x-y coordinates to the same Popen data (Fig. 10 F) showed a comparable distribution. Thus far, our analysis of two further membrane patches has similarly failed to show evidence of any obvious spatial patterning in open probability of expressed nicotinic channels opened by both ACh and suberyldicholine. Nevertheless, we believe this functional-mapping technique may prove valuable for exploring possible regional differences in channel gating properties resulting, for example, from local modulation by second messengers or differences in membrane lipid composition.
DISCUSSION
The first recordings from individual ion channels were achieved using the patch-clamp to measure currents through muscle nicotinic acetylcholine receptor/channels (Neher and Sakmann 1976); a technique that subsequently revolutionized studies of channel function and biophysics (Hamill et al., 1981; Hille 2001). Here, we demonstrate the use of optical techniques to obtain analogous physiological information from these same channels, by imaging single-channel Ca2+ flux (SCCaFTs) as a reporter of channel gating. One major advantage over electrophysiological recording is that optical single-channel imaging is massively parallel, providing simultaneous readout from hundreds of channels (Fig. 3). This enormously enhanced dataset should facilitate detailed statistical analysis of Markovian channel behavior. For example, we had shown that N-type channels within the same optical field display divergent open probabilities, with individual channels displaying transitions between low and high frequency openings (Demuro and Parker 2004). Moreover, imaging provides spatial information that is entirely lacking in patch-clamp recordings. Thus, channel locations can be mapped with submicrometer precision, and their mobility (or immobility) can be followed over seconds or minutes, thereby enabling studies of phenomena such as channel clustering and redistribution. Although such information can also be derived from channels tagged by fluorescent proteins (Harms et al. 2001), TIRFM imaging of Ca2+ flux has advantages that it may be applied to native channels, provides a bright signal that is substantially immune from bleaching, and circumvents problems with transfection and possible disturbance of protein function and localization owing to the attached fluorescent moiety. Finally, high-resolution Ca2+ imaging yields simultaneous readout of both position and function, enabling analysis of spatial correlates of channel kinetics.
We have used the Xenopus oocyte as a convenient model cell system for developing single channel imaging techniques, in part because of its ready ability to express a wide variety of channel types from cloned genes. Moreover, resolution of SCCaFTs from discrete channels is facilitated because the enormous size (1 mm diameter) of the oocyte results in a low density of channels (∼0.2 μm−2), even with high expression levels giving several microamperes of whole-cell current. There appear, however, to be no insurmountable problems in extending these imaging techniques to native channels in mammalian cells, although it may then be necessary to reduce the channel opening probability (e.g., by pharmacological block or application of low agonist concentrations) to obtain discrete signals in regions of high channel density.
Using Ca2+ flux as a monitor of channel gating restricts the number of channel types that are amenable to this methodology, and it seems doubtful whether similar imaging could be achieved for flux of Na+ or Cl− ions through individual channels owing to their high basal cytosolic concentrations and lack of highly sensitive indicator dyes (Demuro and Parker, 2005). Nevertheless, we show that excellent signals can be obtained from even the small amount of Ca2+ that passes through muscle αβγδ nicotinic acetylcholine receptor/channels, corresponding to a Ca2+ current of no more than 0.25 pA at −150 mV with 6 mM extracellular [Ca2+] (Decker and Dani, 1990), and representing 2% of the total current in physiological solution, among the lowest of all nicotinic receptors (Ragozzino et al., 1998; Fucile, 2004). Our technique should thus be readily applicable to the numerous other channel types (including those activated by glutamate, ACh, ATP, and serotonin) that show a partial Ca2+ permeability (Burnashev, 1998), as well as to Ca2+ channels per se. The fluorescence magnitude and spatial extent of SCCaFTs can be calibrated to estimate the underlying Ca2+ currents (Demuro and Parker, 2003; Ventura et al., 2005), and comparison with parallel patch-clamp measurements of total single-channel current would then reveal the fractional permeability of the channel to Ca2+ (Zou et al., 2004a,b).
TIRF imaging requires that the cell membrane be close (tens of nanometers) to the microscope cover glass, thus raising concerns that the resulting thin film of “trapped” extracellular fluid may impede access of agonists to ligand-gated channels and result in local Ca2+ depletion. Our results indicate that these are not serious problems. Bath applied agonists and antagonists equilibrated sufficiently fast (tens of seconds) to allow repeated steady-state measurements from the same population of channels under different conditions, and flash photolysis of caged ligands would allow rapid concentration jump experiments. Moreover, the relatively uniform and time-invariant amplitudes of SCCaFTs generated by the opening of nicotinic receptors throughout the imaging field suggest that there is negligible depletion of Ca2+ within the contact patch.
Voltage- and ligand-gated channels open stochastically, with typical mean open times of a few milliseconds (Hille 2001). Adequate characterization of gating kinetics thus requires a temporal resolution on the order of milliseconds or faster. Recent improvements in technology of electron-multiplied c.c.d. cameras now provide a frame rate of 500 s−1 coupled with a sensitivity approaching the theoretical limit (quantum efficiency >90%), enabling us to achieve a resolution of 2 ms. This is sufficient to determine the open lifetime of nAChR and reveal differences in mean open time with different agonists (Fig. 6). Yet further improvements in frame rate may readily be achieved by pixel binning or by reading out only subregions of the c.c.d. sensor. A more fundamental constraint arises from the dynamics of the fluorescence signal itself, as determined by the reaction-diffusion kinetics of Ca2+ and Ca2+-bound indicator in the cytosol (Shuai and Parker, 2005). In this regard, TIRFM has the advantage over confocal and widefield imaging of providing a smaller sampling volume (tens of attoliters), thereby enhancing kinetic resolution of local Ca fluorescence signals (Shuai and Parker, 2005). Moreover, two-dimensional (x-y) TIRFM images can be captured rapidly and relatively inexpensively by a camera, whereas confocal studies (Wang et al., 2001, 2004; Demuro and Parker, 2003) have been restricted to a linescan mode that limits the number of channels that can be sampled and introduces problems of out-of-focus SCCaFTs arising from channels laterally displaced from the scan line. Further reduction in the sampling volume is not likely to offer a feasible means of increasing temporal resolution, as this is already diffraction limited, and smaller volumes are expected to result in degraded signal-to-noise ratio. However, model predictions suggest that addition of exogenous buffers and “tuning” of indicator concentration and properties should speed the SCCaFTs and reduce the slow tail of fluorescence that persists after channel closure (Shuai and Parker, 2005).
The positions of SCCaFTs arising through nAChR remain essentially constant with time, showing a net displacement of <50 nm over a minute. This greatly facilitates analysis by allowing fluorescence signals to be monitored from a fixed region of interest, rather than necessitating the tracking of a moving target. We had previously described a similar immobility of SCCaFTs arising from N-type Ca2+ channels expressed in oocytes (Demuro and Parker, 2004), suggesting that both these voltage-gated channels and the ligand-gated nAChR are rigidly anchored. In contrast, freely diffusible membrane proteins are expected to show relatively large mean displacements over recording times of several seconds. For example, Peng et al. (2004b), report a lateral dimensional diffusion coefficient of ∼1 μm2 s−1 for ryanodine receptor channels imaged in lipid bilayers, resulting in movements of >10 μm in a minute; and Harms et al. (2001) report a mean diffusion coefficient of 0.15 μm2 s−1 for single L-type Ca2+ channels expressed in HEK 293 cells. We can rule out the possibility that interactions between proteins in the oocyte membrane and the closely adjacent coverglass are responsible for the restricted channel mobility, because SCCaFT locations remained fixed even when imaged by wide-field fluorescence microscopy in oocytes with an intact vitelline envelope (unpublished data). Instead, it is likely that nAChR and N-type Ca2+ channels are anchored to the oocyte cytoskeleton. In muscle, nAChR are linked to F-actin via utrophin (Willmann and Fuhrer, 2002). Early in muscle development the nAChR are diffusely distributed, similar to the random distribution we observe in the oocyte, but they then become tightly clustered at the neuromuscular junction in response to agrin secreted from the motor nerve terminal (Willmann and Fuhrer, 2002). Agrin-induced clustering is blocked by fast, but not slow, intracellular Ca2+ buffers (Borges et al., 2002), pointing to a regulatory role of local Ca2+ microdomains and suggesting that spatiotemporal imaging of SCCaFTs may provide a useful tool to study functional modulation of receptor/channel clustering.
In conclusion, we anticipate that optical imaging will evolve as a powerful adjunct to electrophysiological techniques for single-channel recording, having specific advantages in that it is minimally invasive, massively parallel, and provides spatial information of channel location and mobility as well as functional information of channel gating. The technique we describe for TIRF imaging currently provides recordings appreciably superior to that yet achieved by other single-channel Ca2+ imaging approaches (Zou et al., 1999, 2002, 2004a,b; Wang et al., 2001, 2004; Demuro and Parker, 2003), or to fluorescence techniques that monitor the conformational state of the channel (Demuro and Parker, 2003; Sonnleitner and Isacoff, 2003). In addition to its applicability for basic research, single-channel imaging may provide a new direction as a high-throughput screening system for channel-related drugs, with distinct advantages in comparison to efforts to employ parallel arrays of patch-clamp electrodes (Xu et al., 2001; Sigworth and Klemic, 2002). Moreover, potential remains for yet further improvements in resolution, and for the development of information processing routines for analysis of the resulting enormous data stream.
Supplemental Material
Supplemental Material Index
Acknowledgments
We are grateful to Dr. Stephen F. Heinemann (Salk Institute, San Diego, CA) for generously providing the muscle nAChR subunit cDNAs, and to Dr. Jianwei Shuai for assistance with programming and for numerous helpful discussions.
This work was supported by grants GM 48071 and GM 65830 from the National Institutes of Health.
Angus C. Nairn served as editor.
Abbreviations used in this paper: nAChR, nicotinic acetylcholine receptor; SCCaFT, single channel Ca2+ fluorescence transient; TIRFM, total internal reflection fluorescence microscopy.
References
- Anderson, C.R., and C.F. Stevens. 1973. Voltage-clamp analysis of acetylcholine-produced end-plate current fluctuations at frog neuromuscular junction. J. Physiol. 235:655–691. [DOI] [PMC free article] [PubMed] [Google Scholar]
- Axelrod, D. 2003. Total internal reflection microscopy in cell biology. Methods Enzymol. 361:1–33. [DOI] [PubMed] [Google Scholar]
- Borges, L.S., Y. Lee, and M. Ferns. 2002. Dual role for calcium in agrin signaling and acetylcholine receptor clustering. J. Neurobiol. 50:69–79. [DOI] [PubMed] [Google Scholar]
- Borisenko, V., T. Lougheed, J. Hesse, E. Fureder-Kitzmuller, N. Fertig, J.C. Behrends, G.A. Woolley, and G.J. Schutz. 2003. Simultaneous optical and electrical recording of single gramicidin channels. Biophys. J. 84:612–622. [DOI] [PMC free article] [PubMed] [Google Scholar]
- Burnashev, N. 1998. Calcium permeability of ligand-gated channels. Cell Calcium. 24:325–332. [DOI] [PubMed] [Google Scholar]
- Colquhoun, D., and B. Sakmann. 1985. Fast events in single-channel currents activated by acetylcholine and its analogues at the frog muscle end-plate. J. Physiol. 369:501–557. [DOI] [PMC free article] [PubMed] [Google Scholar]
- Decker, E.R., and J.A. Dani. 1990. Calcium permeability of the nicotinic acetylcholine receptor: the single-channel calcium influx is significant. J. Neurosci. 10:3413–3420. [DOI] [PMC free article] [PubMed] [Google Scholar]
- Demuro, A., E. Palma, F. Eusebi, and R. Miledi. 2001. Inhibition of nicotinic acetylcholine receptors by bicuculline. Neuropharmacology. 41:854–861. [DOI] [PubMed] [Google Scholar]
- Demuro, A., and I. Parker. 2003. Optical single-channel recording: imaging Ca2+ flux through individual N-type voltage-gated channels expressed in Xenopus oocytes. Cell Calcium. 34:499–509. [DOI] [PubMed] [Google Scholar]
- Demuro, A., and I. Parker. 2004. Imaging the activity and localization of single voltage-gated Ca2+ channels by total internal reflection fluorescence microscopy. Biophys. J. 86:3250–3259. [DOI] [PMC free article] [PubMed] [Google Scholar]
- Demuro, A., and I. Parker. 2005. Optical single-channel recording: imaging Ca2+ flux through individual ion channels with high temporal and spatial resolution. J. Biomed. Opt. 10:11002. [DOI] [PubMed] [Google Scholar]
- Dumont, J.N. 1972. Oogenesis in Xenopus laevis (Daudin). I. Stages of oocytes development in laboratory maintained animals. J. Morphol. 136:153–179. [DOI] [PubMed] [Google Scholar]
- Fucile, S. 2004. Ca2+ permeability of nicotinic acetylcholine receptors. Cell Calcium. 35:1–8. [DOI] [PubMed] [Google Scholar]
- Hamill, O.P., A. Marty, E. Neher, B. Sakmann, and F.J. Sigworth. 1981. Improved patch-clamp techniques for high-resolution current recording from cells and cell-free membrane patches. Pflugers Arch. 391:85–100. [DOI] [PubMed] [Google Scholar]
- Harms, G.S., L. Cognet, P.H. Lommerse, G.A. Blab, H. Kahr, R. Gamsjager, H.P. Spaink, N.M. Soldatov, C. Romanin, and T. Schmidt. 2001. Single-molecule imaging of L-type Ca2+ channels in live cells. Biophys. J. 81:2639–2646. [DOI] [PMC free article] [PubMed] [Google Scholar]
- Harms, G.S., G. Orr, M. Montal, B.D. Thrall, S.D. Colson, and H.P. Lu. 2003. Probing conformational changes of gramicidin ion channels by single-molecule patch-clamp fluorescence microscopy. Biophys. J. 85:1826–1838. [DOI] [PMC free article] [PubMed] [Google Scholar]
- Hille, B. 2001. Ion Channels of Excitable Membranes. Sinauer Associates, Sunderland, MA. 814 pp.
- Methfessel, C., V. Witzemann, T. Takahashi, M. Mishina, S. Numa, and B. Sakmann. 1986. Patch clamp measurements on Xenopus laevis oocytes: currents through endogenous channels and implanted acetylcholine receptor and sodium channels. Pflugers Arch. 407:577–588. [DOI] [PubMed] [Google Scholar]
- Neher, E., and B. Sakmann. 1976. Single-channel currents recorded from membrane of denervated frog muscle fibers. Nature. 260:799–802. [DOI] [PubMed] [Google Scholar]
- Peng, S., N.G. Publicover, G.J. Kargacin, D. Duan, J.A. Airey, and J.L. Sutko. 2004. a. Imaging single cardiac ryanodine receptor Ca2+ fluxes in lipid bilayers. Biophys. J. 86:134-144. [DOI] [PMC free article] [PubMed] [Google Scholar]
- Peng, S., N.G. Publicover, D. Airey, J.E. Hall, H.T. Haigler, D. Jiang, S.R. Chen, and J.L. Sutko. 2004. b. Diffusion of single cardiac ryanodine receptors in lipid bilayers is decreased by annexin12. Biophys. J. 86:145–151. [DOI] [PMC free article] [PubMed] [Google Scholar]
- Ragozzino, D., B. Barabino, S. Fucile, and F. Eusebi. 1998. Ca2+ permeability of mouse and chick nicotinic acetylcholine receptors expressed in transiently transfected human cells. J. Physiol. 507:749–757. [DOI] [PMC free article] [PubMed] [Google Scholar]
- Sigworth, F.J., and K.G. Klemic. 2002. Patch clamp on a chip. Biophys. J. 82:2831–2832. [DOI] [PMC free article] [PubMed] [Google Scholar]
- Sonnleitner, A., and Y. Isacoff. 2003. Single ion channel imaging. Methods Enzymol. 361:304-319. [DOI] [PubMed] [Google Scholar]
- Sonnleitner, A., L.M. Mannuzzu, S.E. Terakawa, and Y. Isacoff. 2002. Structural rearrangements in single ion channels detected optically in living cells. Proc. Natl. Acad. Sci. USA. 99:12759–12764. [DOI] [PMC free article] [PubMed] [Google Scholar]
- Shuai, J., and I. Parker. 2005. Optical single channel recording by imaging Ca2+ flux through individual ion channels: theoretical considerations and limits to resolution. Cell Calcium. 37:283–299. [DOI] [PubMed] [Google Scholar]
- Ventura, A.C., L. Bruno, A. Demuro, I. Parker, and S.P. Dawson. 2005. A model-independent algorithm to derive Ca2+ fluxes underlying local cytosolic Ca2+ transients. Biophys. J. 88:2403–2421. [DOI] [PMC free article] [PubMed] [Google Scholar]
- Wang, S.Q., L.S. Song, E.G. Lakatta, and H. Cheng. 2001. Ca2+ signalling between single L-type Ca2+ channels and ryanodine receptors in heart cells. Nature. 410:592–596. [DOI] [PubMed] [Google Scholar]
- Wang, S.Q., C. Wei, G. Zhao, D.X. Brochet, J. Shen, L.S. Song, W. Wang, D. Yang, and H. Cheng. 2004. Imaging microdomain Ca2+ in muscle cells. Circ. Res. 94:1011–1022. [DOI] [PubMed] [Google Scholar]
- Willmann, R., and C. Fuhrer. 2002. Neuromuscular synaptogenesis: clustering of acetylcholine receptors revisited. Cell. Mol. Life Sci. 59:1296–1316. [DOI] [PMC free article] [PubMed] [Google Scholar]
- Xu, J., X. Wang, B. Ensign, M. Li, L. Wu, A. Guia, and J. Xu. 2001. Ion-channel assay technology: quo vadis? Drug Discov. Today. 6:1278–1287. [DOI] [PubMed] [Google Scholar]
- Zou, H., L.M. Lifshitz, R.A. Tuft, K.E. Fogarty, and J.J. Singer. 1999. Imaging Ca2+ entering the cytoplasm through a single opening of a plasma membrane cation channel. J. Gen. Physiol. 114:575–588. [DOI] [PMC free article] [PubMed] [Google Scholar]
- Zou, H., L.M. Lifshitz, R.A. Tuft, K.E. Fogarty, and J.J. Singer. 2002. Visualization of Ca2+ entry through single stretch-activated cation channels. Proc. Natl. Acad. Sci. USA. 99:6404–6409. [DOI] [PMC free article] [PubMed] [Google Scholar]
- Zou, H., L.M. Lifshitz, R.A. Tuft, K.E. Fogarty, and J.J. Singer. 2004. a. Using total fluorescence increase (signal mass) to determine the Ca2+ current underlying localized Ca2+ events. J. Gen. Physiol. 124:259–272. [DOI] [PMC free article] [PubMed] [Google Scholar]
- Zou, H., L.M. Lifshitz, R.A. Tuft, K.E. Fogarty, and J.J. Singer. 2004. b. Imaging calcium entering the cytosol through a single opening of plasma membrane ion channels: SCCaFTs-fundamental calcium events. Cell Calcium. 35:523–533. [DOI] [PubMed] [Google Scholar]
Associated Data
This section collects any data citations, data availability statements, or supplementary materials included in this article.
Supplementary Materials
Supplemental Material Index