Paradoxical block of the Na+-Ca2+ exchanger by extracellular protons in guinea-pig ventricular myocytes (original) (raw)
Abstract
- The Na+-Ca2+ exchange is a major pathway for removal of cytosolic Ca2+ in cardiac myocytes. It is known to be inhibited by changes of intracellular pH that may occur, for example, during ischaemia. In the present study, we examined whether extracellular protons (pHo) can also affect the cardiac exchange.
- Na+-Ca2+ exchange currents (_I_Na-Ca) were recorded from single adult guinea-pig ventricular myocytes in the whole-cell voltage-clamp configuration while [Ca2+]i was simultaneously imaged with fluo-3 and a laser-scanning confocal microscope. To activate _I_Na-Ca, intracellular Ca2+ concentration jumps were generated by laser flash photolysis of caged Ca2+ (DM-nitrophen).
- Exposure of the cell to moderately and extremely acidic conditions (pHo 6 and 4) was accompanied by a decrease of the peak _I_Na-Ca to 70 % and less than 10 %, respectively. The peak _I_Na-Ca was also inhibited to about 45 % of its initial value by increasing pHo to 10. The largest _I_Na-Ca was found at pHo≈ 7·6.
- Simultaneous measurements of [Ca2+]i and _I_Na-Ca during partial proton block of the Na+-Ca2+ exchanger revealed that the exchange current was more inhibited by acidic pHo than the rate of Ca2+ transport. This observation is consistent with a change in the electrogenicity of the Na+-Ca2+ exchange cycle after protonation of the transporter.
- We conclude that both extracellular alkalinization and acidification affect the Na+-Ca2+ exchanger during changes of pHo that may be present under pathophysiological conditions. During both extreme acidification or alkalinization the Na+-Ca2+ exchanger is strongly inhibited, suggesting that extracellular protons may interact with the Na+-Ca2+ exchanger at multiple sites. In addition, the electrogenicity and stoichiometry of the Na+-Ca2+ exchange may be modified by extracellular protons.
The Na+-Ca2+ exchanger is a transmembrane protein expressed in the cell membrane of almost every cell type. In general, this antiport system is involved in the homeostasis of intracellular Ca2+ concentration ([Ca2+]i), helps to maintain the resting [Ca2+]i orders of magnitude below the extracellular Ca2+ concentration and indirectly regulates other biological functions in many cell types (Carafoli, 1985; Hilgemann et al. 1996). For recent reviews on general aspects of Na+-Ca2+ exchange function see, for example, Khananschvili (1998); Egger & Niggli (1999); Blaustein & Lederer (1999). In cardiac muscle cells the Na+-Ca2+ exchange is especially important as a central mechanism for Ca2+ extrusion and muscle relaxation (Carafoli, 1985; Bers et al. 1990; Barry & Bridge, 1993; Bassani et al. 1994; Janvier & Boyett, 1996; Egger & Niggli, 1999). The Na+-Ca2+ exchanger can mediate Ca2+ efflux or it can promote Ca2+ influx. The direction of the transport is governed by the magnitude and orientation of the transmembrane electrical and chemical gradients for both Na+ and Ca2+. Although the molecular mechanisms of the ion exchange and its regulation are poorly understood (Eisner & Lederer, 1985; Hilgemann, 1990; Niggli & Lederer, 1991; Matsuoka & Hilgemann, 1992; Matsuoka et al. 1993; Hilgemann & Ball, 1996), an exchange stoichiometry of 3 Na+:1 Ca2+ is fairly well established (Reeves & Hale, 1984). A (consecutive) ping-pong scheme has been proposed for the exchange mechanism, based on the separate movements of Ca2+ and Na+ mediated by the exchanger (Hilgemann, 1990; Niggli & Lederer, 1991). As a consequence the Na+-Ca2+ exchanger is electrogenic and produces an inwardly directed Na+-Ca2+ exchange current (_I_Na-Ca) while extruding Ca2+. The electrogenic Na+-Ca2+ exchange process is known to be modulated by intracellular constituents, e.g. ATP (Hilgemann & Collins, 1992) and protons (pHi) (Reeves & Philipson, 1989; Philipson et al. 1992; Doering & Lederer, 1993; Khananshvili et al. 1994, 1995; Doering et al. 1996). Most of these observations were made with the giant-patch voltage-clamp technique or with Ca2+ flux studies in sarcolemmal vesicles.
In cardiac myocytes Ca2+ homeostasis can be altered in various diseases and the resulting changes in systolic and diastolic intracellular Ca2+ can cause clinically significant alterations during contraction and/or relaxation (Meno et al. 1989; Tani, 1990). It is assumed that the Na+-Ca2+ exchange is very sensitive to pH but the molecular interactions underlying the proton effect are not known. Since the pH can rapidly change during several cardiac pathophysiological conditions including ischaemia (∼0.8 pH units within 1 min; Meno et al. 1989; Tani, 1990) the effects of protons on the Na+-Ca2+ exchanger function may be clinically relevant. In giant patch preparations excised from guinea-pig ventricular cells it was found that at physiological intracellular pH, the Na+-Ca2+ exchanger is already inhibited by 50 % (Doering & Lederer, 1993; Doering et al. 1996).
In the present study, we examined whether and how extracellular protons modulate the Na+-Ca2+ exchange process. We found that the Na+-Ca2+ exchange is sensitive to moderate changes of pHo and that both extreme acidification and alkalinization of the extracellular medium are accompanied by a marked inhibition of _I_Na-Ca. Surprisingly, the Ca2+ transport via Na+-Ca2+ exchange appeared to be less affected than _I_Na-Ca at very low pHo. These findings indicate that complex interactions take place between extracellular protons and the Na+-Ca2+ exchanger and are consistent with the idea of a reduced electrogenicity of the exchange process under acidic conditions. Preliminary results have been presented to the Biophysical Society in abstract form (Egger & Niggli, 1998).
METHODS
Isolation of cells and solutions
Cardiac ventricular myocytes were isolated from guinea-pig hearts using enzymatic methods (Mitra & Morad, 1985). The experiments were carried out according to the guidelines of the Swiss Animal Protection Law and with the permission of the The Federal Veterinary Office, Bern, Switzerland. Briefly, after heparinization (30 U kg−1) the guinea-pigs were killed by cervical dislocation. The heart was quickly removed and mounted on a Langendorff system, perfused with a nominally Ca2+-free solution at 37°C for about 5 min. For enzymatic digestion, collagenase B (0.4 mg ml−1, Boehringer Mannheim, Rotkreuz, Switzerland) and protease type XIV (0.04 mg ml−1, Sigma, Buchs, Switzerland) were added to the perfusion solution (Table 1, solution 1) for another 6 min. After perfusion with the enzymes the ventricular tissue was cut into small pieces and placed in a gently rotating shaker at room temperature in a solution containing 200 μM Ca2+. The cells were harvested from the supernatant and treated with 10 μM ryanodine (Calbiochem, La Jolla, CA, USA) and 0.1 μM thapsigargin (Calbiochem or Alomone Labs, Jerusalem, Israel) at room temperature for 60 min. For measurements, myocytes were allowed to settle onto the glass surface of the superfusion chamber. The chamber assembly was mounted on an inverted microscope (Nikon Diaphot, Nikon, Japan). Rapid (_t_1/2≈ 400 ms) changes of the extracellular pH were performed using a gravity-driven superfusion system. Compositions of the superfusion solutions (solutions 2–4) as well as the pipette solutions (solutions 5–7) are given in Table 1. All experiments were performed at room temperature (20–23°C).
Table 1.
Solutions
| Solution no. | 1 Cell isolation | 2 Neutral range | 3 Alkanlinic range | 4 Acidic range | 5 Pipette flash solution | 6 Pipette flash-Ca2+ solution | 7 Pipette pH solution |
|---|---|---|---|---|---|---|---|
| NaCl | 135 | 145 | 145 | 145 | — | — | — |
| KCl | 5.4 | 5 | 5 | 5 | — | — | — |
| CaCl2 | — | 1 | 1 | 1 | 0.5 | 0.5 | — |
| MgCl2 | 1 | 1 | 1 | 1 | — | — | — |
| Glucose | 11 | 10 | 10 | 10 | — | — | — |
| CsCl | — | 1 | 1 | 1 | — | — | — |
| BaCl2 | — | 0.5 | 0.5 | 0.5 | — | — | — |
| Hepes1 | 5 | 10 | — | — | 20 | 20 | 0.1 |
| Mes1 | — | — | 10 | — | — | — | — |
| Tricine1 | — | — | — | 10 | — | — | — |
| K2-ATP | — | — | — | — | 5 | 5 | 5 |
| TEA-Cl1 | — | — | — | — | 20 | 20 | 20 |
| NaH2PO4 | 0.33 | — | — | — | — | — | — |
| Caesium aspartate | — | — | — | — | — | — | 145 |
| Sucrose | — | — | — | — | — | — | — |
| Fluo-32 | — | — | — | — | 0.1 | — | — |
| Na4-DM-nitrophen2 | — | — | — | — | 2 | 2 | — |
| GSH | — | — | — | — | 2 | 2 | — |
| pH | 7.4 | 6.0–8.0 | > 8.0 | < 6.0 | 7.4 | 7.4 | 7.4 |
| (NaOH) | (NaOH) | (NaOH) | (NaOH) | (CsOH) | (CsOH) | (CsOH) |
Flash photolysis
Flash lamp photolysis
Light from a xenon short-arc flash lamp (Strobex 238/278, Chadwick, El Monte, CA, USA; 230 W, pulse duration ∼1 ms) was used to photolyse intracellular DM-nitrophen in an epi-illumination arrangement on the confocal microscope. The light was collected with an ellipsoidal mirror and a portion of the produced ultraviolet spectrum (330–390 nm) was reflected by a dichroic mirror onto the input of a liquid-light guide (Oriel, Stratford, CT, USA). The output of the liquid-light guide was passed into the epi-illumination port of the inverted microscope. After reflection by a dichroic mirror (< 390 nm) the light passed through the microscope objective (Zeiss Neofluar, × 63 oil immersion lens, N.A. = 1.25, Carl Zeiss, Germany) generating a homogeneous illumination of the entire visible field. During loading with DM-nitrophen (about 5 min with additional moderate pressure injection) and between flashes at different test potentials the cells were held at a membrane potential of 0 mV to elevate the resting [Ca2+]i slightly. This procedure ensures complete loading of DM-nitrophen with Ca2+ and displacement of residual Mg2+. Unless indicated otherwise, _V_m was repolarized to −40 mV 2 s prior to the flash to allow recovery of the resting [Ca2+]i.
Laser flash photolysis
Single UV flashes or trains with a duration of 1–30 s (1–5 Hz) were used to photolyse intracellular DM-nitrophen in an epi-illumination arrangement and were generated with a frequency-tripled Nd:YAG laser (Surelite-II, Continuum, Santa Clara, CA, USA; wavelength 355 nm, double-pulse mode, 20 ns each pulse, 40 μs separation, maximum energy 20.7 mJ). To remove infrared and green laser light, the 355 nm line was reflected with a series of four dichroic mirrors onto the input of a liquid-light guide. The output of the liquid-light guide was passed into the epi-illumination port of an inverted microscope. After reflection by a dichroic mirror the light passed through the microscope objective generating a homogeneous illumination of the entire visible field.
Voltage clamp and data analysis
The _I_Na-Ca was recorded in the whole-cell configuration of the patch-clamp technique. The setup for current recordings was based on an Axopatch-1D voltage-clamp amplifier (Axon Instruments, Foster City, CA, USA). For intracellular dialysis the cells were patch clamped with pipettes made from filamented glass (GC150F-15, Clark Electromedical Instruments, Pangbourne, UK) on a horizontal puller (DMZ, Zeitz Instrumente, Augsburg, Germany) with final tip diameters of 1–2 μm. After filling with pipette solution the resistances of the pipettes ranged between 0.9 and 2.5 MΩ. Synchronization between the flash, control of membrane voltage and the data acquisition and current measurements digitized at 1000 Hz was performed by triggering via a fibre optic coupler connected to an Apple PowerPC 8100/100 equipped with a data acquisition board (software developed under LabView, both from National Instruments, Austin, TX, USA). Data were analysed using Igor Pro software (WaveMetrics, Lake Oswego, OR, USA). The _I_Na-Ca peak amplitude was determined from the mean current of five data points around the most inward current sample in the record after baseline correction. All values are expressed as means ±s.e.m. Student's paired t tests were used to test for significance. Significance is given as P < 0.05 or < 0.1, as indicated in the figure legends.
Confocal microscopy
For [Ca2+]i measurements 0.1 mM fluo-3 (Teflabs, Austin, TX, USA) was added to the pipette solution (Table 1, solution 5). The setup for fluorescence measurements was based on a confocal laser-scanning microscope (MRC 1000, Bio-Rad, Glattbrugg, Switzerland). Fluo-3 was excited at 488 nm with 50 μW intensity; fluorescence was detected at wavelengths > 515 nm. Amplitude and time course of Ca2+ concentrations were computed off-line from linescan images using a customized version of the NIH Image software (NIH, Bethesda, MA, USA). After background subtraction the fluorescence ratio (_R = F/F_0) was computed by dividing the image by the average resting fluorescence of the same image. The [Ca2+]i was derived using a self-ratio method assuming a resting [Ca2+]i of 100 nM and a dissociation constant (_K_d) of the fluo-3:Ca2+ complex of 400 nM (Cheng et al. 1993). For detection of pHi changes carboxy-SNARF-1 was loaded by exposing the cells to 5 μM SNARF-1-AM for 60 min at room temperature (Molecular Probes, Eugene, OR, USA; excitation, 488 nm; detection, 565 ± 15 nm). To obtain the pHi fluorescence signals, images were repeatedly acquired with a frequency of 1 Hz.
RESULTS
Extreme changes of pHo inhibit _I_Na-Ca
In the first series of experiments we examined whether the _I_Na-Ca induced by flash photolytic liberation of Ca2+ was affected by shifts of extracellular pH (pHo) in a way similar to the effects observed with intracellular pH (pHi). In order to investigate the influence of pHo on the Na+-Ca2+ exchange process, experimental conditions were necessary to make the Na+-Ca2+ exchange the dominant system for removing Ca2+ from the cytosol. Since the photorelease of caged Ca2+ would also trigger Ca2+ release from intracellular stores via Ca2+-induced Ca2+ release (CICR), release by the SR and uptake of additional Ca2+ must be eliminated. Therefore the cells were pre-treated with thapsigargin and ryanodine to suppress the action of the SR. The rapid activation (∼2 ms) of the _I_Na-Ca in response to the UV flash (Fig. 1_a_) indicates that the exchange current is only a result of the photolytically generated Ca2+ transient without a contribution by CICR, which would generate an additional slow component during the activation phase of the _I_Na-Ca (DelPrincipe et al. 1999). Figure 1_a_ shows three superimposed examples of _I_Na-Ca under control conditions (pH 7.4), in alkaline medium (pH 10), and in acidic medium (pH 5) at a membrane potential of −40 mV. The analysis of a large number of such experiments (Fig. 1_B_ and C) revealed that reducing the pHo was accompanied by a decrease of the peak _I_Na-Ca to about 6.6 % (at pH 4, _n_= 12).
Figure 1. Inhibition of the Na+-Ca2+ exchanger by alterations of pHo.
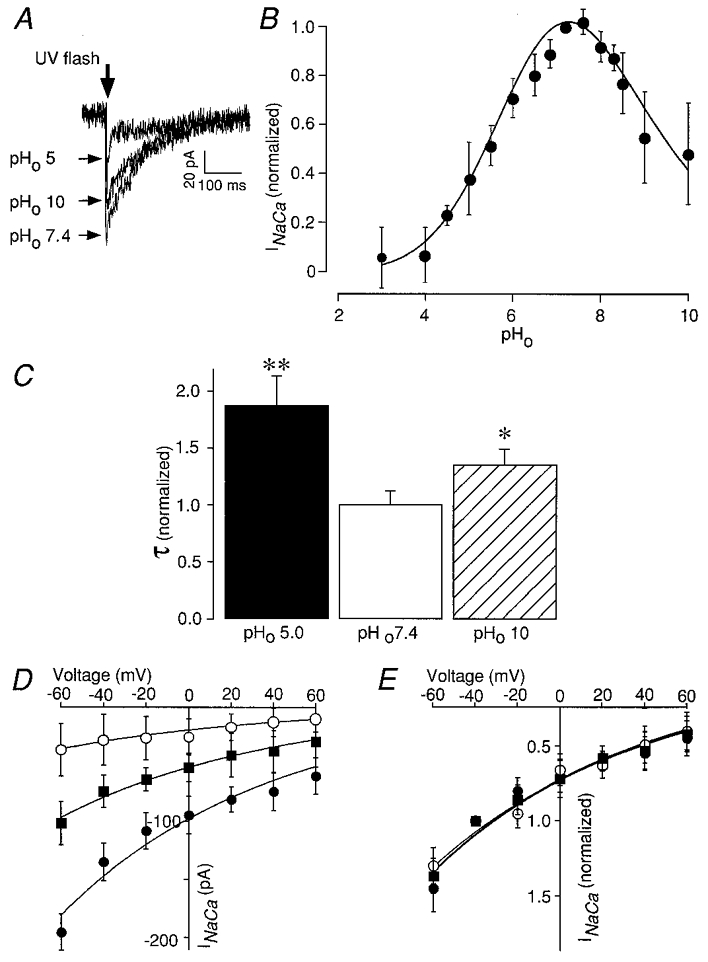
A, three examples of Na+-Ca2+ exchange currents (_I_Na-Ca) induced by flash photolysis of DM-nitrophen (2 mM) and recorded in acidic (pHo 5), alkaline (pHo 10) and neutral (pHo 7.4) extracellular solution. All experiments were carried out in the presence of 10 μM ryanodine and 0.1 μM thapsigargin. B, the bell-shaped curve reveals that pHo extremes can inhibit the peak _I_Na-Ca. The _I_Na-Ca peak amplitude was determined from the mean of five data points around the most negative sample in the current record and normalized at _V_m=−40 mV and pHo 7.4 after correction for photoconsumption (see Fig. 2_B_). Reducing the pHo was accompanied by a decrease of the peak _I_Na-Ca to less than 7 % (pH 4–5). The peak _I_Na-Ca was also inhibited to about 48 % of its initial value by increasing pHo to 10. The data were fitted using two Hill equations describing the pHo range with the following parameters:

Bars represent mean ±s.e.m. (_n_= 5–10). C, pHo effects on _I_Na-Ca time course. The time constants were determined by fitting a monoexponential function to _I_Na-Ca with a least-squares technique. Occasionally, a rapid current component not arising from _I_Na-Ca was observed (Fig. 1_A_). The rapid _I_Na-Ca component was not used for analysis and fitting. The Na+-Ca2+ exchange current decay was slowed at high and low pHo. The graph represents τ normalized for pHo 7.4. Acidification (pHo 5.0) and alkalinization (pHo 10.0) increased τ significantly (pHo 5.0: τ= 863 ± 123 ms; pHo 7.4: τ= 459 ± 54 ms; pHo 10.0: τ= 620 ± 64 ms). Error bars represent mean ±s.e.m. (_n_= 6). *P < 0.05 vs. pHo 7.4 and **P < 0.001 vs. pHo 7.4. D, voltage dependence of _I_Na-Ca induced by concentration jumps of [Ca2+]i at pHo 7.4, pHo 5 and pHo 10. The amplitude of the peak _I_Na-Ca inward current shows a tendency to increase with more negative potentials independent of the pHo. However, at pHo 5 the I_Na-Ca_-V relationship deviates at potentials below −20 mV and the _I_Na-Ca appears to saturate. The lines represent non-linear least-squares fits of the Di Francesco-Noble model:

(Di Francesco & Noble, 1985), where a is a scaling factor determining the magnitude of _I_Na-Ca and r represents the asymmetrical position of the energy barrier inside the electrical field of the sarcolemmal membrane. pH 7.4 (•): _a_=−0.36 × 10³, _r_= 0.73; pH 5.0 (^): _a_=−7.8 × 10⁻⁵, _r_= 0.75; pH 10 (▪): _a_=−1.89 × 10⁻⁴, _r_= 0.74. Error bars represent mean ±s.e.m. (_n_= 8). E, normalized voltage dependence of the peak _I_Na-Ca. At pHo 5 and pHo 10, the normalized I_Na-Ca_-V curve is superimposable on the control curve. Currents are normalized with respect to the current elicited at −40 mV (mean ±s.e.m., _n_= 8).
However, the peak _I_Na-Ca was also inhibited to about 48.1 % (_n_= 10) of its initial value by increasing pHo to 10. The block of _I_Na-Ca induced by both alkalinization and acidification was completely reversible. The onset of inhibition and the recovery from block were rapid and presumably limited by the extracellular solution change. There was a ‘bell-shaped’ dependence of the peak _I_Na-Ca on pHo, similar to the effect of intracellular protons on _I_Na-Ca (Doering & Lederer, 1993). The data were well described by fitting two Hill equations (Fig. 1_B_, parameters are given in the figure legend). At acidic pH half-maximal inhibition of peak _I_Na-Ca occurred at pHo 5.42 while alkalosis suppressed _I_Na-Ca half-maximally at pHo 8.57. Interestingly, the maximal _I_Na-Ca was observed at pHo 7.6 and not at the ‘physiological’ pH of 7.4 (Doering & Lederer, 1993).
There are a number of ways by which _I_Na-Ca might be reduced by extreme pHo: (i) protonation reactions may completely immobilize a fraction of the exchanger molecules without affecting the turnover rate of the remaining exchangers; (ii) the amount of electrical charge moved per turnover may be reduced; (iii) the turnover rate (estimated to be ∼2.500 s−1, Niggli & Lederer, 1991) of all exchangers may be slowed down for several reasons. For example, the rate-limiting step of the Na+-Ca2+ exchange may be slowed owing to changes of the experienced electrical field or protonation may lead to conformational changes of the Na+-Ca2+ exchange molecule that slow it down without affecting the charge carrying reaction steps. Some of these interactions with protons would be expected to change the voltage dependence and/or electrogenicity of the overall transport cycle.
Since in the absence of other Ca2+ removal systems the decay of the _I_Na-Ca is determined by the removal of [Ca2+]i by the Na+-Ca2+ exchange itself, the time course of the current decay allows a rough estimate of the rate of Ca2+ transport by the Na+-Ca2+ exchange. Figure 1_C_ compares the normalized τ of the Na+-Ca2+ exchange current at pHo 7.4, pHo 10 and pHo 5 (τ at pHo 7.4 = 1). Under extreme pHo the time course of the Na+-Ca2+ exchange current was significantly prolonged compared with that at pHo 7.4. It is, however, noticeable that at acidic pHo the prolongation of the decay was less pronounced than what one would have expected based on the reduction of the peak current. This discrepancy could arise from other Ca2+ transport processes removing Ca2+ preferentially at acidic pH or, more interestingly, from a change in the electrogenicity of the Na+-Ca2+ exchanger. This issue was addressed in another series of experiments (see below).
In order to determine the voltage dependence of the Na+-Ca2+ exchanger we analysed peak _I_Na-Ca elicited by flash photolytic [Ca2+] jumps performed in the voltage range from −60 mV to +60 mV (Fig. 1_D_ and E). It is important to note that the _I_Na-Ca induced by a transient elevation of [Ca2+]i was always inward and exhibited no reversal because it represents a change of _I_Na-Ca corresponding to a difference current and not the total current carried by the Na+-Ca2+ exchanger (Läuger, 1991; Niggli & Lederer, 1993). Indeed, in the voltage range examined reversal of _I_Na-Ca was not observed, suggesting that contamination with other Ca2+- activated currents was negligible. This is seen in Fig. 1_D_ and E. Although the current amplitude was clearly affected by pHo, Fig. 1_D_ indicates that the amplitude of the peak _I_Na-Ca had a tendency to be larger at more negative potentials irrespective of the pHo. The peak _I_Na-Ca increased from −60.7 pA at +60 mV to about −195.9 pA at −60 mV under control conditions at pHo 7.4. The same tendency was observed at pHo 5 where the _I_Na-Ca increased from −11.8 to −38.6 pA over this voltage range. After normalization the I_Na-Ca_-V curves at pHo 5 and pHo 10 could be superimposed on the control data confirming that the current-voltage relationship was not noticeably affected by the extracellular pH (Fig. 1_E_).
A series of experiments was performed to examine how the experimental results were affected by photoconsumption of DM-nitrophen and to exclude unwanted side-effects of the different buffers used. These findings are summarized in Fig. 2. The largest variability of _I_Na-Ca in the flash photolytic experimental approach results from the photoconsumption of the ‘caged’ calcium compound DM-nitrophen. At constant flash energy, every flash photolyses a given fraction of DM-nitrophen. Therefore, a continuous decrease of the peak current from flash to flash is expected. Nevertheless, there is also a slow supply of unphotolysed DM-nitrophen from the patch pipette during the experiment, especially when flashes are only applied every 30 s (i.e. during photolysis with the xenon flash lamp system). Figure 2_a_ shows the normalized peak inward _I_Na-Ca as a function of flash numbers obtained by repeatedly discharging 230 W flashes at a holding potential of −40 mV. As expected for photoconsumption of the caged compound, a monoexponential decrease of the peak _I_Na-Ca was observed corresponding to about 6.6 % photolysis of DM-nitrophen with each flash. How can we correct for this photoconsumption when quantifying _I_Na-Ca? This is illustrated in one example in Fig. 2_B_. For the data analysis and normalization, each test flash was bracketed by two control flashes at pH 7.4 (at −40 mV). A correction for photoconsumption was applied by normalizing to a value determined by linear interpolation between two adjacent control values. Figure 2_C_ shows that the three different pH buffers used to cover the large pH range from 3 to 10 (Hepes, Mes and Tricine) had no unexpected side effects on the amplitude of _I_Na-Ca. For this control experiment _I_Na-Ca was measured for each buffer at identical pHo and at −40 mV.
Figure 2. Experimental protocol, photoconsumption and pH-buffer effects on _I_Na-Ca.
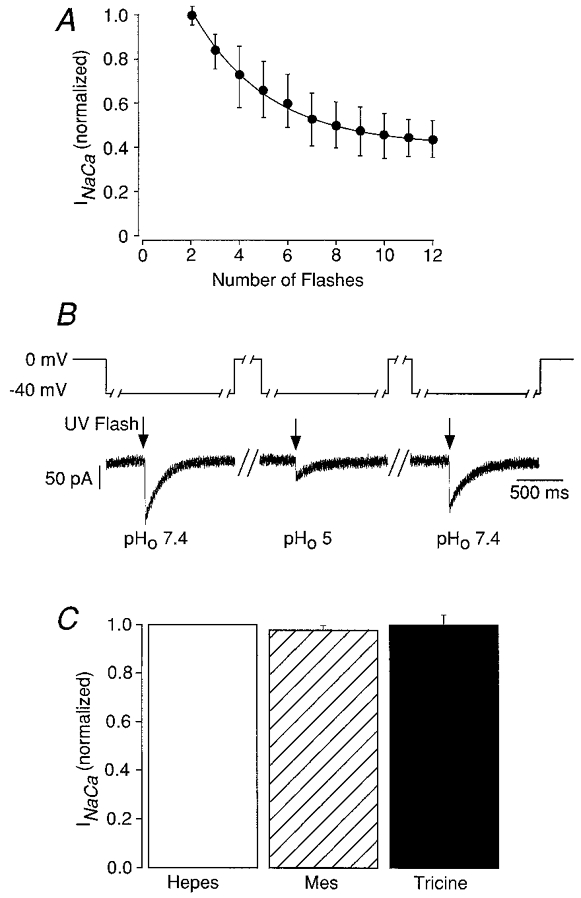
A, INa-Ca peak inward currents were induced by repeatedly applying 230 W flashes at a holding potential of −40 mV. Error bars represent mean ±s.e.m. (_n_= 5–12). The photoconsumption of DM-nitrophen was accompanied by decreasing peak _I_Na-Ca and the experimental data can be fitted with a monoexponential function. B, this protocol was used to correct _I_Na-Ca for the photoconsumption of DM-nitrophen. For data analysis and normalization, each test flash at each pHo was bracketed by two control flashes at −40 mV in pHo 7.4. The correction for photoconsumption was performed by normalization to a value determined by linear interpolation between two adjacent control values. A flash (indicated by arrow) was triggered 2 s after the voltage step, which was maintained for an additional 1 s. Unless indicated otherwise the _I_Na-Ca measurements themselves were performed after repolarizing to −40 mV. Except for 2–4 s before the flash where the cells were superfused with the test solution, the myocytes were continuously superfused with the control solution (pH 7.4). C, no stimulation or inhibition of _I_Na-Ca was observed by Hepes, Mes or Tricine at pH 7.4. Bars represent mean ±s.e.m. (_n_= 7).
pHi is not affected during brief acidic pHo shifts in Hepes-buffered myocytes
Since it is known that changes of intracellular pH also affect the Na+-Ca2+ exchanger, we performed confocal measurements of pHi with carboxy-SNARF-1 to exclude changes of pHi resulting from the imposed dramatic changes of pHo (Fig. 3). Figure 3_a_ shows an experiment performed in an adult guinea-pig ventricular myocyte under whole- cell patch-clamp conditions with 20 mM Hepes perfusion. The superfusion with 10 mM NH4Cl as well as the solution change to pHo 5 induced only slow and small changes of pHi, suggesting that 20 mM Hepes is sufficient to protect the intracellular milieu from substantial pHi shifts, even during prolonged exposures (about 50 s in Fig. 3_a_).
Figure 3. Changes of pHi recorded with carboxy-SNARF-1.
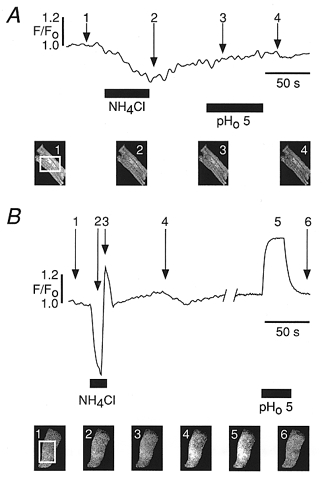
A, confocal fluorescence trace of a strongly pH-buffered adult guinea-pig myocyte in whole-cell configuration pre-loaded by exposure to 5 μM carboxy-SNARF-1-AM. The pipette solution contained 20 mM Hepes, identical to all other experiments. No substantial change of the fluorescence intensity during the superfusion step with pH 5 solution was observed. B, confocal fluorescence measurement using carboxy-SNARF-1-AM (loading with 5 μM for 60 min, room temperature) in neonatal rat myocytes. Superfusion with 10 mM NH4Cl to induce an acid load induced the fluorescence response characteristic for the NH4+ prepulse method (Buckler & Vaughan-Jones, 1990). Superfusion with pHo 5 induced an increase of the carboxy-SNARF-1 fluorescence. Snapshot images (1–4 in A and 1–6 in B) were taken at different times during each superfusion step, indicated by arrows.
Figure 3_B_ shows a control experiment in unbuffered cells (i.e. no Hepes), where substantial pH shifts could be elicited. A typical fluorescence trace recorded from a neonatal rat myocyte pre-loaded with carboxy-SNARF-1-AM but without any other added pH buffer is illustrated in Fig. 3_B_. In the experiment shown the cell was challenged by superfusion of NH4Cl. Using this manoeuvre, the fluorescence exhibited the well-described NH4Cl response (NH4Cl prepulse technique; Buckler & Vaughan-Jones, 1990). A brief application of NH4Cl resulted in a transient rise in pHi (decrease in the fluorescence intensity) followed by a transient decrease in pHi upon NH4Cl removal. The observed rapid response indicates that the cell was intact and the incorporated fluorescent dye was indeed sensitive to changes in pHi. In the same preparation the superfusion with acidic solution (pH 5) also induced a transient decrease in pHi.
Thus, changes of intracellular pH seem to be unlikely under our experimental conditions (brief superfusion at varying pHo during ∼3-4 s in cells dialysed with 20 mM Hepes).
Charge and calcium transport by the Na+-Ca2+ exchanger
Since the _I_Na-Ca can be reduced in amplitude both by changes of the electrogenicity and by changes of the turnover rate it would be desirable to determine the turnover rate independently of the electrogenicity. Examining the rate of Ca2+ removal via the Na+-Ca2+ exchange may offer such a possibility, provided the suspected change in electrogenicity does not affect the number of Ca2+ ions transported per turnover. Therefore, we designed an experiment to determine the Ca2+ transport rate more directly while simultaneously recording I_Na-Ca. For this purpose we combined the flash photolysis of caged Ca2+ and the patch-clamp technique with Ca2+ measurements on a laser-scanning confocal microscope. Using this approach, a series of experiments was carried out to check for changes of Na+-Ca2+ exchange electrogenicity at extreme pHo. Figure 4_A–D_ details an example of the experimental protocol and the resulting data. The fluorescence signals are shown as line scan images and as plots of [Ca2+]i_versus time. Starting with a flash at pHo 7.4 (Fig. 4_a_) the cell was briefly (3 s) superfused with an external solution of pHo 5.0 and pHo 6.0 (Fig. 4_B_ and C). Finally, the protocol was completed by a second control experiment at pHo 7.4 for bracketing (Fig. 4_D_). The traces of [Ca2+]i revealed that at pH 5, where the current was markedly suppressed the [Ca2+]i signal was only slightly slowed (Fig. 4_B_; top trace).
Figure 4. The electrogenicity and Ca2+ transport rate of the Na+-Ca2+ exchanger in acidic pH.
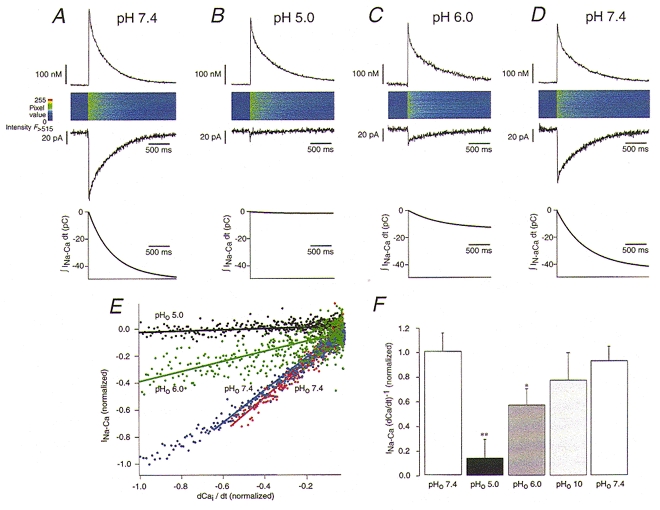
Comparison of _I_Na-Ca and Ca2+ transport in response to flash photolysis of caged Ca2+ in pHo 7.4 (A, initial control), pHo 5 (B), pHo 6 (C) and pHo 7.4 (D, re-control at end). Traces show from top to bottom: [Ca2+]i transients, line scan images of fluo-3 fluorescence, the corresponding I_Na-Ca traces (V_m=−50 mV) and the transported charge (∫_I_Na-Cad_t: pH 7 = 48.5 pC, pH 5 = 1.5 pC, pH 6 = 12.6 pC, pH 7 = 41.9 pC) measured in a single ventricular myocyte. In E, INa-Ca is plotted as a function of the Ca2+ transport rate (differentiated [Ca2+]i signal, dCa2+i/d_t) calculated from the data presented in A–D (control: red dots; re-control at end: blue dots; pHo 6: green dots; pHo 5: black dots). The data were normalized to the maximal _I_Na-Ca at pH 7.4 and the corresponding maximal Ca2+ transport rate. The lines represent linear fits of the experimental data (slopes: pHo 5 = 0.058, pHo 6 = 0.036, pHo 7.4start= 1.04, pHo 7.4end= 1.30). Acidification (pHo 5 and pHo 6) inhibited _I_Na-Ca to a larger extent than the Ca2+ transport rate (compare A and B), leading to a change in the slope. In F charge movement per transported Ca2+ is expressed as I_Na-Ca/(dCa2+/d_t) normalized for pH 7.4. Results are summarized for initial control (white bar), pHo 5 (black bar), pHo 6 (dark grey bar), pHo 10 (light grey bar) and final control at pHo 7.4 (white bar). Under extreme acidic conditions (pHo 5 and pHo 6) I_Na-Ca/(dCa2+/d_t) was significantly reduced. Error bars represent mean ±s.e.m. (_n_= 6). *P < 0.05 vs. pHo 7.4 and **P < 0.001 vs. pHo 7.4.
The simultaneous measurements of _I_Na-Ca and the changes of [Ca2+]i make it possible to compare the transport of Ca2+ and the transport of electrical charge during I_Na-Ca. To obtain an estimate of the Ca2+ transport and for the analysis, the Ca2+ signals were converted into the Ca2+ transport rate (d[Ca2+]i/d_t). For the experiment shown in Fig. 4 we also calculated the maximal Ca2+ transport rates at: pHo 7.4, 780 nM s−1; pHo 5, 530 nM s−1; pHo 6, 590 nM s−1; and the second control at pHo 7.4, 650 nM s−1. I_Na-Ca was fitted by a monoexponential function and the integral (∫_I_Na-Cad_t) was calculated which represents the net charge transport mediated by the exchanger (the values are given in the legend to Fig. 4). From this calculation we were able to determine the fraction of Ca2+1 which was removed from the cytosol by the conventional mode of Na+-Ca2+ exchange. Thus, at pHo 5 only ∼3 % and at pHo 6 ∼26 % of the photolytically released Ca2+ was moved electrogenically compared with 100 % at pH 7.4. In Fig. 4_E_ each Na+-Ca2+ exchange current was plotted as a function of the corresponding Ca2+ transport rate (data from Fig. 4_A–D_) and the data were fitted with a linear equation. The two experiments at a pHo of 7.4 (red dots; i.e. the initial and the final control) were virtually superimposable and had very similar slopes. It is obvious that during exposure to low pHo (black dots) the exchange current I_Na-Ca was much more inhibited than the corresponding Ca2+ removal signal (d[Ca2+]i/d_t), leading to a 28.2- and 17.9-fold change in the slope of the fit at pHo 5 and 6, respectively. After normalization for the slope at pH 7.4 a number of similar experiments from different cells were analysed (Fig. 4_F_). We found that the slope was indeed significantly reduced at low pHo, while this was not the case during inhibition of the Na+-Ca2+ exchange by alkaline solutions (Fig. 4_F_).
In Fig. 5 we examined the voltage dependence of the [Ca2+]i decline which is apparently not accompanied by _I_Na-Ca. For this purpose we simultaneously measured _I_Na-Ca and the Ca2+ transport rate at voltages between −100 and +80 mV. I_Na-Ca and d[Ca2+]i/d_t were normalized to the values measured at −40 mV. The voltage dependence of Ca2+ transport and _I_Na-Ca were found to be indistinguishable at pHo 7.4 (Fig. 5_a_) and at pHo 5 (Fig. 5_B_), respectively. Both increased about 3-fold when hyperpolarizing from +80 to −100 mV, suggesting that the electroneutral Ca2+ removal was still voltage dependent (see Discussion).
Figure 5. Voltage dependence of the Ca2+ transport rate and of the peak _I_Na-Ca.
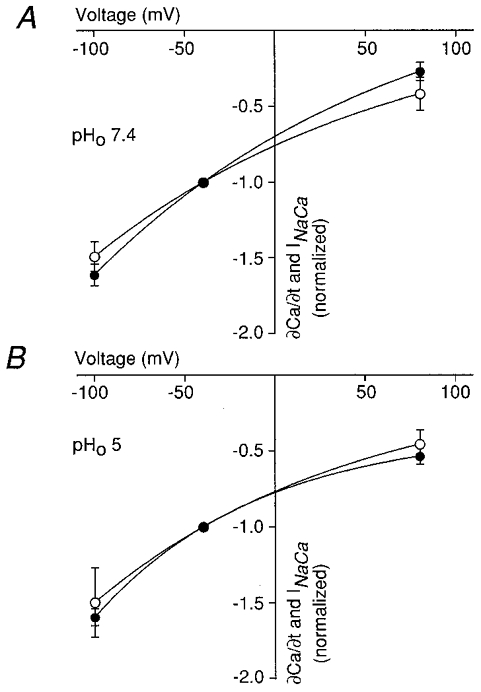
A, normalized Ca2+ transport rate (d[Ca2+]i/d_t_; •) and normalized _I_Na-Ca (^) as a function of voltage at pH 7.4 and in B at pH 5. The experimental data can be fitted with a monoexponential function. Error bars represent mean ±s.e.m. (_n_= 3). Hyperpolarization increased both _I_Na-Ca and Ca2+ transport rate comparably.
How can we explain the discrepancy between the strong inhibition of _I_Na-Ca and the weak effect on Ca2+ transport rate? A change in the electrogenicity of the Na+-Ca2+ exchange would be an obvious possibility. Alternatively, the discrepancy between the _I_Na-Ca block and the nearly unchanged Ca2+ transport rate under acidic conditions could result from the stimulation of another pathway for sarcolemmal Ca2+ removal by protons (e.g. the sarcolemmal Ca2+-ATPase which is a Ca2+-proton countertransporter; Dixon & Haynes, 1990; Naderali et al. 1997).
Proton effect on the sarcolemmal Ca2+-ATPase
To test for a possible stimulation of the sarcolemmal Ca2+-ATPase by extracellular protons, we used the experimental strategy to block Ca2+ removal via the Na+-Ca2+ exchanger with an intervention that was independent of the block by pHo but would not affect the Ca2+ pump (Fig. 6). Since Ca2+ removal by the Na+-Ca2+ exchange requires extracellular Na+ we compared Ca2+ extrusion in the presence and absence of Na+0 at pHo 7.4 (d[Ca2+]i/d_t_= 740 nM s−1) and pH 5, a test which should reveal any stimulation of the Ca2+-ATPase by extracellular protons (Fig. 6). In Na+-free media at pHo 7.4 a [Ca2+]i jump induced by flash photolysis resulted in a Ca2+ signal that only decayed very slowly (30 nM s−1) since the Na+-Ca2+ exchange was not functioning. When the same experiment was performed at pH 5 (Fig. 6_C_) the decay of [Ca2+]i was only moderately slowed in the presence of Na+0 (370 nM s−1). However, removing Na+0 at pHo 5 again slowed Ca2+ extrusion considerably (60 nM s−1; Fig. 6_D_), suggesting that the Na+-Ca2+ exchange was important for removal of [Ca2+]i at pH 5. In other words, proton stimulation of the Ca2+ pump, if present, is negligible and the Na+-Ca2+ exchange rapidly extrudes Ca2+ while generating little current at pHo 5.
Figure 6. Ca2+ transport by the Na+-Ca2+ exchanger in low pH and zero Na+.
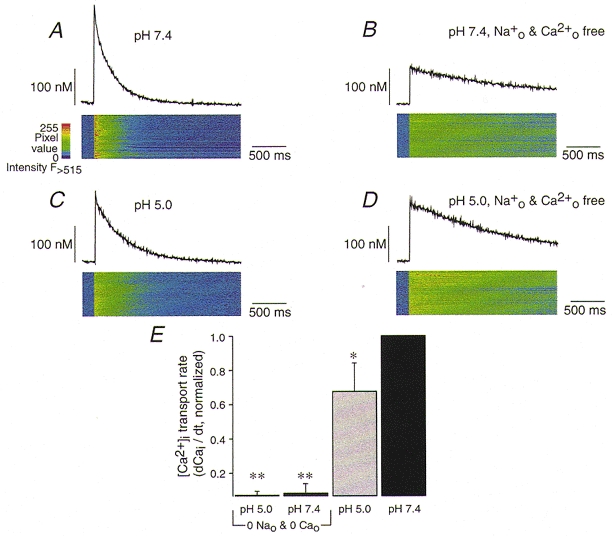
Ca2+ extrusion via the Na+-Ca2+ exchanger was blocked by omitting Na+ and Ca2+ from the superfusing solution. Traces in A–D show from top to bottom: [Ca2+]i transients and the corresponding line scan images of fluo-3 fluorescence in pHo 7.4 (A) and pHo 5 (C), and under Na+0- and Ca2+o-free conditions: pHo 7.4 (B) and pHo 5 (D) measured in a single ventricular myocyte. In E, the Ca2+ transport rate (dCai/d_t_) was calculated and normalized for the maximal rate at pHo 7.4. Note that in the absence of Na+ no acceleration of Ca2+ transport by pH 5 was observed. Error bars represent mean ±s.e.m. (_n_= 6). *P < 0.05 vs. pHo 7.4 and **P < 0.001 vs. pHo 7.4.
When the Ca2+-transport rates were analysed in several cells it became clear that the protons did not significantly stimulate additional Ca2+ extrusion pathways (Fig. 6_E_). Na+ removal slowed down Ca2+ extrusion by about 93 % irrespective of the pHo. Given these results an interference by the Ca2+-ATPase becomes very unlikely. However, it is conceivable that the discrepancy between the inhibition of the Na+-Ca2+ exchange current and the Ca2+ transport rate arises from a change of the electrogenicity of ion transport.
DISCUSSION
Pathophysiology of pH changes
It has been shown in several studies that during ischaemia the Na+-Ca2+ exchange activity is dramatically downregulated in cardiac myocytes (e.g. Meno et al. 1989; Tani, 1990). One view is that this ‘regulation’ of the exchanger protein results predominantly from changes of pH. An understanding of these interactions is important to predict the behaviour of the exchanger under pathophysiological conditions. The intracellular pH is known to decrease by ∼0.8 pH units within 1 min after the onset of ischaemia (Yan & Kléber, 1992). Ischaemia is accompanied by a more prominent extracellular acidification than intracellular acidification after approximately 8 min. Consequently, the transmembrane pH gradient can even reverse (pHo 6.64 and pHi 6.93; Yan & Kléber, 1992). The ‘proton block’ of the Na+-Ca2+ exchange process was first observed in the squid giant axon (Baker & MacNaughton, 1977) and characterized in sarcolemmal vesicles (Philipson et al. 1982). In experiments carried out in the giant patch preparation (Hilgemann, 1989), it was observed that alkalinization of cytoplasmic pH (7.2-8.0) caused an increase in Na+-Ca2+ exchange current, while lowering the cytoplasmic pH from 7.2 to 6.4 inhibited _I_Na-Ca (Doering & Lederer, 1993; Doering et al. 1996). At pH 6.4 the outward _I_Na-Ca was inhibited by about 98 % (Doering et al. 1996). Interestingly, partial proteolysis of the intracellular loop of the exchange protein largely abolished the pHi sensitivity. Based on these observations it was concluded that the protonation state of specific residues of the Na+-Ca2+ exchanger or other proteins associated with the intracellular loop of the exchanger are critical for the pHi regulation (Doering & Lederer, 1993, 1994; Doering et al. 1996). Since extracellular pH is known to change dramatically during several pathophysiological conditions, we performed a detailed analysis of the Na+-Ca2+ exchanger function both in terms of generated membrane current and Ca2+ transport. For this purpose, we explored a wide range of pHo changes in intact voltage-clamped myocytes.
_I_Na-Ca is affected by acidic and alkaline pHo shifts
The main finding of the present study is that the Na+-Ca2+ exchange current was sensitive towards changes of pHo during both alkalinization and acidification and over a large pH range. The block of _I_Na-Ca induced by elevation of the extracellular proton concentration was comparable in extent and pH dependence to the _I_Na-Ca block induced by acidic cytoplasmic pH in the giant patch preparation (Doering et al. 1996). In addition to the suppression at acidic pHo, we found a marked inhibition of _I_Na-Ca at low proton concentrations. Interestingly, moderate alkalosis up to pH 7.6 led to a noticeable stimulation of _I_Na-Ca, suggesting that in experiments carried out at pH of 7.4 the exchanger is already slightly inhibited by protons. Taken together, the pHo dependence turned out to be bell shaped. This unique dose dependence is quite characteristic for the pH effects on many proteins and has been reported for the turnover rate of several transporters and enzymes including Ca2+-ATPase (Bishop & Al-Shawi, 1988). This bell-shaped pH dependence also suggests the existence of at least two protonation sites on the protein that may modulate transport of substrates and/or charge in various ways.
Quantification of Na+-Ca2+ exchange as membrane current and Ca2+ transporter
The quantification of the Na+-Ca2+ exchange current in intact ventricular myocytes is not straightforward and a number of potential pitfalls need to be considered. The photorelease of ‘caged’ Ca2+ in the whole-cell configuration turned out to be an ideal approach to activate _I_Na-Ca and to examine ‘modulatory’ effects on the Na+-Ca2+ exchange mechanism. This technique has the important advantage that the substrates for _I_Na-Ca activation can be controlled nearly perfectly. Moreover, no voltage steps are required to activate _I_Na-Ca and the possible activation of voltage-dependent contaminating currents can thus be excluded. It has been shown previously that in guinea-pig ventricular myocytes all currents activated by flash photolytic jumps of [Ca2+]i are dependent on Na+ and are Ni2+ sensitive, suggesting that they are only mediated by the Na+-Ca2+ exchanger (Niggli & Lederer, 1993).
When assessing Ca2+ transport via the Na+-Ca2+ exchange, other Ca2+ transport mechanisms removing or sequestering cytosolic Ca2+ need to be inhibited. This was achieved by pre-incubating the cells with thapsigargin and ryanodine to eliminate the SR as a source and sink for Ca2+. Under these conditions, the peak _I_Na-Ca and the rate of Ca2+ removal are largely determined by the Na+-Ca2+ exchange activity. This is apparent in experiments carried out in Na+0-free conditions (Fig. 6_a_ and B), where the decay of [Ca2+]i after a flash was slowed down considerably. Taken together these results and the control experiments using confocal measurements of pHi suggest that the membrane currents and the Ca2+ removal observed after intracellular Ca2+ steps arose from the activity of the Na+-Ca2+ exchanger and were not contaminated by other membrane currents or Ca2+ transport mechanisms. In addition, these findings revealed that the buffer concentration of 20 mM Hepes in the pipette solution was sufficient to protect the cellular interior from changes of global pHi during superfusion with extremely acidic solutions.
The discrepancy between block of _I_Na-Ca and inhibition of Ca2+ transport in acidic pHo
Based on exchange current experiments alone the molecular mechanism(s) underlying ‘proton block’ cannot be derived. In this regard, unidirectional tracer flux measurements can provide unique information that cannot be obtained when measuring _I_Na-Ca. Based on such flux measurements in cardiac sarcolemmal vesicles, it has been concluded that the voltage-sensitive Na+ transport is the rate-limiting step (i.e. the slowest reaction step in the biochemical reaction cycle) in a range of pH conditions (pH 7.0-9.7). Interestingly, at pH 6.1 the exchanger lost the voltage sensitivity of Ca2+ uptake (Khananshvili et al. 1994, 1995). There are at least two ways to explain these results: (i) protons may modify the exchange cycle in such a way that the Ca2+ influx becomes rate limiting for the Na+-Ca2+ exchange without altering the stoichiometry. However, rate-limiting Ca2+ influx can only be voltage independent if no charge is moved with this step. The Ca2+ translocation step was found to be electrogenic in some experiments (Niggli & Lederer, 1991; Kappl & Hartung, 1996; He et al. 1998), but not in others (Hilgemann et al. 1991). Alternatively (ii) protons may directly change the 3 Na+:1 Ca2+ stoichiometry into an electroneutral exchange (Khananshvili et al. 1994, 1995). Recently it was found that in cardiac sarcolemmal vesicles Na+0-dependent Ca2+ efflux was able to generate a membrane potential at low pH. This observation suggests that the protons did not eliminate the electrogenicity completely (Baazov et al. 1999). Although the _I_Na-Ca was clearly inhibited by acidic pHo in our study, the voltage dependence of the remaining current and the voltage dependence of the Ca2+ transport rate were virtually unchanged. This indicates that the charge moved during the rate-limiting step was not affected by the protonation reaction. The Na+-Ca2+ exchange cycle is believed to comprise more than one step carrying charge across the membrane, each of which is voltage dependent (Niggli & Lederer, 1991; He et al. 1998). The details are not yet known but the Na+ translocation is assumed to be rate limiting for the exchange cycle while the charge movement during other electrogenic steps (e.g. the Ca2+ translocation) is believed to be much more rapid. Even though all electrogenic steps exponentially depend on the membrane potential as sensed by the moved charge, for the overall turnover rate of the transporter only modifications of the slow (i.e. rate-limiting) step are important (Läuger 1991).
Changes of a rapid reaction step would have little effect on the turnover rate. Thus, a change of the electrogenicity without modifications of the voltage dependence as observed here, is expected if the charge translocated during the rate-limiting step is not affected by the protonation.
We found a contrasting behaviour of the Ca2+ transport mediated by the Na+-Ca2+ exchanger which may be related to the proposed change of electrogenicity at low pH. The Ca2+ transport contains information about the Na+-Ca2+ exchange turnover rate that is partly independent of the generated membrane current. For example, an altered exchange of 1 Ca2+:2 Na+ (or 1 Ca2++ 1 K+:3 Na+) would yield no measurable _I_Na-Ca but would still allow Ca2+ removal. Thus, with our experimental techniques we are able to determine two parameters with complementary information content. One is the current amplitude itself, which depends on the turnover rate and on the electrogenicity of the exchange stoichiometry (i.e. normally 1 elementary charge per exchange cycle and exchanger molecule). The second parameter is the rate of Ca2+ transport by the Na+-Ca2+ exchange, which does not per se depend on the electrogenicity and stoichiometry, as long as there is net movement of 1 Ca2+ ion per exchange cycle. Initially, we tried to estimate the rate of Ca2+ transport by the Na+-Ca2+ exchange from the time course of the Na+-Ca2+ exchange current (Fig. 1_C_). This is possible in principle because the current itself is known to linearly depend on [Ca2+]i (e.g. Beuckelmann & Wier, 1989; Lipp et al. 1990; DelPrincipe et al. 1999). Since the amount of photoreleased Ca2+ does not vary with pHo the total integrated charge moved during _I_Na-Ca should remain constant even when pH reduces the turnover rate. The total charge moved after a photolytic Ca2+ release could in principle be estimated by numerical integration of the current from the flash to the point where the baseline is reached, as shown in Fig. 4.
Since the integration of currents is not very reliable, particularly during small currents, an independent estimate of the rate of Ca2+ transport would be preferable. For this purpose we carried out experiments were the [Ca2+]i signal was recorded on a confocal microscope after the flash photolytic Ca2+ jump while I_Na-Ca was measured simultaneously. This allowed us to examine the rate of Ca2+ removal mediated by the Na+-Ca2+ exchanger directly and independently of the electrogenicity of the exchange process. Surprisingly, the Ca2+ transport rate (d[Ca2+]i/d_t) was only slightly decreased at low pH while the exchange current was almost completely inhibited. When compared with control experiments at pH 7.4 the slope of a linear fit of I_Na-Ca_versus d[Ca2+]i/d_t_ was strikingly reduced. Taken together, these results suggest that the rate of Ca2+ transport may be less affected than the average charge moved per transported Ca2+, a notion that would also imply changes in the electrogenicity of the Na+-Ca2+ exchange cycle at low pHo. How could such a change be induced at the molecular level?
While the Na+-Ca2+ exchange is believed to exhibit a constant stoichiometry under physiological conditions (Reeves & Hale, 1984; Crespo et al. 1990), changes in the electrogenicity may occur after protonation at low pH. To explain the observed reduction of the electrogenicity this would need to be either negatively charged ions transported in (e.g. Cl−) or positively charged ions moved out (e.g. K+) via the Na+-Ca2+ exchanger. A possibility would be the concomitant outward movement of a K+ or Cs+ ion, leading to a stoichiometry of 3 Na+:1 Ca2++ 1 K+. A similar transport mode is employed by the Na+-Ca2+-K+ exchanger found in the rod outer segment (4 Na+:1 Ca2++ 1 K+; Cervetto et al. 1989; Schnetkamp et al. 1991). Presumably, at low pHo a small fraction of the Na+-Ca2+ exchangers continue to function normally, thus still generating a small current and some Ca2+ transport. The remaining protonated exchanger molecules could undergo a conformational change that allows them to transport Ca2+ without generating any current (i.e. those working with an electroneutral stoichiometry) but would still be able to lower [Ca2+]i. For example, this could correspond to a stoichiometry of 3 Na+:1 Ca2++ 1 K+ or 2 Na+:1 Ca2+ or 1 Na++ 1 H+:1 Ca2+ or 2 H+:1 Ca2+. Since the Ca2+ removal at pHo 5 still required the presence of extracellular Na+ the latter possibility can be excluded. Obviously, the 2 Na+:1 Ca2+ mode cannot lower [Ca2+]i to normal resting levels because of thermodynamic reasons. The 3 Na+:1 Ca2++ 1 K+ stoichiometry would maintain sufficient electrochemical driving force for efficient Ca2+ removal. In addition, the number of Na+ ions translocated during the rate-limiting step and thus the voltage dependence would remain constant, as observed in our experiments.
Interactions of the sarcolemmal Ca2+-ATPase in [Ca2+]i removal
However, we also had to consider alternative explanations for the discrepancy (_I_Na-Ca:Ca2+ transport rate). In principle, other Ca2+ removal systems might interfere with our experiments and lead to a decline of [Ca2+]i that is not due to Na+-Ca2+ exchange activity. Therefore, we examined whether low pHo might lead to stimulation of other sarcolemmal Ca2+ transport and/or removal mechanisms, such as the sarcolemmal Ca2+-ATPase (Choi & Eisner, 1999). In rat ventricular myocytes the Ca2+-ATPase makes a contribution to Ca2+ removal from the cytosol which is ∼25 % of that mediated by the Na+-Ca2+ exchange (Choi & Eisner, 1999). This is expected to be less in guinea-pig ventricular myocytes because of the higher exchanger density in this species (Sham et al. 1995). Under physiological conditions, the contribution of the sarcolemmal Ca2+ pump thus appears to be small in cardiac myocytes (Negretti et al. 1993; Bassani et al. 1994, 1995). This can also be seen in Fig. 6_B_ where both the SR Ca2+ pump and the Na+-Ca2+ exchange were blocked. Nevertheless, a slow decrease of [Ca2+]i was observed. The process underlying Ca2+ removal under these conditions may be a combination of Ca2+ extrusion via the sarcolemmal Ca2+-ATPase, mitochondrial Ca2+ sequestration and Ca2+ buffering via the patch pipette.
It has been reported that the Ca2+-ATPase can be dramatically activated at low pH (Dixon & Haynes, 1990; Naderali et al. 1997). In bovine sarcolemmal vesicle preparations the velocity of Ca2+ removal was doubled when pHo was reduced from 7.2 to pH 6.6 (Dixon & Haynes, 1990). Because of this observation we repeated the experiment in zero Na+0 in low pHo. Under these conditions Ca2+ extrusion was inhibited by Na+ removal in a comparable way. This result is clearly inconsistent with the idea of a stimulation of Ca2+-ATPase activity by acidic pHo. The discrepancy between the _I_Na-Ca block and Ca2+ transport can thus not be explained by stimulation of the Ca2+-ATPase activity by low pH. More likely, this discrepancy arises from a change in the electrogenicity of the Na+-Ca2+ exchange transport cycle, as outlined above.
In summary, changes of extracellular pH occurring during ischaemia may profoundly influence the electrogenic properties and, to a lesser extent, the Ca2+ transport capabilities of the Na+-Ca2+ exchanger. This may have important consequences for the electrical and mechanical activity of the diseased heart.
Acknowledgments
This work was supported by the Swiss National Science Foundation (31–50564.97) and the Roche Research Foundation. We are grateful to Dr D. Eisner for stimulating discussions, to Drs H. P. Clamann and F. DelPrincipe for helpful comments on the manuscript and to D. Lüthi for technical assistance.
References
- Baazov D, Wang X, Khananshvili D. Time-resolved monitoring of electrogenic Na+-Ca2+ exchange in isolated cardiac sarcolemmal vesicles by using rapid-response fluorescence probe. Biochemistry. 1999;38:1435–1445. doi: 10.1021/bi981429u. [DOI] [PubMed] [Google Scholar]
- Baker PF, Macnaughton PA. Selective inhibition of the Ca-dependent Na efflux from intact squid axons by a fall in intracellular pH. The Journal of Physiology. 1977;269:78–79P. [PubMed] [Google Scholar]
- Barry WH, Bridge JH. Intracellular calcium homeostasis in cardiac myocytes. Circulation. 1993;87:1806–1815. doi: 10.1161/01.cir.87.6.1806. [DOI] [PubMed] [Google Scholar]
- Bassani RA, Bassani JWM, Bers DM. Relaxation in ferret ventricular myocytes: unusual interplay among calcium transport systems. The Journal of Physiology. 1994;476:295–308. doi: 10.1113/jphysiol.1994.sp020131. [DOI] [PMC free article] [PubMed] [Google Scholar]
- Bassani RA, Bassani JWM, Bers DM. Relaxation in ferret ventricular myocytes: role of the sarcolemmal Ca-ATPase. Pflügers Archiv. 1995;430:573–578. doi: 10.1007/BF00373894. [DOI] [PubMed] [Google Scholar]
- Bers DM, Lederer WJ, Berlin JR. Intracellular Ca transients in rat cardiac myocytes: role of Na-Ca exchange in excitation-contraction coupling. American Journal of Physiology. 1990;258:C944–954. doi: 10.1152/ajpcell.1990.258.5.C944. [DOI] [PubMed] [Google Scholar]
- Beuckelmann DJ, Wier WG. Sodium-calcium exchange in guinea-pig cardiac cells: exchange current and changes in intracellular Ca2+ The Journal of Physiology. 1989;414:499–520. doi: 10.1113/jphysiol.1989.sp017700. [DOI] [PMC free article] [PubMed] [Google Scholar]
- Bishop JE, Al-Shawi MK. Inhibition of sarcoplasmic reticulum Ca2+-ATPase by Mg2+ at high pH. Journal of Biological Chemistry. 1988;268:1886–1892. [PubMed] [Google Scholar]
- Blaustein MP, Lederer WJ. Sodium/calcium exchange: Its physiological implications. Physiological Reviews. 1999;79:763–854. doi: 10.1152/physrev.1999.79.3.763. [DOI] [PubMed] [Google Scholar]
- Buckler KJ, Vaughan-Jones RD. Application of a new pH-sensitive fluoprobe (carboxy-SNARF-1) for intracellular pH measurement in small, isolated cells. Pflügers Archiv. 1990;417:234–239. doi: 10.1007/BF00370705. [DOI] [PubMed] [Google Scholar]
- Carafoli E. The homeostasis of calcium in heart cells. Journal of Molecular and Cellular Cardiology. 1985;17:203–212. doi: 10.1016/s0022-2828(85)80003-1. [DOI] [PubMed] [Google Scholar]
- Cervetto L, Lagnado L, Perry RJ, Robinson DW, Mcnaughton PA. Extrusion of calcium from rod outer segments is driven by both sodium and potassium gradients. Nature. 1989;337:740–743. doi: 10.1038/337740a0. [DOI] [PubMed] [Google Scholar]
- Cheng H, Lederer WJ, Cannell MB. Calcium sparks: Elementary events underlying excitation-contraction coupling in heart muscle. Science. 1993;262:740–744. doi: 10.1126/science.8235594. [DOI] [PubMed] [Google Scholar]
- Choi HS, Eisner DA. The role of sarcolemmal Ca2+-ATPase in the regulation of resting calcium concentration in rat ventricular myocytes. The Journal of Physiology. 1999;515:109–118. doi: 10.1111/j.1469-7793.1999.109ad.x. [DOI] [PMC free article] [PubMed] [Google Scholar]
- Crespo LM, Grantham CJ, Cannell MB. Kinetics, stoichiometry and role of the Na-Ca exchange mechanism in isolated cardiac myocytes. Nature. 1990;345:618–621. doi: 10.1038/345618a0. [DOI] [PubMed] [Google Scholar]
- Delprincipe F, Egger M, Niggli E. Ca2+-induced Ca2+ release: Refractoriness revealed by coherent activation. Nature Cell Biology. 1999;1:323–329. doi: 10.1038/14013. [DOI] [PubMed] [Google Scholar]
- Di Francesco D, Noble D. A model of cardiac electrical activity incorporating ionic pumps and concentration changes. Philosophical Transactions of the Royal Society. 1985;B 307:353–398. doi: 10.1098/rstb.1985.0001. [DOI] [PubMed] [Google Scholar]
- Dixon DA, Haynes DH. The pH dependence of the cardiac sarcolemmal Ca2+-transporting ATPase: evidence that the Ca2+ translocator bears a doubly negative charge. Biochimica et Biophysica Acta. 1990;1029:274–284. doi: 10.1016/0005-2736(90)90164-j. [DOI] [PubMed] [Google Scholar]
- Doering AE, Eisner DA, Lederer WJ. Cardiac Na-Ca exchange and pH. Annals of the New York Academy of Sciences. 1996;779:182–198. doi: 10.1111/j.1749-6632.1996.tb44786.x. [DOI] [PubMed] [Google Scholar]
- Doering AE, Lederer WJ. The mechanism by which cytoplasmic protons inhibit the sodium-calcium exchanger in guinea-pig heart cells. The Journal of Physiology. 1993;466:481–499. [PMC free article] [PubMed] [Google Scholar]
- Doering AE, Lederer WJ. The action of Na+ as a cofactor in the inhibition by cytoplasmic protons of the cardiac Na+-Ca2+ exchanger in the guinea-pig. The Journal of Physiology. 1994;480:9–20. doi: 10.1113/jphysiol.1994.sp020336. [DOI] [PMC free article] [PubMed] [Google Scholar]
- Egger M, Niggli E. Extracelllular protons modulate Na-Ca exchange current and Ca2+ transport. Biophysical Journal. 1998;74:A268. [Google Scholar]
- Egger M, Niggli E. Regulatory function of Na-Ca exchange in the heart: Milestones and outlook. Journal of Membrane Biology. 1999;168:107–130. doi: 10.1007/s002329900502. [DOI] [PubMed] [Google Scholar]
- Eisner DA, Lederer WJ. Na-Ca exchange: stoichiometry and electrogenicity. American Journal of Physiology. 1985;248:C189–202. doi: 10.1152/ajpcell.1985.248.3.C189. [DOI] [PubMed] [Google Scholar]
- He ZP, Tong QS, Quednau BD, Philipson KD, Hilgemann DW. Cloning, expression, and characterization of the squid Na+-Ca2+ exchanger (NCX-SQ1) Journal of General Physiology. 1998;111:857–873. doi: 10.1085/jgp.111.6.857. [DOI] [PMC free article] [PubMed] [Google Scholar]
- Hilgemann DW. Giant excised cardiac sarcolemmal membrane patches: sodium and sodium-calcium exchange currents. Pflügers Archiv. 1989;415:247–249. doi: 10.1007/BF00370601. [DOI] [PubMed] [Google Scholar]
- Hilgemann DW. Regulation and deregulation of cardiac Na+-Ca2+ exchange in giant excised sarcolemmal membrane patches. Nature. 1990;344:242–245. doi: 10.1038/344242a0. [DOI] [PubMed] [Google Scholar]
- Hilgemann DW, Ball R. Regulation of cardiac Na+, Ca2+ exchange and K-ATP potassium channels by PIP2. Science. 1996;273:956–959. doi: 10.1126/science.273.5277.956. [DOI] [PubMed] [Google Scholar]
- Hilgemann DW, Collins A. Mechanism of cardiac Na+-Ca2+ exchange current stimulation by MgATP: possible involvement of aminophospholipid translocase. The Journal of Physiology. 1992;454:59–82. doi: 10.1113/jphysiol.1992.sp019254. [DOI] [PMC free article] [PubMed] [Google Scholar]
- Hilgemann DW, Nicoll DA, Philipson KD. Charge movement during Na+ translocation by native and cloned cardiac Na+/Ca2+ exchanger. Nature. 1991;352:715–718. doi: 10.1038/352715a0. [DOI] [PubMed] [Google Scholar]
- Hilgemann DW, Philipson KD, Vassort G. Sodium-Calcium Exchange. Proceedings of the Third International Conference. Annals of the New York Academy of Sciences. Vol. 77. NY, USA: The New York Academy of Sciences; 1996. [Google Scholar]
- Janvier NC, Boyett MR. The role of Na-Ca exchange current in the cardiac action potential. Cardiovascular Research. 1996;32:69–84. [PubMed] [Google Scholar]
- Kappl M, Hartung K. Rapid charge translocation by the cardiac Na+-Ca2+ exchanger after a Ca2+ concentration jump. Biophysical Journal. 1996;71:2473–2485. doi: 10.1016/S0006-3495(96)79441-9. [DOI] [PMC free article] [PubMed] [Google Scholar]
- Khananshvili D. Distinction between the two basic mechanisms of cation transport in the cardiac Na+-Ca2+ exchange system. Biochemistry. 1990;29:2437–2442. doi: 10.1021/bi00462a001. [DOI] [PubMed] [Google Scholar]
- Khananshvili D. Structure, mechanism, and regulation of the cardiac sarcolemma Na+-Ca2+ exchanger. Advances in Molecular and Cell Biology. 1998;23B:311–358. [Google Scholar]
- Khananshvili D, Shaulov G, Weil-Maslansky E. Rate-limiting mechanisms of exchange reactions in the cardiac sarcolemma Na+-Ca2+ exchanger. Biochemistry. 1995;34:10290–10297. doi: 10.1021/bi00032a024. [DOI] [PubMed] [Google Scholar]
- Khananshvili D, Weil-Maslansky E. The cardiac Na+-Ca2+ exchanger: Relative rates of calcium and sodium movements and their modulation by protonation-deprotonation of the carrier. Biochemistry. 1994;33:312–319. doi: 10.1021/bi00167a041. [DOI] [PubMed] [Google Scholar]
- Läuger P. Electrogenic Ion Pumps. Sunderland, MA, USA: Associates Inc.; 1991. p. 313. [Google Scholar]
- Lipp P, Pott L, Callewaert G, Carmeliet E. Simultaneous recording of indo-1 fluorescence and Na+/Ca2+ exchange current reveals two components of Ca2+-release from sarcoplasmic reticulum of cardiac atrial myocytes. FEBS Letters. 1990;257:181–184. doi: 10.1016/0014-5793(90)81467-3. [DOI] [PubMed] [Google Scholar]
- Matsuoka S, Hilgemann DW. Steady-state and dynamic properties of cardiac sodium-calcium exchange. Ion and voltage dependencies of the transport cycle. Journal of General Physiology. 1992;100:963–1001. doi: 10.1085/jgp.100.6.963. [DOI] [PMC free article] [PubMed] [Google Scholar]
- Matsuoka S, Nicoll DA, Reilly RF, Hilgemann DW, Philipson KD. Initial localization of regulatory regions of the cardiac sarcolemmal Na+-Ca2+ exchanger. Proceedings of the National Academy of Sciences of the USA. 1993;90:3870–3874. doi: 10.1073/pnas.90.9.3870. [DOI] [PMC free article] [PubMed] [Google Scholar]
- Meno H, Jarmakani JM, Philipson KD. Effect of ischemia on sarcolemmal Na+-Ca2+ exchange in neonatal hearts. American Journal of Physiology. 1989;256:H1615–1620. doi: 10.1152/ajpheart.1989.256.6.H1615. [DOI] [PubMed] [Google Scholar]
- Mitra R, Morad M. A uniform enzymatic method for dissociation of myocytes from hearts and stomachs of vertebrates. American Journal of Physiology. 1985;249:H1056–1060. doi: 10.1152/ajpheart.1985.249.5.H1056. [DOI] [PubMed] [Google Scholar]
- Naderali EK, Buttell N, Taggart MJ, Bullock AJ, Eisner DA, Wray S. The role of the sarcolemmal Ca2+-ATPase in the pH transients associated with contraction in rat smooth muscle. The Journal of Physiology. 1997;505:329–336. doi: 10.1111/j.1469-7793.1997.329bb.x. [DOI] [PMC free article] [PubMed] [Google Scholar]
- Negretti N, O'neill SC, Eisner DA. The relative contributions of different intracellular and sarcolemmal systems to relaxation in rat ventricular myocytes. Cardiovascular Research. 1993;27:1826–1830. doi: 10.1093/cvr/27.10.1826. [DOI] [PubMed] [Google Scholar]
- Niggli E, Lederer WJ. Molecular operations of the sodium-calcium exchanger revealed by conformation currents. Nature. 1991;349:621–624. doi: 10.1038/349621a0. [DOI] [PubMed] [Google Scholar]
- Niggli E, Lederer WJ. Activation of Na-Ca exchange current by photolysis of ‘caged calcium’. Biophysical Journal. 1993;65:882–891. doi: 10.1016/S0006-3495(93)81105-6. [DOI] [PMC free article] [PubMed] [Google Scholar]
- Philipson KD, Bersohn MM, Nishimoto AY. Effects of pH on Na+-Ca2+ exchange in canine cardiac sarcolemmal vesicles. Circulation Reseach. 1992;50:287–293. doi: 10.1161/01.res.50.2.287. [DOI] [PubMed] [Google Scholar]
- Reeves JP, Hale CC. The stoichiometry of the cardiac sodium-calcium exchange system. Journal of Biological Chemistry. 1984;259:7733–7739. [PubMed] [Google Scholar]
- Reeves JP, Philipson KD. Sodium-calcium exchange activity in plasma membrane vesicles. In: Allen TJA, Noble D, Reuter H, editors. Sodium-Calcium Exchange. Oxford, UK: Oxford University Press; 1989. pp. 27–53. [Google Scholar]
- Schnetkamp PP, Szerencsei RT, Basu DK. Unidirectional Na+, Ca2+, and K+ fluxes through the bovine rod outer segment Na-Ca-K exchanger. Journal of Biological Chemistry. 1991;266:198–206. [PubMed] [Google Scholar]
- Sham JS, Hatem SN, Morad M. Species differences in the activity of the Na+-Ca2+ exchanger in mammalian cardiac myocytes. The Journal of Physiology. 1995;488:623–631. doi: 10.1113/jphysiol.1995.sp020995. [DOI] [PMC free article] [PubMed] [Google Scholar]
- Tani M. Mechanisms of Ca2+ overload in reperfused ischemic myocardium. Annual Review of Physiology. 1990;52:543–559. doi: 10.1146/annurev.ph.52.030190.002551. [DOI] [PubMed] [Google Scholar]
- Yan GX, Kleber AG. Changes in extracellular and intracellular pH in ischemic rabbit papillary muscle. Circulation Research. 1992;71:460–470. doi: 10.1161/01.res.71.2.460. [DOI] [PubMed] [Google Scholar]