Quantal components of the excitatory postsynaptic currents at a rat central auditory synapse (original) (raw)
Abstract
- Paired whole-cell recordings were made from a glutamatergic giant nerve terminal, the calyx of Held, and its postsynaptic target cell in the medial nucleus of the trapezoid body (MNTB) in the brainstem slice of juvenile rat. Excitatory postsynaptic currents (EPSCs) were evoked by presynaptic action potentials triggered by brief (1 ms) depolarizing pulses.
- In normal artificial cerebrospinal fluid (ACSF), EPSCs of several nanoamperes in amplitude were evoked at a relatively constant latency with no failure, whereas in low [Ca2+]o-high [Mg2+]o solutions, EPSCs fluctuated both in amplitude and latency, and stochastic failures of transmitter release were observed in response to presynaptic action potentials.
- After blocking action potentials with tetrodotoxin (TTX), direct depolarization of the calyceal preterminal elicited asynchronous release of miniature EPSCs (mEPSCs). When the magnitude of depolarization was increased, mEPSCs increased in frequency. Being consistent with their quantal nature, their mean amplitude remained constant over a wide range of frequencies. The amplitude distribution of mEPSCs was slightly skewed (skewness = 1.06), with a mean conductance of 0.45 nS and a coefficient of variation (c.v.) of 0.43.
- Single-channel conductance underlying mEPSCs was estimated using non-stationary fluctuation analysis. The weighted mean single channel conductance was 20.4 pS, suggesting that a single quantum opens 22 postsynaptic glutamate receptor channels on average.
- After washing out TTX, EPSCs evoked by presynaptic action potentials were tested for quantal analysis based upon the mean amplitude of mEPSCs and their variance. In low [Ca2+]o-high [Mg2+]o solutions, quantal contents estimated from the EPSC/mEPSC ratio, rate of failures or c.v. assuming Poisson's statistics, coincided with each other. Evoked EPSCs could be fitted by integer multiples of mEPSCs with an assumption of incremental variance more adequately than the constant variance assumption.
- It is concluded that the rat central auditory synaptic transmission is made in a quantal manner as at the frog neuromuscular junction.
The quantal nature of synaptic transmission was first demonstrated by del Castillo & Katz (1954_a_) at the frog neuromuscular junction (NMJ), where the nerve-evoked synaptic response was described as integer multiples of spontaneous miniature synaptic responses, or quanta. Since then, attempts have been made to test the quantum hypothesis at the central synapse, which have raised many arguments and controversies (for reviews, see Stevens, 1993; Walmsley, 1995; Auger & Marty, 2000). One of the critical differences in quantal analysis between the NMJ and central synapses is that the quantal size of a given synaptic input has not been directly measured in most cases at central synapses. Spontaneous miniature synaptic responses similar in nature to miniature endplate potentials have been observed at central synapses (Katz & Miledi, 1963; Blankenship & Kuno, 1968; Takahashi, 1984). However, they cannot be simply regarded as quantal components of evoked synaptic responses because they arise from diverse origins. Therefore, the quantal amplitude has been inferred from the best fit on assuming the binomial model (Kuno, 1964; Kullmann & Nicoll, 1992), or from the peaks of amplitude distribution of evoked responses (Jack et al. 1981; Edwards et al. 1990; Paulsen & Heggelund, 1994). Attempts have been made to reveal quantal components of evoked synaptic responses by (1) activating a single presynaptic bouton with one or few release sites (Bekkers et al. 1990; Gulyas et al. 1993; Silver et al. 1996), (2) reducing release probability (Takahashi, 1992; Issacson & Walmsley, 1995), or (3) desynchronizing transmitter release using strontium (Abdul-Ghani et al. 1996; Silver et al. 1998; Bekkers & Clements, 1999) or α-latrotoxin (Auger & Marty, 1997). In the mammalian central nervous system, most presynaptic terminals are too small to be visually identified in slices. However, at the calyx of Held, a giant presynaptic terminal making an axo-somatic contact on a principal neuron in the medial nucleus of the trapezoid body (MNTB) in rat brainstem, it is possible to make paired pre- and postsynaptic whole-cell recordings under visual control in thin-slice preparation (Forsythe, 1994; Borst et al. 1995; Takahashi et al. 1996). Taking advantage of this preparation, in the present study, we produced asynchronous quantal release via direct patch clamping of the presynaptic terminal and examined whether excitatory postsynaptic currents (EPSCs) evoked by presynaptic action potentials can be fitted by integer multiples of evoked miniature ESPCs (mEPSCs). Our data indicate that the quantum hypothesis established at the NMJ similarly applies at this mammalian central synapse. A preliminary report of this work has appeared in an abstract form (Sahara & Takahashi, 1999).
METHODS
Electrophysiological recording
Experiments were performed in accordance with the guideline of the Physiological Society of Japan. Transverse slices (150 μm) of superior olivary complex were prepared from 14- to 15-day-old Wistar rats (Forsythe & Barnes-Davies, 1993) after decapitation under halothane anaesthesia and superfused with artificial cerebrospinal fluid (ACSF) composed of 125 mm NaCl, 2.5 mm KCl, 1 mm MgCl2, 2 mm CaCl2, 10 mm glucose, 25 mm NaHCO3, 1.25 mm NaH2PO4, 0.4 mm ascorbic acid, 3 mm_myo-_inositol and 2 mm sodium pyruvate (pH 7.3 with 95 % O2-5 % CO2, 310 mosmol kg−1). The ACSF routinely contained bicuculline methiodide (10 μm) and strychnine hydrochloride (0.5 μm) to block GABAergic and glycinergic synaptic currents, respectively, and also 25 μmd(-)-2-amino-5-phosphonopentanoic acid (D-AP5) to block _N_-methyl-d-aspartate receptors. Recordings were made at room temperature (22-26 °C). Principal neurons in the MNTB and the presynaptic terminal, the calyx of Held, were visualized under an upright microscope (Axioskop, Zeiss, Germany) using a × 60 water immersion objective (Olympus, Tokyo, Japan). Whole-cell current-clamp recordings were made from a presynaptic terminal simultaneously with voltage-clamp recordings from a postsynaptic target neuron using Axopatch 200B amplifiers (Takahashi et al. 1996). Patch pipettes for postsynaptic recordings were filled with 110 mm CsF, 35 mm CsCl, 10 mm Hepes, 5 mm EGTA and 1 mm MgCl2 (pH 7.3 with CsOH, 300 mosmol kg−1). Presynaptic patch pipettes were filled with 95 mm potassium gluconate, 35 mm KCl, 10 mml-glutamic acid, 10 mm Hepes, 0.5 mm EGTA, 1 mm MgCl2, 12 mm phosphocreatinine, 3 mm ATP (Mg salt) and 0.5 mm GTP (Na salt) (pH adjusted to 7.3 with KOH, 305 mosmol kg−1). The postsynaptic and presynaptic pipettes had resistances of 2–4 MΩ and 6-10 MΩ, respectively. The series resistance of the postsynaptic recordings was typically 8-15 MΩ and its stability was monitored throughout the experiments. The series resistance was occasionally compensated (by up to 80 %) except for the experiments for kinetic analyses. The postsynaptic holding potential was −70 mV all through. The liquid junction potential between pipette and external solution was not corrected for. The EPSCs were evoked at 1 Hz by presynaptic action potentials elicited by a depolarizing pulse (1 ms). For drug applications and changing solutions, perfusion lines were switched using solenoid valves.
Data acquisition and analysis
Synaptic currents were low-pass filtered at 5 kHz and stored on a DAT tape (sampling rate 48 kHz). Data were digitized at 40 kHz by using a CED1401 interface (Cambridge Electronic Design, Cambridge, UK) and analysed off-line using Axograph (Axon Instruments, Foster City, CA, USA). The mEPSCs were detected automatically using a sliding template method implemented in Axograph, where the template was generated by averaging 30-40 mEPSCs selected by eye. Overlapped mEPSCs were excluded from analyses by visual inspection. For non-stationary noise analysis, the difference between individual mEPSCs and the peak-scaled averaged mEPSC at their decay phases was calculated and the ensemble variance was plotted against the current amplitude (Traynelis et al. 1993). Background current noise was estimated from the baseline with no clear event, and was subtracted from signals for analyses. The σ2_-I_ plot was fitted with the equation σ2_=iI – (I_2_/N_), where I represents the mean current, σ2 peak-scaled variance, N the average number of channels open at the peak and i single-channel current amplitude. The amplitude of evoked EPSCs (including failures) was measured from the current peak no longer than 2 ms after the peak of presynaptic action potentials. Curve fittings for the amplitude histograms of mEPSCs and evoked EPSCs were made using KyPlot (http://www.qualest.co.jp). The noise amplitude histogram was approximated by a single Gaussian function, from which the standard deviation of noise amplitude (σ_n_) was estimated. Then the maximum likelihood procedures (the quasi-Newton algorithm) were used to obtain estimates for the amplitude distribution parameters of mEPSC, the mean amplitude (μ) and the standard deviation (σ), and parameters of evoked EPSCs, the mean quantal size (q), the mean quantal content (m) and the quantal size variance (σ_2q_). The parameters σ, m, σ_q_, and σ_n_ were constrained to be > 0. Coefficient of variation (c.v.) is defined as σ_/μ_. Skewness is defined as:
All values are given as the mean ±s.e.m.
RESULTS
EPSCs evoked by presynaptic action potentials
After simultaneous whole-cell recordings were established from a calyx and its postsynaptic target cell, presynaptic action potentials were elicited by depolarizing the calyx for 1 ms. Following presynaptic action potentials, glutamatergic non-NMDA EPSCs (Forsythe & Barnes-Davies, 1993) were recorded from the postsynaptic MNTB cell (Fig. 1_A_). In the standard solution containing 2 mm[Ca2+]o and 1 mm[Mg2+]o, presynaptic action potentials evoked EPSCs of several nanoamperes in amplitude (at −70 mV) without failures at 1 Hz stimulation (Fig. 1_A_ and C). The synaptic latency was relatively constant (Fig. 1_A_ and E) with a mean of 0.51 ± 0.01 ms (n = 4 cells). This latency in P14-15 rats is similar to that in P12-14 rats (Taschenberger & von Gersdorff, 2000), but nearly twice as short as that reported at this synapse in P8-10 rats (0.94 ms; Borst et al. 1995), indicating the rapid developmental change during this period. When the release probability was decreased by partial replacement of [Ca2+]o by [Mg2+]o, EPSCs became smaller and more variable in amplitude (Fig. 1_B_ and D). In 0.5 mm[Ca2+]o-5 mm[Mg2+]o solutions, EPSCs showed a marked fluctuation of synaptic latency (Fig. 1_B_ and F) and occasional failures in response to presynaptic action potentials (Fig. 1_B_). Because EPSCs are evoked by presynaptic action potentials in these experiments, these phenomena represent pure stochastic nature of transmitter release rather than jitters or conduction failures of presynaptic action potentials.
Figure 1. EPSCs evoked by presynaptic action potentials in an MNTB principal neuron in simultaneous pre- and postsynaptic recording in normal ACSF (A,C and E) and 0.5 mm[Ca2+]o-5 mm[Mg2+]o solution (B,D and F).
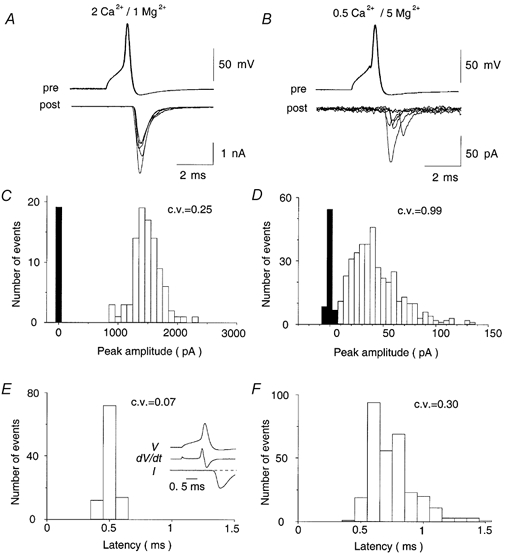
A and B, EPSCs (lower traces) are evoked by presynaptic action potentials (upper traces) at 1 Hz (five consecutive records superimposed for each trace). C and D, amplitude histograms for EPSCs. Background noise histograms (filled bars) are obtained from records 10-20 ms before stimulation. There were no failures (out of 100 trials) in normal ACSF and 215 failures out of 599 trials in 0.5 mm[Ca2+]o-5 mm[Mg2+]o solution. E and F, synaptic latency histograms. Synaptic latency was measured from the peak of the first derivative (d_V/d_t) of action potential (V) to the onset of EPSCs (I, inset in E; baseline indicated by broken line). The frequency of spontaneous mEPSCs was 2.5 Hz in 0.5 mm[Ca2+]o-5 mm[Mg2+]o solution, indicating that the probability of miscounting mEPSCs falling into the 2 ms window as evoked EPSCs is between two and three events for 599 trials. All data shown in this figure derived from the same cell.
Miniature EPSCs evoked by presynaptic depolarization
Spontaneous miniature EPSCs (mEPSCs) were recorded after blocking action potentials with tetrodotoxin (TTX; 0.5 μm; Fig. 2_Aa_). Their basal frequency was 5.6 ± 1.7 Hz (n = 10) on average. When the calyx was depolarized by passing steady currents through the presynaptic pipette, mEPSCs became more frequent (Fig. 2_Ab_, 35 Hz at −40 mV; Fig. 2_Ac_, 166 Hz at −30 mV) and eventually fused with each other on further depolarization (data not shown). When the calyx was repolarized, mEPSC frequency returned to the basal level. This phenomenon has been described at the NMJ by del Castillo & Katz (1954_b_) as an increase in release probability caused by the sustained Ca2+ influx through presynaptic Ca2+ channels. Whilst the frequency of mEPSCs increased with presynaptic depolarization (Fig. 2_A_ and C), the mean amplitude of mEPSCs remained the same (Fig. 2_A_ and B). Also, the kinetics of mEPSCs did not change appreciably (Fig. 2_B_, superimposed sample traces). The mean amplitude of evoked mEPSCs was 33.3 ± 0.8 pA at the postsynaptic holding potential of −70 mV (0.45 ± 0.01 nS) with a mean c.v. of 0.43 ± 0.01 (n = 10). These values are similar to those of spontaneous mEPSCs at this synapse in paired pre- and postsynaptic recordings (Fig. 2_Aa_), as well as those in single postsynaptic recordings (Chuma & Ohmori, 1998; Ishikawa & Takahashi, 2001). The amplitude distribution of mEPSCs was close to single Gaussian (Fig. 5_A_) with a slight skewness (1.06 ± 0.14, n = 10). The mean amplitude of mEPSCs was stable over a wide range of mEPSC frequency as shown for four examples in Fig. 2_D_, suggesting a stable quantal size for a wide range of release probability.
Figure 2. Spontaneous and evoked mEPSCs recorded from an MNTB principal neuron in the presence of TTX.
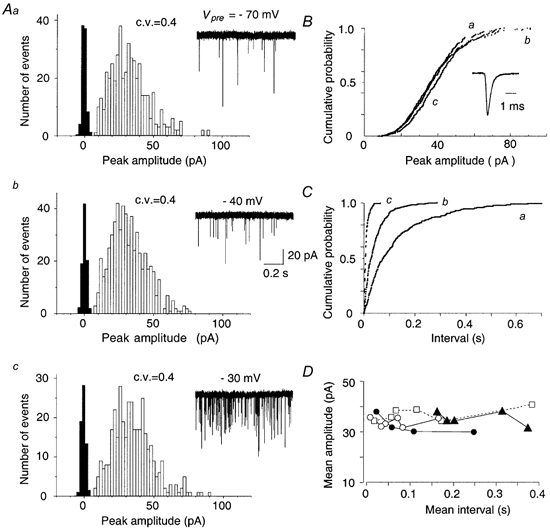
A, amplitude histogram of spontaneous mEPSCs recorded at the presynaptic membrane potential of −70 mV (a), and mEPSCs evoked by presynaptic depolarization to −40 mV (b) and −30 mV (c) in TTX (0.5 μm). Postsynaptic holding potential was −70 mV throughout the experiment. Sample traces of mEPSCs are shown on the right. The mean frequencies of mEPSCs were 8.5 (a), 34.5 (b) and 166 Hz (c), respectively. The cumulative amplitude histogram (B) and the interval histogram (C) show mEPSCs obtained from the neuron at three different presynaptic membrane potentials (Aa-c). Despite a clear difference in frequency (C), the amplitude of the mEPSCs was not significantly different from each other (B, P < 0.01 by Kolmogorov-Smirnov test). mEPSCs recorded at three different presynaptic membrane potentials (a–c) were normalized in amplitude and superimposed (inset in B). D, mean amplitudes of mEPSCs recorded at four calyx synapses at different magnitudes of presynaptic depolarization are plotted against mean intervals (different symbols).
Figure 5. Quantal analysis of EPSCs based upon Poisson's law.

Probability density function superimposed on an amplitude histogram (bin size = 5 pA) of mEPSCs (A), and EPSCs (B) obtained using paired pre- and postsynaptic recording at a calyx-MNTB synapse. A, mEPSCs were elicited by presynaptic depolarization (to −40 mV) in TTX (0.5 μm) and had a mean amplitude of 30.9 pA, with a coefficient of variation of 0.39 (n = 332). The background noise variance for mEPSCs was 12.7 pA2. B, EPSCs were evoked by presynaptic action potentials in 0.65 mm[Ca2+]o-4.5 mm[Mg2+]o ACSF and recorded from a postsynaptic cell at the holding potential of −70 mV. The maximum-likelihood estimate with the compound Poisson model (eqn (2)) was searched using a quasi-Newton algorithm. The values given by the fitting curve are m = 0.82, q = 29.8 pA, σ_q_2= 90.6 pA2, and σ_n_2= 16.1 pA2 (for 655 events, including failures). The _m_-value directly calculated from the ratio of mean EPSC/mEPSC was 0.84.
Single-channel conductance of postsynaptic receptor channels underlying mEPSCs
Because of the somatic location of the calyceal presynaptic terminal, spontaneous and evoked mEPSCs had a relatively uniform shape and rapid kinetics (10-90 % rise time < 150 μs, e-fold decay time 0.31 ± 0.01 ms, n = 5) comparable to those recorded from electrotonically compact cells such as cerebellar granule cells (Silver et al. 1996). Thus, modified non-stationary fluctuation analysis (Robinson et al. 1991; Traynelis et al. 1993) can be applied reasonably to deduce mean single channel conductance underlying quanta. The variance during the decay phase of individual evoked mEPSCs was plotted against their mean amplitude (Fig. 3) and the weighted-mean single-channel current was estimated from the initial slope of the peak-scaled mean-variance relationship. The average single channel current amplitude was 1.51 ± 0.23 pA (at −70 mV, n = 5 cells). The reversal potential of EPSCs was 3.9 ± 0.2 mV (n = 7), and thus, the weighted mean single-channel conductance was 20.4 pS, giving an estimate of 22 channels opened by a single quantum. This conductance is larger than that reported for synaptic AMPA receptors in cerebellar granule cells (12 pS; Silver et al. 1996), but similar to that reported for hippocampal AMPA receptors (22.6 pS; Koh et al. 1995), which have relatively high Ca2+ permeability (P_Ca/P_K= 1.79). The AMPA receptors expressed in MNTB cells are known to possess high Ca2+ permeability (P_Ca/P_Na= 1.12; Geiger et al. 1995) with relative scarcity of GluRB subunit expression (Caicedo & Eybalin, 1999). Thus, the Ca2+-permeable large conductance AMPA receptor-channels may underlie EPSCs at the calyx-MNTB synapse.
Figure 3. Estimation of single-channel conductance underlying mEPSCs.
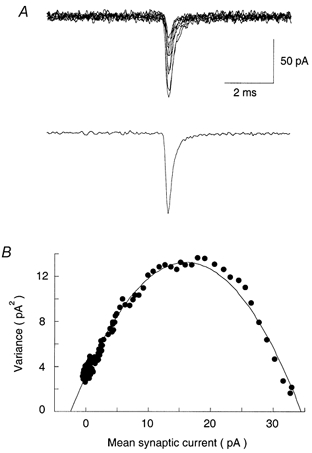
A, individual mEPSCs (top, superimposed) and averaged mEPSCs (bottom). B, peak-scaled variance-mean current plot from non-stationary fluctuation analysis of 366 mEPSC events. Fluctuations in the decay of mEPSCs were analysed by subtracting the mean waveform from individual mEPSCs. The σ_2_-I plot was fitted with the equation σ_2_= iI_– (I_2/N), where I is the mean current, _σ_2 is the peak-scaled variance, N is the number of channels open at the peak, and i is the single-channel current amplitude. This gave estimates of i = 1.43 pA and N = 22.8 in this cell.
Quantal analysis of EPSCs based upon Poisson's law
At the calyx-MNTB synapse, mEPSCs evoked by a sustained presynaptic depolarization had constant mean amplitude for a wide range of release probability. Also in low [Ca2+]o-high [Mg2+]o solutions, ‘true’ stochastic failures of synaptic transmission distinct from conduction failures were observed. Thus, we tested whether quantal analysis established at the NMJ (del Castillo & Katz, 1954_a_) could be applied to this central synapse. According to the quantum hypothesis, the mean quantal content is defined as m =Np, where N is the total number of readily releasable quanta and p is the mean release probability. If the mean quantal size is constant (Fig. 2) and action potential evoked EPSCs are integer multiples of mEPSCs, m is given by (mean amplitude of evoked EPSCs)/(mean amplitude of mEPSCs). Taking the stochastic fluctuation in the latency of evoked EPSCs (Fig. 1) into account, m value estimated from the ratio of synaptic charges may be more accurate (Van der Kloot, 1997). At the calyx-MNTB synapse in normal solution, the amplitude of evoked EPSCs is more than two orders of magnitude larger than that of mEPSCs and the size of the readily releasable pool of synaptic vesicles has been estimated to be more than 800 (Schneggenburger & Neher, 2000). Thus, presumably, by reducing release probability, EPSCs can be described by Poisson's law. If transmitter release follows Poisson's law, the probability, P(r), for a presynaptic impulse to release r quanta is given as:
 |
(1) |
|---|
Therefore, the mean quantal content can be estimated as ln (number of trials)/(number of failures) and also from the c.v. of evoked EPSCs as 1/(c.v.)2. The first test for this assumption is shown in Fig. 4. The mean quantal content estimated from three different methods agreed well with each other. Using synaptic charges instead of currents for the estimation of m showed slightly better fits for larger m values (Fig. 4, filled circles). Similar results have been reported at the endbulb of the Held synapse, where the mean quantal size was deduced from reducing release probability by cadmium (Issacson & Walmsley, 1995).
Figure 4. Comparison between the mean quantal content (m) values determined by three independent methods on an assumption of Poisson's law.
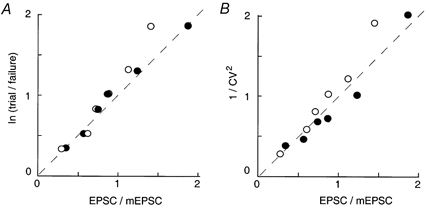
The m values in abscissa were estimated from the EPSC/mEPSC ratio of amplitude (○) or charge (•). These agreed well with those estimated from the number of failures (ordinate in A) or the coefficient of variation (B). The dashed lines correspond to equality of estimates. The data derive from six experiments in low [Ca2+]o-high [Mg2+]o ACSFs.
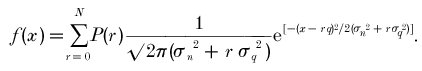
For the quantal assumption, we next tested whether the amplitude distribution of evoked EPSCs is as expected from the Poisson's law. Taking the quantal variance (σ_q_2) and recording noise variance (σ_n_2) into account, the probability density function (f) was estimated as:
 |
(2) |
|---|
We measured mEPSCs evoked by presynaptic depolarization in the presence of TTX in seven cells to obtain the quantal size distribution (Fig. 5_A_). The best-fit Gaussian curve gave values of q = 30.9 pA, σ_q_2= 147 pA2 (background noise corrected). We then washed out TTX and measured evoked EPSCs in the low [Ca2+]o (0.65 mm)-high [Mg2+]o (4.5 mm) ACSF and fitted their amplitude distribution with the Poisson model, with no assumption of the mean quantal size or the quantal variance (Fig. 5_B_). The maximum-likelihood estimation for the evoked EPSCs gave values of q = 29.8 pA, σ_q_2= 90.6 pA2 and m = 0.82. In seven such experiments under reduced quantal contents (m = 0.28–1.29), the mean quantal size estimated from the fitting curve of evoked EPSCs (range = 26.0-29.8 pA) was 92 ± 3.1 % of those directly measured (27.4-31.9 pA). Similarly, the c.v. of quantal size estimated from evoked EPSCs (0.32-0.71) was 92 ± 4.8 % of those directly measured (0.39-0.69). These results indicate that EPSCs are composed of integer multiples of mEPSCs. For these fits, we assumed the variance to increase linearly as a function of the number of quanta (r) as at the NMJ (del Castillo & Katz, 1954_a_). When a uniform variance was assumed instead, both the log likelihood function and the Kolmogorov-Smirnov test (P < 0.01) indicated worse results compared with the case of incremental variance. Thus, at the reduced release probability, transmitter release at the calyx-MNTB synapse can be adequately described by the Poisson's law as at the NMJ (del Castillo & Katz, 1954_a_).
DISCUSSION
Quantal analysis at the calyx of Held synapse
In the present study, we examined whether the quantal hypothesis proposed at the NMJ is applicable to a rat auditory brainstem synapse formed by the calyx of Held. This synapse has many advantages over other central synapses for quantal analysis. First, because of the axosomatic location of synaptic contact, the electrotonic distortion of synaptic currents is minimal, allowing direct measurements of quantal size and its variance. Secondly, because of the large presynaptic structure, it is possible to directly evoke quantal synaptic responses in paired pre- and postsynaptic whole-cell recordings. Thirdly, because the number of readily releasable quanta is large, the application of Poisson's law can be justified after reducing release probability. Our results clearly indicate that the neurotransmitter release at this mammalian central synapse is made in a quantal manner.
Quantal size and its variation at the calyx synapse
Among mammalian central synapses, the calyx of Held is one of the largest presynaptic terminals with its readily releasable quanta estimated to be more than 800 in number (Schneggenburger & Neher, 2000). This figure is comparable to that at the frog NMJ, where 35 000 synaptic vesicles are assembled along 700 active zones (Katz & Miledi, 1979). At the calyx-MNTB synapse, the mean quantal size was 0.45 nS and the underlying single channel mean conductance was 20.4 pS, suggesting that a single packet of transmitter opens on average 22 AMPA receptor channels. These figures are comparable to those at other central excitatory synapses (Issacson & Walmsley, 1995; Abdul-Ghani et al. 1996; Silver et al. 1996, 1998). Assuming 100 mm for the vesicular glutamate concentration (Burger et al. 1989), the number of glutamate molecules in a vesicle having inner diameter of 40 nm is estimated to be 2000, which can occupy 1000 postsynaptic AMPA receptors with dual ligand binding sites. Even though a fraction of the AMPA receptor channels remain closed after binding transmitter, most of transmitter released from vesicles must be cleared away from synaptic cleft without binding to AMPA receptors by diffusion or rapid binding to glutamate transporters (Diamond & Jahr, 1997).
The c.v. of mEPSCs evoked by a sustained presynaptic depolarization was 0.43 at the calyx-NTB synapse, which is comparable to the c.v. of miniature end-plate potentials (0.3, del Castillo & Katz, 1954_a_), and quantal EPSCs revealed by strontium at the cerebellar climbing fibre-Purkinje cell synapse (0.37, Silver et al. 1998) or those revealed by cadmium at the endbulb of Held synapse (0.43, Issacson & Walmsley, 1995). This figure is, however, far larger than the c.v. of quantal size deduced from the first peak in amplitude distribution of evoked EPSCs (0.15, Paulsen & Heggelund, 1994; 0.17, Wall & Usowicz, 1998). Thus, the quantal variance at the calyx-MNTB synapse is large enough to obscure the peaks in the EPSC amplitude histogram. It has been suggested that a single packet of transmitter does not saturate postsynaptic receptors at the frog NMJ (Hartzell et al. 1975), cerebellar mossy fibre-granule cell synapses (Silver et al. 1996) or hippocampal excitatory synapses (Mainen et al. 1999) of juvenile rats. In contrast, postsynaptic receptors are suggested to be fully occupied by a quantal transmitter at adult hippocampal inhibitory synapses (De Koninck & Mody, 1994). Our recent study using direct loading of glutamate into the nerve terminal suggests that postsynaptic receptors are not saturated by a quantal packet of transmitter at the calyx-MNTB synapse (Ishikawa et al. 2000). Thus, the large quantal size variance at this synapse can arise from the variable transmitter content in a vesicle in addition to the intra-site variance of receptor channel openings and inter-site variance of receptor density. At the goldfish Mauthner inhibitory synapse, uniform quantal size variance for multiquantal release has been attributed to background noise variance with quantal transmitter (Korn et al. 1987). In contrast, at the calyx-MNTB synapse, EPSCs could be fitted more satisfactorily on assuming incremental variance with the number of quanta (r) as at the NMJ (del Castillo & Katz, 1954_a_). This may arise from a large intra-site variance partly because of non-saturation of receptors and/or a large inter-site variance of receptor density, which can also increase with r (Clements & Silver, 2000).
Applicability of quantal analysis to central synapses
We have shown that the quantal analysis based upon identified quantal size can be made at the calyx-MNTB synapse after reducing release probability. It remains to be seen whether the quantal analysis is applicable in normal conditions at this synapse. At this calyceal synapse, like the NMJ, but unlike many other central synapses, many quanta are simultaneously released from many sites in physiological conditions, thereby ensuring fast and reliable transmission. At such a large synapse, quanta released from neighbouring release sites may overlap with each other, as at the NMJ (Hartzell et al. 1975) and cerebellar mossy fibre-granules cell synapses (Silver et al. 1996), thereby possibly increasing postsynaptic receptor occupancy toward saturation. At a high release probability, multi-vesicular release (Auger et al. 1998) and postsynaptic receptor desensitization caused by accumulation of released transmitter (Neher & Sakaba, 2001) may further complicate the EPSC amplitude distribution. Also, the release probability among many release sites may not be uniform enough (Rosenmund et al. 1993) to apply the binomial assumption. Thus, the quantal analysis at this synapse is likely to be applicable only in the condition of reduced release probability as at the NMJ (del Castillo & Katz, 1954_a_). However, quantal analysis based upon identified quantal size at this central synapse would be useful in clarifying the mechanisms underlying synaptic modulations caused by a variety of endogenous and exogenous molecules.
Acknowledgments
We thank Taro Ishikawa, Bernard Katz, Motoy Kuno, Thomas Otis, Angus Silver and Gary Westbrook for their comments on the manuscript. We also thank Koichi Yoshioka for help on the Ky plot. This work was supported by grants from the Brain Science Foundation, and the Japan Science and Technology Foundation (CREST) to Y. S., and from the Research for the Future Program from the Japan Society for the Promotion of Sciences to T.T.
References
- Abdul-Ghani MA, Valiante TA, Pennefather PS. Sr2+ and quantal events at excitatory synapses between mouse hippocampal neurons in culture. Journal of Physiology. 1996;495:113–125. doi: 10.1113/jphysiol.1996.sp021578. [DOI] [PMC free article] [PubMed] [Google Scholar]
- Auger C, Marty A. Heterogeneity of functional synaptic parameters among single release sites. Neuron. 1997;19:139–150. doi: 10.1016/s0896-6273(00)80354-2. [DOI] [PubMed] [Google Scholar]
- Auger C, Marty A. Quantal currents at single-site central synapses. Journal of Physiology. 2000;526:3–11. doi: 10.1111/j.1469-7793.2000.t01-3-00003.x. [DOI] [PMC free article] [PubMed] [Google Scholar]
- Auger C, Kondo S, Marty A. Multivesicular release at single functional synaptic sites in cerebellar stellate and basket cells. Journal of Neuroscience. 1998;18:4532–4547. doi: 10.1523/JNEUROSCI.18-12-04532.1998. [DOI] [PMC free article] [PubMed] [Google Scholar]
- Bekkers JM, Clements JD. Quantal amplitude and quantal variance of strontium-induced asynchronous EPSCs in rat dentate granule neurons. Journal of Physiology. 1999;516:227–248. doi: 10.1111/j.1469-7793.1999.227aa.x. [DOI] [PMC free article] [PubMed] [Google Scholar]
- Bekkers JM, Richerson GB, Stevens CF. Origin of variability in quantal size in cultured hippocampal neurons and hippocampal slices. Proceedings of the National Academy of Sciences of the USA. 1990;87:5359–5362. doi: 10.1073/pnas.87.14.5359. [DOI] [PMC free article] [PubMed] [Google Scholar]
- Blankenship JE, Kuno M. Analysis of spontaneous subthreshold activity in spinal motoneurons of the cat. Journal of Neurophysiology. 1968;31:195–209. doi: 10.1152/jn.1968.31.2.195. [DOI] [PubMed] [Google Scholar]
- Borst JGG, Helmchen F, Sakmann B. Pre- and postsynaptic whole-cell recordings in the medial nucleus of the trapezoid body of the rat. Journal of Physiology. 1995;489:825–840. doi: 10.1113/jphysiol.1995.sp021095. [DOI] [PMC free article] [PubMed] [Google Scholar]
- Burger PM, Mehl E, Cameron PL, Maycox PR, Baumert M, Lottspeich F, De Camilli P, Jahn R. Synaptic vesicles immunoisolated from rat cerebral cortex contain high levels of glutamate. Neuron. 1989;3:715–720. doi: 10.1016/0896-6273(89)90240-7. [DOI] [PubMed] [Google Scholar]
- Caicedo A, Eybalin M. Glutamate receptor phenotypes in the auditory brainstem and mid-brain of the developing rat. European Journal of Neuroscience. 1999;11:51–74. doi: 10.1046/j.1460-9568.1999.00410.x. [DOI] [PubMed] [Google Scholar]
- Chuhma N, Ohmori H. Postnatal development of phase-locked high-fidelity synaptic transmission in the medial nucleus of the trapezoid body of the rat. Journal of Neuroscience. 1998;18:512–520. doi: 10.1523/JNEUROSCI.18-01-00512.1998. [DOI] [PMC free article] [PubMed] [Google Scholar]
- Clements JD, Silver RA. Unveiling synaptic plasticity: a new graphical and analytical approach. Trends in Neurosciences. 2000;23:105–113. doi: 10.1016/s0166-2236(99)01520-9. [DOI] [PubMed] [Google Scholar]
- De Koninck Y, Mody I. Noise analysis of miniature IPSCs in adult rat brain slices: Properties and modulation of synaptic GABAA receptor channels. Journal of Neurophysiology. 1994;71:1318–1335. doi: 10.1152/jn.1994.71.4.1318. [DOI] [PubMed] [Google Scholar]
- Del Castillo J, Katz B. Quantal components of end-plate potential. Journal of Physiology. 1954a;124:560–573. doi: 10.1113/jphysiol.1954.sp005129. [DOI] [PMC free article] [PubMed] [Google Scholar]
- Del Castillo J, Katz B. Changes in end-plate activity produced by pre-synaptic polarization. Journal of Physiology. 1954b;124:586–604. doi: 10.1113/jphysiol.1954.sp005131. [DOI] [PMC free article] [PubMed] [Google Scholar]
- Diamond JS, Jahr CE. Transporters buffer synaptically released glutamate on a submillisecond time scale. Journal of Neuroscience. 1997;17:4672–4687. doi: 10.1523/JNEUROSCI.17-12-04672.1997. [DOI] [PMC free article] [PubMed] [Google Scholar]
- Edwards FA, Konnerth A, Sakmann B. Quantal analysis of inhibitory synaptic transmission in the dentate gyrus of rat hippocampal slices: A patch-clamp study. Journal of Physiology. 1990;430:213–249. doi: 10.1113/jphysiol.1990.sp018289. [DOI] [PMC free article] [PubMed] [Google Scholar]
- Forsythe ID. Direct patch recording from identified presynaptic terminals mediating glutamatergic EPSCs in the rat CNS, in vitro. Journal of Physiology. 1994;479:381–387. doi: 10.1113/jphysiol.1994.sp020303. [DOI] [PMC free article] [PubMed] [Google Scholar]
- Forsythe ID, Barnes-Davies M. The binaural auditory pathway: excitatory amino acid receptors mediate dual time course excitatory postsynaptic currents in the rat medial nucleus of the trapezoid body. Proceedings of the Royal Society B. 1993;251:151–157. doi: 10.1098/rspb.1993.0022. [DOI] [PubMed] [Google Scholar]
- Geiger JRP, Melcher T, Koh D-S, Sakmann B, Seeburg PH, Jonas P, Monyer H. Relative abundance of subunit mRNAs determines gating and Ca2+ permeability of AMPA receptors in principal neurons and interneurons in rat CNS. Neuron. 1995;15:193–204. doi: 10.1016/0896-6273(95)90076-4. [DOI] [PubMed] [Google Scholar]
- Gulyas AI, Miles R, Sik A, Toth K, Tamamaki N, Freund TF. Hippocampal pyramidal cells excite inhibitory neurons through a single release site. Nature. 1993;366:683–687. doi: 10.1038/366683a0. [DOI] [PubMed] [Google Scholar]
- Hartzell HC, Kuffler SW, Yoshikami D. Post-synaptic potentiation: Interaction between quanta of acetylcholine at the skeletal neuromuscular synapse. Journal of Physiology. 1975;251:427–463. doi: 10.1113/jphysiol.1975.sp011102. [DOI] [PMC free article] [PubMed] [Google Scholar]
- Ishikawa T, Sahara Y, Takahashi T. A single packet of glutamate does not saturate postsynaptic AMPA receptors at the calyx of Held synapse. Society for Neuroscience Abstracts. 2000;26:1120. [Google Scholar]
- Ishikawa T, Takahashi T. Mechanisms underlying presynaptic facilitatory effect of cyclothiazide at the calyx of Held of juvenile rats. Journal of Physiology. 2001;533:423–431. doi: 10.1111/j.1469-7793.2001.0423a.x. [DOI] [PMC free article] [PubMed] [Google Scholar]
- Issacson JS, Walmsley B. Counting quanta: Direct measurements of transmitter release at a central synapse. Neuron. 1995;15:875–884. doi: 10.1016/0896-6273(95)90178-7. [DOI] [PubMed] [Google Scholar]
- Jack JJB, Redman SJ, Wong K. The components of synaptic potentials evoked in cat spinal motoneurones by impulses in single group Ia afferents. Journal of Physiology. 1981;321:65–96. doi: 10.1113/jphysiol.1981.sp013972. [DOI] [PMC free article] [PubMed] [Google Scholar]
- Katz B, Miledi R. A study of spontaneous miniature potentials in spinal motoneurones. Journal of Physiology. 1963;168:389–422. doi: 10.1113/jphysiol.1963.sp007199. [DOI] [PMC free article] [PubMed] [Google Scholar]
- Katz B, Miledi R. Estimates of quantal content during ‘chemical potentiation’ of transmitter release. Proceedings of the Royal Society B. 1979;205:369–378. doi: 10.1098/rspb.1979.0070. [DOI] [PubMed] [Google Scholar]
- Koh D-S, Geiger JRP, Jonas P, Sakmann B. Ca2+-permeable AMPA and NMDA receptor channels in basket cells of rat hippocampal dentate gyrus. Journal of Physiology. 1995;485:383–402. doi: 10.1113/jphysiol.1995.sp020737. [DOI] [PMC free article] [PubMed] [Google Scholar]
- Korn H, Burnod Y, Faber DS. Spontaneous quantal currents in a central neuron match predictions from binomial analysis of evoked responses. Proceedings of the National Academy of Sciences of the USA. 1987;84:5981–5985. doi: 10.1073/pnas.84.16.5981. [DOI] [PMC free article] [PubMed] [Google Scholar]
- Kullmann DM, Nicoll RA. Long-term potentiation is associated with increases in quantal content and quantal amplitude. Nature. 1992;357:240–244. doi: 10.1038/357240a0. [DOI] [PubMed] [Google Scholar]
- Kuno M. Quantal components of excitatory synaptic potentials in spinal motoneurones. Journal of Physiology. 1964;175:81–99. doi: 10.1113/jphysiol.1964.sp007504. [DOI] [PMC free article] [PubMed] [Google Scholar]
- Mainen ZF, Malinow R, Svoboda K. Synaptic calcium transients in single spines indicate that NMDA receptors are not saturated. Nature. 1999;399:151–155. doi: 10.1038/20187. [DOI] [PubMed] [Google Scholar]
- Neher E, Sakaba T. Combining deconvolution and noise analysis for the estimation of transmitter release rates at the calyx of Held. Journal of Neuroscience. 2001;21:444–461. doi: 10.1523/JNEUROSCI.21-02-00444.2001. [DOI] [PMC free article] [PubMed] [Google Scholar]
- Paulsen O, Heggelund P. The quantal size at reticulogeniculate synapses determined from spontaneous and evoked EPSCs in guinea-pig thalamic slices. Journal of Physiology. 1994;480:505–511. doi: 10.1113/jphysiol.1994.sp020379. [DOI] [PMC free article] [PubMed] [Google Scholar]
- Robinson HPC, Sahara Y, Kawai N. Nonstationary fluctuation analysis and direct resolution of single channel currents at postsynaptic sites. Biophysical Journal. 1991;59:295–304. doi: 10.1016/S0006-3495(91)82223-8. [DOI] [PMC free article] [PubMed] [Google Scholar]
- Rosenmund C, Clements JD, Westbrook GL. Non-uniform probability of glutamate release at a hippocampal synapse. Science. 1993;262:754–757. doi: 10.1126/science.7901909. [DOI] [PubMed] [Google Scholar]
- Sahara Y, Takahashi T. Quantal analysis at a rat central synapse formed by the calyx of Held. Society for Neuroscience Abstracts. 1999;25:476. [Google Scholar]
- Schneggenburger R, Neher E. Intracellular calcium dependence of transmitter release rates at a fast central synapse. Nature. 2000;406:889–893. doi: 10.1038/35022702. [DOI] [PubMed] [Google Scholar]
- Silver RA, Cull-Candy SG, Takahashi T. Non-NMDA glutamate receptor occupancy and open probability at a rat cerebellar synapse with single and multiple release sites. Journal of Physiology. 1996;494:231–250. doi: 10.1113/jphysiol.1996.sp021487. [DOI] [PMC free article] [PubMed] [Google Scholar]
- Silver RA, Momiyama A, Cull-Candy SG. Locus of frequency-dependent depression identified with multiple-probability fluctuation analysis at rat climbing fibre-Purkinje cell synapses. Journal of Physiology. 1998;510:881–902. doi: 10.1111/j.1469-7793.1998.881bj.x. [DOI] [PMC free article] [PubMed] [Google Scholar]
- Stevens CF. Quantal release of neurotransmitter and long-term potentiation. 1993;(Suppl.):55–63. doi: 10.1016/s0092-8674(05)80028-5. Cell 72/Neuron 10. [DOI] [PubMed] [Google Scholar]
- Takahashi T. Inhibitory miniature synaptic potentials in rat motoneurons. Proceedings of the Royal Society B. 1984;221:103–109. doi: 10.1098/rspb.1984.0025. [DOI] [PubMed] [Google Scholar]
- Takahashi T. The minimal inhibitory synaptic currents evoked in neonatal rat motoneurones. Journal of Physiology. 1992;450:539–611. doi: 10.1113/jphysiol.1992.sp019145. [DOI] [PMC free article] [PubMed] [Google Scholar]
- Takahashi T, Forsythe ID, Tsujimoto T, Barnes-Davies M, Onodera K. Presynaptic calcium current modulation by a metabotropic glutamate receptor. Science. 1996;274:594–597. doi: 10.1126/science.274.5287.594. [DOI] [PubMed] [Google Scholar]
- Taschenberger H, Von Gersdorff H. Fine tuning an auditory synapse for speed and fidelity: Developmental changes in presynaptic waveform, EPSC kinetics, and synaptic plasticity. Journal of Neuroscience. 2000;20:9162–9173. doi: 10.1523/JNEUROSCI.20-24-09162.2000. [DOI] [PMC free article] [PubMed] [Google Scholar]
- Traynelis SF, Silver RA, Cull-Candy SG. Estimated conductance of glutamate receptor channels activated during EPSCs at the cerebellar mossy fiber-granule cell synapse. Neuron. 1993;11:279–289. doi: 10.1016/0896-6273(93)90184-s. [DOI] [PubMed] [Google Scholar]
- Van Der Kloot W. Making quantal analysis easier and more accurate. Journal of Neuroscience Methods. 1997;77:129–133. doi: 10.1016/s0165-0270(97)00117-9. [DOI] [PubMed] [Google Scholar]
- Wall MJ, Usowicz MM. Development of the quantal properties of evoked and spontaneous synaptic currents at a brain synapse. Nature Neuroscience. 1998;1:675–682. doi: 10.1038/3677. [DOI] [PubMed] [Google Scholar]
- Walmsley B. Interpretation of ‘quantal peaks’ in distributions of evoked synaptic transmission at central synapses. Proceedings of the Royal Society B. 1995;261:245–250. doi: 10.1098/rspb.1995.0144. [DOI] [PubMed] [Google Scholar]