Integration of Endocannabinoid and Leptin Signaling in an Appetite-Related Neural Circuit (original) (raw)
. Author manuscript; available in PMC: 2008 Apr 3.
Summary
Recently developed therapeutics for obesity, targeted against cannabinoid receptors, result in decreased appetite and sustained weight loss. Prior studies have demonstrated CB1 receptors (CB1Rs) and leptin modulation of cannabinoid synthesis in hypothalamic neurons. Here, we show that depolarization of perifornical lateral hypothalamus (LH) neurons elicits a CB1R-mediated suppression of inhibition in local circuits thought to be involved in appetite and “natural reward.” The depolarization-induced decrease in inhibitory tone to LH neurons is blocked by leptin. Leptin inhibits voltage-gated calcium channels in LH neurons via the activation of janus kinase 2 (JAK2) and of mitogen-activated protein kinase (MAPK). Leptin-deficient mice are characterized by both an increase in steady-state voltage-gated calcium currents in LH neurons and a CB1R-mediated depolarization-induced suppression of inhibition that is 6-fold longer than that in littermate controls. Our data provide direct electrophysiological support for the involvement of endocannabinoids and leptin as modulators of hypothalamic circuits underlying motivational aspects of feeding behavior.
Introduction
Two psychoactive drugs, nicotine in cigarettes and Δ-9-tetrahydrocannabinol (THC), in marijuana have the opposite effects on food intake. The former decreases food intake, and the latter stimulates hunger as well as appetite (Cota et al., 2003; Jo et al., 2002). Despite the well-known physiological effects of these agents administered exogenously, relatively little is known of the hypothalamic actions of their endogenous counterparts. Our prior studies demonstrate that nicotine and endogenous acetylcholine enhance GABAergic transmission at lateral hypothalamus (LH) synapses (Jo and Role, 2002; Jo et al., 2005). The electrophysiological mechanism(s) that underlie the orexigenic effect of cannabinoids remains largely unexplored, and the effects of cannabinoids on synaptic transmission in hypothalamic circuits involved in motivated aspects of feeding are not known. Recent evidence suggests that an endogenous cannabinoid ligand, such as anandamide, increases food intake and body weight (Hao et al., 2000; Williams and Kirkham, 2002). Genetic deletion of the cannabinoid type 1 (CB1) receptor (CB1R) in mice results in a decreased body weight, reduced fat mass, and hypophagia (Cota et al., 2003). CB1R mRNA is coexpressed with mRNA encoding neuropeptides known to modulate food intake in the hypothalamus, such as corticotropin-releasing hormone (CRH), cocaine- and amphetamine-regulated transcript (CART), melanin-concentrating hormone (MCH), and orexin/hypocretin (Cota et al., 2003). Moreover, recent reports identify cannabinoid receptor (CBR) antagonists (such as SR141716, aka rimonabant) as potent inhibitors of appetite with consequent reduction in body weight (Arnone et al., 1997; Ravinet Trillou et al., 2003; Simiand et al., 1998). These observations support a possible role for endocannabinoid receptor activation in feeding-related neuronal circuitry.
The LH appears to be essential for the control of food intake (Elmquist et al., 1999; Flier and Maratos-Flier, 1998; Jo et al., 2002; Lawrence et al., 1999; Sawchenko, 1998). The LH is unique in its expression of two specialized groups of peptide-expressing neurons: the orexin/hypocretin neurons (de Lecea et al., 1998; Sakurai et al., 1998) and those expressing MCH (Broberger et al., 1998). Both populations of neurons have been implicated in the regulation of arousal and in motivated aspects of feeding behavior via their widespread and overlapping projections to key cortical, limbic, and basal forebrain areas (Cvetkovic et al., 2003; Fadel and Deutch, 2002; Sutcliffe and De Lecea, 2002). As LH neurons are implicated in the hedonic or motivational aspects of food intake (Fulton et al., 2000), the appetite-stimulating effects of cannabinoid could involve changes in the excitability of LH neurons.
In this study, we tested the hypothesis that activation of presynaptic CB1Rs by released endogenous cannabinoids might regulate inhibitory tone to perifornical LH neurons. Our electrophysiological analysis reveals that perifornical LH neurons are subject to CB1R-mediated depolarization-induced suppression of inhibition (DSI; for reviews, see Alger, 2002; Freund et al., 2003; Schlicker and Kathmann, 2001; Wilson and Nicoll, 2002). We show that the effects of leptin, an anorexigenic hormone, involve the modulation of endocannabinoid-mediated DSI. Leptin inhibits voltage-gated calcium entry via janus kinase 2 (JAK2) and mitogen-activated protein kinase (MAPK)-dependent signaling, thereby decreasing synthesis and release of endocannabinoids. These results extend prior biochemical studies of leptin-induced decreases in endocannabinoids and are consistent with the hypothesis that the integration of endocannabinoid and leptin signaling regulates the excitability of neurons in appetite-related circuits (Di Marzo et al., 2001).
Results
Our initial experiments identified specific populations of perifornical neurons within acute slice preparations of LH (Jo et al., 2005). We focused our search for possible physiological effects of endocannabinoids on inhibitory inputs to perifornical neurons within the LH by conducting experiments in the presence of a mixture of glutamate receptor blockers (see Experimental Procedures). Under these conditions, all synaptic currents recorded appear to be mediated by GABAA receptors as antagonists (such as 10 μM bicuculline or 10 μM β-hydrastine) blocked all evoked and spontaneous synaptic currents.
Features of Perifornical LH Neurons Studied
Our prior studies identified a population of perifornical LH neurons in acute preparations of mouse brain slice, establishing basic electrophysiological and morphological properties that are associated with specific immunocytochemical features (Jo et al., 2005). In the current study, we focused our work on perifornical neurons with the characteristics of type 1/MCH-positive neurons, which are typically large, multipolar neurons with moderate spike accommodation profiles (Figures 1A and 1B), consistent with the studies of van den Pol and colleagues (Gao et al., 2003; van den Pol et al., 2004). We provide further support for these basic features of MCH neurons in single-cell reverse transcription (RT)-PCR studies of perifornical LH neurons (Figure 1C). Thirteen of the 25 large, multipolar perifornical LH neurons assayed by RT-PCR were positive for both neuronal enolase and MCH mRNA. The majority of the MCH-positive neurons were also positive for fatty acid amide hydrolase (FAAH), a key enzyme in endocannabinoid catalysis (Piomelli, 2003). Subsequent studies examined the role of endocannabinoid signaling in the GABAergic synaptic inputs to neurons with similar morphology and electrophysiological profile located less than 200 μM lateral to the fornix. Thus, overall about half of the neurons sampled are likely to be MCH positive.
Figure 1. Characteristics of MCH Neurons in the Perifornical Lateral Hypothalamus.
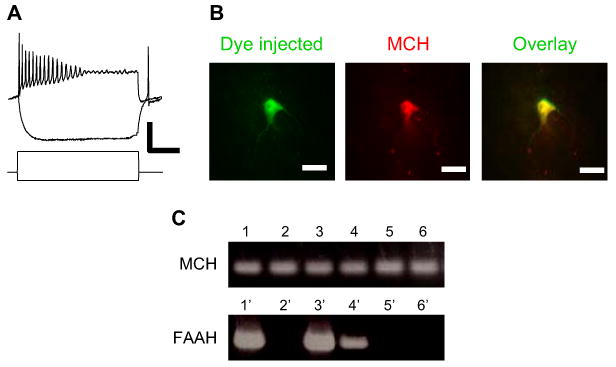
(A) Electrophysiological profile of relocated LH neurons in acute slice. Responses of an MCH-expressing neuron to depolarizing/hyperpolarizing current pulses recorded at the resting membrane potential in current-clamp mode. The neuron shown, like most MCH-positive neurons, has moderate spike accommodation in response to direct depolarization. Vm = −58 mV; scale bar, 50 mV, 0.6 nA, and 100 ms.
(B) Immunohistochemical identification of relocated LH neurons in acute slice. Following recording, the neuron was injected with dye for relocalization and immunohistochemical visualization for MCH. Example of fluorescent dye-injected neuron (green; FITC) immunostained with an antibody to MCH (red; Cy3-IgG). Scale bar, 20 μm.
(C) Expression of MCH and FAAH mRNA in individual perifornical LH neurons in acute brain slice preparations. PCR products from six MCH-positive, neuronal enolase-positive samples (lanes 1–6; top panel). Three of these samples were also positive for FAAH (lanes 1, 3, and 4; bottom panel; overall, four out of seven MCH-positive neurons were also positive for FAAH.).
Direct Depolarization of Postsynaptic Neurons Depresses Evoked IPSCs
We first tested for depolarization-induced suppression of stimulus-evoked GABAergic inhibitory postsynaptic currents (IPSCs). Electrical stimulation of presynaptic inputs within the area ventromedial to the fornix was performed while we recorded from postsynaptic, perifornical LH neurons (Figure 2A). The LH neurons were briefly depolarized from −70 mV to 0 mV for 5 s prior to stimulation of the presynaptic input (Figures 2B1 and 2B2). This protocol has been shown in other brain areas to cause the release of endocannabinoids that then act as retrograde messengers to regulate presynaptic inputs (e.g., Diana et al., 2002; Kreitzer and Regehr, 2001; Wilson and Nicoll, 2001). Also consistent with an endocannabinoid-based mechanism, the depolarization (prepulse)-induced decrease in stimulus-evoked GABAergic transmission was blocked by inclusion of CB1R antagonists (e.g., AM251; 1 μM; n = 3; Figures 2B2 and 2E). Likewise, treatment with a CB1R agonist, such as WIN 55,212-2 (1 μM) mimicked the effects of the DSI protocol, decreasing the amplitude of evoked IPSCs by 55% ± 10% (Figure 2C; n = 4).
Figure 2. Evoked GABAergic Inputs to Perifornical LH Neurons Are Depressed by Direct Depolarization of Postsynaptic Neurons.
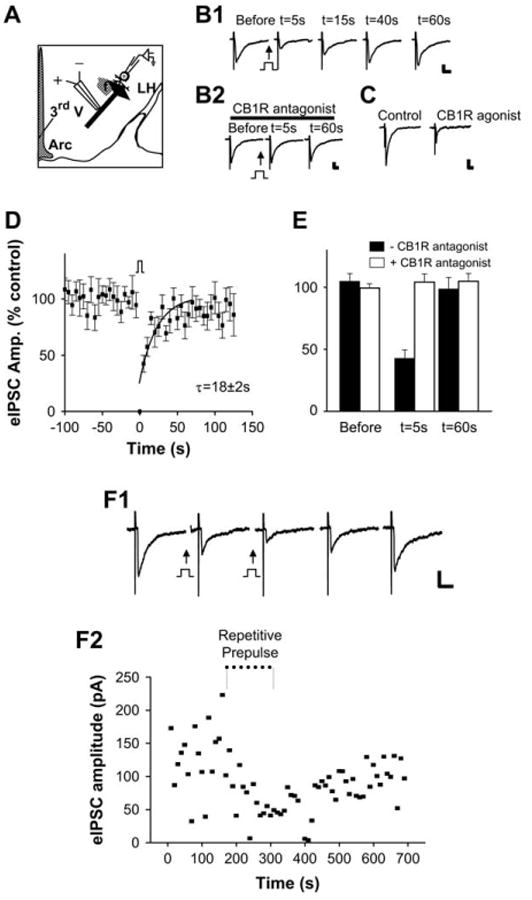
(A) Schematic diagram of experimental configuration for recording evoked and spontaneous GABAergic inputs to perifornical neurons in the LH. Extracellular stimulation of incoming GABAergic projections coursing ventromedial to the fornix are represented by black barbed arrow with apposed bipolar (+/−) electrode. DSI was induced by a “prepulse” step depolarization of the LH neuron through the patch-recording electrode (Arc, arcuate nucleus; f, fornix; 3rd V, third ventricle). (B1 and B2) Depolarization-induced suppression of inhibition (DSI) of evoked IPSCs in LH: inhibition of DSI by the CB1R antagonist AM251. Sample current traces of evoked IPSCs before and after direct depolarization of the postsynaptic neuron. (B1) Following direct “prepulse” depolarization of the postsynaptic neuron, there was a significant decrease in the amplitude of evoked IPSCs (prepulse = step from Vh = −70 mV to 0 mV; 5 s, indicated by square pulse). (B2) Sample current traces of evoked IPSCs before and after DSI protocol in the same cell shown in (B1) but following treatment with the CB1R antagonist AM251. DSI was blocked by AM251 (1 μM). Scale bar, 50 pA, 20 ms. (C) DSI is mimicked by the CB1R agonist WIN 55,212-2. Sample current traces of evoked IPSCs before and after treatment of LH slice with a CB1R agonist. WIN 55,212-2 (1 μM) mimics DSI. Scale bar, 100 pA, 20 ms. (D and E) Pooled data of evoked IPSC amplitude versus time before, during, and after direct depolarization (n = 12). The superimposed curve is a single exponential fit to the data over t = 0–60 s (τ = 18 ± 2 s) (E) Pooled data of evoked IPSC amplitude versus time with (open bars) or without (filled bars) CB1R antagonist. (F1) Repeat prepulse depolarization (indicated by square pulse) prior to stimulus-evoked recording of eIPSCs with an interstimulus interval of 5 s induced a sustained reduction in the amplitude of evoked IPSCs. Scale bar, 50 pA, 50 ms. (F2) Plot of the amplitudes of evoked IPSCs versus time with repetitive prepulse depolarization protocol. Error bars indicate ± SEM.
Examination of the effects of a single prepulse depolarization in perifornical LH neurons revealed significant inhibition of subsequent stimulus-evoked GABAergic IPSCs in about half of the neurons assayed (eIPSCs versus time; Figure 2D). IPSC amplitude was typically decreased by 58% ± 8% of control levels, and the time constant (τ) of recovery from DSI was about 20 s (Figure 2D; τ = 18 ± 2 s; r = 0.8; n = 24). In another set of experiments, 5 s depolarizing steps preceded each presynaptic stimulation with an interstimulus interval of 5 s. Such repetitive prepulse depolarization resulted in sustained reduction in the amplitude of evoked IPSCs (Figures 2F1 and 2F2).
Direct Depolarization of Postsynaptic Neurons Depresses Spontaneous IPSCs
We next tested whether the direct depolarization protocol modulated spontaneous synaptic transmission of GABAergic inputs to LH neurons (sIPSCs). Direct depolarization of perifornical LH neurons decreased ongoing GABAergic transmission, evident in a significant decrease in the frequency of sIPSCs in one-third of the neurons tested (Figure 3A; n = 29). This suppression of sIPSCs persisted after a single prepulse depolarization, with a time constant of ∼4 s (τ = 4.3 ± 0.7 s; r = 0.8; Figure 3B; n = 10). The mean percent decrease in sIPSC frequency was 57% ± 10% (Figure 3B; n = 10 of 29 neurons tested). As in studies of stimulus-evoked GABAergic transmission, we found that exogenous application of a CB1R antagonist blocked depolarization-induced inhibition of spontaneous GABAergic transmission (n = 7; Figure 3A [right panel] and Figure 3C).
Figure 3. Spontaneous GABAergic Inputs to Perifornical LH Neurons Are Depressed by Direct Depolarization of Postsynaptic Neurons.

(A) Sample recordings of spontaneous IPSCs (sIPSCs) before and after direct depolarization. (Left panels) Voltage-clamp recording in perifornical LH neuron showing spontaneous GABAergic IPSCs before and after direct depolarization, at compressed (top) and at expanded (bottom) timescales. (Right panels) Sample recordings of sIPSCs before and after DSI protocol but following treatment of the slice with the CB1R antagonist AM251. Both compressed (top) and expanded timescales (bottom) are shown. HP = −70 mV. Scale bar, 50 pA, 20 s (upper) and 50 pA, 1 s (lower). (B) Pooled data from ten experiments showing the frequency of spontaneous synaptic currents versus time before, during, and after DSI protocol. The superimposed curve is a single exponential fit to the data over t = 0–19 s (τ = 4.3 ± 0.7 s). (C) Pooled data of spontaneous IPSC frequency versus time with (open bars) or without (filled bars) CB1R antagonist. (D1 and D2) Direct loading of anandamide into postsynaptic neurons. (D1) Schematic of anandamide infusion and recording configuration. (D2) Sample current traces of spontaneous GABAergic IPSCs recorded at the times indicated (D3a, D3b, and D3c) after onset of anandamide infusion through the patch pipette. (D3) Plot of the frequency of spontaneous synaptic current events versus time recorded. Loading of anandamide depressed the sIPSC frequency, and the effect of anandamide was reversed by the CB1R antagonist AM251 (1 μM). Scale bar, 100 pA, 200 ms. (E) Summary plot of spontaneous synaptic current frequency data from seven experiments. Error bars indicate ± SEM.
Direct Loading of Anandamide into the Postsynaptic Neurons Reduces Spontaneous GABAergic Transmission Release
To test whether DSI could be mimicked by increasing the intracellular concentration of endocannabinoids, we injected a natural CBR agonist, anandamide (100 μM), into the postsynaptic neurons through the recording pipette. Under these conditions, the frequency of sIPSCs was monitored continuously from the time of initial access in whole-cell configuration (i.e., the onset of anandamide infusion) and without direct depolarization of the neuron. There was a significant decrease in the frequency of sIPSCs in ∼40% of neurons tested (mean inhibition: 28% ± 13%; n = 7 of 19 neurons tested; Figures 3D1 and 3D2). The subsequent addition of CB1R antagonists to the bath reversed the anandamide-induced suppression of sIPSCs (Figures 3D2 and 3E). Taken together, these findings are consistent with the previous studies (Gerdeman et al., 2002; Ronesi et al., 2004) and a proposed model of depolarization-induced suppression in LH, where depolarization of the postsynaptic perifornical LH neurons results in their release of endocannabinoids and the consequent activation of presynaptic CB1Rs, thereby depressing GABAergic transmission.
Leptin Inhibits DSI
Having found that the excitability of perifornical LH neurons can be tuned by endocannabinoids, we next examined the potential of an anorexigenic hormone, leptin, to counter the effects of the orexigenic endocannabinoid signal. We induced DSI by prepulse depolarization of the postsynaptic neurons as before, assaying the effects on evoked (Figures 4A and 4B) and spontaneous GABAergic transmission with or without leptin treatment for ∼10 min (60 nM; Figure 7E). Whereas brief depolarization decreased the amplitude of evoked IPSCs by 47% ± 11%, the same protocol was without effect on the evoked IPSCs following leptin treatment for ∼10 min (n = 5; Figure 4B). Leptin had similar effects on the depolarization-induced suppression of spontaneous GABAergic transmission (see below).
Figure 4. Leptin Inhibits DSI of GABAergic Inputs to Perifornical LH Neurons.

(A) Leptin inhibits DSI of evoked IPSCs. (Top) Sample current traces showing evoked IPSCs before (control) and after (t = 5 s, 25 s) direct depolarization of postsynaptic neuron. (Bottom) Sample current traces of evoked IPSCs in the same neuron before and after direct depolarization following treatment of LH slice with leptin (60 nM). Scale bar, 50 pA, 20 ms. (B) Summary plot of evoked IPSC amplitude data before and after (5 s, 25 s) direct depolarization and in the presence (black bars) or absence (open bars) of leptin (n = 5). (C) Leptin does not interfere with CB1R agonist-induced inhibition of evoked IPSCs. Sample current traces of evoked IPSCs before (control), after (+leptin), and following coapplication of leptin and CB1R agonist (leptin + CB1R agonist). Scale bar, 50 pA, 20 ms. (Stimulus artifact was digitally removed for clarity.) (D) Plot of the amplitudes of evoked IPSCs versus time obtained from the neuron shown in (C). (E) Summary plot of the mean inhibition of evoked IPSCs elicited by a CB1R agonist in the absence or presence of leptin (CB1R agonists, 0 leptin: 55% ± 10%; CB1IR agonist + 60 nM leptin: 52% ± 5%; n = 4, respectively). Error bars indicate ± SEM.
Figure 7. Examination of DSI in Leptin-Deficient Mice Reveals Tonic Disinhibition of Endocannabinoid Signaling.

(A) DSI of spontaneous GABA transmission in wild-type littermates of ob/ob mice. (A1) Sample recordings of spontaneous IPSCs in perifornical LH neuron before and after DSI protocol in acute slice from wild-type littermate of an ob/ob mouse. (A2) Summary plots of frequency of sIPSCs versus time in recordings from perifornical LH neurons in wild-type littermates, before and after DSI protocol (n = 6). (A3) The data were fit by a single exponential function with a τ of 4.5 ± 1 s. Scale bar, 50 pA, 20 s. (B) DSI of spontaneous GABA transmission is prolonged in ob/ob mice. (B1) Sample current traces of spontaneous IPSCs in perifornical LH neuron before and after DSI protocol in acute slice from an ob/ob mouse. (B2) Summary plots of sIPSCs versus time in recordings from perifornical LH neurons in ob/ob mice before and after direct depolarization (n = 9). (B3) The time constant of DSI is increased by 6-fold in ob/ob mice. The superimposed curve is a single exponential fit to the data with a τ of 30 ± 6 s. Scale bar, 50 pA, 20 s. (C) DSI of stimulus-evoked GABA transmission in wild-type littermates of ob/ob mice. Sample current traces of evoked IPSCs before and after direct depolarization of the postsynaptic neuron in +/+ mice (C1). Summary plots of evoked synaptic current amplitude versus time before and after DSI protocol ([C2]; n = 3). (C3) The data were fit by a single exponential function with a τ of 33 ± 3.5 s. Scale bar, 500 pA, 10 ms. (D) DSI of stimulus-evoked GABA transmission is prolonged in ob/ob mice. Sample current traces of evoked IPSCs before and after direct depolarization of the postsynaptic neuron in ob/ob mice (D1). (D2 and D3) Summary plots of evoked synaptic current amplitude versus time before and after DSI protocol ([D2]; τ = 82 ± 14 s; n = 5). Scale bar, 50 pA, 10 ms. (E) The mean amplitude of voltage-gated calcium currents is greater in LH neurons of ob/ob mice versus their +/+ littermates (p < 0.05). Sample recordings (E1) and summary plot (E2). Scale bar, 500 pA, 20 ms. (F) Sample recordings of spontaneous IPSCs before and after leptin treatment in ob/ob mice. Leptin blocks DSI in mutant animals as shown in wild-type animals. Scale bar, 50 pA, 5 s. Error bars indicate ± SEM.
The observation that leptin blocks DSI of both evoked and spontaneous inhibitory transmission in LH could be due to leptin interaction at one or more steps in the proposed sequence of endocannabinoid synthesis and release from perifornical LH neurons or in the CB1R-mediated suppression of GABA transmission. We next tested whether leptin treatment interferes with endocannabinoid signaling due to a direct block of CB1Rs. As shown in Figures 4C and 4D, application of a CB1R agonist (WIN 55,212-2; 1 μM) decreased the amplitude of evoked IPSCs in the presence of leptin (60 nM; n = 4). Leptin does not interfere with CB1R activation per se: the mean inhibition of evoked IPSCs was the same with or without leptin plus the CB1R agonist (Figure 4E).
Leptin Inhibits Voltage-Gated Calcium Channels
We next explored the mechanism(s) by which leptin could interfere with endocannabinoid signaling in assays of leptin effects on depolarization-induced synthesis/release of endocannabinoids from perifornical LH neurons. The regulation of endocannabinoid by leptin appears to be independent of transcriptional effects, as blockade of DSI occurred within minutes (e.g., see Figure 5A).
Figure 5. Leptin Inhibits Voltage-Gated Calcium Channels in Perifornical LH Neurons via JAK2- and MAPK-Dependent Pathways.

(A) Schematic diagram of proposed steps in leptin receptor-mediated inhibition of endocannabinoid signaling. EC, endocannabinoids; VGCC, voltage-gated calcium channels. (B1 and B2) Inhibition of voltage-gated calcium current by leptin. Sample traces of calcium current elicited by step depolarization from −80 to 0 mV for 100 ms. Leptin (30 nM) decreases the amplitude of calcium currents. The effect of leptin persists for more than 30 min. Scale bar, 500 pA, 50 ms. (C, D, and E) Sample traces of voltage-gated calcium current (VGCC) in the presence of leptin and following treatment with indicated kinase inhibitors. The inhibitors of JAK2 (AG490) and MAPK (U0126) activity block the inhibition of voltage-gated calcium currents by leptin. In contrast, treatment with wortmannin, a PI 3-K inhibitor, was without effect on the leptin inhibition of VGCC. Scale bars, 500 pA, 500 pA, 200 pA, and 20 ms, respectively. (F) Summary of the results from experiments with kinase inhibitors tested on leptin-induced inhibition of voltage-gated calcium currents (n = 19). Error bars indicate ± SEM.
The synthesis of endocannabinoids in response to direct depolarization is strongly dependent on increased calcium influx (for review, see Di Marzo et al., 1998; Piomelli, 2003; Wilson and Nicoll, 2002). Hence, we reasoned that leptin-inhibition of DSI may be due, at least in part, to a leptin-induced decrease in calcium entry via the voltage-gated calcium currents that normally support depolarization-induced endocannabinoid production (Figure 5A). To test this possibility, we directly monitored the amplitude of voltage-gated calcium currents in LH neurons by depolarizing the neurons from −80 to 0 mV for 100 ms in the presence or absence of leptin. Bath application of leptin (30 nM) strongly inhibited voltage-gated calcium currents in the LH with the mean inhibition of 54% ± 6% (Figures 5B1 and 5B2; n = 5).
We further explored the intracellular signal transduction mechanisms by which leptin modulates voltage-gated calcium currents (Figure 5A). Leptin receptors are members of the cytokine receptor superfamily that interact with JAK/STAT via specific intracellular docking sites. Leptin's interaction with its receptor causes the activation of JAK2, which in turn can lead to the activation of other downstream kinase cascades, including MAPK and phosphatidylinositol 3-kinase (PI 3-K) (Figure 5A). As shown in Figures 5C and 5F, leptin receptor-mediated inhibition of voltage-gated calcium currents is blocked following treatment of LH slices with a JAK2 inhibitor, AG490 (50 μM and 5 min; n = 6), consistent with the involvement of JAK2 in the regulation of calcium current by leptin.
Other studies have implicated both MAPK (Hegyi et al., 2004) and PI 3-K (Lee et al., 2003) as potential downstream mediators of JAK/STAT signaling. To test whether leptin-stimulated JAK/STAT regulates voltage-gated calcium currents via activation of MAPK, we examined the effect of the MAPK inhibitor U0126. As with JAK2 inhibitor, incubation of slices with MAPK inhibitor U0126 (10 μM; 5 min; n = 5) blocked the leptin-mediated inhibition of voltage-gated calcium currents (Figures 5D and 5F). In contrast to our results implicating both JAK and MAPK in leptin-induced inhibition of calcium currents, inhibitors of PI 3-K (200 nM wortmannin) were without effect; leptin still effectively inhibited voltage-gated calcium currents (mean inhibition: 52% ± 7%; n = 3; Figures 5E and 5F). Our data are consistent with the involvement of JAK2 and MAPK in the regulation of voltage-dependent calcium channels by leptin.
The Extent of DSI Is Directly Related to the Extent of Postsynaptic Calcium Entry
Having found that leptin modulates voltage-gated calcium current in a manner consistent with the observed leptin-induced inhibition of DSI, we next tested the potential contribution of calcium influx to the extent of DSI at LH synapses. First, we examined the effects of increasing external [Ca2+] on the profile of DSI. Raising [Ca2+]ext from 2.5 to 5 mM significantly prolonged DSI of spontaneous GABAergic transmission, increasing the time constant for recovery from 4 to 31 s (compare Figures 3B and 6B; n = 8 cells). Hence, the duration of DSI appears to be regulated by the amount of calcium influx. In another set of experiments, we decreased the intracellular [Ca2+] by increasing the concentration of the calcium buffer, BAPTA, in the patch pipette solution over the range of 0.2 mM (standard conditions) to 10 mM. Raising [BAPTA]int levels above 5 mM prevented DSI of GABAergic transmission in LH (Figure 6C). Taken together, these results are compatible with the idea that intracellular Ca2+ levels are an important determinant of the extent of DSI and are consistent with prior studies demonstrating that endocannabinoid synthesis is dependent on cellular levels of calcium (for review, see Di Marzo et al., 1998).
Figure 6. The Extent of DSI Is Directly Related to Depolarization-Induced Increases in Postsynaptic Calcium via Voltage-Gated Calcium Channels.

(A) Sample recordings of spontaneous IPSCs before and after DSI protocol in 5 mM [Ca]ext. All experiments were conducted with 0.2 mM BAPTA in the recording pipette (compare with Figure 3). Scale bar, 50 pA, 20 s. (B) Pooled data from eight experiments with 5 mM [Ca]ext showing the frequency of spontaneous synaptic currents versus time before, during, and after DSI protocol. The superimposed curve is a single exponential fit to the data (τ = 31 ± 5 s; fit over t = 0–36 s). (C) Pooled data of percent change in DSI of spontaneous IPSCs at different [BAPTA]int. (D1) Sample recordings of calcium currents and spontaneous IPSCs before and after DSI protocol. Scale bar, 50 pA, 5 s. (D2) Superimposed calcium currents at voltage steps of −20 and −30 mV, respectively. (E) Pooled data from ten experiments examining the relationship between voltage-gated calcium current (integrated ICa, as percent of maximum) and the extent of depolarization-induced suppression of spontaneous GABAergic transmission to perifornical LH neurons. Error bars indicate ± SEM.
We further tested the relationship between depolarization-induced Ca2+ conductance and DSI by direct measure of both parameters. We isolated calcium currents (ICa) by addition of broad spectrum blockers of both IK and INa (see Experimental Procedures). Application of depolarizing voltage steps to postsynaptic perifornical LH neurons activated ICa and elicited DSI as measured by decreased spontaneous GABAergic transmission. The extent of DSI was steeply related to changes in the total charge transfer measured as integrated ICa; even a 20% decrease in the integrated ICa was sufficient to block DSI (Figures 6D1, 6D2, and 6E).
Leptin Deficiency Induces a More Prolonged DSI in ob/ob Mice
Having established that leptin can regulate voltage-gated calcium currents, subsequent studies tested for a potential role of endogenous signaling via leptin-endocannabinoid interactions, using leptin-deficient (ob/ob) mice of the FVB strain (Haluzik et al., 2004). In wild-type FVB littermates (+/+), we observed the same time course and the same extent of DSI as observed in C57BL/6 wild-type mice (Figure 7A). In contrast, brief depolarization of perifornical LH neurons induced a more profound DSI in slices from ob/ob mice than in those from wild-type littermates (Figure 7B). Thus, the time constant for recovery of DSI was increased about 6-fold in ob/ob versus +/+ littermates (Figures 7A and 7B; τ: +/+ = 4.5 ± 1 s, ob/ob = 30 ± 6 s; mean percent of inhibition: +/+ = 54 ± 17, ob/ob = 57 ± 3; n = 6/19 and n = 9/27, respectively). DSI of the evoked IPSCs was also more prolonged in ob/ob than in +/+ mice (Figures 7C and 7D; τ: +/+ = ∼33 ± 3.5 s, ob/ob = 82 ± 14 s; τ over t = 0–120 s for both; mean percent of inhibition: +/+ = 48 ± 9, ob/ob = 53 ± 19; n = 3 and n = 5, respectively). Finally, as the blockade of DSI by leptin seems to be due, at least in part, to inhibition of voltage-gated calcium current, we tested whether there might be an increase in calcium currents in leptin-deficient animals. Significant increases in the mean amplitude of voltage-gated calcium currents in LH neurons of ob/ob mice (+/+: 818 ± 90 pA, n = 17; ob/ob: 1096 ± 90 pA, n = 17; p < 0.05; Figure 7E) were detected without changes in capacitance (+/+: 14.5 ± 0.6 pF, n = 14; _ob/ob_: 14.5 ± 0.7 pF, n = 13). Neither the frequency nor the mean amplitude of sIPSCs was significantly different between +/+ and _ob/ob_ mice, although we noted a trend toward increased baseline sIPSC frequency in _ob/ob_ mice (frequency: +/+ = 9.3 ± 2 Hz, _ob/ob_ = 13.1 ± 2.5 Hz; amplitude: +/+ = 46.1 ± 5 pA, _ob/ob_ = 58.6 ± 6 pA; n = 19 and 27, respectively; p > 0.05). The application of exogenous leptin in slices from ob/ob mice blocked DSI, similar to its effects in wild-type littermates (Figure 7F; n = 4). Overall, these data are consistent with a steady-state increase in endocannabinoid tone due, at least in part, to enhanced voltage-gated calcium influx in ob/ob mice.
Discussion
The purpose of this study was to explore how the neurons of the LH area integrate signaling of an orexigenic agent, endocannabinoid, with that of an anorexigenic agent, leptin. The perifornical LH neurons are of particular interest as part of the neural circuitry commonly related to motivational aspects of food intake (for review, see Kelley and Berridge, 2002). Our work provides direct electrophysiological evidence for mechanisms underlying the regulatory balance between these signals in four sets of experimental results (summarized in the schematic diagrams presented in Figure 8). First, we demonstrate that the inputs to neurons within 200 μm perifornical to the LH are disinhibited by endocannabinoids. Second, we demonstrate that an endogenous anorexigenic signal, leptin, “short circuits” the endocannabinoid effects by downmodulation of a voltage-gated calcium current. As calcium entry into the LH neurons is required for the tonic synthesis of endocannabinoids, leptin-sensitive calcium entry provides an endogenous counterbalance to this appetitive drive. Third, we define key aspects of the signaling cascades between the activation of leptin receptors and the modulation of the voltage-gated calcium current. Specifically, we found that leptin inhibits voltage-gated calcium currents via the activation of JAK2 and MAPK in LH neurons. Finally, we implicate this mechanism for leptin receptor/endocannabinoid signaling interactions in contributing to the maintenance of weight balance in studies of genetically modified mice that are obese due to leptin signaling deficiencies.
Figure 8. Summary Diagram of Current Studies and Proposed Model.

(Left side) Schematic of lateral hypothalamus (LH) area illustrating perifornical LH neurons that were the focus of the current study. MCH neurons receive GABAergic inputs from diverse brain areas, including the nucleus accumbens/ventral striatum and the arcuate nucleus. The regulation of these GABAergic inhibitory tones to MCH neurons appears to be an important factor for controlling food intake and appetite. (Right top panel) Cartoon of proposed model for mechanisms of endocannabinoid signaling and modulation of GABAergic transmission in the perifornical LH neurons of the LH. The activation of presynaptic CB1Rs located on GABA terminals decreases GABA release, thereby enhancing the net excitability of perifornical LH neurons, consistent with increased feeding behavior. The activation of leptin receptors on perifornical LH neurons inhibits voltage-gated calcium currents (VGCC) via activation of JAK2 and MAPK. The consequent decrease in [Ca]int results in less synthesis and release of endocannabinoids and hence decreases DSI. Perifornical LH neurons in leptin-deficient, obese mice (ob/ob) have larger VGCC, consistent with upregulated endocannabinoid signaling, enhanced excitability, and consequent hyperphagia. (Right bottom panel) Cartoon of proposed model for mechanisms in which rimonabant, a CB1R antagonist, decreases body weight and food intake. Rimonabant would inhibit CB1R, antagonizing the elevated EC from the MCH neuron. This would potentially normalize GABA release and inhibit MCH release, leading to decreased appetite.
Immunohistochemical studies have demonstrated CB1R expression in the hypothalamus, particularly the LH of the rat (Moldrich and Wenger, 2000). Likewise, in situ hybridization studies demonstrated that CB1R mRNA is detected in particular subsets of hypothalamic neurons that are involved in the control of feeding behaviors, such as CRH, CART, MCH, and orexin/hypocretin neurons (Cota et al., 2003). Our experiments examined the effect of endocannabinoids in a subpopulation of LH neurons within the perifornical area that includes MCH-expressing neurons (Broberger et al., 1998; Elias et al., 1998). We chose neurons within the perifornical LH based on several criteria (Jo et al., 2005). About half of the neurons that we assayed are MCH positive. In addition, about 60% of MCH mRNA-positive neurons expressed FAAH, an enzyme that degrades endocannabinoids (for review, see Piomelli, 2003), consistent with the idea that MCH neurons may release endocannabinoids in the LH. Indeed, direct depolarization of the majority of the perifornical LH neurons suppressed both spontaneous and evoked GABAergic transmission, consistent with endocannabinoid activation of the CB1Rs expressed in LH (Cota et al., 2003; Moldrich and Wenger, 2000). CB1R antagonists blocked DSI observed in LH, and CB1R agonists mimicked the effects of the DSI protocol, consistent with the participation of CB1R in the modulation of GABA release (Figure 8). Additional evidence consistent with endocannabinoid mediation of DSI in hypothalamus is provided by experiments in which anandamide was loaded into the postsynaptic neurons directly through the patch pipette. Introduction of cannabinoids into the LH neurons also depressed GABAergic inputs to these neurons in a CB1R antagonist-sensitive manner. Taken together, these experiments support prior proposals that endocannabinoids can act as retrograde messengers to inhibit GABA release from presynaptic GABA inputs and demonstrate that such a mechanism is employed in the hypothalamus. The activation of CB1Rs leads to a net increase in the excitability of LH neurons, consistent with the effects of cannabinoid agonists in enhancing food intake (Cota et al., 2003; Di Marzo et al., 2001; Hao et al., 2000; Kirkham et al., 2002; Williams and Kirkham, 2002). The endocannabinoid-induced suppression of GABAergic transmission at LH synapses contrasts with the enhancement of GABAergic input elicited by nicotinic AChR activation in vitro and in acute hypothalamic slice (Jo and Role, 2002; Jo et al., 2005).
In situ hybridization studies demonstrate leptin receptor expression within the LH (Elmquist et al., 1998), and leptin induces STAT translocation in the LH (Ladyman and Grattan, 2004). Prior studies of the arcuate nucleus demonstrate differential effects of leptin on the firing properties of neuropeptide Y (NPY)- versus pro-opiomelanocortin (POMC)-expressing neurons. Leptin excites POMC-expressing neurons, whereas it inhibits NPY-expressing neurons, resulting in an increase in anorexigenic peptides and decreased orexigenic peptides in the target areas, respectively (for a review, see Schwartz et al., 2000). Although leptin has been shown to activate or inhibit neurons of the arcuate nucleus, the electrophysiological effects of leptin within the LH nucleus remain relatively unexplored (Funahashi et al., 1999). We found that leptin blocked DSI in the LH in all cases examined. Furthermore, leptin-deficient mice show a prolonged DSI consistent with an increased endocannabinoid tone due, at least in part, to enhanced voltage-gated calcium influx in ob/ob mice.
Recent studies have reported that activation of G protein-coupled receptors, including metabotropic glutamate receptors and muscarinic acetylcholine receptors, enhance endocannabinoid release (Galante and Diana, 2004; Kim et al., 2002; Maejima et al., 2001; Ohno-Shosaku et al., 2002, 2003). Hence, the synthesis of the endocannabinoids anandamide and 2-AG is initiated in postsynaptic target cells either by calcium influx through voltage-gated calcium channels or by the activation of G protein-coupled receptors. Our work reveals that activation of leptin receptors inhibits rather than enhances endocannabinoid release (Figure 8). In the absence of a neuronal storage mechanism for endocannabinoids, the effect of leptin on endocannabinoid signaling in the LH may reflect decreased synthesis, increased degradation, or both. Prior studies have reported that hypothalamic activity of the enzyme FAAH, which hydrolyzes both anandamide and 2-AG, was not affected by leptin (Di Marzo et al., 2001). Furthermore, the activity of the N-arachidonoyl-phosphatidylethanolamine (N-Ar-PE)-specific phospholipase D (PLD), which catalyses the conversion of N-Ar-PE into anandamide, was not altered by treatment with leptin (Di Marzo et al., 2001).
Endocannabinoid synthesis is calcium dependent (for review, see Di Marzo et al., 1998; Piomelli, 2003; Wilson and Nicoll, 2002). Current studies demonstrate that depolarization-induced calcium entry is an important determinant of the degree of DSI. An ∼20% decrease of the integrated ICa was sufficient to block DSI at LH synapses. Hence, the regulation by leptin of calcium entry through voltage-dependent calcium channels may be, at least in part, an important determinant in the control of endocannabinoid signaling. Of course, the mechanisms underlying the regulation of endocannabinoid signaling by leptin may not depend solely on inhibition of calcium entry (see Figure 8). Prior studies have demonstrated the involvement of cyclooxygenase-2 (Kim and Alger, 2004), ryanodine-sensitive stores (Isokawa and Alger, 2005), anandamide transporter (Ronesi et al., 2004), anandamide internalization (Fegley et al., 2004), and type 1 mGluRs (Maejima et al., 2001; Varma et al., 2001) as well as mAChRs (Kim et al., 2002) in the regulation of endocannabinoid signaling. Interestingly, Maccarrone and colleagues (Maccarrone et al., 2003) have demonstrated that physiological levels of leptin stimulate the activity of FAAH in human T lymphocytes up to ∼300% over the untreated controls.
Leptin deficiency is accompanied by an increase in the mean amplitude of calcium currents in LH neurons of ob/ob mice, and CB1R-mediated DSI is greatly enhanced. The loss of leptin signaling in the ob/ob mice results in a more sustained CB1R-mediated suppression of GABAergic transmission. These data are consistent with decreased leptin signaling, resulting in an increase in the duration of endocannabinoid-induced modulation in leptin-deficient, genetically obese mice (Figure 8). Prior studies demonstrate that endocannabinoid signaling regulates feeding behavior (Cota et al., 2003; Di Marzo et al., 2001; Hao et al., 2000; Kirkham et al., 2002; Williams and Kirkham, 2002). Upregulation of endocannabinoid signaling in the LH may explain, at least in part, the increased body weight consistent with a prior report of elevated endocannabinoids in ob/ob mice (Di Marzo et al., 2001).
In summary, our data indicate that the orexigenic effects of endocannabinoids include a presynaptic CB1R-mediated suppression of GABAergic transmission in LH. In addition, we provide direct electrophysiological evidence that the effects of leptin involve inhibition of postsynaptic Ca entry and consequent endocannabinoid-induced DSI. The cellular mechanisms of recently developed antiobesity drugs, such as rimonabant (Figure 8), may include decreased endocannabinoid signaling and hence decreased excitability of LH circuits related to appetite, even in the context of leptin insufficiency or resistance.
Experimental Procedures
Slice Preparation
Transverse brain slices were prepared from C57BL/6 (wild-type only) or FVB-ob (+/+ or ob/ob) mice (Haluzik et al., 2004) at postnatal age 14–20 days. Genotyping was performed on DNA extracted from toe clips obtained 1–5 days prior to sacrifice. Animals were anesthetized with a mixture of ketamine and xylazine. After decapitation, the brain was transferred into a sucrose-based solution bubbled with 95% O2/5% CO2 and maintained at ∼3°C. This solution contained the following: 248 mM sucrose, 2 mM KCl, 1 mM MgCl2, 1.25 mM KH2PO4, 26 mM NaHCO3, and 10 mM glucose. Transverse coronal brain slices (350 μM) were prepared using a Vibratome (Leica VT1000S). Slices were equilibrated with an oxygenated artificial cerebrospinal fluid (aCSF) for >1 hr prior to transfer to the recording chamber. The slices were continuously superfused with aCSF at a rate of 2 ml/min containing the following: 113 mM NaCl, 3 mM KCl, 1 mM NaH2PO4, 26 mM NaHCO3, 2.5 mM CaCl2, 1 mM MgCl2, and 10 mM glucose in 95% O2/5% CO2 at room temperature (25°C–26°C).
Electrophysiological Recordings
Brain slices were placed on the stage of an upright, infrared-differential interference contrast microscope (Olympus BX50WI) mounted on a Gibraltar X-Y table (Burleigh) and visualized with a 40× water immersion objective by infrared microscopy (DAGE MTI camera). Membrane currents were recorded at room temperature (25°C–26°C) with an Axopatch 200B patch-clamp amplifier in the whole-cell configuration. The external solution contained the following: 113 mM NaCl, 3 mM KCl, 1 mM NaH2PO4, 26 mM NaHCO3, 2.5 mM CaCl2, 1 mM MgCl2, and 10 mM glucose in 95% O2/5% CO2. CNQX (10 μM), DL-amino-phosphonovaleric acid (DL-AP-5; 50 μM), strychnine (1 μM), and CGP55845 (GABAB receptor antagonist; 10 μM) were continuously present in the external solution. The internal solution contained the following: 130 mM KCl or CsCl, 2 mM MgCl2, 0.2 mM EGTA, 10 mM HEPES, 1 mM Na2ATP, 0.5 mM Na2GTP, and 0.5 mM QX314. Pipette resistance ranged from 2.5 to 4 MΩ.
For extracellular stimulation, an electrode prepared from theta glass (WPI, Inc.) and filled with extracellular solution was placed medial to the perifornical area and the recorded neuron. Spontaneous postsynaptic currents were recorded to a PC with a Pentium III processor after being filtered at 5 kHz by Axopatch 200B and analyzed using pClamp9 (Axon Instruments, Inc.) and Mini analysis 5.0 (Synaptosoft, Inc.). To induce DSI, the postsynaptic neuron was briefly depolarized from −70 to 0 mV (interval between pulses: 5 s).
To monitor the currents of voltage-dependent calcium channels, voltage-dependent Na+ channels were blocked by tetrodotoxin (1 μM), and voltage-dependent K+ channels were blocked by adding tetraethylammonium (TEA) in the extracellular solution (93 mM NaCl, 3 mM KCl, 1 mM NaH2PO4, and 20 mM NaHCO3, glucose, CaCl2, MgCl2, and TEACl) as well as 4-AP and Cs+ in the intracellular solution (65 mM Cs2SO4, 2 mM MgCl2, 10 mM HEPES, 10 mM EGTA, 5 mM 4-AP, 2 mM ATP, 0.5 mM GTP, and 5 mM phosphocreatine). Osmolarity was adjusted with sucrose. We also added CNQX (10 μM), DL-APV (50 μM), bicuculline (10 μM), and strychnine (1 μM). We depolarized the neurons from −80 to 0 mV for 100 ms to activate voltage-dependent calcium channels. Under these experimental conditions, the inward currents were completely inhibited by 200 μM cadmium (n = 3), indicating that these are calcium currents. To measure both voltage-dependent calcium currents and DSI, we used the intracellular solution containing the following: 100 mM CsCl, 30 mM TEACl, 2 mM MgCl2, 10 mM HEPES, 0.2 mM BAPTA, 5 mM 4-AP, 1 mM QX-314, 2 mM ATP, 0.5 mM GTP, and 5 mM phosphocreatine.
Student's t tests were used to analyze the difference between parameters (Origin 6.0). The critical value for statistical significance was set at p < 0.05. The time constant (τ) of recovery from DSI was fit by a single exponential function to the data over the time window indicated in the text; fitted curves have correlation coefficients of ∼0.8 in most cases (Origin 6.0). All statistical results are given as mean ± standard error of the mean (SEM).
Single-Cell RT-PCR
Single-cell samples were collected from brain slice preparations via aspiration into the patch pipette. The initial RT reaction was conducted after pressure ejection of the single-cell samples into freshly prepared RT mix A solution (RT mix A: 20 U of RNase OUT, 300 ng of random primers, 0.5% NP-40, and RNase-free water). Samples were sonicated in a total volume of 10 μl at 4°C for 5 min and then incubated for 3 min at 65°C prior to addition of 10 μl RT mix B (RT mix B: 500 μM dNTP, 1 × RT buffer, 5 mM MgCl2, 10 mM DTT, and 200 U Superscript II). The tubes were incubated at 25°C for 5 min, at 42°C for 1 hr, and at 65°C for 10 min.
Each cDNA sample obtained was split into two aliquots, one for analysis of MCH transcripts and the other for analysis of neuronal enolase. Two rounds of amplification were done for the detection of MCH transcripts, and one round of amplification was done for the analysis of neuronal enolase. In the first amplification (final volume 50 μl), the reaction mixture contained 10 μl of cDNA, 1 × PCR buffer with Mg2+ (Roche), 0.2 mM dNTP, 0.1 μM of each primer, and 2 U of Taq polymerase (Roche). For the second amplification, the reaction mixtures contained 3 μl of the first round PCR product, 1 × PCR buffer with Mg2+ (Roche), 0.5 mM dNTP, 1 μM of each primer, 1 M Betaine (Sigma), and 2 U of Taq polymerase in a final volume of 30 μl). Following denaturation by 3 min at 94°C, the target cDNAs were amplified by 35 cycles (94°C, 30 s; 60°C, 30 s; 72°C, 30 s) followed by 10 min at 72°C. As positive control, 1 ng of brain RNA was subjected to RT-PCR in parallel with the single-cell samples. After amplification, the PCR products (532 bp for enolase, 220 bp for MCH, and 334 bp for FAAH) were analyzed on 2% agarose gels. The primers used were as follows: MCH sense, 5′-CAGCTTCCAAGTCCATAAGG-3′; MCH antisense, 5′-AGTGGCAGCCCGTGAGTTAC-3′; FAAH sense, 5′-TGACTGACTGTGAGACTCAG-3′; FAAH antisense, 5′-GCCTCCAGATCCAATGAGAG-3′; enolase sense, 5′-GCTTTGCCCCCAATATCCTG-3′; enolase antisense, 5′-CACAGTCCGACGACAAGATC-3′. The primers were purchased from Invitrogen (Carlsbad, CA).
Acknowledgments
We would like to thank Dr. Rémy Schlichter for the valuable discussions. We also thank Drs. Steven Siegelbaum and Li Jiang for helpful comments on prior versions of this manuscript and Denise Wiedl for technical assistance. This work was supported by NS22061 and a NARSAD Grable Distinguished Investigator award to L.W.R.; by CA79737 to D.A.T.; by DK57621 to S.C.C.; and by an award from the New York Obesity Research Center to Y.-H.J.
References
- Alger BE. Retrograde signaling in the regulation of synaptic transmission: focus on endocannabinoids. Prog Neurobiol. 2002;68:247–286. doi: 10.1016/s0301-0082(02)00080-1. [DOI] [PubMed] [Google Scholar]
- Arnone M, Maruani J, Chaperon F, Thiebot MH, Poncelet M, Soubrie P, Le Fur G. Selective inhibition of sucrose and ethanol intake by SR 141716, an antagonist of central cannabinoid (CB1) receptors. Psychopharmacology (Berl) 1997;132:104–106. doi: 10.1007/s002130050326. [DOI] [PubMed] [Google Scholar]
- Broberger C, De Lecea L, Sutcliffe JG, Hokfelt T. Hypocretin/orexin- and melanin-concentrating hormone-expressing cells form distinct populations in the rodent lateral hypothalamus: relationship to the neuropeptide Y and agouti gene-related protein systems. J Comp Neurol. 1998;402:460–474. [PubMed] [Google Scholar]
- Cota D, Marsicano G, Tschop M, Grubler Y, Flachskamm C, Schubert M, Auer D, Yassouridis A, Thone-Reineke C, Ortmann S, et al. The endogenous cannabinoid system affects energy balance via central orexigenic drive and peripheral lipogenesis. J Clin Invest. 2003;112:423–431. doi: 10.1172/JCI17725. [DOI] [PMC free article] [PubMed] [Google Scholar]
- Cvetkovic V, Brischoux F, Griffond B, Bernard G, Jacquemard C, Fellmann D, Risold PY. Evidence of melanin-concentrating hormone-containing neurons supplying both cortical and neuroendocrine projections. Neuroscience. 2003;116:31–35. doi: 10.1016/s0306-4522(02)00557-2. [DOI] [PubMed] [Google Scholar]
- de Lecea L, Kilduff TS, Peyron C, Gao X, Foye PE, Danielson PE, Fukuhara C, Battenberg EL, Gautvik VT, Bartlett FS, II, et al. The hypocretins: hypothalamus-specific peptides with neuroexcitatory activity. Proc Natl Acad Sci USA. 1998;95:322–327. doi: 10.1073/pnas.95.1.322. [DOI] [PMC free article] [PubMed] [Google Scholar]
- Diana MA, Levenes C, Mackie K, Marty A. Short-term retrograde inhibition of GABAergic synaptic currents in rat Purkinje cells is mediated by endogenous cannabinoids. J Neurosci. 2002;22:200–208. doi: 10.1523/JNEUROSCI.22-01-00200.2002. [DOI] [PMC free article] [PubMed] [Google Scholar]
- Di Marzo V, Melck D, Bisogno T, De Petrocellis L. Endocannabinoids: endogenous cannabinoid receptor ligands with neuromodulatory action. Trends Neurosci. 1998;21:521–528. doi: 10.1016/s0166-2236(98)01283-1. [DOI] [PubMed] [Google Scholar]
- Di Marzo V, Goparaju SK, Wang L, Liu J, Batkai S, Jarai Z, Fezza F, Miura GI, Palmiter RD, Sugiura T, Kunos G. Leptin-regulated endocannabinoids are involved in maintaining food intake. Nature. 2001;410:822–825. doi: 10.1038/35071088. [DOI] [PubMed] [Google Scholar]
- Elias CF, Saper CB, Maratos-Flier E, Tritos NA, Lee C, Kelly J, Tatro JB, Hoffman GE, Ollmann MM, Barsh GS, et al. Chemically defined projections linking the mediobasal hypothalamus and the lateral hypothalamic area. J Comp Neurol. 1998;402:442–459. [PubMed] [Google Scholar]
- Elmquist JK, Bjorbaek C, Ahima RS, Flier JS, Saper CB. Distributions of leptin receptor mRNA isoforms in the rat brain. J Comp Neurol. 1998;395:535–547. [PubMed] [Google Scholar]
- Elmquist JK, Elias CF, Saper CB. From lesions to leptin: Hypothalamic control of food intake and body weight. Neuron. 1999;22:221–232. doi: 10.1016/s0896-6273(00)81084-3. [DOI] [PubMed] [Google Scholar]
- Fadel J, Deutch AY. Anatomical substrates of orexindopamine interactions: lateral hypothalamic projections to the ventral tegmental area. Neuroscience. 2002;111:379–387. doi: 10.1016/s0306-4522(02)00017-9. [DOI] [PubMed] [Google Scholar]
- Fegley D, Kathuria S, Mercier R, Li C, Goutopoulos A, Makriyannis A, Piomelli D. Anandamide transport is independent of fatty-acid amide hydrolase activity and is blocked by the hydrolysis-resistant inhibitor AM1172. Proc Natl Acad Sci USA. 2004;101:8756–8761. doi: 10.1073/pnas.0400997101. [DOI] [PMC free article] [PubMed] [Google Scholar]
- Flier JS, Maratos-Flier E. Obesity and the hypothalamus: Novel peptides for new pathways. Cell. 1998;92:437–440. doi: 10.1016/s0092-8674(00)80937-x. [DOI] [PubMed] [Google Scholar]
- Freund TF, Katona I, Piomelli D. Role of endogenous cannabinoids in synaptic signaling. Physiol Rev. 2003;83:1017–1066. doi: 10.1152/physrev.00004.2003. [DOI] [PubMed] [Google Scholar]
- Fulton S, Woodside B, Shizgal P. Modulation of brain reward circuitry by leptin. Science. 2000;287:125–128. doi: 10.1126/science.287.5450.125. [DOI] [PubMed] [Google Scholar]
- Funahashi H, Yada T, Muroya S, Takigawa M, Ryushi T, Horie S, Nakai Y, Shioda S. The effect of leptin on feeding-regulating neurons in the rat hypothalamus. Neurosci Lett. 1999;264:117–120. doi: 10.1016/s0304-3940(99)00186-x. [DOI] [PubMed] [Google Scholar]
- Galante M, Diana MA. Group I metabotropic glutamate receptors inhibit GABA release at interneuron-Purkinje cell synapses through endocannabinoid production. J Neurosci. 2004;24:4865–4874. doi: 10.1523/JNEUROSCI.0403-04.2004. [DOI] [PMC free article] [PubMed] [Google Scholar]
- Gao XB, Ghosh PK, Van Den Pol AN. Neurons synthesizing melanin-concentrating hormone identified by selective reporter gene expression after transfection in vitro: transmitter responses. J Neurophysiol. 2003;90:3978–3985. doi: 10.1152/jn.00593.2003. [DOI] [PubMed] [Google Scholar]
- Gerdeman GL, Ronesi J, Lovinger DM. Postsynaptic endocannabinoid release is critical to long-term depression in the striatum. Nat Neurosci. 2002;5:446–451. doi: 10.1038/nn832. [DOI] [PubMed] [Google Scholar]
- Haluzik M, Colombo C, Gavrilova O, Chua S, Wolf N, Chen M, Stannard B, Dietz KR, Le Roith D, Reitman ML. Genetic background (C57BL/6J versus FVB/N) strongly influences the severity of diabetes and insulin resistance in ob/ob mice. Endocrinology. 2004;145:3258–3264. doi: 10.1210/en.2004-0219. [DOI] [PubMed] [Google Scholar]
- Hao S, Avraham Y, Mechoulam R, Berry EM. Low dose anandamide affects food intake, cognitive function, neurotransmitter and corticosterone levels in diet-restricted mice. Eur J Pharmacol. 2000;392:147–156. doi: 10.1016/s0014-2999(00)00059-5. [DOI] [PubMed] [Google Scholar]
- Hegyi K, Fulop K, Kovacs K, Toth S, Falus A. Leptin-induced signal transduction pathways. Cell Biol Int. 2004;28:159–169. doi: 10.1016/j.cellbi.2003.12.003. [DOI] [PubMed] [Google Scholar]
- Isokawa M, Alger BE. Retrograde endocannabinoid regulation of GABAergic inhibition in the rat dentate gyrus granule cell. J Physiol. 2005;567:1001–1010. doi: 10.1113/jphysiol.2005.094219. [DOI] [PMC free article] [PubMed] [Google Scholar]
- Jo YH, Role LW. Cholinergic modulation of purinergic and GABAergic co-transmission at in vitro hypothalamic synapses. J Neurophysiol. 2002;88:2501–2508. doi: 10.1152/jn.00352.2002. [DOI] [PubMed] [Google Scholar]
- Jo YH, Talmage DA, Role LW. Nicotinic receptor-mediated effects on appetite and food intake. J Neurobiol. 2002;53:618–632. doi: 10.1002/neu.10147. [DOI] [PMC free article] [PubMed] [Google Scholar]
- Jo YH, Wiedl D, Role LW. Cholinergic modulation of appetite-related synapses in mouse lateral hypothalamic slice. J Neurosci. 2005;25:11133–11144. doi: 10.1523/JNEUROSCI.3638-05.2005. [DOI] [PMC free article] [PubMed] [Google Scholar]
- Kelley AE, Berridge KC. The neuroscience of natural rewards: relevance to addictive drugs. J Neurosci. 2002;22:3306–3311. doi: 10.1523/JNEUROSCI.22-09-03306.2002. [DOI] [PMC free article] [PubMed] [Google Scholar]
- Kim J, Alger BE. Inhibition of cyclooxygenase-2 potentiates retrograde endocannabinoid effects in hippocampus. Nat Neurosci. 2004;7:697–698. doi: 10.1038/nn1262. [DOI] [PubMed] [Google Scholar]
- Kim J, Isokawa M, Ledent C, Alger BE. Activation of muscarinic acetylcholine receptors enhances the release of endogenous cannabinoids in the hippocampus. J Neurosci. 2002;22:10182–10191. doi: 10.1523/JNEUROSCI.22-23-10182.2002. [DOI] [PMC free article] [PubMed] [Google Scholar]
- Kirkham TC, Williams CM, Fezza F, Di Marzo V. Endocannabinoid levels in rat limbic forebrain and hypothalamus in relation to fasting, feeding and satiation: stimulation of eating by 2-arachidonoyl glycerol. Br J Pharmacol. 2002;136:550–557. doi: 10.1038/sj.bjp.0704767. [DOI] [PMC free article] [PubMed] [Google Scholar]
- Kreitzer AC, Regehr WG. Cerebellar depolarization-induced suppression of inhibition is mediated by endogenous cannabinoids. J Neurosci. 2001;21:RC174. doi: 10.1523/JNEUROSCI.21-20-j0005.2001. [DOI] [PMC free article] [PubMed] [Google Scholar]
- Ladyman SR, Grattan DR. Region-specific reduction in leptin-induced phosphorylation of signal transducer and activator of transcription-3 (STAT3) in the rat hypothalamus is associated with leptin resistance during pregnancy. Endocrinology. 2004;145:3704–3711. doi: 10.1210/en.2004-0338. [DOI] [PubMed] [Google Scholar]
- Lawrence CB, Turnbull AV, Rothwell NJ. Hypothalamic control of feeding. Curr Opin Neurobiol. 1999;9:778–783. doi: 10.1016/s0959-4388(99)00032-x. [DOI] [PubMed] [Google Scholar]
- Lee JW, Swick AG, Romsos DR. Leptin constrains phospholipase C-protein kinase C-induced insulin secretion via a phosphatidylinositol 3-kinase-dependent pathway. Exp Biol Med (Maywood) 2003;228:175–182. doi: 10.1177/153537020322800207. [DOI] [PubMed] [Google Scholar]
- Maccarrone M, Di Rienzo M, Finazzi-Agro A, Rossi A. Leptin activates the anandamide hydrolase promoter in human T lymphocytes through STAT3. J Biol Chem. 2003;278:13318–13324. doi: 10.1074/jbc.M211248200. [DOI] [PubMed] [Google Scholar]
- Maejima T, Hashimoto K, Yoshida T, Aiba A, Kano M. Presynaptic inhibition caused by retrograde signal from metabotropic glutamate to cannabinoid receptors. Neuron. 2001;31:463–475. doi: 10.1016/s0896-6273(01)00375-0. [DOI] [PubMed] [Google Scholar]
- Moldrich G, Wenger T. Localization of the CB1 cannabinoid receptor in the rat brain. An immunohistochemical study. Peptides. 2000;21:1735–1742. doi: 10.1016/s0196-9781(00)00324-7. [DOI] [PubMed] [Google Scholar]
- Ohno-Shosaku T, Shosaku J, Tsubokawa H, Kano M. Cooperative endocannabinoid production by neuronal depolarization and group I metabotropic glutamate receptor activation. Eur J Neurosci. 2002;15:953–961. doi: 10.1046/j.1460-9568.2002.01929.x. [DOI] [PubMed] [Google Scholar]
- Ohno-Shosaku T, Matsui M, Fukudome Y, Shosaku J, Tsubokawa H, Taketo MM, Manabe T, Kano M. Postsynaptic M1 and M3 receptors are responsible for the muscarinic enhancement of retrograde endocannabinoid signalling in the hippocampus. Eur J Neurosci. 2003;18:109–116. doi: 10.1046/j.1460-9568.2003.02732.x. [DOI] [PubMed] [Google Scholar]
- Piomelli D. The molecular logic of endocannabinoid signalling. Nat Rev Neurosci. 2003;4:873–884. doi: 10.1038/nrn1247. [DOI] [PubMed] [Google Scholar]
- Ravinet Trillou C, Arnone M, Delgorge C, Gonalons N, Keane P, Maffrand JP, Soubrie P. Anti-obesity effect of SR141716, a CB1 receptor antagonist, in diet-induced obese mice. Am J Physiol Regul Integr Comp Physiol. 2003;284:R345–R353. doi: 10.1152/ajpregu.00545.2002. [DOI] [PubMed] [Google Scholar]
- Ronesi J, Gerdeman GL, Lovinger DM. Disruption of endocannabinoid release and striatal long-term depression by postsynaptic blockade of endocannabinoid membrane transport. J Neurosci. 2004;24:1673–1679. doi: 10.1523/JNEUROSCI.5214-03.2004. [DOI] [PMC free article] [PubMed] [Google Scholar]
- Sakurai T, Amemiya A, Ishii M, Matsuzaki I, Chemelli RM, Tanaka H, Williams SC, Richarson JA, Kozlowski GP, Wilson S, et al. Orexins and orexin receptors: A family of hypothalamic neuropeptides and G protein-coupled receptors that regulate feeding behavior. Cell. 1998;92:1 page following 696. doi: 10.1016/s0092-8674(02)09256-5. [DOI] [PubMed] [Google Scholar]
- Sawchenko PE. Toward a new neurobiology of energy balance, appetite, and obesity: the anatomists weigh in. J Comp Neurol. 1998;402:435–441. [PubMed] [Google Scholar]
- Schlicker E, Kathmann M. Modulation of transmitter release via presynaptic cannabinoid receptors. Trends Pharmacol Sci. 2001;22:565–572. doi: 10.1016/s0165-6147(00)01805-8. [DOI] [PubMed] [Google Scholar]
- Schwartz MW, Woods SC, Porte D, Jr, Seeley RJ, Baskin DG. Central nervous system control of food intake. Nature. 2000;404:661–671. doi: 10.1038/35007534. [DOI] [PubMed] [Google Scholar]
- Simiand J, Keane M, Keane PE, Soubrie P. SR 141716, a CB1 cannabinoid receptor antagonist, selectively reduces sweet food intake in marmoset. Behav Pharmacol. 1998;9:179–181. [PubMed] [Google Scholar]
- Sutcliffe JG, De Lecea L. The hypocretins: setting the arousal threshold. Nat Rev Neurosci. 2002;3:339–349. doi: 10.1038/nrn808. [DOI] [PubMed] [Google Scholar]
- van den Pol AN, Acuna-Goycolea C, Clark KR, Ghosh PK. Physiological properties of hypothalamic MCH neurons identified with selective expression of reporter gene after recombinant virus infection. Neuron. 2004;42:635–652. doi: 10.1016/s0896-6273(04)00251-x. [DOI] [PubMed] [Google Scholar]
- Varma N, Carlson GC, Ledent C, Alger BE. Metabotropic glutamate receptors drive the endocannabinoid system in hippocampus. J Neurosci. 2001;21:RC188. doi: 10.1523/JNEUROSCI.21-24-j0003.2001. [DOI] [PMC free article] [PubMed] [Google Scholar]
- Williams CM, Kirkham TC. Observational analysis of feeding induced by Δ9-THC and anandamide. Physiol Behav. 2002;76:241–250. doi: 10.1016/s0031-9384(02)00725-4. [DOI] [PubMed] [Google Scholar]
- Wilson RI, Nicoll RA. Endogenous cannabinoids mediate retrograde signalling at hippocampal synapses. Nature. 2001;410:588–592. doi: 10.1038/35069076. [DOI] [PubMed] [Google Scholar]
- Wilson RI, Nicoll RA. Endocannabinoid signaling in the brain. Science. 2002;296:678–682. doi: 10.1126/science.1063545. [DOI] [PubMed] [Google Scholar]