A micromachined device provides a new bend on fibroblast traction forces (original) (raw)
Abstract
We have measured the traction forces generated by fibroblasts using a novel micromachined device that is capable of determining the subcellular forces generated by individual adhesive contacts. The front of migrating fibroblasts produced intermittent rearward forces whereas the tail produced larger forward directed forces. None of the forces were steady; they all had periodic fluctuations. The transition between forward and rearward traction forces occurred at the nucleus, not at the rear of the cell or the border between the endoplasm and the ectoplasm. We propose that the coupling of lamella extensions to fluctuating rearward tractions in front of the nuclear region move the front of a fibroblast forward, while force-facilitated release of rear adhesive contacts and anterior-directed tractions allow the region behind the nucleus to advance.
Migrating cells exert forces against the substrate to move forward. These forces or tractions (in units of force/unit area) are part of the contraction phase of migration in which the rear of the cell is detached from the substrate and the body of the cell is moved forward. On the dorsal surface of the cell it has been shown that the tractions in the front of the cell are oriented rearward through the retrograde movement of actin (1) and beads placed on the cell surface (2). These rearward-directed forces in the front of the fibroblasts work against forward-directed forces at the rear of the cell. The opposing forces act together to move the cell body forward through a contraction of the cytoplasm.
Work by other investigators has examined the direction and the magnitude of whole cell forces exerted against the substrate by a variety of cell types. In general, the largest forces are exerted along the long axis of the cell. For example, fibroblasts exert the greatest forces parallel to the direction of migration, which is along the long axis of the cell. Keratocytes also exert the largest forces along their long axis, but in these cells the long axis is perpendicular to the direction of migration (3, 4). The magnitude of the forces generated by fibroblasts is larger than that produced by keratocytes, perhaps since slower moving cells exert larger tractions than faster moving cells (ref. 5; for a review, see ref. 6). These studies have used deformable substrata to describe the magnitude and the direction of the forces generated by the entire cell; however, they do not distinguish between different models for contraction. To do this we must measure dynamic subcellular tractions without the influence of other regions of the cell.
This paper describes the development and the use of a novel micromachined device to measure the tractions generated by a few adhesive contacts in a small subcellular area. This technical advance allows us to make dynamic measurements of subcellular tractions, allowing us to distinguish between different models for forward movement of the cell body, and determine whether the tractions applied to the ventral adhesive contacts are similar to those applied to dorsal contacts.
MATERIALS AND METHODS
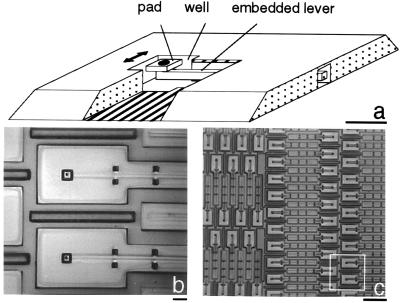
The new device can continuously monitor forces exerted on adhesive contacts. A cell can locomote over one of the 5,904 pads, ranging in area from 4 to 25 μm2, which make up the surface of the device. Each pad rests on a pedestal at the free end of one of the cantilever levers of various lengths that are buried beneath the surface (Fig. 1). A square hole around each pad provides a 2-μm space on each side of the pad that allows the lever to move when a cell pulls on the pad (Fig. 1a). Cells contact the pads, not the hidden levers, and cells have never been observed to enter the gaps around the pads. The forces that the cells exert on the pads can be determined by measuring the displacement of the pads and calculating the product of the pad displacement and the stiffness of the cantilever lever.
Figure 1.
Different magnifications of the micromachined substrate. (a) A cut-away drawing showing the lever, the pad, and the well. (Bar = 10 μm.) (b) The two largest pads. (Bar = 10 μm.) (c) The 0.18-mm beams. (Bar = 1 mm.) Only the 0.18-mm-long beam was used to measure traction forces in this study. The white square indicates the region of this photo that is presented in b.
The cantilevers are made according to standard micromachining procedures with the exception of the pads on the ends of the beams and the covering of the beams beneath the surface. The techniques used to manufacture the device are described in detail elsewhere (7). Briefly, phosphosilicate glass (PSG) is placed on a silicon wafer and holes are lithographically patterned and etched into the PSG to form anchors for the beams. Polycrystalline silicon is deposited over the PSG and etched to form the pattern of the beams. A layer of spin-on-glass is added, and a small hole is placed at what will be the free end of the beam. The surface is then coated with a plasma-deposited amorphous silicon that fills the hole and forms the pedestal that anchors the pad to the beam. The top layer is etched to form the pad and the cut-out, and the entire assembly is released with hydrofluoric acid.
The stiffness of the levers was determined using glass microneedles that were calibrated by measuring the deflection of the needle tip under the weight of various lengths of 25-μm-diameter chromel wire. The technique was also used to calibrate an 8-mm length of chromel wire, and the value obtained for the wire stiffness agreed with the stiffness determined by other investigators within 1% (8). The stiffness of the micromachined beams was then determined by pushing the calibrated needle against the beam and measuring the relative displacement. This resulted in a stiffness of 75.8 ± 11.4 nN/mm (mean ± SD, 41 trials on 6 beams) for the 0.18-mm beams used in this study.
Chicken embryo fibroblasts (CEFs) from passages 1–3 were used in these experiments. Cells were isolated (9) and grown in phenol-red-free DMEM supplemented with 100 units/ml penicillin, 100 μg/ml streptomycin, 10% fetal calf serum, and 20 mM Hepes. Prior to the experiment, cells were trypsinized and allowed to settle onto substrates that had been coated overnight with 20 μg/ml laminin. After 30 min, the substrate was placed in a small chamber and mounted onto a Zeiss Axiovert microscope equipped with a programmable motorized stage that was temperature controlled to 37°C. The substrate and the cells were visualized with polarized reflection optics using red light (>640 nm) for illumination. Cells near pads were noted, and a computer program controlled the stage to cycle through these locations, returning to each cell every minute. The experiment was recorded on S-VHS tape, and individual frames were captured with a Scion LG-3 frame grabber in a Macintosh Power PC 7100. The images were density sliced, and the centroids of the pad and the surrounding well were calculated with NIH image 1.60 (developed at the National Institutes of Health and available by anonymous FTP from zippy.nimh.nih.gov). The centroid of the well was subtracted from the centroid of the pad to determine pad displacement and eliminate any contribution to displacement from drift in stage position between sampling cycles. By tracking the position of a pad that was not in contact with a cell and therefore not moving, the typical resolution of this technique was determined to be 0.02 μm.
The displacement of the pad was multiplied by the stiffness of the lever to calculate the traction force. Because the beam can only move along one axis, the force calculated from the pad displacement is attenuated if the cell crosses the beam at any angle other than 90°; therefore, the force generated by the cell was calculated as the force determined from pad position divided by the sine of the angle that the cell made with the beam (Fig. 2a). This assumption was based on work by Harris et al. (10), which demonstrated that the tractions generated by fibroblasts are directed along the long axis of cell, parallel to the direction of migration. Fibroblast traction forces are perpendicular to the greatest forces generated by keratocytes (4), and our traction measurements concur with those observations. Fibroblasts generate the largest tractions when they cross the beam orthogonally and keratocytes generate the largest traction force when their pincer regions cross the pad parallel to the beam.
Figure 2.
Force calculations and measurement noise. (a) A force vector diagram explaining the calculation of the maximum force generated by the cell by dividing the measured force by the sine of the angle the cell makes with the beam. Note that when a broad lamella crosses the beam, the angle perpendicular to the leading edge that crosses the pad is used. (b) A typical trace showing fluctuations in force and the level of measurement noise. Measurement noise was calculated as apparent movement of the beam along its long axis. Fluctuations in force are several-fold greater than measurement noise.
The centroid of the pad should not move along the direction of the beam, and any change in position along this axis was considered to be measurement noise. Fig. 2b illustrates the level of measurement noise and the time-dependent variations in force for a typical experiment. Some of the variations in force were large and sustained; if they were 2-fold greater than the measurement noise, then we defined them as a physiological fluctuation. To ensure that the fluctuations were not a sampling artifact, a number of experiments were performed with the sampling rate of the pad position increased from 1 time per minute to 2 or 4 times each minute. Because the duration of the fluctuations did not decrease with increased sampling, we believe the fluctuations are not due to undersampling the dynamic traction force generated by fibroblasts.
For fluorescent staining of integrin, myosin, or F-actin distribution, cells were fixed in 1% paraformaldehyde in PHEM buffer (11) for 10 min and permeabilized for 1.5 min with 0.5% Triton X-100 in PHEM (F-actin and myosin stains). Nonspecific binding was blocked with a mixture of 0.5% BSA, 0.5% fish skin gelatin, and 1% normal goat serum in PHEM with 0.05 M glycine (PHEM-gly). Cells were stained with primary antibody, incubated with secondary antibody, and mounted with an anti-fade solution of 4% _n_-propyl gallate in a buffer composed of 90% glycerol and 10% PHEM (pH 7.8). Extensive rinsing was performed between each step. The ES66 antibody to beta 1 integrin was produced by hybridomas provided by Ken Yamada (National Institutes of Health), the myosin antibody was provided by Dan Kiehart (Duke University, Durham, NC), and the rhodamine phalloidin was purchased from Molecular Probes. Images were collected with IP Lab version 2.4.1 (Signal Analytics, Vienna, VA) using a Star 1 cooled charge-couple device (CCD) camera (Photometrics, Tucson, AZ) and a ×40 1.3 NA objective on a Zeiss Axiophot.
RESULTS
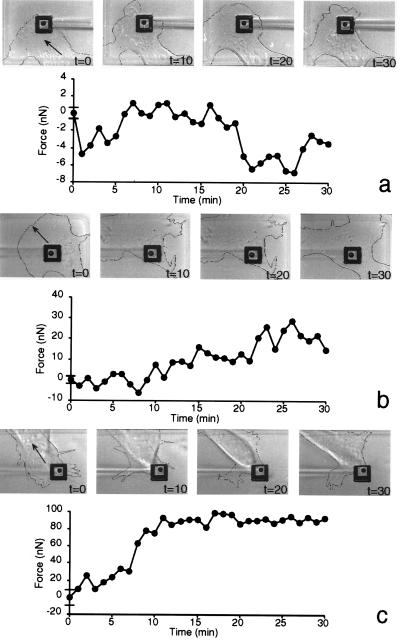
CEF cells grow on the micromachined substrate; they spread with ruffling lamella, have visible organelle transport, migrate, and apply forces to the pads. For this analysis, we have divided the cells into five distinct regions, the lamella (ectoplasm), the front-endoplasm (differentiated from ectoplasm by the presence of many vesicular structures and microtubules), the nuclear region, the rear-endoplasm, and the tail. As different regions of the cells cross the pad, a record of the force patterns for each region of the cell is generated. The force that the lamellipodium of the cell applies against the pad produces very small fluctuations in the pad position (Fig. 3a). At a distance of ≈10 μm behind the leading edge, where the lamella begins, these forces are large enough to be measured with the 0.18-mm beams. The force increases ≈2-fold at the border of the ectoplasm and the microtubule-rich endoplasm, and it is always oriented opposite to the direction of cell extension, even in nonmigrating cells that are spreading. As the nuclear region of a cell crosses the pad (t > 10 min, Fig. 3b), the force increases to a value that is 5-fold greater than the lamellar force. Larger fluctuations in the magnitude of the force, ≈10 nN, occur under this region of the cell (t > 20 min, Fig. 3b). After the nucleus has crossed the lever, the rear-ectoplasm of the cell is over the pad, and the force is oriented along the direction of cell migration (Fig. 3c). The force under the tail is also unsteady; however, the fluctuations are still about 10 nN even though the force is very large. The maximum force under the tail region is ≈10-fold greater than the maximum force generated under the lamella region.
Figure 3.
Regional variations in traction forces generated by CEFs migrating on 5-μm pads. Positive forces are oriented with the direction of cell motion, and negative forces are oriented opposite the direction of cell motion. The bars on the ordinate axis indicate the standard deviation of the measurement noise. (a) A series of images of the front leading edge and lamella of a fibroblast moving across a pad on the micromachined silicon substrate displayed at 10-min intervals. The contour of the cell has been outlined for better contrast. (b) Micrographs and traction force generated by the ectoplasm and nuclear region of a fibroblast. (c) Micrographs and traction force generated by the tail region of a fibroblast.
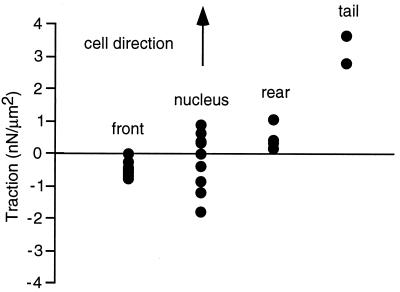
To define the direction and the magnitude of the force generated by different regions of the cell, we quantified the maximum traction (force/cross-sectional area of the pad) generated under each of four different regions of the cell (Fig. 4). Because all of the regions of a given cell did not cross the pad during every experiment, the maximum force generated by each cell was determined and grouped according to the region of the cell that generated this force. The forces were normalized by the cross-sectional area of the pad because two different size pads were used in these experiments. The tractions were denoted as positive if they were oriented with the direction of cell migration, and negative if they were oriented opposite to the direction of migration. The maximum tractions generated by the front of the cell are all oriented opposite to the direction of migration, whereas those generated by the rear and the tail are oriented with the direction of cell migration. The maximum traction generated under the nuclear region is variable, and it is oriented either with or against the direction of migration. This indicates that the nuclear region is the transition region between forward and rearward pulling.
Figure 4.
The maximum tractions in different regions of the cells are calculated and plotted according to the sign convention discussed in the text. Tractions generated by the front of the cell are opposite the direction of migration (−0.87 ± 0.43 nN/μm2, mean ± SD, n = 10). The maximum tractions oriented opposite to (−1.50 ± 0.75 nN/μm2, n = 4) and with (0.79 ± 0.41 nN/μm2, n = 5) the direction of cell migration were recorded under the nuclear region of the cell. The tractions under the rear (0.99 ± 0.47 nN/μm2, n = 4) and tail (3.91 ± 1.37 nN/μm2, n = 2) of the cell are oriented in the same direction as cell movement.
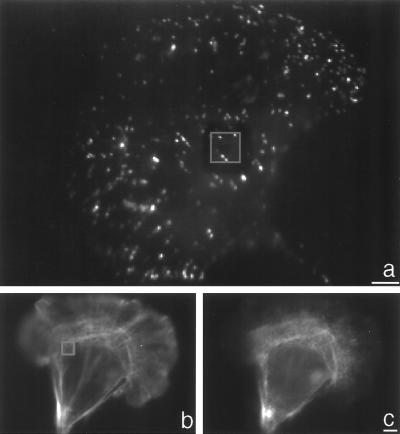
Because the force exerted by the cell against the pad is not steady, we characterized the time dependence of the fluctuations in the traction force. Fluctuation events that were 2-fold greater than measurement noise occurred in 43% of the cells analyzed. These events occurred most frequently under the nucleus (61%) and had an average duration of 3.2 ± 1.6 min (mean ± SD, n = 33). Immunofluorescent labeling of β-1 integrin on cells over pads (Fig. 5a) indicates that these forces are generated by a small number of adhesive contacts, 0.54 ± 0.53 contacts/μm2 (mean ± SD, n = 14) acting on the surfaces of the pads. We have used these data to estimate that the force generated by a single adhesive contact is ≈3 nN.
Figure 5.
Immunofluorescent images of integrin and actin-myosin distribution in CEFs on micromachined devices. (a) CEF plated on a laminin coated micromachined substrate and stained for anti-β-1 integrin. The image was taken at the plane where the pad was in focus. The pad “bleeds through” the fluorescent image and is enclosed in a gray square. Only a few punctate spots are present over the pad. (Bar = 5 μm.) (b) CEF plated on a laminin-coated micromachined substrate and stained for F-actin. A reflection image of the substrate has been added to the image to indicate the position of the pad in the upper left hand corner of the cell. The pad has also been enclosed by a gray square. (c) Nonmuscle myosin image of the same cell taken at the same plane of focus as b. Myosin is organized into ribbon-like structures in the front of the cell, is absent from the perinuclear region, and is present in the rear of the cell. (Bar = 5 μm.)
To determine how the distribution of actin and myosin correlate with the regional mapping of traction forces, CEF cells grown on the substrate were fluorescently labeled for F-actin and myosin (Fig. 5 b and c). The ribbon-like myosin structures proposed to be involved in F-actin contraction (12) are present, and the organization of the structures increases dramatically at a distance of ≈10 μm behind the leading edge, concomitant with the location where traction force increases. Myosin and F-actin are largely absent from the nuclear region, but myosin is particularly concentrated around the nucleus. This distribution is consistent with a contraction occurring between the front and the rear of the cell.
DISCUSSION
We have developed a novel force-measuring device that measures subcellular tractions by allowing small regions of fibroblasts to apply forces to calibrated micromachined levers. Using this device, we have quantified the force generated by a small number of ventral adhesive contacts, and this advance in technology has demonstrated that the force is not continuous. We have seen that the front of the cell generates initially weak, unsteady rearward directed tractions, and that the tractions become stronger but more discontinuous under the nucleus where they change direction. In the tail region of the cell, much larger forward directed tractions are present, but the oscillations still have the same magnitude. The tractions measured by the new device (0.2–4 nN/μm2) are larger than the rearward tractions on the dorsal surface (0.001 nN/μm2) (13), but they are comparable to previous measures of fibroblast ventral forces (10 nN per μm of cell length) (10). The differences between the dorsal and ventral tractions may be related to the reported differences between the actin organization and the speed and trajectories of beads (14) on the two surfaces. Our unpublished observations also indicate that the device measures tractions of keratocytes which are of the same order of magnitude as those obtained by others (3).
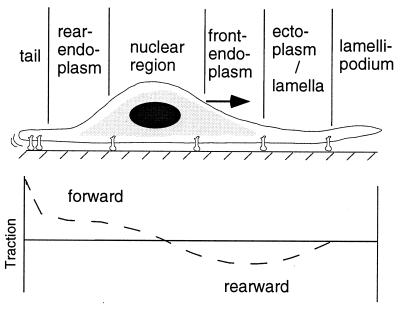
From the traction forces measured by the micromachined substrate, we can understand how the periodic movements of the cell and the organization of its attachments to the substrate influence force production and migration (Fig. 6). The ruffling lamellipodia are not involved in the production of traction force; they are used by the cell for extension and can lift off the substrate (15, 16). Rearward tractions begin at the lamella, ≈5–25 μm behind the leading edge (10)—the region where attachments to the substrate form (17) and myosin organization increases. These rearward tractions change direction at the nucleus, not at the endoplasm/ectoplasm border; they are approximately equal to the forward directed tractions in the rear (Fig. 4), but they are much smaller than the tractions in the tail. Because the forward forces are balanced by the rearward forces (less than 0.2 pN is dissipated as fluid drag), there must be an asymmetry in the adhesion process for forward migration to occur (18) This asymmetry could be due to the smaller area of the tail producing larger tractions that act on fewer contacts when compared with the front and the greater cytoskeletal–integrin connections in the front compared with the rear of the cell (19). Moreover, the sharp decrease in tractions as individual adhesive contacts detach (7) suggests that the cluster of integrins under the tail (20) is under significant tension. The contraction of the cell eventually rips the tail from the substrate and the forward tractions draw the rear toward the front of the cell (17).
Figure 6.
Traction distribution in fibroblasts as measured by the micromachined measuring device. Tractions are negative, indicating that they are against the direction of migration, in the front of the cell, and they increase at the endoplasm/ectoplasm border. Tractions change direction at the nucleus, and in the rear they are positive, indicating that they are along the direction of migration. Large tractions can be generated at the tail region.
The mechanism used to generate the contraction needed for forward movement of the cell body might be accomplished through one of the following models: cortical tension (21), muscle-like contraction of bundles of actin filaments with alternating polarity, or myosin contraction along centripetally oriented ventral actin bundles (22). The first model, cortical tension, would move the cell body forward by increasing actin–myosin contractions toward the rear of the cell and causing the cortical tension in the rear of the cell to increase to the point of breaking substrate bonds and propel the cell forward. This model suggests that the retrograde traction in the front of the cell would increase in magnitude toward the rear of the cell, and it would only change direction at the very posterior end of the cell. We have shown that the change in direction of tractions is under the nuclear region, suggesting that cortical tension is not the predominant mechanism for forward movement of the fibroblast cell body. The second model, a muscle-like contraction, would use myosin to contract filaments of alternating polarity within an actin bundle. This model proposes that the contraction of the bundle can move the cell body forward, suggesting that the rear of the cell would only exert a forward traction during contraction. However, our results indicate that the rear continuously exerts forward force. Moreover, it has recently been demonstrated that the majority of actin filaments in the ventral bundles of locomoting fibroblasts do not have an alternating polarity, instead they have a graded polarity, with barbed ends oriented outward at the anterior and posterior regions and a mixed polarity in the cell center where they may overlap (23). This suggests that the third model, a radial myosin transport mechanism, may be involved (23). The directional change in the tractions determined by the micromachined device are consistent with myosin movement on centripetally oriented ventral filaments to generate tractions, but the fluctuations that we measured in the force indicate that the movement is not a continuous and smooth treadmill. The fluctuations are the order of 10 nN and are equivalent to the force generated by 2000 myosins. In addition, the frequency of fluctuations increases under the nuclear region where the ventral filaments have mixed polarity.
To explain the discrete force pattern, we suggest that the periodic rearward-directed ventral forces in the broad lamellar region of the cell are continuously opposed by the forward- directed forces in the rear, and both of these forces are generated by myosin acting against the ventral filaments. For forward movement to occur, the tail contacts must be preferentially released. The observed decrease in integrin attachment to the cytoskeleton and the large tractions at the tail suggest that such a biased dissociation of the cell from the substrate contacts at the rear exists. Thus, the force for breaking of cell-substrate contacts contributes to migration, and there is a rapid decrease in force when individual contacts appear to be disrupted (7).
Using a new micromachined device, we have been able to determine subcellular ventral tractions as a function of time and compare them to dorsal measurements. These data lead us to propose that fibroblasts move by continual generation of new adhesive contacts in the front and mechanical release of contacts in the rear where the integrin–cytoskeletal linkages are weaker (19).
Acknowledgments
The staff at MCNC was instrumental in fabricating the micromachined device, in particular Dave Koester, Vijay Dhuler, Richard Faire, Scott Goodwin-Johansson, and Karen Markus. We thank Harold Errikson, Dan Felsenfeld, Jim Galbraith, Meg Titus, Kwan Wong, and members of the Sheetz Lab for comments on the work and the manuscript. We also thank Bruce Nicklas, members of his lab, Dahong Zhang and Suzy Ward, and Fred Siedenburg of Sutter Instruments for their assistance in calibration of the levers. Funding was provided by MCNC, a National Institutes of Health grant (M.P.S.), and the Whitaker Foundation (Duke Center for Cellular and Biosurface Engineering).
Footnotes
This paper was submitted directly (Track II) to the Proceedings Office.
Abbreviation: CEF, chicken embryo fibroblast.
References
- 1.Wang Y-L. J Cell Biol. 1985;101:597–602. doi: 10.1083/jcb.101.2.597. [DOI] [PMC free article] [PubMed] [Google Scholar]
- 2.Abercrombie M, Heaysman J, Pegrum S. Exp Cell Res. 1970;62:389–398. doi: 10.1016/0014-4827(70)90570-7. [DOI] [PubMed] [Google Scholar]
- 3.Lee J, Leonard M, Oliver T, Ishihara A, Jacobson K. J Cell Biol. 1994;127:1957–1964. doi: 10.1083/jcb.127.6.1957. [DOI] [PMC free article] [PubMed] [Google Scholar]
- 4.Oliver T, Dembo M, Jacobson K. Cell Motil Cytoskeleton. 1995;31:225–240. doi: 10.1002/cm.970310306. [DOI] [PubMed] [Google Scholar]
- 5.Harris A, Stopak D, Wild P. Nature (London) 1981;290:249–251. doi: 10.1038/290249a0. [DOI] [PubMed] [Google Scholar]
- 6.Oliver T, Lee J, Jacobson K. Semin Cell Biol. 1994;5:139–147. doi: 10.1006/scel.1994.1018. [DOI] [PubMed] [Google Scholar]
- 7.Galbraith C, Sheetz M. In: Optic, Electronic, and High Precision Measuring Techniques in Cell Biology. Isenberg G, editor. Heidelberg: Springer; 1997. , in press. [Google Scholar]
- 8.Dennerll T, Joshi H, Steel V, Buxbaum R, Heidemann S. J Cell Biol. 1988;107:665–674. doi: 10.1083/jcb.107.2.665. [DOI] [PMC free article] [PubMed] [Google Scholar]
- 9.Kelly P, Schlesinger M. Cell. 1978;15:1277–1286. doi: 10.1016/0092-8674(78)90053-3. [DOI] [PubMed] [Google Scholar]
- 10.Harris A, Wild P, Stopak D. Science. 1980;208:117–118. doi: 10.1126/science.6987736. [DOI] [PubMed] [Google Scholar]
- 11.Schliwa M, Van Blerkom J. J Cell Biol. 1981;90:222–235. doi: 10.1083/jcb.90.1.222. [DOI] [PMC free article] [PubMed] [Google Scholar]
- 12.Verkhovsky A, Svitkina T, Borisy G. J Cell Biol. 1995;131:989–1002. doi: 10.1083/jcb.131.4.989. [DOI] [PMC free article] [PubMed] [Google Scholar]
- 13.Felder S, Elson E. J Cell Biol. 1990;111:2513–2526. doi: 10.1083/jcb.111.6.2513. [DOI] [PMC free article] [PubMed] [Google Scholar]
- 14.Harris A, Dunn G. Exp Cell Res. 1972;73:519–523. doi: 10.1016/0014-4827(72)90084-5. [DOI] [PubMed] [Google Scholar]
- 15.Ingram V. Nature (London) 1969;222:641–644. doi: 10.1038/222641a0. [DOI] [PubMed] [Google Scholar]
- 16.Abercrombie M, Heaysman J, Pegrum S. Exp Cell Res. 1970;59:393–398. doi: 10.1016/0014-4827(70)90646-4. [DOI] [PubMed] [Google Scholar]
- 17.Chen W. J Cell Biol. 1981;90:187–200. doi: 10.1083/jcb.90.1.187. [DOI] [PMC free article] [PubMed] [Google Scholar]
- 18.DiMilla P, Barbee K, Lauffenburger D. Biophys J. 1991;60:15–37. doi: 10.1016/S0006-3495(91)82027-6. [DOI] [PMC free article] [PubMed] [Google Scholar]
- 19.Schmidt C, Horwitz A, Lauffenburger D, Sheetz M. J Cell Biol. 1993;123:977–991. doi: 10.1083/jcb.123.4.977. [DOI] [PMC free article] [PubMed] [Google Scholar]
- 20.Regen C, Horwitz A. J Cell Biol. 1992;119:1347–1359. doi: 10.1083/jcb.119.5.1347. [DOI] [PMC free article] [PubMed] [Google Scholar]
- 21.Bray D, White J. Science. 1988;239:883–888. doi: 10.1126/science.3277283. [DOI] [PubMed] [Google Scholar]
- 22.Mitchison T, Cramer L. Cell. 1996;84:371–379. doi: 10.1016/s0092-8674(00)81281-7. [DOI] [PubMed] [Google Scholar]
- 23.Cramer L, Siebert M, Mitchison T. J Cell Biol. 1997;136:1287–1305. doi: 10.1083/jcb.136.6.1287. [DOI] [PMC free article] [PubMed] [Google Scholar]
