Estimation of Pairwise Identity by Descent From Dense Genetic Marker Data in a Population Sample of Haplotypes (original) (raw)
Abstract
I present a new approach for calculating probabilities of identity by descent for pairs of haplotypes. The approach is based on a joint hidden Markov model for haplotype frequencies and identity by descent (IBD). This model allows for linkage disequilibrium, and the method can be applied to very dense marker data. The method has high power for detecting IBD tracts of genetic length of 1 cM, with the use of sufficiently dense markers. This enables detection of pairwise IBD between haplotypes from individuals whose most recent common ancestor lived up to 50 generations ago.
TWO haplotypes are identical by descent (IBD) if both copies were inherited from a shared common ancestor. In studies of related individuals, the ancestors are members of the known pedigree. However, in a population sample, genealogical information is not usually known, yet all individuals are related to each other, if only distantly. Tracts of IBD between individuals from a population sample will tend to be shorter than tracts of IBD in closely related individuals.
Except for the possibility of recurrent mutation, all identical alleles are technically IBD. This article, however, focuses only on tracts of IBD due to relatively recent shared ancestry (such as <100 generations). Chapman and Thompson (2003) show that even after 100 generations of random mating in a growing population, IBD tracts will have an average length of 0.6 cM. Thus, for the remainder of the article, IBD implies extended tracts, covering multiple markers, of shared material inherited from a common ancestor.
Recent technological advances have now made it cost effective to genotype high-density markers on a large scale. This provides the potential of detecting IBD tracts that are much shorter than those that could be detected previously. To maximize ability to detect such tracts, it is important to use appropriate statistical tools.
Some existing methods are based on the observed extent of tracts of allele sharing (Houwen et al. 1994; Te Meerman et al. 1995; Nelson et al. 2006; Miyazawa et al. 2007). This is somewhat inefficient, as information on haplotype frequencies is being ignored. Studies of extended homozygosity demonstrate the existence of extended common haplotypes (Curtis et al. 2008). Thus, unless haplotype frequency is taken into account, the rate of false-positive detection of IBD will be unnecessarily high.
Existing probabilistic methods (Leutenegger et al. 2003; Purcell et al. 2007) are based on hidden Markov models (HMMs) that incorporate dependence in IBD between neighboring locations but that assume independence between genotypes across markers (i.e., linkage equilibrium). This approach is very suitable for low-density genetic markers, but cannot properly utilize the information in dense marker data. Such methods will tend to overestimate IBD sharing if applied directly to dense data with high levels of linkage disequilibrium (LD). One strategy for circumventing this problem is to prune markers to reduce LD (Purcell et al. 2007); however, this also reduces the amount of information in the data and thus decreases power to detect tracts of IBD.
In this article, I present an approach for IBD detection that is probabilistic and accounts for LD in arbitrarily dense markers. The proposed HMM incorporates both dependence in IBD status through a Markov model for the IBD process and dependence in genotypes (i.e., LD) through modeling of haplotype frequencies. This approach enables detection of IBD tracts of length ≤1 cM. The current implementation of the method is restricted to known haplotypes, but I discuss future extension to unphased genotype data.
The central application of this work is to IBD mapping, in which an excess of IBD sharing between case individuals indicates the presence of disease susceptibility variants (Houwen et al. 1994; Te Meerman et al. 1995). IBD mapping has potential for mapping genes or genomic regions containing multiple rare disease-susceptibility variants (Purcell et al. 2007; International HapMap Consortium 2007). IBD mapping is also powerful for detecting founder effects in isolated populations (Te Meerman et al. 1995; Nelson et al. 2006). Traditional association testing relies on LD between a single marker or a haplotype block and the causal variant(s). However, for recent or rare disease variants the IBD tracts will extend over many markers in a dense marker panel, so that testing only a single marker or haplotype block will miss much of the available information.
There are several approaches to using estimated IBD tracts in IBD mapping of disease-associated genes. So-called population-based linkage analysis (Purcell et al. 2007) tests for correlation between IBD sharing and phenotypic sharing. One straightforward approach is to look for unusually long tracts of IBD between pairs or groups of case individuals (Houwen et al. 1994; Te Meerman et al. 1995; Nelson et al. 2006). Haplotype sharing and similarity-based methods (Van Der Meulen and Te Meerman 1997; McPeek and Strahs 1999; Tzeng et al. 2003; Beckmann et al. 2005; Wessel and Schork 2006) are additional approaches to IBD mapping.
METHODS
To decide whether two identical haplotypes are likely to be IBD, or are merely identical by state, it is necessary to assign a population frequency to the observed haplotype. Shared haplotypes with high frequency are probably not IBD (in the sense of having common ancestry within 500–1000 generations), while those with very low frequency are most likely IBD. To avoid false-positive results, a very low threshold for the frequency of the shared haplotype is required to be sure of IBD. It is not feasible to estimate such frequencies directly from a population sample, as the sample will not be large enough to give an accurate estimate of a very small frequency. Instead, one needs to use a model for haplotype frequencies, and the model must incorporate LD. An appropriate model is the localized haplotype cluster model that has been used for haplotype phase inference (S. R. Browning and B. L. Browning 2007), which can be fit quickly using a heuristic algorithm. The hidden Markov model underlying the localized haplotype cluster method may be extended to include IBD status, and it is then possible to obtain posterior probabilities of IBD.
IBD prior probabilities:
The proposed method requires the specification of a prior IBD model. To make the computations tractable, only a two-state Markov model is considered. The two states are IBD and non-IBD. It is assumed that IBD and non-IBD tracts have lengths drawn from exponential distributions. Thus, the model has two parameters: the expected length of an IBD tract, and the expected length of a non-IBD tract. While this model may appear to be overly simplistic, such models have proved to be reasonable approximations for the purpose of relationship inference (McPeek and Sun 2000) and for estimating homozygosity by descent (Abney et al. 2002) and inbreeding coefficients (Leutenegger et al. 2003) and should also prove adequate in this context.
In this work, I fix the values of the parameters (expected lengths of IBD and non-IBD tracts) in advance. It would be possible to estimate these parameters, perhaps by using an iterative approach in which an initial guess of the parameter values is used to obtain estimates of IBD, which are in turn used to reestimate the parameters, but I do not attempt that here.
The choice of parameter values affects the sensitivity and specificity of the method. However, in the context of IBD mapping, one can make use of a control sample for calibration. Assuming that one does not expect to see appreciable IBD in controls, one can estimate IBD probabilities in the controls and choose a threshold on these probabilities that will give the desired rate of false-positive IBD detection. This calibration approach reduces the impact of the choice of prior.
Another approach is to choose parameter values that are reasonable in the context of a given founder population. In a rapidly growing population, most of the founding haplotypes will be retained, so the probability that two randomly chosen haplotypes are IBD now is ∼1/N, where N is the number of founding haplotypes. The ratio of expected IBD length to the sum of expected IBD length plus expected non-IBD length should equal 1/N in this case.
The Markov model is most suitable when an IBD tract is generated entirely by one path of descent. Consider, for example, IBD in half-cousins with one common grandparent but all other grandparents unrelated to each other: there is only one possible path of descent. IBD tracts generated by a single path of descent comprising m meioses have length distributed exponentially with a mean of 1/m morgans, assuming Haldane's model (Haldane 1919) (results are unlikely to be very different when considering interference, but calculations are more difficult). Thus, g generations after founding, single-path IBD tracts would have approximately exponential length distributions with a mean of 1/(2_g_) morgans.
However, for complex pedigrees with loops, it is possible to have an IBD tract made up of two or more sub-tracts with differing paths of descent, even though the IBD tract is entirely inherited from the same ancestral chromosome. Such multiple-path IBD tracts are on average longer than single-path IBD tracts and do not have exponential length distribution. Provided that the goal is to detect IBD rather than to obtain precise estimates of IBD probabilities, this is not a problem. If attention is focused on detection of single-path IBD tracts, multiple-path IBD tracts also will be detected because they are longer and thus more easily detected. From a detection point of view, the exponential length distribution assumption in the IBD model is not particularly important. For distantly related individuals, there typically will be at most one IBD tract per chromosome, and the process governing the length of that tract is essentially irrelevant, except that, if the length is too small, it will not be detected.
As an example, based on single-path IBD, consider the Maori population of New Zealand. The main Maori migration to New Zealand occurred ∼800 years ago (Sutton 1994). There were ∼190 founding woman ancestors (Whyte et al. 2005). The population reached a level of ∼115,000 before the arrival of Europeans (Kirch 1984). Suppose that there were 1000 founding ancestral haplotypes (500 individuals). The probability now of finding that two randomly chosen haplotypes are IBD would be ∼1/1000. Suppose further that there have been ∼30 generations (750 years at 25 years/generation) since the founding event. The mean length of a single-path IBD tract would be 1/60 = 1.7 cM. To obtain a per-locus IBD probability of 1/1000, it is necessary that A/(A + B) = 1/1000, where A = 1.7 cM is the expected length of IBD tracts, and B is the expected length of non-IBD tracts. Solving, one obtains B = 1698.3. Thus, for the Maori, one might model IBD tracts having an expected length of 1.7 cM and non-IBD tracts having an expected length of 1700 cM.
As a final consideration, note that for a collection of case individuals, greater-than-average IBD sharing is expected over the whole genome when the disease has some genetic basis (Voight and Pritchard 2005). The parameters could be adjusted accordingly if one knew the extent of this effect.
In summary, the arguments described above for single-path IBD tracts can be used to obtain values for the parameters of the prior Markov model for IBD probabilities. These approximate values are likely to be adequate for the purposes of IBD detection, particularly if a control sample is available for calibration of false-positive detection. On the other hand, if accurate estimate of actual IBD probabilities is desired, one could use the data to estimate these parameters. However, the simulations presented in the results show that the estimated IBD probabilities are somewhat biased, even when the correct prior model is used.
Localized haplotype cluster model:
Earlier work describes the algorithm for fitting the localized haplotype cluster model (Browning 2006; B. L. Browning and S. R. Browning 2007). The algorithm is not reproduced here, but the important properties of the model are described. Figure 1 shows a small example of a localized haplotype cluster model fit to fictional haplotype data with four single nucleotide polymorphism (SNP) markers. Figure 2 shows an alternative representation of the model from Figure 1, consistent with that given in earlier work. In Figure 2 haplotype clusters are represented by edges rather than by nodes. Figures 1 and 2 are essentially dual graphs, with edges converted to nodes and vice versa. The following descriptions refer to the representation in Figure 1, which is the more natural representation in the context of IBD probability estimation.
Figure 1.—

Example of a localized haplotype cluster model. Nodes of the graph represent haplotype clusters (labeled A–L). Solid boundaries around nodes represent allele 1 while dashed boundaries represent allele 2. The initial state is shaded gray. Transition probabilities are given on the edges.
Figure 2.—

An alternative representation of the localized haplotype cluster model in Figure 1. This representation is given solely for comparison with previous work (for example, Browning 2006). Edges of the graph represent the haplotype clusters. Solid edges represent allele 1 while dashed edges represent allele 2.
Each node of the graph corresponds to a haplotype cluster. Each haplotype cluster has an associated localization to a specific marker. Nodes in the same column in Figure 1 correspond to localization to the same marker. For example, nodes A and B correspond to marker 1, and nodes C, D, and E correspond to marker 2. Each node also has an associated allele. Also, each node transitions to one or more nodes with localization at the next marker. A node cannot transition to more than one node with the same associated allele. For example, node B could not transition to both nodes C and E, because both C and E are associated with allele 1. I refer to a node as a “localized haplotype cluster.”
Every haplotype that is present in the data used to fit the model has a path through the graph representing the model. For example, the haplotype 1122 has path ACGK in Figure 1. The path through the graph corresponding to a given haplotype is unique, because of the restriction that a node cannot transition to more than one node with the same allele label. I refer to a path through the graph as a “haplotype cluster path”; it is a sequence of localized haplotype clusters.
A crucial aspect of the model is that of merging. A merge occurs when two or more edges transition into a single node. For example, edges from nodes C and E merge into node F at marker 3 in Figure 1. Genetically, merges represent historical recombination, which breaks down LD. From a mathematical point of view, merges represent a Markov property: given that the haplotype traverses through node x localized to marker i, the alleles at markers i + 1, i + 2, … are independent of the alleles at markers 1, 2, 3, …, i − 1 (and of nodes localizing to those markers). From a computational point of view, merging ensures that the graph remains parsimonious.
The localized haplotype cluster model gives a hidden Markov model (S. R. Browning and B. L. Browning 2007). In Figure 1, each edge has a transition probability indicated. The localized haplotype cluster (node of the graph) is the hidden state. (For phase-known data, the localized haplotype cluster is not actually “hidden.” However, I retain this terminology to facilitate future extension to unphased data.) The observed data are the alleles at each marker. Emission probabilities are always 0 or 1; the cluster always emits the associated allele. (Allowing for intermediate emission probabilities could be useful in some situations, but would greatly increase the computational burden.) Thus, the model gives haplotype probabilities, which are obtained by multiplying the relevant transition probabilities. In Figure 1 an artificial initial state has been added. This initial state has a probability of 1, so no initial probabilities are needed. The probability of haplotype 1122 (equivalently haplotype cluster path ACGK) is (0.52)(0.63)(0.51)(1) = 0.167 (obtained by multiplying appropriate transition frequencies from Figure 1). For low-frequency haplotypes extending over large numbers of markers, it is not possible to obtain reasonable estimates of haplotype frequency simply by using observed (sample) frequencies; however, one can obtain useful estimates from the localized haplotype cluster model.
The localized haplotype cluster model accounts for the LD correlation structure along the haplotype in a parsimonious manner. Fitting of the model to data is computationally fast with the Beagle software package (http://www.stat.auckland.ac.nz/∼browning/beagle/beagle.html). When fitting the localized haplotype cluster model to a set of data, I assume that the haplotypes are independent. As IBD haplotypes are identical, I downweight the two haplotypes that are being investigated for IBD. Each of these two haplotypes is given weight 1/2, so that together they are equivalent to one haplotype. Failure to make this adjustment leads to IBD haplotypes appearing to have a higher population frequency than is actually the case, with a consequent decrease in power to detect IBD.
Hidden Markov model:
The overall model is composed of the two components described above. The first is the IBD model, which is a continuous 0/1 Markov process. The second is the model for haplotype probabilities, which is a localized haplotype cluster model. Combining the IBD model with two copies of the haplotype model gives a joint hidden Markov model for IBD status and a pair of haplotypes.
The state of the joint model, at a given marker position, comprises 0/1 IBD status for the pair of haplotypes and a pair of localized haplotype clusters. The form of the transition probabilities for the joint model differs depending on the IBD status of the destination state.
Let si denote the IBD status (0 for non-IBD and 1 for IBD) at position i. Let ci(1) [respectively, ci(2)] denote the localized haplotype cluster (state of the localized haplotype cluster model) at position i, for the first (respectively, second) of the haplotypes that are being compared.
If the destination state has IBD status 0 (non-IBD), the haplotype transitions are conditionally independent, so the overall transition probability is the appropriate IBD model transition probability multiplied by each of the appropriate transition probabilities for the haplotypes. For example, to transition from state ( ), with IBD status _s_1 and localized haplotype clusters
  , to state (
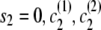 ), the transition probability is
 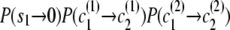 .
.
If the destination state has IBD status 1 (IBD), the two alleles at this marker must be equal. Any position at which the two alleles differ has zero probability of IBD (although I expect to relax this constraint in future work to allow for genotype error). A property of the haplotype model is that knowledge of the allele at the next marker determines the transition from the current state. Thus, when the IBD status is 1, knowing one haplotype transition (and thus the associated allele) completely determines the other transition. This complete dependence implies that only one haplotype transition probability will go into the joint model transition probability. However, the two haplotypes may have different paths through the model, due to divergence in regions of nonidentity, and may remain divergent even in regions of identity. In this case, the transition probabilities of the two haplotypes may differ, and it is not clear which transition probability to use. To solve this problem I average the two candidate probabilities. (Other options are possible. For example, one could take the minimum, or one could weight the average by the counts on the corresponding edges. However, I have not investigated these alternatives.) Thus, the overall transition probability for the joint model is the appropriate IBD model transition probability multiplied by the average of the appropriate transition probabilities for the localized haplotype clusters. For example, to transition from state ( ) to state (
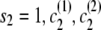 ), the transition probability is
 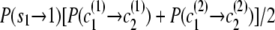 .
.
Worked example:
Consider four closely spaced markers with haplotype distribution following the localized haplotype cluster model in Figure 1. For the prior IBD model, let the rate of change from IBD to non-IBD be 1/3 per cM (thus IBD tracts have an expected length of 3 cM) and the rate of change from non-IBD to IBD be 1/3000 per cM (thus non-IBD tracts have an expected length of 3000 cM). Suppose the four markers have approximate genetic positions (relative to the first of the four markers) of 0, 0.003, 0.009, and 0.012 cM. Thus, the probability of transition to non-IBD at marker 2 from IBD at marker 1 is ∼10−3, while the probability of transition to IBD at marker 2 from non-IBD at marker 1 is ∼10−6. The transition probabilities between markers 2 and 3 are approximately twice those between markers 1 and 2, while the transition probabilities between markers 3 and 4 are the same as those between markers 1 and 2. The initial probability of IBD at the first marker is 3/3003 = 10−3. Write s for (_s_1, _s_2, _s_3, _s_4), the IBD status at each marker,  , the haplotype cluster path corresponding to the first haplotype, and similarly c(2) for the haplotype cluster path corresponding to the second haplotype.
Consider the IBD status of haplotypes 1111 and 2111. These haplotypes are clearly not IBD at the first position, but could be IBD at any of positions 2–4 (although a change in IBD status in a region this small has very low probability). The haplotype cluster paths corresponding to these two haplotypes are c(1) = ACFI and c(2) = BEFI, respectively. Recall that the haplotype cluster path always determines the haplotype, and vice versa.
As a first example, the joint probability of the haplotype pair and that these haplotypes are entirely non-IBD (s = 0000) is calculated. The two haplotypes are conditionally independent, given that they are completely non-IBD. Thus, P(s = 0000, c(1) = ACFI, c(2) = BEFI) = P(s = 0000)P(c(1) = ACFI)P(c(2) = BEFI). Now P(s = 0000) = (1 − 10−3)(1 − 10−6)(1 − 2 × 10⁻⁶)(1 − 10−6) = 0.9990, P(c(1) = ACFI) = (0.52)(0.63)(0.49)(0.19) = 0.0305, and P(c(2) = BEFI) = (0.48)(1)(0.49)(0.19) = 0.0447. Thus, P(s = 0000, c(1) = ACFI, c(2) = BEFI) = 0.0014.
Second, the probability of the haplotypes with the IBD pattern s = 0111 (non-IBD at marker 1, IBD at markers 2–4) is calculated. To do so, the problem is separated into initial and transition probabilities:
- Initial probability:
 .
. - First transition:
 .
. - Second transition:
 .
. - Third transition:
 .
.
Thus the full probability is P(s = 0111, c(1) = ACFI, c(2) = BDFI) = (0.249)(8.15 × 10⁻⁷)(0.489)(0.190) = 1.89 × 10⁻⁸.
As a final example, consider the IBD pattern s = 1100. Because the alleles of the two haplotypes at the first marker differ, the haplotypes cannot be IBD at the first position. Thus, P(s = 1100, c(1) = ACFI, c(2) = BDFI) = 0.
Calculation of IBD probabilities:
Given the HMM described above, the probabilities of joint IBD and haplotype cluster paths, P(s, c(1), c(2)), can be calculated from the posterior distribution in a computationally efficient manner using forward–backward calculation (Baum 1972; Rabiner 1989). Then, for each marker location, one can sum over states with IBD status 1 (i.e., IBD) at that location to obtain the posterior probability of IBD, P(si = 1 | c(1), c(2)). Alternatively, one can sample multiple realizations from the posterior distribution (Thompson 2000; S. R. Browning and B. L. Browning 2007). At each marker, the sample proportion of IBD realizations gives the estimated posterior probability of IBD at that position. One advantage of the sampling approach is that it enables estimation of multilocus IBD probabilities (Hill and Hernandez-Sanchez 2007). However, the sampling approach is more computationally intensive and less accurate. I used direct calculation in the results presented here.
Simulation study:
The methodology described above applies only to known haplotypes, although I plan to extend it to unphased data in future work. The basis for the simulation study is phase-known haplotypes simulated using Cosi (Schaffner et al. 2005) and phased haplotypes from the control data from the Wellcome Trust Case Control Consortium (WTCCC) study (Wellcome Trust Case Control Consortium 2007). IBD was artificially constructed in pairs of haplotypes, and then probability of IBD was estimated using the proposed methodology.
Although the natural unit of distance for IBD is genetic distance (in centimorgans), the lengths of the simulated regions were determined using physical distance (megabases) for computational convenience. Approximate genetic distances are given with the results.
Cosi version 1.1 was used with default settings to generate sets of 2000 haplotypes from a “European” population. Regions of length 1.2 Mb were generated, and, for each region, 400 markers were selected at random from those markers with minor allele frequency (MAF) of at least 5% to obtain data with an average 3-kb spacing. In addition, regions of length 3 Mb were generated, and, for each region, 100 markers were selected at random from those markers with MAF of at least 5% to obtain data with an average 30-kb spacing. On average, 1 cM corresponds to ∼1 Mb in the simulated data; however, the Cosi program simulates recombination hotspots, so the actual genetic distances vary. For the IBD analyses, I assumed that 1 Mb = 1 cM throughout.
In addition to the simulated data, 6004 phased haplotypes from the WTCCC control collection were used. The individuals were genotyped using the Affymetrix GeneChip Human Mapping 500K Array Set (Wellcome Trust Case Control Consortium 2007). Phasing of these haplotypes is described elsewhere (S. R. Browning and B. L. Browning 2007). For the purposes of this study, the estimated phase was treated as the true phase. Subsets of 300 consecutive markers were extracted from chromosome 1 and from chromosome 21, with random starting positions. The chromosome 1 data have an average marker spacing of 6 kb. The chromosome 21 data have an average marker spacing of 5 kb. The average correspondence between 1 Mb and 1 cM does not exactly hold for these chromosomes, and, in any case, the ratio varies from one region to another. However, for the IBD analysis performed here, I assumed that the 1 cM/Mb ratio holds.
For each data set, IBD was artificially created in one pair of haplotypes, and the probability of IBD was estimated at every marker for that pair of haplotypes. As a control, the analysis was also run using data in which no IBD had been created. To create IBD, the alleles in part of one haplotype were overwritten using the alleles in the corresponding part the other haplotype. The alleles outside the created IBD tracts were left unchanged. For the simulated data with 3-kb average spacing, IBD was created in the central 167 (of 400) markers or in the central 333 (of 400) markers, corresponding to an IBD length of ∼0.5 cM or ∼1 cM, respectively. For the simulated data with 30-kb average spacing, IBD was created in the central 33 (of 100) markers or in the central 67 markers, corresponding to an IBD length of ∼1 or ∼2 cM, respectively. For the WTCCC chromosome 1 data, IBD was created in the central 83 (of 300) markers or in the central 167 markers, corresponding to an IBD length of ∼0.5 or ∼1.0 cM, respectively. For the WTCCC chromosome 21 data, IBD was created in the central 100 (of 300) markers or in the central 200 (of 300) markers, corresponding to an IBD length of ∼0.5 or ∼1 cM, respectively. Twenty data sets were used for each type of data and IBD length, while 100 data sets of each type were used with no IBD for calibration of type I error.
The IBD prior model used in these analyses is based on a population somewhat older than the Maori population described above, but of approximately the same founding size. The average proportion of IBD sharing is one-thousandth, while the average IBD length is 1 cM. This model was chosen to facilitate investigation of whether IBD tracts of length ≤1 cM can be detected. Rather than make use of the genetic distances between the markers, the same transition probabilities were used between each adjacent pair of markers. Doing so may reduce the accuracy of the analysis slightly, but it suffices for this proof-of-principle study. For the simulated data with 3 kb (3 × 10⁻³ cM) spacing, the transition probabilities used for IBD status were P(si+1 = 1 | si = 0) = 3 × 10⁻⁶ and P(si+1 = 0 | si = 1) = 3 × 10⁻³. For the simulated data with 30 kb (3 × 10⁻² cM) spacing, the transition probabilities were P(si+1 = 1 | si = 0) = 3 × 10⁻⁵ and P(si+1 = 0 | si = 1) = 3 × 10⁻². For the WTCCC chromosome 1 data, the transition probabilities were P(si+1 = 1 | si = 0) = 6 × 10⁻⁶ and P(si+1 = 0 | si = 1) = 6 × 10⁻³ (on the basis of an average marker spacing of 6 × 10⁻³ cM in these data). For the WTCCC chromosome 21 data, the transition probabilities were P(si+1 = 1 | si = 0) = 5 × 10⁻⁶ and P(si+1 = 0 | si = 1) = 5 × 10⁻³ (on the basis of an average marker spacing of 5 × 10⁻³ cM).
In addition, data sets were created in which IBD lengths were randomly distributed according to the same prior IBD model used in the analysis. In theory, estimated IBD probabilities should be approximately correct in this situation. Ten simulated data sets with 400 markers having a 3-kb average spacing were used (as described above), and 200 replicates of the random IBD length generation were applied to each data set for a total of 2000 replicates. For each replicate, a pair of haplotypes was selected at random, position and length of IBD were simulated from the prior IBD model, and the appropriate IBD was created in the chosen pair of haplotypes. Thus, in some iterations no IBD would be created, while in others the entire region might be IBD, or part of the region might be IBD. To generate a high proportion of regions containing some IBD, a prior IBD model with a high average proportion of IBD was used. Between each pair of adjacent markers the IBD model has the transition probability P(si+1 = 1 | si = 0) = 0.0006 and P(si+1 = 0 | si = 1) = 0.006. Thus, one-eleventh of the genome is IBD on average, and an IBD tract has an average length of 167 markers or ∼0.5 cM. For each replicate, estimated IBD was recorded at every 10th marker position.
RESULTS
Non-IBD regions:
Table 1 and the top row of Figure 3 show estimated IBD probabilities for regions that are entirely non-IBD. For each of the four data types, 100 simulated non-IBD regions were used, and IBD probabilities were estimated at every marker position. Table 1 shows the distribution of IBD probabilities, as well as the distribution of the maximum IBD probability from each simulated region. On the basis of these results, it is appropriate to declare pairs of haplotypes with IBD probabilities >0.5 to be IBD. For the lengths of regions and marker densities considered here, this decision rule results in a false-positive rate of at most 4%.
TABLE 1.
Null distribution of IBD probabilities: proportions of estimated IBD probabilities less than specified values for non-IBD regions
| Probabilities at individual locations | Probabilities maximized over regions | |||||
|---|---|---|---|---|---|---|
| <0.01 | <0.1 | <0.5 | <0.01 | <0.1 | <0.5 | |
| 30 kb | 0.938 | 0.983 | 0.991 | 0.25 | 0.88 | 0.96 |
| 3 kb | 0.976 | 0.994 | 0.996 | 0.67 | 0.94 | 0.95 |
| Chromosome 1 | 0.991 | 0.996 | 0.997 | 0.97 | 0.99 | 0.99 |
| Chromosome 21 | 0.998 | 1.000 | 1.000 | 0.95 | 1.00 | 1.00 |
Figure 3.—

Estimated IBD probabilities. Histograms of maximum estimated IBD probabilities from each region. (Top) Results from pairs of haplotypes with no IBD. (Middle) Results from pairs of haplotypes with short tracts of IBD. (Bottom) Results from pairs of haplotypes with long tracts of IBD. The genetic lengths given are approximate.
IBD tracts:
Table 2 and the middle and bottom rows of Figure 3 show estimated IBD probabilities from the IBD tracts. Results from both estimated probabilities at each marker position and maximums over the IBD tracts are shown. Except for IBD of length 0.5 cM in data from chromosome 1, the probability of detecting IBD when using the 0.5 posterior IBD probability threshold is at least 55% for the IBD lengths considered. Ninety percent of IBD tracts of length 2 cM are detectable in 30-kb data, while 85% of IBD tracts of length 1 cM are detectable in 3-kb data. For genomic regions with 1 cM/Mb, ∼80–90% of IBD tracts of length 1 cM are detectable using data at an average spacing of 6 kb (as on the Affymetrix 500K SNP panel). Thus, there is good ability to detect IBD tracts of length 1 cM in data with 5- to 6-kb marker spacing, while in less dense data (30-kb spacing) tracts of length 2 cM are easily detected.
TABLE 2.
Power to detect IBD: proportions of estimated probabilities of IBD greater than specified values for IBD tracts
| Individual probabilities | Maximum probabilities | ||||||
|---|---|---|---|---|---|---|---|
| IBD length (cM) | >0.1 | >0.5 | >0.9 | >0.1 | >0.5 | >0.9 | |
| 30 kb | 1.0 | 0.75 | 0.52 | 0.28 | 0.80 | 0.55 | 0.35 |
| 2.0 | 0.92 | 0.81 | 0.53 | 0.95 | 0.90 | 0.65 | |
| 3 kb | 0.5 | 0.80 | 0.70 | 0.49 | 0.85 | 0.75 | 0.65 |
| 1.0 | 0.95 | 0.79 | 0.59 | 0.95 | 0.85 | 0.80 | |
| Chromosome 1 | 0.5 | 0.35 | 0.24 | 0.18 | 0.35 | 0.25 | 0.25 |
| 1.0 | 0.94 | 0.86 | 0.56 | 0.95 | 0.90 | 0.75 | |
| Chromosome 21 | 0.5 | 0.59 | 0.44 | 0.23 | 0.60 | 0.55 | 0.30 |
| 1.0 | 0.89 | 0.74 | 0.47 | 0.90 | 0.80 | 0.60 |
Accuracy of estimated IBD probabilities:
Figure 4 shows the distribution of estimated IBD probabilities for the data at 3-kb spacing with randomly distributed IBD lengths (mean IBD length 0.5 cM and one-eleventh of the genome IBD). Estimation of IBD probabilities was performed using the same prior as was used to generate the IBD data. Note that estimated probabilities are shown for all positions, including non-IBD positions that are near the boundary of IBD tracts (these are included in the non-IBD histogram). Some of the IBD tracts may be quite short; thus it is not surprising to see low estimated IBD probabilities for many IBD positions.
Figure 4.—

Estimated IBD probabilities for random IBD data. IBD tracts were inserted in pairs of simulated haplotypes at random according to the prior distribution. IBD probabilities were estimated at both IBD and non-IBD positions, and these probabilities are shown in the two histograms.
As the same prior was used to generate the data as to estimate the posterior IBD probabilities, the accuracy of these estimated probabilities can be tested. Figure 5 shows that the estimated probabilities tend to be too low. For example, of those positions with estimated IBD probability 0.2, ∼45% are actually IBD. From an IBD detection standpoint, the estimated probabilities are conservative: the true posterior probability of IBD is larger than that reported. This may occur because the IBD haplotypes are used in building the haplotype probability model. Because the IBD haplotype is seen in the data, it does not appear to be very rare. As the estimated frequency of the haplotype is overly high, the posterior probability of IBD is underestimated. With the current procedure, it is not possible to build the model without the haplotypes being considered for IBD, as they may then be assigned zero probability. This is an area for future work.
Figure 5.—

Accuracy of estimated IBD probabilities. IBD tracts were inserted in pairs of simulated haplotypes at random according to the prior distribution. IBD probabilities were estimated at both IBD and non-IBD positions. Within each bin shown on the _x_-axis, the locations having an estimated IBD probability falling within the bin are considered. Of those locations falling into the bin, the proportion of locations that are actually part of an IBD tract is shown by the height of the bar for that bin. As the distribution of IBD follows the same distribution as the prior used in the IBD estimation, actual proportions should ideally match the estimated probabilities and thus fall close to the diagonal line.
DISCUSSION
This work has shown that quite small tracts of IBD between pairs of haplotypes can be accurately detected with sufficiently dense genotype data. For example, the proposed method has high power to detect IBD tracts of length 1 cM when marker density is at least one SNP/6 kb. The examples used simulated and real data in which markers are not tag selected, and it is likely that use of tag-selected markers would enable this level of detection with slightly lower density of markers. Also, most of the results given here are based on a prior IBD distribution that has low IBD proportion. With higher prior IBD probability or a less stringent posterior IBD probability threshold, ability to detect IBD tracts will increase (however, the frequency of false-positive results will also increase). The results presented here contrast with methods that do not account for LD and haplotype probabilities and which cannot detect tracts of IBD <3 cM in length (Miyazawa et al. 2007).
With marker density continuing to increase, the data will soon approach the situation in which one can essentially determine IBD status continuously along the genome, which earlier work has anticipated (Feingold 1993; Browning 1998; Cheung and Nelson 1998; Grant et al. 1999; Browning 2000; Siegmund and Yakir 2003). Nonetheless, because of LD, it will still be necessary to infer IBD status probabilistically for short IBD tracts.
Extension to unphased data and allowance for genotyping error:
For practical purposes, it is not adequate to have an IBD detection method based on the use of phased haplotypes only, as phased haplotypes cannot be determined without error, and errors will significantly disrupt the ability to detect IBD. This problem cannot be alleviated by simply considering multiple possible haplotype phasings. For the lengths of regions considered (at least a hundred markers spread over 1 cM, for example), the number of possible haplotype phasings for one individual is enormous. For each combination of phasings considered for the two individuals, IBD probabilities need to be estimated. Even ignoring those haplotype phasings that have particularly low posterior probability, the number of reasonable possibilities is still too great. Thus, a method that simultaneously determines haplotype phase and IBD status is needed. This will allow estimated IBD status to inform the haplotype phasing.
The localized haplotype cluster model for haplotype probabilities is already used very successfully in haplotype inference (S. R. Browning and B. L. Browning 2007), and I plan to extend the method proposed here to simultaneously determine haplotypes and IBD status. The Beagle implementation of the localized haplotype cluster model is fast and flexible. It can deal with multiallelic markers as well as SNPs, and it is fast enough to be used with whole-genome association data comprising hundreds of thousands of markers and thousands of individuals (Browning and Browning 2008). The existing haplotype-phasing routine is significantly faster than other existing programs for haplotype phase inference (S. R. Browning and B. L. Browning 2007). One challenge will be the large number of pairwise comparisons that are required when detecting IBD between all pairs of individuals in a large set. It may be necessary to use quick ad hoc methods to identify regions that are suggestive of IBD to reduce the number of full IBD probability calculations required.
To allow for possible genotype errors, I plan to relax the requirement that only identical alleles can be IBD. I will allow a small positive probability of IBD at positions with nonidentical alleles. An IBD tract will have to be a little larger or consist of rarer haplotypes to enable detection of the IBD when the tract contains some observed nonidentity.
IBD mapping using IBD probabilities:
Once estimated IBD probabilities are available, one can use them in IBD mapping. This will be a powerful complement to existing approaches, being somewhat intermediate between LD association mapping and linkage mapping. One could either use estimated IBD probabilities directly or apply a threshold to assign IBD/non-IBD status to pairs of haplotypes. The estimated probabilities or inferred IBD status from pairs of individuals can be combined in a variety of different statistics. Options include the IBD-based statistics used in linkage mapping (Feingold 1993), haplotype-sharing-type statistics that contrast IBD-sharing levels between cases and controls, or other approaches developed specifically for case-only IBD data (Grant et al. 1999; Siegmund and Yakir 2003).
Acknowledgments
The author thanks Brian Browning and Elizabeth Thompson for valuable discussions, the anonymous reviewers for their helpful comments, and the WTCCC for making their whole-genome data available. This work was supported by a grant from the University of Auckland Research Committee, by National Institutes of Health grant 3R01GM075091-02S1, and by Marsden Fund award 07-UOA-175 from the Royal Society of New Zealand. This study makes use of data generated by the Wellcome Trust Case Control Consortium. A full list of the investigators who contributed to the generation of the data is available at http://www.wtccc.org.uk. Funding for the Wellcome Trust Case Control Consortium project was provided by the Wellcome Trust under award 076113.
References
- Abney, M., C. Ober and M. S. McPeek, 2002. Quantitative-trait homozygosity and association mapping and empirical genomewide significance in large, complex pedigrees: fasting serum-insulin level in the Hutterites. Am. J. Hum. Genet. 70 920–934. [DOI] [PMC free article] [PubMed] [Google Scholar]
- Baum, L. E., 1972. An inequality and associated maximization technique in statistical estimation for probabilistic functions on Markov processes, pp. 1–8 in Inequalities. III. Proceedings of the Third Symposium on Inequalities. Academic Press, New York.
- Beckmann, L., D. C. Thomas, C. Fischer and J. Chang-Claude, 2005. Haplotype sharing analysis using Mantel statistics. Hum. Hered. 59 67–78. [DOI] [PubMed] [Google Scholar]
- Browning, B. L., and S. R. Browning, 2007. Efficient multilocus association mapping for whole genome association studies using localized haplotype clustering. Genet. Epidemiol. 31 365–375. [DOI] [PubMed] [Google Scholar]
- Browning, B. L., and S. R. Browning, 2008 Haplotypic analysis of Wellcome Trust Case Control Consortium data. Hum. Genet. 123 273–280. [DOI] [PMC free article] [PubMed]
- Browning, S., 1998. Relationship information contained in gamete identity by descent data. J. Comput. Biol. 5 323–334. [DOI] [PubMed] [Google Scholar]
- Browning, S., 2000. A Monte Carlo approach to calculating probabilities for continuous identity by descent data. J. Appl. Probab. 37 850–864. [Google Scholar]
- Browning, S. R., 2006. Multilocus association mapping using variable-length Markov chains. Am. J. Hum. Genet. 78 903–913. [DOI] [PMC free article] [PubMed] [Google Scholar]
- Browning, S. R., and B. L. Browning, 2007. Rapid and accurate haplotype phasing and missing data inference for whole genome association studies by use of localized haplotype clustering. Am. J. Hum. Genet. 81 1084–1097. [DOI] [PMC free article] [PubMed] [Google Scholar]
- Chapman, N. H., and E. A. Thompson, 2003. A model for the length of tracts of identity by descent in finite random mating populations. Theor. Popul. Biol. 64 141–150. [DOI] [PubMed] [Google Scholar]
- Cheung, V. G., and S. F. Nelson, 1998. Genomic mismatch scanning identifies human genomic DNA shared identical by descent. Genomics 47 1–6. [DOI] [PubMed] [Google Scholar]
- Curtis, D., A. E. Vine and J. Knight, 2008. Study of regions of extended homozygosity provides a powerful method to explore haplotype structure of human populations. Ann. Hum. Genet. 72: 261–278. [DOI] [PMC free article] [PubMed] [Google Scholar]
- Feingold, E., 1993. Markov processes for modeling and analyzing a new genetic-mapping method. J. Appl. Probab. 30 766–779. [Google Scholar]
- Grant, G. R., E. Manduchi, V. G. Cheung and W. J. Ewens, 1999. Significance testing for direct identity-by-descent mapping. Ann. Hum. Genet. 63 441–454. [DOI] [PubMed] [Google Scholar]
- Haldane, J. B. S., 1919. The combination of linkage values, and the calculation of distances between the loci of linked factors. J. Genet. 8 299–309. [Google Scholar]
- Hill, W. G., and J. Hernandez-Sanchez, 2007. Prediction of multilocus identity-by-descent. Genetics 176 2307–2315. [DOI] [PMC free article] [PubMed] [Google Scholar]
- Houwen, R. H., S. Baharloo, K. Blankenship, P. Raeymaekers, J. Juyn et al., 1994. Genome screening by searching for shared segments: mapping a gene for benign recurrent intrahepatic cholestasis. Nat. Genet. 8 380–386. [DOI] [PubMed] [Google Scholar]
- International HapMap Consortium, 2007. A second generation human haplotype map of over 3.1 million SNPs. Nature 449 851–862. [DOI] [PMC free article] [PubMed] [Google Scholar]
- Kirch, P. V., 1984. The Evolution of the Polynesian Chiefdoms. Cambridge University Press, Cambridge, UK.
- Leutenegger, A. L., B. Prum, E. Genin, C. Verny, A. Lemainque et al., 2003. Estimation of the inbreeding coefficient through use of genomic data. Am. J. Hum. Genet. 73 516–523. [DOI] [PMC free article] [PubMed] [Google Scholar]
- McPeek, M. S., and A. Strahs, 1999. Assessment of linkage disequilibrium by the decay of haplotype sharing, with application to fine-scale genetic mapping. Am. J. Hum. Genet. 65 858–875. [DOI] [PMC free article] [PubMed] [Google Scholar]
- McPeek, M. S., and L. Sun, 2000. Statistical tests for detection of misspecified relationships by use of genome-screen data. Am. J. Hum. Genet. 66 1076–1094. [DOI] [PMC free article] [PubMed] [Google Scholar]
- Miyazawa, H., M. Kato, T. Awata, M. Kohda, H. Iwasa et al., 2007. Homozygosity haplotype allows a genomewide search for the autosomal segments shared among patients. Am. J. Hum. Genet. 80 1090–1102. [DOI] [PMC free article] [PubMed] [Google Scholar]
- Nelson, S., B. Merriman, Z. Chen, M. Ogdie, J. Stone et al., 2006. Applications of pedigree-free identity-by-descent mapping to localizing disease genes. Abstract 1530, Annual Meeting of The American Society of Human Genetics, October 11, 2006, New Orleans. http://www.ashg.org/genetics/ashg06s/.
- Purcell, S., B. Neale, K. Todd-Brown, L. Thomas, M. A. R. Ferreira et al., 2007. PLINK: a tool set for whole-genome association and population-based linkage analyses. Am. J. Hum. Genet. 81 559–575. [DOI] [PMC free article] [PubMed] [Google Scholar]
- Rabiner, L. R., 1989. A tutorial on hidden Markov models and selected applications in speech recognition. Proc. IEEE 77 257–286. [Google Scholar]
- Schaffner, S. F., C. Foo, S. Gabriel, D. Reich, M. J. Daly et al., 2005. Calibrating a coalescent simulation of human genome sequence variation. Genome Res. 15 1576–1583. [DOI] [PMC free article] [PubMed] [Google Scholar]
- Siegmund, D., and B. Yakir, 2003. Statistical analysis of direct identity-by-descent mapping. Ann. Hum. Genet. 67 464–470. [DOI] [PubMed] [Google Scholar]
- Sutton, D. G. (Editor), 1994. The Origins of the First New Zealanders. Auckland University Press, Auckland, New Zealand.
- Te Meerman, G. J., M. A. Van der Meulen and L. A. Sandkuijl, 1995. Perspectives of identity by descent (IBD) mapping in founder populations. Clin. Exp. Allergy 25(Suppl. 2): 97–102. [DOI] [PubMed] [Google Scholar]
- Thompson, E., 2000. Statistical Inference From Genetic Data on Pedigrees. The Institute of Mathematical Statistics and the American Statistical Association, Beachwood, OH.
- Tzeng, J. Y., B. Devlin, L. Wasserman and K. Roeder, 2003. On the identification of disease mutations by the analysis of haplotype similarity and goodness of fit. Am. J. Hum. Genet. 72 891–902. [DOI] [PMC free article] [PubMed] [Google Scholar]
- Van der Meulen, M. A., and G. J. Te Meerman, 1997 Association and haplotype sharing due to identity by descent, with an application to genetic mapping, pp. 115–136 in Genetic Mapping of Disease Genes, edited by I.-H. Pawlowitzki, J. H. Edwards and E. A. Thompson. Academic Press, San Diego.
- Voight, B. F., and J. K. Pritchard, 2005. Confounding from cryptic relatedness in case-control association studies. PLoS Genet. 1 302–311. [DOI] [PMC free article] [PubMed] [Google Scholar]
- Wellcome Trust Case Control Consortium, 2007. Genome-wide association study of 14,000 cases of seven common diseases and 3,000 shared controls. Nature 447 661–678. [DOI] [PMC free article] [PubMed] [Google Scholar]
- Wessel, J., and N. J. Schork, 2006. Generalized genomic distance-based regression methodology for multilocus association analysis. Am. J. Hum. Genet. 79 792–806. [DOI] [PMC free article] [PubMed] [Google Scholar]
- Whyte, A. L. H., S. J. Marshall and G. K. Chambers, 2005. Human evolution in Polynesia. Hum. Biol 77 157–177. [DOI] [PubMed] [Google Scholar]