Plasma Adiponectin Complexes Have Distinct Biochemical Characteristics (original) (raw)
Abstract
Adipocytes release the secretory protein adiponectin in a number of different higher-order complexes. Once synthesized and assembled in the secretory pathway of the adipocyte, these complexes circulate as biochemically distinct and stable entities with little evidence of interchange between the different forms that include a high-molecular-weight (HMW) species, a hexamer (low-molecular-weight form), and a trimeric form of the complexes. Here, we validate a high-resolution gel filtration method that reproducibly separates the three complexes in recombinant adiponectin and adiponectin from human and murine samples. We demonstrate that the HMW form is prominently reduced in male vs. female subjects and in obese, insulin-resistant vs. lean, insulin-sensitive individuals. A direct comparison of human and mouse adiponectin demonstrates that the trimer is generally more abundant in human serum. Furthermore, when the production of adiponectin is reduced, either by obesity or in mice carrying only a single functional allele of the adiponectin locus, then the amount of the HMW form is selectively reduced in circulation. The complex distribution of adiponectin can be regulated in several ways. Both mouse and human HMW adiponectin are very stable under basic conditions but are exquisitely labile under acidic conditions below pH 7. Murine and human adiponectin HMW forms also display differential susceptibility to the presence of calcium in the buffer. A mutant form of adiponectin unable to bind calcium is less susceptible to changes in calcium concentrations. However, the lack of calcium binding results in a destabilization of the structure. Disulfide bond formation (at position C39) is also important for complex formation. A mutant form of adiponectin lacking C39 prominently forms HMW and trimer but not the low-molecular-weight form. Injection of adiponectin with a fluorescent label reveals that over time, the various complexes do not interconvert in vivo. The stability of adiponectin complexes highlights that the production and secretion of these forms from fat cells has a major influence on the circulating levels of each complex.
EXCLUSIVELY SECRETED FROM the adipocytes, adiponectin is a 30K molecule that exists in at least three different higher-order complexes (1,2,3). These complexes have been identified as the high-molecular-weight (HMW) form (12–36 mer), low molecular weight (LMW) form (hexamer), and trimeric form (trimer) (4,5). It is well established that the circulating levels of adiponectin are an important marker for metabolic disorders (5,6,7,8). The effects of adiponectin do not just correlate with the metabolic disorders but play a direct role in the regulation of glucose and lipid metabolism (9,10,11,12). Additionally, adiponectin levels have been associated with many other diseases that include but are not limited to cardiovascular disease, kidney disease, and hypertension (as reviewed in Ref. 13).
Both hyperglycemia and hyperinsulinemia in wild-type mice reduce the levels of circulating HMW adiponectin (4). To highlight the potential relevance of circulating adiponectin complexes to insulin action in humans, several groups have focused on adiponectin mutations in humans that prevent the formation of the HMW complex. The presences of these mutations are associated with an increased risk of type 2 diabetes (5). There is also a well-established sexual dimorphism manifest between males and females with the latter displaying higher levels of total adiponectin that is primarily due to the higher levels of HMW adiponectin (4,14). A number of studies have taken advantage of the potent predictive power that measurement of the HMW form offers and have further strengthened the strong correlations with the metabolic syndrome and insulin sensitivity previously revealed with measurements of total adiponectin (15,16). In particular, a strong correlation exists between peroxisome proliferator-activated receptor-γ-mediated improvements of insulin sensitivity and the degree of induction of HMW adiponectin increase during the course of treatment (16). What remains to be established is the importance of measuring the other two forms of adiponectin, which are the LMW and trimeric complexes.
A number of different methods have been employed in the past for the separation of different adiponectin complexes from circulating and recombinant preparations. Some groups have used partially denaturing, nonreducing gel electrophoresis (5). This is a powerful method that allows for the relatively rapid processing of a larger number of samples. The disadvantage is the relatively ill-defined biochemical basis by which this method separates the complexes and hence the susceptibility of the method to even slight changes in the temperature and denaturing state. Even though very intriguing correlations have been unraveled with this method, there is a relatively high technique-inherent variability of the results. In the past, we have used velocity sedimentation analysis coupled to quantitative Western blot analysis to measure the complex distribution of adiponectin (4). This method was useful in understanding the importance of the HMW adiponectin. However, it fails to resolve the lower-molecular-weight complexes that are all bundled together.
Here we sought to develop a technique using gel filtration chromatography analysis that enables us to reproducibly resolve all three major adiponectin complexes. Using this method, we have refined our understanding of the nature of the various forms of adiponectin. The ratio of each complex in both mice and humans is reported along with the effects of obesity and insulin resistance on the complexes. The effects of reduced adiponectin are also examined in the heterozygous adiponectin knockout mice as well as those in obese patients. The stability of the three complexes is explored using recombinant wild-type and mutant forms of adiponectin that highlight the importance of the calcium-binding domain and the disulfide bonds in complex formation of wild-type adiponectin.
Materials and Methods
Animals
Mice (FVB) were maintained on a 12-h light, 12-h dark cycle and on a standard chow diet. Adiponectin knockout animals were described previously (17) and have been backcrossed 12 generations into the FVB strain. All animal experimental protocols were approved by the Institutional Animal Care and Use Committee of the University of Texas Southwestern Medical Center at Dallas.
Materials
DMEM was purchased from Mediatech Inc. (Manassas, VA). The antimouse and antihuman adiponectin antibody was described elsewhere (4). The IRDye 800CW infrared NHS ester dye was purchased from LI-COR Biotechnology (Lincoln, NE). PBS with calcium was purchased from HyClone (Logan, UT).
Site-directed mutagenesis to create the C39S and calcium binding mutation in mouse adiponectin
The C39S mutation in mouse adiponectin has been previously described (4). To generate the calcium-binding mutant of mouse adiponectin, forward and reverse primers containing mutation sites were synthesized by Invitrogen (Carlsbad, CA), and the sequences were as below with targeted sites underlined (forward, 5′-ATCAGGAAAAGAATGTGGCCCAGGCCTCTGGCTCTGT-3′; reverse, 5′-ACAGAGCCAGAGGCCTGGGCCACATTCTTTTCCTGAT-3′). The pRA-GFP expression vector with wild-type mouse adiponectin was used as template for PCR (18). The PCR amplification was performed using the site-directed mutagenesis kit under the manufacturer’s recommendations (Stratagene, La Jolla, CA). The PCR product was transformed into TOP 10 chemically competent cells (Invitrogen), and the positive clone was verified by sequencing (Genewiz, South Plainfield, NJ). The resulting protein has an Asp288Ser point mutation that no longer chelates calcium.
Adipocyte differentiation in cell culture
3T3-L1 murine fibroblasts (a generous gift of Dr. Charles Rubin, Department of Molecular Pharmacology, Albert Einstein College of Medicine, Bronx, NY) were propagated and differentiated to adipocytes. The cells were maintained in DMEM containing 10% fetal calf serum (FCS) supplemented with penicillin/streptomycin of 100 U/ml each and allowed to reach confluence (d −2). After 2 d (d 0), the medium was changed to DM1 (containing FCS and 160 nm insulin, 250 nm dexamethasone, and 0.5 mm 3-isobutyl-1-methylxanthine). Two days later (day 2), the medium was switched to DM2 (FCS containing 160 nm insulin). After another 2 d, the cells were switched backed to FCS. Cells were used between d 8 and 12 after induction of differentiation.
Cell lysis
Cells were lysed in HNET buffer (25 mm HEPES; 150 mm NaCl; 5 mm EDTA; and 1% Triton X-100, pH 8.0) with 1× complete protease inhibitor cocktail (Roche, Indianapolis, IN). The extract was cleared by centrifugation at 20,000 × g at 4 C for 15 min. All samples were stored at −20 C with Laemmli sample buffer (2×) until further analysis.
Adiponectin complex distribution analysis
The complex distribution of adiponectin was determined by separating 25 μl or less of serum from mouse and human along with recombinant protein over a Superdex 200 10/300 GL column (GE Healthcare Bio-Sciences Corp., Piscataway, NJ) using an ÁKTA FPLC system (GE Healthcare). The flow rate of the column was 0.25 ml/min during the separation of adiponectin complexes. The column was run in buffers indicated in the figure legend of each experiment, and 0.215-ml fractions were collected over the retention volume that adiponectin elutes (∼8–13 ml). In Fig. 9, 200 μl recombinant human adiponectin were separated using HiLoad 16/60 Superdex 200 column at a flow rate of 0.5 ml/min using an ÁKTA FPLC system (GE Healthcare). Two buffer systems were used that include HEPES/Ca2+ buffer (25 mm HEPES; 150 mm NaCl; and 1 mm CaCl2, pH 7.4) and 1× PBS (10 mm phosphate buffer; 137 mm NaCl; and 2.7 mm KCl, pH 7.4).
Figure 9.
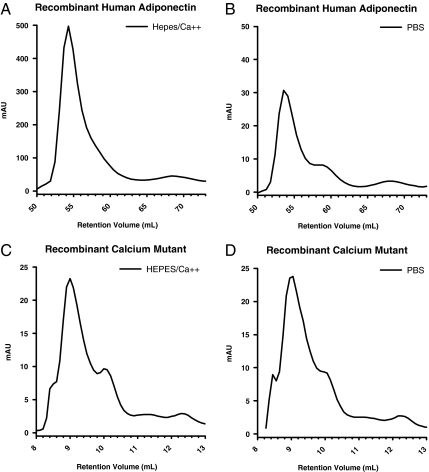
Calcium binding affects the stability of adiponectin. Recombinant human adiponectin (200 μl of 4 mg/ml) was separated by gel filtration chromatography using a HiLoad 16/60 Superdex 200 column in either HEPES/Ca2+ buffer (A) or 1× PBS (B) without calcium. The absorbance of the purified protein (A280nm) at 280 nm is shown on the y-axis, and the retention volume is shown on the x-axis. Note the difference in scale of the y-axis between A and B. Recombinant calcium-binding mutant adiponectin (50 μl of 1 mg/ml) was separated by gel filtration chromatography using a Superdex 200 10/300 GL column in either HEPES/Ca2+ buffer (C) or 1× PBS (D) with no calcium.
Gel electrophoresis and Western blot analysis
Samples (60 μl) were collected over the entire elution of adiponectin and incubated with 20 μl 5× Laemmli sample buffer followed by boiling for 5 min. Samples (20 μl) were loaded on a Criterion precast 26-well gel (Bio-Rad, Hercules, CA), and after SDS-PAGE, the samples were subjected to immunoblot analysis with PVDF-FL membrane (Millipore, Bedford, MA) using 1:1000 polyclonal anti-adiponectin antibodies followed by incubation with IRDye 800-coupled goat antirabbit secondary antibodies (Rockland, Gilbertsville, PA). Primary and secondary antibodies were diluted in Tris-buffered saline with 0.1% Tween 20 and 4% nonfat milk. The fluorescent Western blotting protocol from LI-COR Biosciences (document no. 988-07568) was followed. The membrane was then scanned by the LI-COR Odyssey infrared imaging system at 700- and 800-nm channels simultaneously, and band intensity at 30 kDa was quantified with Odyssey v2.1 software (LI-COR Biotechnology).
Quantitation of adiponectin complexes
For each Western blot, the peak intensities were plotted onto an xy line graph where the retention volume (x-axis) was plotted vs. the relative intensity (y-axis). The area under the curve for each distinct peak of the HMW, LMW, and trimer form was determined. To calculate the percentage of each complex, the area of each complex was divided by the total area under the curve and multiplied by 100. Overloading the samples onto the Western blot is detrimental to the analysis process because it is difficult to measure three distinct peaks. It is important to have a general idea of the level of adiponectin in the starting material to obtain three distinct peaks for the analysis. For example, only 15 μl of lean female samples are required compared with 25 μl of obese male samples to get the desired peak separation.
Velocity sedimentation of adiponectin complexes
Velocity sedimentation was performed as described previously (4). The total recombinant mouse adiponectin (25 μl) or peak fractions (100 μl) from size fractionation column corresponding to the three complexes were loaded on 5–20% sucrose gradients. After separation, 10 fractions (150 μl) were collected and resolved by SDS-PAGE on 12% Tris-glycine gels (Invitrogen), and quantitative fluorescence Western blotting was performed using the protocol above.
Production of recombinant wild-type, C39S, and calcium-binding mutant adiponectin
Proteins were produced similar to Berg et al. (9) with the following modifications. An expression construct for wild-type mouse, human, C39S, or calcium-binding mutant adiponectin was made by placing each coding region in a bicistronic expression vector for adiponectin and green fluorescent protein and then stably transfected into HEK-293T cells. High expressers were isolated by fluorescence-activated cell sorting and further propagated in DMEM containing 10% FCS, penicillin/streptomycin, and 0.1 g/liter ascorbic acid. When cells reached confluence, the serum-containing medium was removed, and cells were allowed to secrete for 48 h into serum-free DMEM with 0.1 g/liter ascorbic acid. Medium was collected and centrifuged for 30 min at 3000 rpm to pellet cellular debris. Ammonium sulfate was added to 40% (wt/vol), and protein was precipitated overnight at 4 C followed by centrifugation for 1 h at 4000 × g. Precipitated protein was washed in ammonium sulfate (40% (wt/vol)) and centrifuged for 1 h at 4000 × g. The precipitated protein was resuspended in 15 ml 10 mm HEPES (pH 8), 25 mm NaCl, 1 mm CaCl2 (low-salt buffer) and passed over a HiPrep 26/10 desalting column (GE Healthcare) equilibrated in low-salt buffer. The protein fraction off the desalting column was immediately added to a 5-ml HiTrap Q HP ion exchange column (GE Healthcare). The column was washed extensively with low-salt buffer until the absorbance at 280 nm reached baseline, and the adiponectin was eluted off the column with a salt gradient elution using low-salt buffer and high-salt buffer [10 mm HEPES (pH 8), 500 mm NaCl, 1 mm CaCl2]. Adiponectin-containing fractions were determined by Coomassie staining, and positive fractions were concentrated using a centrifugal filtration device (Amicon Ultra-15 50,000 MWCO; Millipore) and analyzed for purity. The resulting protein was 98% pure as judged by Coomassie-stained gels with a 2% contamination of albumin carried over from the FCS medium.
Human subjects
Eleven (two female, nine male) nondiabetic subjects underwent 5-h, hyperinsulinemic euglycemic clamp studies, along with measurement of fasting plasma adiponectin levels and analysis of adiponectin multimers. Subjects ranged in body mass index (BMI) from 19.6–35.9 kg/m2 (subject characteristics shown in Table 1). Before their enrollment in the study, the purpose, nature, risks, and benefits of the study were explained to all subjects, and their voluntary, informed, written consent was obtained. The study was approved by the Institutional Review Board of the Albert Einstein College of Medicine. All subjects were fasting for at least 10 h on the morning of the clamp study. An iv catheter was inserted in the left arm for infusions at 0700 h the morning of the study day. An additional iv cannula was inserted in an antecubital vein of the opposite arm for blood sampling. To obtain arterialized venous blood samples, the hand was maintained at 65 C in a thermoregulated Plexiglas box. All subjects underwent 5-h euglycemic-hyperinsulinemic clamp to assess whole-body glucose uptake. Insulin infusion (Humulin R; Eli Lilly Corp., Indianapolis, IN) was initiated at time zero at 80 mU/m2·min for 10 min followed by 40 mU/m2·min for the rest of the study. Plasma glucose was measured every 5–10 min by a Beckman glucose analyzer (Beckman Coulter, Inc., Fullerton, CA) and maintained at euglycemic concentrations (∼90 mg/dl) by a variable infusion of 20% dextrose. The glucose infusion rate (GIR) required to maintain euglycemia, an index of the degree of insulin sensitivity, is shown in Table 1.
Table 1.
Patient cohort for adiponectin distribution studies
| Subject | Gender | BMI | Age (yr) | GIR (mg/kg·min) |
|---|---|---|---|---|
| 1 | Female | 20 | 81 | 11.3 |
| 2 | Female | 25 | 59 | 8.1 |
| 3 | Female | 26 | 44 | 9.69 |
| 4 | Female | 24 | 24 | 13.2 |
| 5 | Male | 23 | 22 | 9.1 |
| 6 | Male | 22 | 33 | 15.2 |
| 7 | Male | 23 | 66 | 15.5 |
| 8 | Male | 26 | 64 | 11.2 |
| 9 | Male | 30 | 61 | 6.8 |
| 10 | Male | 32 | 73 | 5.5 |
| 11 | Male | 36 | 52 | 4.1 |
| 12 | Male | 28 | 61 | 3.8 |
| 13 | Male | 28 | 63 | 3.5 |
Labeling adiponectin with a fluorescent dye
Adiponectin (1 mg total) in HEPES/Ca2+ buffer was labeled with IRDye 800CW NHS ester (LI-COR Biotechnology) for 1 h at 25 C while gently shaking the tube to achieve a dye-protein molar ratio of 1:1. The reaction was stopped by adding 50 μl of 1 m Tris (pH 8.0). Free dye was separated from the dye conjugated to protein by passing the sample over a HiPrep 26/10 desalting column (GE Healthcare) equilibrated in PBS with calcium (HyClone). The resulting fluorescent-labeled adiponectin was concentrated to 1 mg/ml using a centrifugal filtration device (Amicon Ultra-15 50,000 MWCO) and snap frozen in liquid nitrogen for storage.
Fluorescent adiponectin injections
Mice were injected iv by a retroorbital injection (100 μl) using 0.5 μg/g body weight of adiponectin labeled with IRDye 800CW (LI-COR Biotechnology) in PBS with calcium (HyClone). Blood samples were collected in heparinized capillaries, and serum was obtained. Serum samples (20 μl) were separated by gel filtration, and 0.215-μl fractions were collected. The SDS sample buffer of 5× (20 μl) was combined with 60 μl of each fraction between retention volumes 8–13 ml off the column, and proteins were separated by SDS-PAGE. After gel electrophoresis, gels were placed directly onto the Odyssey imaging system (LI-COR Biotechnology), and the fluorescent signal was detected for adiponectin in the 800-nm channel. The signal was quantified using the Odyssey 2.1 software (LI-COR Biotechnology), and relative intensities were plotted.
Statistical analysis
The results are shown as means ± sem. All graphs and statistical analysis was performed by the Student’s t test in SigmaPlot 10.0 (Systat Software, Point Richmond, CA). Significance was accepted at P < 0.05.
Results
The three major adiponectin complexes can effectively be separated by gel filtration chromatography
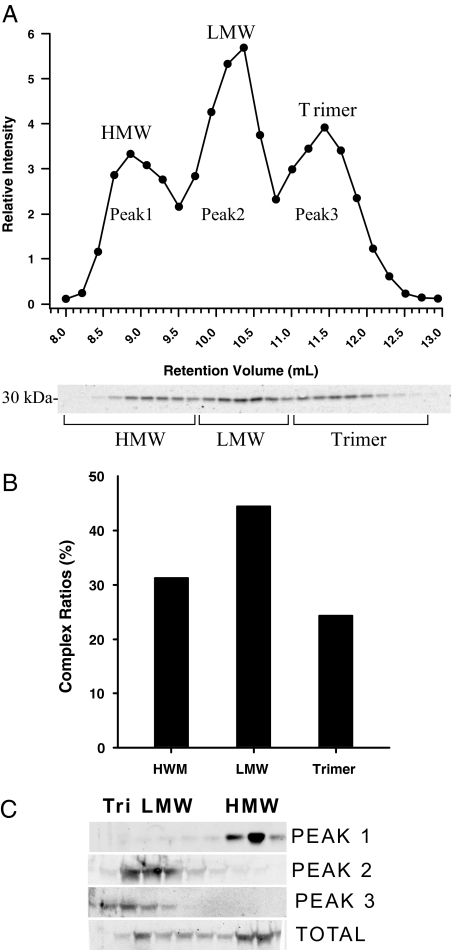
We have previously found that HEK-293T cells offer the unique opportunity to overexpress both murine and human adiponectin at very high levels in the presence of sufficiently high levels of vitamin C. Using pAB123, we generated pools of cells that stably overexpress adiponectin (9). Taking advantage of a bicistronic message that encodes green fluorescent protein downstream of the adiponectin cDNA, populations of cells can be isolated by fluorescent-activated cell sorting that overexpress adiponectin to various degrees. HEK-293T cells secrete all three complexes of adiponectin (4). An approach was needed to separate each of these three complexes to determine the levels of the various forms of adiponectin. To this end, a method was devised that used gel filtration chromatography, SDS-PAGE separation of proteins, and quantitative Western blot analysis using anti-adiponectin antibodies (Fig. 1A). We can detect the basic trimeric adiponectin complexes, the hexamers that we refer to as the LMW complex, whereas other laboratories have chosen the term middle-molecular-weight (MMW) complex. Finally, also a higher-order complex can be detected that is generally referred to as the HMW complex. Different batches of HEK-293T cells express different levels of the three forms (Schraw, T., manuscript in preparation). To validate that each peak was actually the designated form of adiponectin, we used the previously validated method of velocity sedimentation. Pooled fractions for each peak of all three forms separated by gel filtration were placed on a sucrose gradient for velocity sedimentation. As shown in Fig. 1C, each peak from the gel filtration corresponds well to the expected sedimentation velocity for the HMW, LMW, and trimer forms of adiponectin. Gel filtration has the additive advantage that the hexamer and the trimer can effectively be separated, whereas the separation of the two complexes by velocity sedimentation is inefficient as seen by comparing peak 2 vs. peak 3 (Fig. 1C).
Figure 1.
Adiponectin separated by gel filtration chromatography. A, The tissue culture supernatant from HEK-293T cell expressing mouse adiponectin (200 μl) was injected onto the gel filtration column in HEPES/Ca2+ buffer. The relative intensity of the mouse adiponectin is plotted against the retention volume of each fraction (•). Three peaks are clearly separated, representing the HMW, LMW, and trimer. B, A bar graph of the complex distribution of each peak was calculated by dividing the area under the curve for each peak by the total area under the curve for the entire spectrum. C, Pooled fractions for each peak were separated by velocity sedimentation over a sucrose gradient and compared with the original sample. The 10 fractions were separated by SDS-PAGE, and the Western blot was performed using the same primary and secondary antibodies mentioned above. Each peak is highly enriched for the individual complex of adiponectin as expected.
Sexual dimorphism of the distribution of the different adiponectin complexes
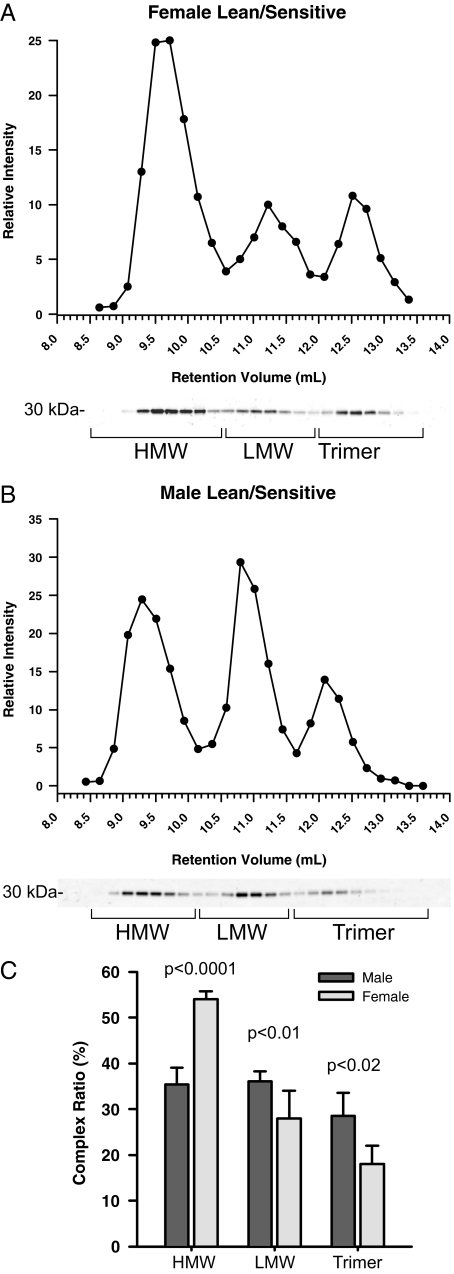
We have previously reported that females tend to have higher levels of adiponectin in circulation than males, a phenomenon that can be observed from mouse to man (4,14). We have analyzed a series of serum samples from lean, nondiabetic individuals using the same type of gel filtration chromatography that we used for the recombinant adiponectin. Total adiponectin levels in females are higher than the total levels of adiponectin in circulation for males (4). There are significant differences with respect to the distribution of the different complexes in females (Fig. 2A) vs. males (Fig. 2B). Quantitatively, the results from the analysis of an entire cohort (Fig. 2C) demonstrate that females have on average half of their adiponectin in the HMW form with the remainder evenly split between hexamer and trimer, whereas males have about equal levels of all three complexes in circulation.
Figure 2.
Adiponectin complex distribution in human samples from lean, insulin-sensitive males and females. A and B, A representative complex distribution of adiponectin from female (A) and male (B) human serum samples are shown. Samples (20 μl) were injected onto the gel filtration column equilibrated in HEPES/Ca2+ buffer. The relative intensity of human adiponectin is plotted against the retention volume of each fraction (•). C, Quantification of the complex distribution of adiponectin from male (n = 4) and female serum samples (n = 4). The percentage of each complex was calculated by dividing the area under the curve for each peak by the total area under the curve for the entire spectrum.
Obesity and insulin resistance are associated with lower levels of the HMW form
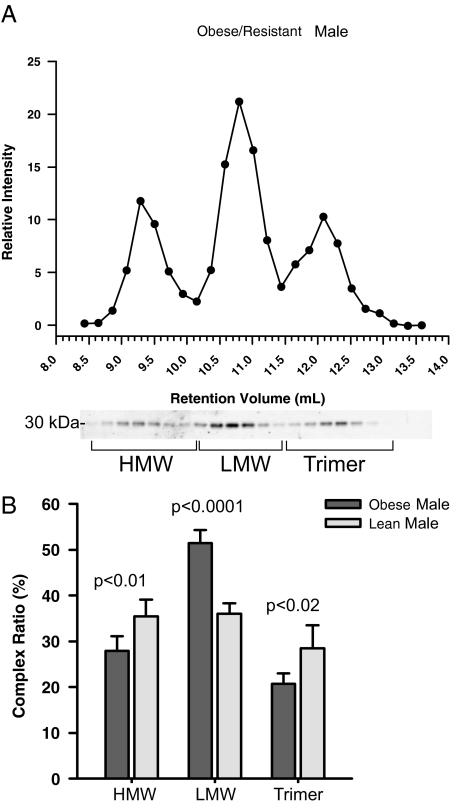
Employing velocity sedimentation analysis, we have recently demonstrated that insulin-resistant individuals have lower levels of HMW adiponectin in circulation (19). Here, we applied the gel filtration technique to analyze obese, insulin-resistant individuals compared with a lean, insulin-sensitive control group. As expected, the levels of HMW complex in obese, insulin-resistant patients are lower than the levels of lean, insulin-sensitive counterparts (Fig. 3B). The hexamer complex becomes much more pronounced, and interestingly, the trimer levels are also reduced in the obese, insulin-resistant state (Fig. 3B).
Figure 3.
Adiponectin distribution in human samples from obese, insulin-resistant males. A, A representative complex distribution of adiponectin from obese/resistant male serum samples. Samples (25 μl) were injected onto the gel filtration column equilibrated in HEPES/Ca2+ buffer. The relative intensity of the human adiponectin is plotted against the retention volume of each fraction (•). B, Quantification of the complex distribution of adiponectin from lean, insulin-sensitive male samples (n = 4) and obese, insulin-resistant male samples (n = 4). The percentage of each complex was calculated by dividing the area under the curve for each peak by the total area under the curve for the entire spectrum.
Comparison of mouse and human adiponectin complexes
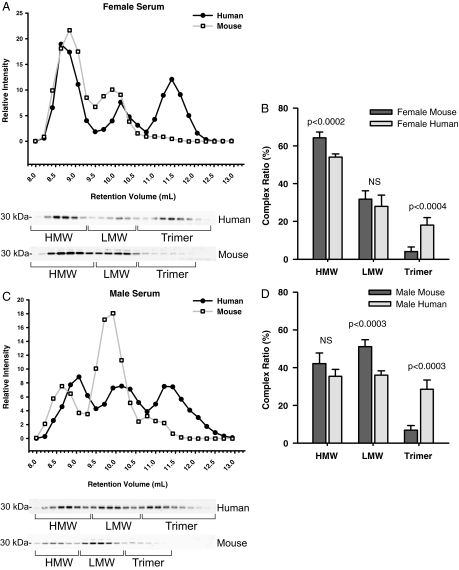
To date, mouse models have been proven to be a valuable tool to study the physiology of adiponectin. We wondered whether there are any differences with respect to the distribution and size of the different adiponectin complexes. Mice have all three forms of the adiponectin complexes in circulation. What is most notable is that mice display significantly lower levels of the trimeric form of adiponectin, which is apparent in both male and female mice (Fig. 4, B and D). For males, it is apparent that there is a size difference in mouse adiponectin compared with human adiponectin complexes. This is manifest in a discrete shift of the adiponectin complexes in the mouse samples compared with the human. Each complex of mouse adiponectin consistently elutes faster than the human adiponectin (Fig. 4C), suggesting biochemical differences in size or shape between these two species. The HMW levels of mice adiponectin are comparable to the levels found in human adiponectin. The levels of LMW adiponectin in male mice are higher than that seen in human male samples, whereas the LMW adiponectin levels in females are not significantly different.
Figure 4.
Comparison of adiponectin complex distribution in human vs. mouse serum samples. The data from the human serum samples in Fig. 3 was compared with data obtained from male and female mice. A, A representative complex distribution of adiponectin from female mouse serum (n = 5) compared with female human serum samples (n = 4). B, A representative complex distribution of adiponectin from male mouse serum (n = 5) compared with male human serum samples (n = 4). Serum samples from female mice (20 μl) and male mice (25 μl) were injected onto the gel filtration column equilibrated in HEPES/Ca2+ buffer. The relative intensity of each fraction is plotted against the retention volume for mouse (□) and human (•). Quantification of the complex distribution of adiponectin was shown for females (B) and males (D). The percentage of each complex was calculated by dividing the area under the curve for each peak by the total area under the curve for the entire spectrum.
Comparison of adiponectin complexes for adiponectin heterozygote mice
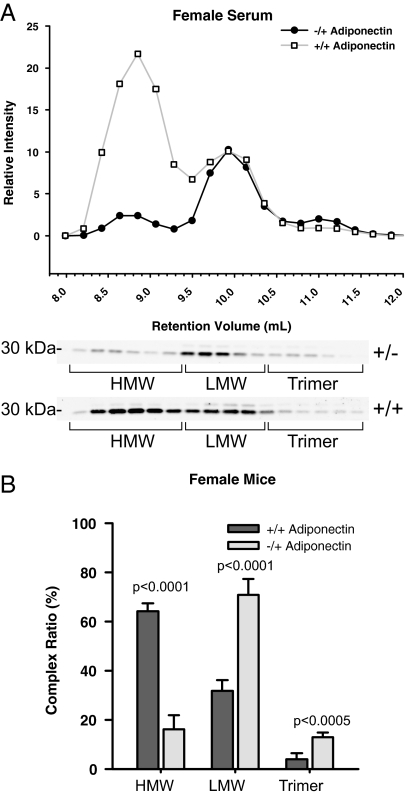
In the obese state, it has been well documented that the HMW form of adiponectin is reduced in circulation (20). Obese subjects also have a tendency for lower total levels of adiponectin. To determine the effect of diminished production on the complex formation of adiponectin, we measured the distribution of adiponectin from mice lacking a single allele of adiponectin. Western blot analysis of total adiponectin from serum samples of these mice revealed that adiponectin heterozygous knockout mice have 40% of the levels found in wild-type littermates (data not shown). The most striking feature revealed by complex distribution analysis was the dramatic loss of the HMW form of adiponectin (Fig. 5A). The substantial reduction in HMW results in an elevation in the percentage of LMW form in the heterozygous mice (Fig. 5B). This result suggests that the formation of the HMW form of adiponectin is particularly susceptible to the reduction of the total levels of adiponectin produced in fat cells. These studies were performed on female mice due to the fact that levels of adiponectin found in the male mice were close to the lower limit of detection for this assay. In the male samples that were analyzed, there were no measurable HMW adiponectin complexes (data not shown).
Figure 5.
Adiponectin complex distribution from mice lacking a single allele for adiponectin. The data from the female mouse serum samples in Fig. 4A was compared with data obtained from female mice that are heterozygous for adiponectin. A, A representative complex distribution of adiponectin from female wild-type mice compared with female mice lacking a single adiponectin allele. Serum samples (25 μl) from female heterozygous mice (•, −/+) and female wild-type mice (□, +/+) were injected onto the gel filtration column equilibrated in HEPES/Ca2+ buffer. The relative intensity of the adiponectin is plotted against the retention volume of each fraction. B, Quantification of the complex distribution of adiponectin from female heterozygous (n = 4) and wild-type samples (n = 5). The percentage of each complex was calculated by dividing the area under the curve for each peak by the total area under the curve for the entire spectrum.
Distinct distribution of intracellular and extracellular adiponectin in 3T3-L1 adipocytes
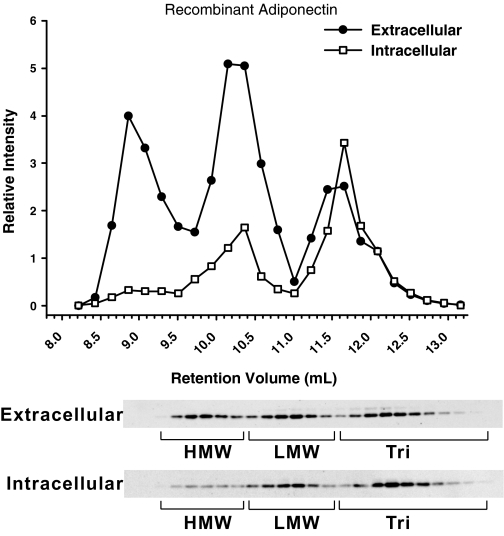
Adiponectin in the supernatant of 3T3-L1 adipocytes is present in three complexes as is adiponectin in serum from humans and mice (Fig. 6). The relative distribution of each complex is about 30%, which is similar to what we found in male human serum (Fig. 5B). When the cellular extracts were analyzed, we saw that the percent HMW at steady state was dramatically decreased compared with what was found outside the cell. This discrepancy in the percent HMW between the extracellular and intracellular milieu suggests that the assembly and secretion of the HMW is not the rate-limiting step. For example, once the HMW form is assembled, it is efficiently secreted. In female wild-type mice, we found that the percent HMW is about 65% in circulation (Fig. 4C). In adiponectin heterozygous mice, the total circulating levels of adiponectin drop by more than half with a majority of that decrease found in the HMW form of adiponectin (Fig. 5B) with undetectable HMW levels in male mice (data not shown). These findings suggest that the inability to accumulate sufficiently large amounts of trimer and LMW form at steady state may be the reason for the HMW assembly and secretion deficiency. It has previously been demonstrated that adiponectin retention and assembly into higher-order complexes involves the endoplasmic reticulum chaperones ERp44 and Ero1-Lα (18). It is clear from the difference in the distribution of extracellular and intracellular adiponectin that the HMW form is efficiently secreted, whereas the LMW and trimer are retained within the cell.
Figure 6.
Complex distribution of adiponectin in the supernatant and cellular extract. Day 8 in vitro differentiated 3T3-L1 adipocytes were incubated with 3 ml serum-free DMEM, and the supernatant was collected after 4 h. The medium was loaded on a gel filtration column, and the complex distribution of adiponectin was determined by Western blot using antimouse adiponectin antibodies. The same cells were treated in lysis buffer with Triton X-100. Cellular extracts were separated by gel filtration using the HEPES/Ca2+ buffer plus Triton X-100, and the complex distribution was analyzed in a similar fashion.
Sample handling for complex distribution analysis
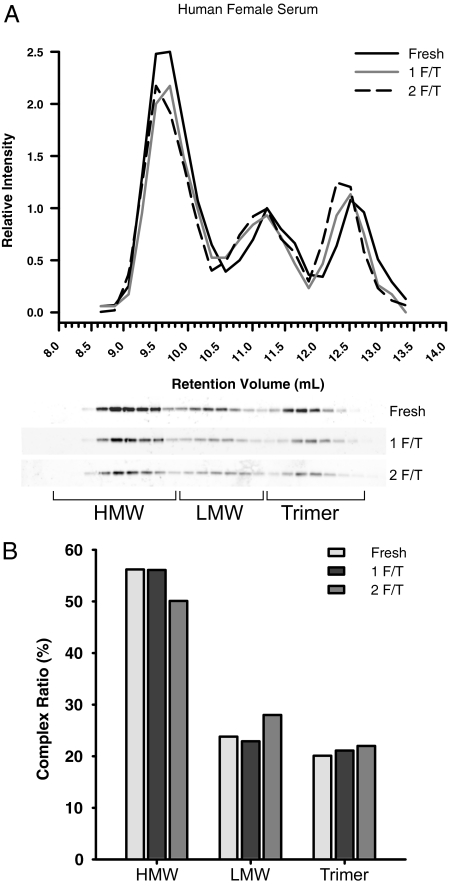
As this technique of adiponectin complex distribution analysis was being developed, one key parameter for its success was that the adiponectin complexes are stable under the conditions used for sample processing. One aspect of the analysis that could alter the distribution of complexes is how the samples are handled after serum is collect from subjects. As with all proteins, the effects of freeze/thawing samples have to be considered because this can significantly affect protein stability. To test the effects of multiple freeze/thaw cycles, we used a freshly collected female serum sample from a human subject (Fig. 7A). After a second freeze/thaw cycle, the complex distribution of adiponectin experienced minimal alterations in each complex (Fig. 7B). This experiment shows that it is acceptable to allow samples to be frozen after collection from patients for determination of the complex distribution of adiponectin.
Figure 7.
Adiponectin is stable after two freeze-thaw cycles. A, The complex distribution of adiponectin from human female serum. Female human serum samples (20 μl) were fractionated on a gel filtration column equilibrated in HEPES/Ca2+ buffer. Fresh serum samples were compared with the same sample that was rapidly frozen and thawed at 25 C (1 F/T). In addition, the same sample was rapidly frozen and then thawed at 25 C for a second time (2 F/T). The relative intensity of adiponectin was plotted against the retention volume of each fraction. B, The quantification of complex distribution for adiponectin was graphed to show the differences after one and two rounds of freezing and then thawing. The percentage of each complex was calculated by dividing the area under the curve for each peak by the total area under the curve for the entire spectrum.
Stability of the different complexes of adiponectin
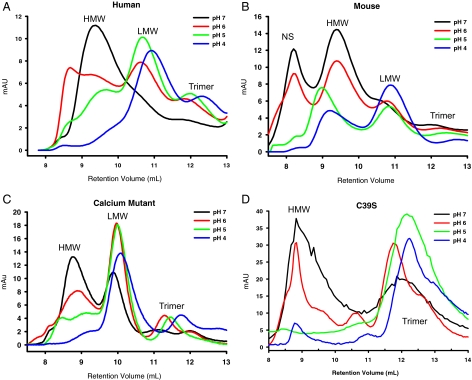
Another parameter suggested to be important for adiponectin stability is pH (4,21). To more comprehensively examine the effects of pH on all three forms of adiponectin from wild-type and mutant forms of adiponectin, we used gel filtration chromatography. In these experiments, we used highly purified adiponectin that was passed through gel filtration columns that have been equilibrated in buffer that contains the indicated pH as shown in Fig. 8. Although all complexes are stable at basic pH (data not shown), we found that human adiponectin HMW is extremely sensitive to small changes in pH from 7 to 6 (Fig. 8A). It can be clearly seen that the reduction of the HMW form is due to conversion of the HMW to LMW and trimer forms as the pH is decreased. At pH 4, it appeared that adiponectin might break down further into even smaller forms or it may precipitate.
Figure 8.
Stability of adiponectin complexes under acidic conditions. Recombinant human, mouse, mouse calcium-binding mutant, and mouse C39S mutant adiponectin were separated by gel filtration chromatography and subjected to a range of pH from 7 to 4. Recombinant human (A), mouse (B), calcium-binding mutant (C), and cysteine to serine mutant (C39S) (D) adiponectin (25 μl, 1 mg/ml) were fractionated on a gel filtration column equilibrated in sodium citrate buffer adjusted to the pH indicated on the graph. The three peaks for the HMW, LMW, and trimer are indicated on the graph. The absorbance at 280 nm (mAU, milli-absorbance units) was plotted against the retention volume over the range at which adiponectin elutes. NS, Nonspecific peak that does not contain any protein.
Mouse adiponectin complexes in contrast do not behave biochemically like human adiponectin complexes. The HMW of mouse adiponectin is more resistant to lower pH changes than human adiponectin (Fig. 8B) as judged by a significant amount of HMW mouse adiponectin detected even at pH 4. Another difference was that the HMW mouse adiponectin did not convert to LMW or trimer forms as the pH is lowered. More likely, it becomes less soluble and was retained on the gel filtration column.
Two mutant forms of mouse adiponectin were also assayed for their stability under acidic conditions. A mutant form of mouse adiponectin in which a critical residue involved in the chelation of calcium is mutated (Asp288Ser; see Materials and Methods) behaves in a similar fashion to the human adiponectin in its sensitivity to lowering pH (Fig. 8C). The HMW form was also converted to LMW and trimer complexes upon exposure to acidic conditions, and very little HMW was detected at pH 4, albeit the HMW form can be generated and is stable at neutral pH in the absence of calcium, which indicates that calcium binding plays a role in the stabilization of mouse adiponectin under suboptimal pH conditions.
Contrary to previous reports, the cysteine to serine (C39S) mutant form of adiponectin has two main complexes that consist of a complex with a migration behavior overlapping the HMW form and trimer both in vitro and in vivo (data not shown). Importantly, the C39S adiponectin does not display a distinct peak for the LMW form. The C39S HMW form is biochemically quite distinct from the wild-type complex and is highly unstable as judged by the high sensitivity to lower pH with most of this HMW form converting to trimer at pH 5 (Fig. 8D). This suggests that the trimeric complex is the key complex that this C39S mutant can form, and even though higher-order structures exist with this mutant as well under some conditions, they are highly unstable. Taken together, the results from the mutant forms of adiponectin indicate that disulfide bond formation and calcium binding contribute to the stability of the HMW form and have an impact on the biochemical characteristics of adiponectin.
Calcium-dependent stability of adiponectin
The structure of the globular head domain of adiponectin shows that three calcium ions bind to the trimeric head (1C3H, data not shown). The relevance of these calcium ions is currently unknown. During the purification of large amounts of recombinant human adiponectin, we found that the presence of calcium ions during protein separation by gel filtration greatly increases the amount of protein recovered. Using HEPES buffer with calcium, we found significantly more adiponectin was recovered compared with phosphate buffer without calcium (Fig. 9, A and B). Quantitatively, the reduction using phosphate buffer can be as many as 15-fold (note the difference in the scales of Fig. 9, A and B). No difference in protein recovery was seen when the calcium-binding mutant form of adiponectin was separated by gel filtration in the presence (Fig. 9C) or absence (Fig. 9D) of calcium.
A large quantity of recombinant mouse adiponectin (0.5 mg) was not affected by the lack of calcium as measured by the absorbance at 280 nm (data not shown). However, the HMW form of mouse adiponectin was not readily soluble once fractionated into its pure form and quickly became insoluble in solution (data not shown). The LMW and trimer forms of mouse adiponectin did not appear to be subject to these solubility issues in solution. Although there are again species-specific phenomena with respect to protein stability in the presence or absence of calcium, these results suggest that the analysis of adiponectin complexes should occur in a solution buffered around neutral pH and in the presence of at least 1 mm calcium.
Adiponectin complexes do not interconvert once in circulation
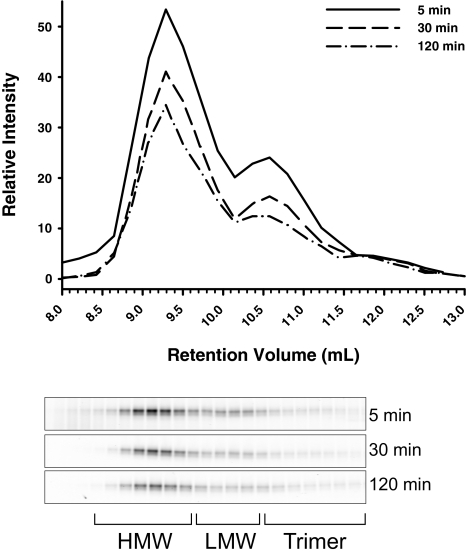
To further explore the stability of the adiponectin complexes in vivo, recombinant adiponectin was labeled with a fluorescent dye and injected into mice. Blood was subsequently collected over a 2-h time period. The serum collected at these time points was then fractionated over a gel filtration column, and the relevant fractions were further separated on an SDS-PAGE gel to be measured using a fluorescent imaging system. The 30-kDa band of adiponectin was quantified to show that during this 2-h time course, each complex is stable and does not get converted to other complexes (Fig. 10). Most notable was that the total level of each complex decreased over time as expected. These findings emphasize the importance of adipocyte proper on the relative amounts of the different complexes in circulation, because these levels are primarily determined at the level of secretion.
Figure 10.
Stability of fluorescent-labeled adiponectin complexes in circulation. Adiponectin was labeled with an IRDye 800 fluorescent label and administered iv into mice by a retroorbital injection of 0.5 μg/g body weight. Blood samples were collected by tail vein bleeding at the indicated time points. Serum samples (20 μl) were separated by gel filtration, and fractions of 0.215 ml were collected. Each fraction was separated over an SDS-PAGE gel, and the gels were scanned on the Odyssey LI-COR scanner. The fluorescent signal was quantified over the range of the retention volume that adiponectin elutes, and clear peaks for HMW, LMW, and trimer are seen.
Discussion
The ability to measure the various complexes of adiponectin is becoming more significant as more studies highlight the importance of the HMW form of adiponectin. Here, we have introduced a method for measuring all three complexes of adiponectin in a reproducible and highly accurate manner. We take advantage of the gel filtration approach followed by quantitative Western blot analysis of the 30-kDa band of adiponectin using fluorescence-based detection. The introduction of fluorescent Western blotting in our method is a key component for the successful application to quantify the amount of adiponectin present in each fraction, which represents the amount of adiponectin in each of the three complexes. Other techniques described in the literature use gel filtration (22); however, the analysis of the amount of adiponectin in each complex relies on ELISA that use antibodies that are likely to have a preference for a particular complex of adiponectin. Thus, these assays introduce a bias toward a particular complex in their design. The nonreducing and partially denaturing method developed by Waki and colleagues (5) can bypass the antibody bias and has been adapted quickly by several groups with success (23). However, this method has proven technically challenging to quantify precisely all three complexes. In our hands, slight modifications of temperature in the 1-h incubation step described by Waki et al. (5) alters the amount of HMW protein (see supplemental Fig. 1, published as supplemental data on The Endocrine Society’s Journals Online web site at http://endo.endojournals.org). In addition, it has been difficult to precisely obtain all three bands for what is referred to as HMW, MMW, and LMW. Using this procedure, a well resolved band can be obtained for HMW, but the MMW and LMW often appear as a long ladder of multiple bands, not as a distinctly resolved single band. The gel filtration/Western blot technique we describe is a more reproducible and stable method, providing a reflection of the levels of adiponectin present in each fraction, and this technique has been validated using velocity sedimentation analysis followed by Western blot analysis of the fractions (Fig. 1C). In addition, another advantage to this assay is the ability to measure the LMW and trimer forms of adiponectin with high resolution. This will allow in future studies the use of clinical serum samples to determine the significance of these forms in relation to metabolic dysregulation, a project currently ongoing in our laboratory.
To examine the level of each complex of adiponectin in humans, we separated serum from lean, insulin-sensitive samples and from male and female subjects. The sexual dimorphism of total adiponectin levels from males and females was identified in earlier studies (4,14). The higher total levels in female samples compared with male samples are largely attributed to the significantly higher levels of HMW adiponectin (Fig. 1C, 54% compared with 35%). Male samples from lean, insulin-sensitive subjects have roughly the same amount of adiponectin in each complex (33% each). The decrease in adiponectin levels during obesity and insulin resistance has been well documented (9,12,24,25). The reduction in total adiponectin levels can be attributed to a significant drop in HMW and trimeric forms. As a result, there is a marked increase in the percentage of the LMW form of adiponectin. The lowering of the HMW form of adiponectin during obesity is well known; however, the significance of the decrease of the trimer form is not well appreciated. We have recently reported that primarily the adiponectin trimer form is present in cerebral spinal fluid (26). Therefore, understanding the specific role that trimeric adiponectin has in the brain is likely to provide useful insights in the effects of the central action of adiponectin.
The distribution of adiponectin complexes in mice is different from that seen in humans. The underlying mechanism is poorly understood. The most noticeable difference between the two species is the low level of the trimeric adiponectin in mice (Fig. 4, C and D). As mentioned above, the trimer form recently has gained significance with respect to its potential central role in the brain. Whether the low level of circulating trimeric adiponectin correlates to the lower level centrally has not yet been explored in mice due to the technical difficulties in cerebral spinal fluid collection. But if we assume that the trimer in the cerebral spinal fluid originates from circulation, then the available pool accessible for mice is significantly lower than in humans. The other notable difference is that male subjects have an even distribution of all three complexes, whereas male mice have significantly higher levels of LMW adiponectin in comparison (Fig. 4D). This difference in the LMW form of adiponectin is not seen in females (Fig. 4C).
Another difference is that male mice, in particular, have adiponectin that appears to migrate more slowly than human adiponectin as seen from a shift in the elution profile of all three complexes. Adiponectin, due to its irregular shape and multimerization, runs as an extremely HMW protein on a gel filtration column. This column was calibrated with thyroglobulin, which has a molecular weight of 669K, and HMW mouse adiponectin elutes much earlier than this on these gel filtration columns. Thus, the HMW form of adiponectin has an apparent molecular weight that is much larger than 669K as judged by gel filtration. In this molecular weight range, a slight shift in the retention volume in the high end of the elution profile may suggest a large difference in the molecular weight of the complexes. These differences in adiponectin complexes are not as apparent in female mice (Fig. 4A).
Mice that lack a single allele for adiponectin display a gene dose-dependent reduction in total circulating adiponectin as expected. Interestingly, we find that the HMW form is more substantially affected than the other complexes (Fig. 5A). This finding is important because it may also provide an explanation of how the lower adiponectin production rates associated with obesity can trigger a reduction in the HMW form. Adipocytes appear to readily secrete the HMW form of adiponectin and retain the LMW and trimer forms (Fig. 6). As the level of adiponectin production declines, the HMW form is not formed due to a lack of sufficient building blocks of LMW and trimer that form this complex. Ultimately, the amount of circulating HMW adiponectin is reduced, which correlates with a reduction in insulin sensitivity that occurs during obesity.
To further explore other parameters that may affect the adiponectin complexes, the stability of these complexes was tested under various conditions. The first and foremost question is how the serum samples could be handled before analyzing the complex distribution. To test whether multiple freeze-thaw cycles affect the complex distribution, a human sample was tested when the sample was freshly collected and then frozen and thawed and again subjected to an additional freeze-thaw cycle (Fig. 7). A single freeze-thaw cycle does not alter the complexes, and only minimal changes occur after a second round of freeze-thawing. This result suggests that the human samples measured in the laboratory after a freeze and thaw cycle during shipment will reflect the complex distribution of adiponectin in a relatively accurate fashion.
The stability of adiponectin complexes is known to be pH sensitive under acidic conditions (4,21). To more comprehensively investigate the effects of lowering pH on the various complexes of adiponectin, recombinant mouse and human adiponectin were tested along with two mutant forms (C39S and the calcium-binding mutant). These experiments used gel filtration of the complexes on columns that were equilibrated in buffers at the indicated pH before loading the sample. The HMW form of adiponectin is more sensitive to acidic pH than LMW and trimer. Each form of adiponectin was also tested under extremely basic conditions (pH 11.5) with no effect on any of the complexes (data not shown). For human adiponectin along with the calcium-binding mutant and C39S mutant, the HMW form under acidic conditions readily shifts to the LMW and trimer forms of adiponectin. For mouse adiponectin, the HMW form does not shift to the other complexes, but all complexes appear to be less stable and are likely no longer soluble under these conditions. Thus, all complexes are reduced as the pH is lowered. The influence of the disulfide bond that is formed at residue cysteine 39 and that of the calcium binding was explored using two mutants of adiponectin (C39S and calcium-binding mutant). The HMW form of both of these mutants is less stable as the pH is lowered compared with the wild-type counterpart. We find that the HMW can be formed with these mutants that are of particular interest. Original publications of the C39S mutant performed under less optimal buffer conditions suggested that the HMW could not be generated and that the disulfide bond at C39 residue is required for HMW formation (4). This inconsistency may be due to different experimental conditions employed in these studies. The HMW form of the C39 mutant has also been measured in mice lacking adiponectin that express this mutant protein (data not shown).
The effects of calcium binding were further explored when high concentrations of recombinant adiponectin were purified in the presence or absence of calcium. As shown in Fig. 9, when recombinant human adiponectin was purified in the presence of calcium, it greatly enhanced the amount of adiponectin recovered from the column. Recombinant human adiponectin is stable after separation into three individual complexes. Unlike human adiponectin, recombinant mouse adiponectin is biochemically distinct from human adiponectin. The HMW form of mouse adiponectin is not soluble once it is separated from the other complexes and precipitates out of solution once eluted from the column. This suggests that the lower-molecular-weight forms may act as chaperones to increase the solubility of the HMW complex. In the absence of calcium, human adiponectin is not soluble and precipitates on the column before it can be eluted. As expected, the calcium-binding mutant form of adiponectin is not sensitive to the changes of calcium. The levels recovered are not different between the presence and absence of calcium (Fig. 9, C and D). Further studies are required to explore how these calcium-binding properties of adiponectin affect adiponectin stability in vivo.
To further examine the stability of adiponectin complexes in vivo, recombinant adiponectin was labeled with a fluorescent infrared dye and injected into mice. The fluorescent adiponectin was then analyzed by gel filtration at various time points after injection. We find that the adiponectin complexes do not interconvert between forms as shown in Fig. 10. The percent content of each complex is maintained over time, whereas there is an overall reduction in adiponectin levels during the experimental period. These data suggest that the adipocyte is the major determining factor influencing the amount of each of the adiponectin complexes in circulation. As seen in the heterozygous knockout mice, when the production of adiponectin is limited within fat cells, the assembly and secretion of HMW adiponectin are decreased, which results in a dramatic reduction in the HMW adiponectin in circulation. This is due to an insufficiently large pool of subunits. A similar phenomenon may be in effect during obesity as well, when the overall pool is reduced and therefore the efficient assembly of the HMW form impaired.
Supplementary Material
[Supplemental Data]
Acknowledgments
We thank Yuan Xin, Aisha Cordero, James Yi, Virginia Liu, and Amy Song for excellent technical assistance. We also thank the entire Scherer lab for advice and suggestions.
Footnotes
This work was supported in part by National Institutes of Health Grants R01-DK55758, R24-DK071030-01, R01-CA112023, and R21DK075887 (P.E.S.) and Grant T32 HL007675T(T.D.S.) and American Heart Association Grant 0625998T (T.D.S.). N.H. is supported by a stipend from the Faculty of Health Science of the University of Copenhagen.
Disclosure Summary: The authors have nothing to disclose.
First Published Online February 17, 2008
Abbreviations: BMI, Body mass index; FCS, fetal calf serum; GIR, glucose infusion rate; HMW, high-molecular-weight; LMW, low-molecular-weight; MMW, middle-molecular-weight.
References
- Hu E, Liang P, Spiegelman BM 1996 AdipoQ is a novel adipose-specific gene dysregulated in obesity. J Biol Chem 271:10697–10703 [DOI] [PubMed] [Google Scholar]
- Maeda K, Okubo K, Shimomura I, Funahashi T, Matsuzawa Y, Matsubara K 1996 cDNA cloning and expression of a novel adipose specific collagen-like factor, apM1 (adipose most abundant gene transcript 1). Biochem Biophys Res Commun 221:286–289 [DOI] [PubMed] [Google Scholar]
- Scherer PE, Williams S, Fogliano M, Baldini G, Lodish HF 1995 A novel serum protein similar to C1q, produced exclusively in adipocytes. J Biol Chem 270:26746–26749 [DOI] [PubMed] [Google Scholar]
- Pajvani UB, Du X, Combs TP, Berg AH, Rajala MW, Schulthess T, Engel J, Brownlee M, Scherer PE 2003 Structure-function studies of the adipocyte-secreted hormone Acrp30/adiponectin. Implications for metabolic regulation and bioactivity. J Biol Chem 278:9073–9085 [DOI] [PubMed] [Google Scholar]
- Waki H, Yamauchi T, Kamon J, Ito Y, Uchida S, Kita S, Hara K, Hada Y, Vasseur F, Froguel P, Kimura S, Nagai R, Kadowaki T 2003 Impaired multimerization of human adiponectin mutants associated with diabetes. Molecular structure and multimer formation of adiponectin. J Biol Chem 278:40352–40363 [DOI] [PubMed] [Google Scholar]
- Lara-Castro C, Luo N, Wallace P, Klein RL, Garvey WT 2006 Adiponectin multimeric complexes and the metabolic syndrome trait cluster. Diabetes 55:249–259 [PubMed] [Google Scholar]
- Pajvani UB, Hawkins M, Combs TP, Rajala MW, Doebber T, Berger JP, Wagner JA, Wu M, Knopps A, Xiang AH, Utzschneider KM, Kahn SE, Olefsky JM, Buchanan TA, Scherer PE 2004 Complex distribution, not absolute amount of adiponectin, correlates with thiazolidinedione-mediated improvement in insulin sensitivity. J Biol Chem 279:12152–12162 [DOI] [PubMed] [Google Scholar]
- Xu A, Chan KW, Hoo RL, Wang Y, Tan KC, Zhang J, Chen B, Lam MC, Tse C, Cooper GJ, Lam KS 2005 Testosterone selectively reduces the high molecular weight form of adiponectin by inhibiting its secretion from adipocytes. J Biol Chem 280:18073–18080 [DOI] [PubMed] [Google Scholar]
- Berg AH, Combs TP, Du X, Brownlee M, Scherer PE 2001 The adipocyte-secreted protein Acrp30 enhances hepatic insulin action. Nat Med 7:947–953 [DOI] [PubMed] [Google Scholar]
- Bouatia-Naji N, Meyre D, Lobbens S, Seron K, Fumeron F, Balkau B, Heude B, Jouret B, Scherer PE, Dina C, Weill J, Froguel P 2006 ACDC/adiponectin polymorphisms are associated with severe childhood and adult obesity. Diabetes 55:545–550 [DOI] [PubMed] [Google Scholar]
- Matsuzawa Y 2006 The metabolic syndrome and adipocytokines. FEBS Lett 580:2917–2921 [DOI] [PubMed] [Google Scholar]
- Yamauchi T, Kamon J, Waki H, Terauchi Y, Kubota N, Hara K, Mori Y, Ide T, Murakami K, Tsuboyama-Kasaoka N, Ezaki O, Akanuma Y, Gavrilova O, Vinson C, Reitman ML, Kagechika H, Shudo K, Yoda M, Nakano Y, Tobe K, Nagai R, Kimura S, Tomita M, Froguel P, Kadowaki T 2001 The fat-derived hormone adiponectin reverses insulin resistance associated with both lipoatrophy and obesity. Nat Med 7:941–946 [DOI] [PubMed] [Google Scholar]
- Okamoto Y, Kihara S, Funahashi T, Matsuzawa Y, Libby P 2006 Adiponectin: a key adipocytokine in metabolic syndrome. Clin Sci (Lond) 110:267–278 [DOI] [PubMed] [Google Scholar]
- Combs TP, Berg AH, Rajala MW, Klebanov S, Iyengar P, Jimenez-Chillaron JC, Patti ME, Klein SL, Weinstein RS, Scherer PE 2003 Sexual differentiation, pregnancy, calorie restriction, and aging affect the adipocyte-specific secretory protein adiponectin. Diabetes 52:268–276 [DOI] [PubMed] [Google Scholar]
- Fisher FF, Trujillo ME, Hanif W, Barnett AH, McTernan PG, Scherer PE, Kumar S 2005 Serum high molecular weight complex of adiponectin correlates better with glucose tolerance than total serum adiponectin in Indo-Asian males. Diabetologia 48:1084–1087 [DOI] [PubMed] [Google Scholar]
- Tonelli J, Li W, Kishore P, Pajvani UB, Kwon E, Weaver C, Scherer PE, Hawkins M 2004 Mechanisms of early insulin-sensitizing effects of thiazolidinediones in type 2 diabetes. Diabetes 53:1621–1629 [DOI] [PubMed] [Google Scholar]
- Nawrocki AR, Rajala MW, Tomas E, Pajvani UB, Saha AK, Trumbauer ME, Pang Z, Chen AS, Ruderman NB, Chen H, Rossetti L, Scherer PE 2006 Mice lacking adiponectin show decreased hepatic insulin sensitivity and reduced responsiveness to peroxisome proliferator-activated receptor γ agonists. J Biol Chem 281:2654–2660 [DOI] [PubMed] [Google Scholar]
- Wang ZV, Schraw TD, Kim JY, Khan T, Rajala MW, Follenzi A, Scherer PE 2007 Secretion of the adipocyte-specific secretory protein adiponectin critically depends on thiol-mediated protein retention. Mol Cell Biol 27:3716–3731 [DOI] [PMC free article] [PubMed] [Google Scholar]
- Basu R, Pajvani UB, Rizza RA, Scherer PE 2007 Selective downregulation of the high molecular weight form of adiponectin in hyperinsulinemia and in type 2 diabetes: differential regulation from nondiabetic subjects. Diabetes 56:2174–2177 [DOI] [PubMed] [Google Scholar]
- Hara K, Horikoshi M, Yamauchi T, Yago H, Miyazaki O, Ebinuma H, Imai Y, Nagai R, Kadowaki T 2006 Measurement of the high-molecular weight form of adiponectin in plasma is useful for the prediction of insulin resistance and metabolic syndrome. Diabetes Care 29:1357–1362 [DOI] [PubMed] [Google Scholar]
- Hada Y, Yamauchi T, Waki H, Tsuchida A, Hara K, Yago H, Miyazaki O, Ebinuma H, Kadowaki T 2007 Selective purification and characterization of adiponectin multimer species from human plasma. Biochem Biophys Res Commun 356:487–493 [DOI] [PubMed] [Google Scholar]
- Kishida K, Nagaretani H, Kondo H, Kobayashi H, Tanaka S, Maeda N, Nagasawa A, Hibuse T, Ohashi K, Kumada M, Nishizawa H, Okamoto Y, Ouchi N, Maeda K, Kihara S, Funahashi T, Matsuzawa Y 2003 Disturbed secretion of mutant adiponectin associated with the metabolic syndrome. Biochem Biophys Res Commun 306:286–292 [DOI] [PubMed] [Google Scholar]
- Qiang L, Wang H, Farmer SR 2007 Adiponectin secretion is regulated by SIRT1 and the endoplasmic reticulum oxidoreductase Ero1-Lα. Mol Cell Biol 27:4698–4707 [DOI] [PMC free article] [PubMed] [Google Scholar]
- Comuzzie AG, Funahashi T, Sonnenberg G, Martin LJ, Jacob HJ, Black AE, Maas D, Takahashi M, Kihara S, Tanaka S, Matsuzawa Y, Blangero J, Cohen D, Kissebah A 2001 The genetic basis of plasma variation in adiponectin, a global endophenotype for obesity and the metabolic syndrome. J Clin Endocrinol Metab 86:4321–4325 [DOI] [PubMed] [Google Scholar]
- Maeda N, Takahashi M, Funahashi T, Kihara S, Nishizawa H, Kishida K, Nagaretani H, Matsuda M, Komuro R, Ouchi N, Kuriyama H, Hotta K, Nakamura T, Shimomura I, Matsuzawa Y 2001 PPARγ ligands increase expression and plasma concentrations of adiponectin, an adipose-derived protein. Diabetes 50:2094–2099 [DOI] [PubMed] [Google Scholar]
- Kusminski CM, McTernan PG, Schraw T, Kos K, O’Hare JP, Ahima R, Kumar S, Scherer PE 2007 Adiponectin complexes in human cerebrospinal fluid: distinct complex distribution from serum. Diabetologia 50:634–642 [DOI] [PubMed] [Google Scholar]
Associated Data
This section collects any data citations, data availability statements, or supplementary materials included in this article.
Supplementary Materials
[Supplemental Data]
