Altered states: Involvement of phosphorylated CagA in the induction of host cellular growth changes by Helicobacter pylori (original) (raw)
Abstract
Helicobacter pylori, present in half of the world’s population, is a very successful pathogen. It can survive for decades in the human stomach with few obvious consequences to the host. However, it is also the cause of gastric diseases ranging from gastritis to ulcers to gastric cancer and has been classified a type 1 carcinogen by the World Health Organization. We have previously shown that phosphorylation of a 145-kDa protein and activation of signal transduction pathways are associated with the attachment of H. pylori to gastric cells. Here we identify the 145-kDa protein as the H. pylori CagA protein. We also show that CagA is necessary to induce a growth-factor-like phenotype (hummingbird) in host gastric cells similar to that induced by hepatocyte growth factor (HGF). Additionally, we identify a second cellular phenotype induced after attachment by H. pylori, which we call SFA (stress fiber associated). SFA is CagA independent and is produced by type I and type II H. pylori.
H;;3**elicobacter pylori** causes gastritis and duodenal ulcers in humans and has been linked as a precursor to the development of gastric cancer and mucosa-associated lymphoid tissue lymphoma. The World Health Organization classifies H. pylori as a type 1 carcinogen (1). Mechanisms by which H. pylori induces these disease states remain largely unknown. Several bacterial virulence factors, including urease, the vacuolating cytotoxin (VacA), and a pathogenicity island (PAI) (2) have been identified. The presence of the CagI PAI has been linked to virulent type I strains, whereas strains lacking the PAI are less virulent and are classified as type II (2). Our previous investigations into type I H. pylori interactions with human gastric epithelial cells have shown that attachment induces effacement of microvilli, cup/pedestal formation at the attachment site, cytoskeletal rearrangements, and Il-8 production (3, 4). Additionally, at least two signal transduction pathways become activated, resulting in tyrosine phosphorylation of proteins adjacent to the site of bacterial adherence (4). The major phosphorylated protein is 145 kDa; significantly, type I strains, but not type II strains, mediate this phosphorylation event, linking it to pathogenesis.
The molecular qualities that provide H. pylori with the ability to make a good (normal) cell turn bad (malignant) are unknown. Taking lessons from the vast amount of data available concerning cellular transformation and the limited amount of data concerning H. pylori and cellular microbiology, it is feasible to predict that H. pylori is able to modify the signal transduction pathways of the host cell, resulting in altered cellular characteristics. It has been shown that CagA, a highly antigenic protein produced by type I H. pylori and encoded for in the PAI, does not play a role in the induction of Il-8, whereas other PAI-encoded genes are essential for cytokine induction. Here we identify the 145-kDa phosphorylated protein as CagA and describe one facet of its role in H. pylori pathogenesis. We also identify two phenotypes induced by attachment of H. pylori to human gastric epithelial cells, one correlated with type I H. pylori and the CagA protein, and the other expressed by both type I and type II H. pylori.
Materials and Methods
Bacterial Strains and Cell Lines.
H. pylori strain 87A300 was obtained from the State of California, Department of Health Services, Berkeley. It is a human clinical isolate (type I) producing VacA, urease, CagA, and a contiguous cag1 PAI. This strain was grown as described (3). H. pylori strain G27 (type I) and its mutants (including the VacA knockout) and strain G50 (type II) were provided by Antonio Covacci (Immunobiological Research Institute, Sienna, Italy) and are described in ref. 4. The CagA and CagA/VacA double knockout mutants of H. pylori G27 were produced by N. Salama in our laboratory (Stanford University, Stanford, CA). AGS cells (American Type Culture Collection CRL 1739), a human gastric adenocarcinoma epithelial cell line, were grown in DMEM/F12 plus 10% fetal calf serum, except under serum starvation conditions. Madin—Darby canine kidney (MDCK) cells (a gift from J. Theriot, Stanford University) were grown in DMEM plus 10% fetal calf serum, except under serum starvation conditions.
Immunoprecipitation of Tyrosine Phosphorylated Proteins.
Lysates were prepared from AGS cells infected with H. pylori 87A300 as previously described (3) and stored at −80°C until used. Protein concentration was done by using 50,000 nominal molecular weight limit Amicon concentrators (Millipore) as described by the manufacturers. Monoclonal antiphosphotyrosine antibody (Py20, Signal Transduction Laboratories, San Diego, CA) was crosslinked via dimethylpimelimidate to ProteinG Sepharose beads (Pharmacia Biotech), washed twice with cold PBS, added to concentrated lysate, and rocked overnight at 4°C. The beads were collected (1,500 rpm × 200 g) and the supernatant aspirated. After two washes with cold PBS, protein was eluted by boiling in an equal volume of 1× SDS/PAGE loading buffer for 10 min. A second boiling was done to assure that all the protein had been released.
Mass Spectrometry Peptide Mapping.
Protein samples released from the beads were run on a 10% SDS/PAGE gel cast in a Bio-Rad Protean II unit. A parallel comparison was done with an antiphosphotyrosine immunoblotted gel to identify the band of interest. The band was excised with a razor blade and sent to the Columbia University Protein Core (New York) for enzymatic digestion with Lys-C (Roche Molecular Biochemicals) followed by matrix-assisted laser desorption ionization time-of-flight mass spectrometry (5). The resulting collection of peptide masses was matched against human and H. pylori protein databases.
Antibodies and Reagents.
Rabbit polyclonal anti-H. pylori antibodies have been previously described (4). Monoclonal and polyclonal anti-CagA were purchased from Austral Biological and used at a 1:100 dilution. FITC-conjugated goat anti-rabbit, tetramethylrhodamine B isothiocyanate (TRITC)-conjugated goat anti-mouse, and TRITC-labeled phalloidin were purchased from Sigma. Vectashield mounting medium, with and without 4′,6-diamidino-2-phenylindole (DAPI), was from Vector Laboratories. Recombinant HGF was purchased from Calbiochem.
Phase Contrast Microscopy.
AGS cells (1 × 10⁵) were plated in 60-mm tissue culture dishes by using complete media, allowed to attach for 2–4 hr, and the media removed and replaced with media without serum. The next morning, the media were aspirated, and the appropriate numbers of bacteria (5 × 10⁶, 5 × 10⁷, or 5 × 10⁸) were added in media without serum in a final volume of 2 ml. During various times after infection, phase-contrast microscopy was done by using an Olympus CK2 inverted microscope with an attached Olympus Photomicrographic PM-10AD system.
Immunofluorescence (IF) Microscopy.
For IF studies, 1 × 10⁴ AGS cells were plated per well into a four-chamber tissue culture slide (Falcon) in complete media. After 2–4 hr, the media were removed and replaced with media without serum. The next morning, the media were aspirated, and the appropriate numbers of bacteria (5 × 10⁵, 5 × 10⁶, or 5 × 10⁷) were added in media without serum, in a final volume of 400 μl. The slides were incubated and, at appropriate time points, the wells aspirated, washed five times with PBS (pH 7.4), and processed for IF. IF microscopy was done by using a Nikon Optiphot Inverted Microscope with a Nikon HFX Photographic system. Deconvolution imaging was done on an Applied Precision (Issaquah, WA) DeltaVision Deconvolution System with an Olympus IX-70 inverted microscope. Three-dimensional (3D) modeling was done by using the Deconvolution 3D model program.
Results
Identification of the 145-kDa Phosphorylated Protein.
Identification of the 145-kDa protein was accomplished by mass spectrometry analysis. Lysates from AGS cells infected with H. pylori 87A300 were prepared as previously described (4), concentrated, and immunoprecipitated by using a monoclonal antibody against phosphotyrosine crosslinked to ProteinG Sepharose beads. The immunoprecipitated proteins were removed from the beads by boiling, separated on 10% SDS/PAGE gels, and the band of interest extracted from the gel and subjected to enzymatic digestion with Lys-C followed by mass spectrometry. The resulting collection of peptide masses was matched against human and H. pylori protein databases, and the results are shown in Fig. 1. Ten peptide matches were identified, representing 16.0% of the CagA protein. These data indicated that the protein was not of host origin, as previously speculated, but is the H. pylori CagA protein. Our results corroborate and extend those of M. Stein, R. Rappuoli, and A. Covacci, showing the phosphorylation of CagA post H. pylori binding to AGS cells (personal communication).
Figure 1.
Amino acid sequence of the CagA protein from H. pylori strain 26695 (the Institute for Genomic Research). Regions that were identified from matrix-assisted laser desorption ionization time-of-flight mass spectrometry analysis of the tyrosine-phosphorylated protein are highlighted in red.
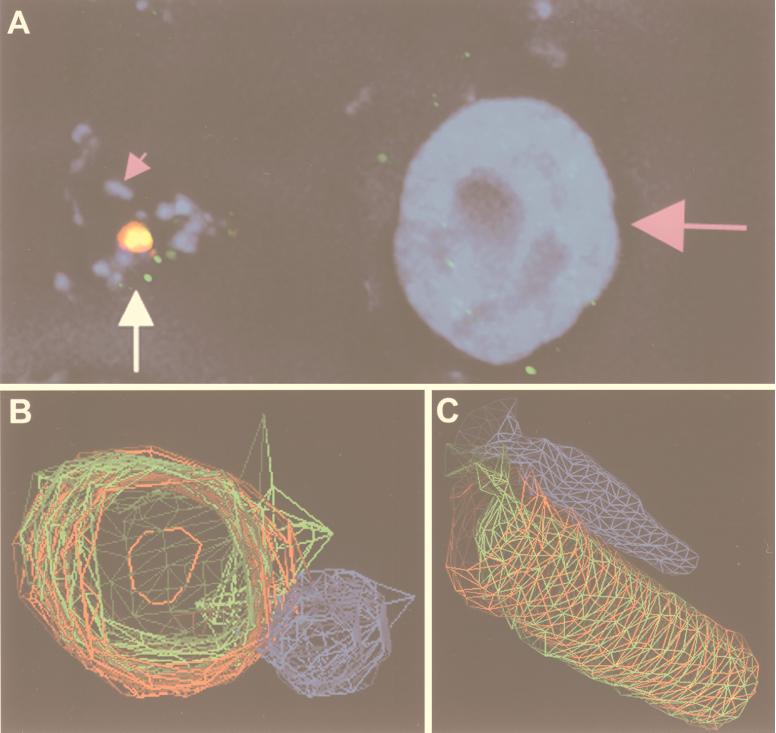
Deconvolution IF of type I H. pylori attached to AGS cells gave additional evidence of phosphorylation of the CagA protein (Fig. 2). Fig. 2A shows an image of H. pylori G27 attached to AGS cells and immunostained for nuclear DNA (host DNA and bacterial DNA are both blue), CagA (red), and phosphotyrosine (green). CagA is seen to be concentrated in a few locales that colocalize with phosphotyrosine. 3D wire modeling of the region, indicated by the arrow in Fig. 2A, is shown in Figs. 2 B and C, with 2_B_ in cross section and 2_C_ a longitudinal view. These figures illustrate that CagA has formed a cylindrical structure colocalizing with phosphotyrosine; the cylinder is attached at one end to an adjacent bacterium.
Figure 2.
Deconvolution immunofluorescence and 3D modeling of H. pylori attached to AGS cells. (A) H. pylori strain G27 attached to AGS cells was stained with DAPI [which stains the host-cell nucleus (large pink arrow) and bacteria (small pink arrow) nuclear DNA blue], anti-CagA (red), and antiphosphotyrosine (green). Colocalization of green and red appears yellow. The image is a composite of 0.2-μm Z-axis sections. The region indicated by the white arrow in A was used to generate the 3D wire models shown in B and C. C is a longitudinal view of B. (B and C) H. pylori is blue, CagA is red, and phosphotyrosine is green. Imaged and modeled on an Applied Precision DeltaVision Deconvolution System.
Location of CagA Post H. pylori Attachment.
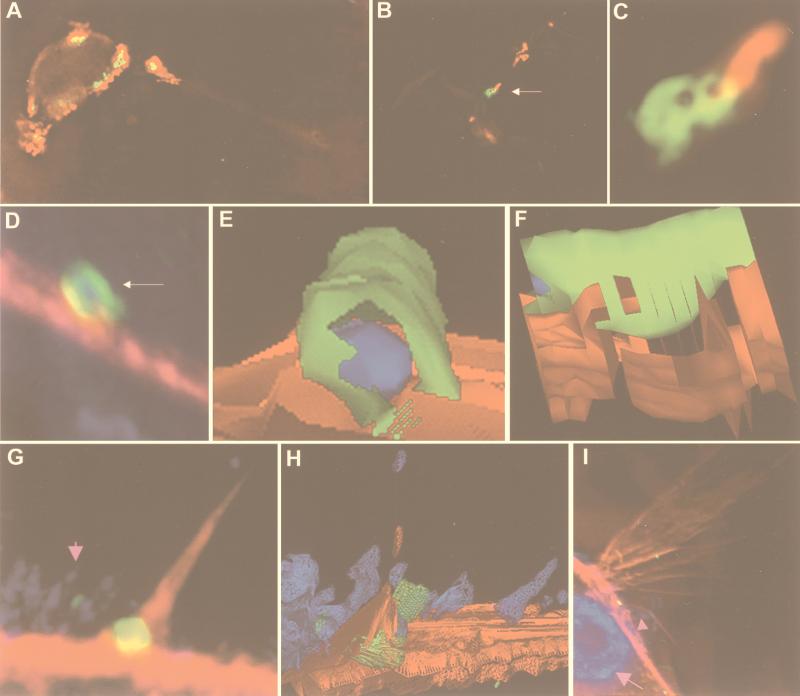
Immunofluorescent analysis of H. pylori attached to AGS cells was done by using an anti-CagA antibody and detected by deconvolution microscopy. The CagA protein can be found directly under the site of H. pylori attachment to host cells and extends into the host cytoplasm (Fig. 3 A–C). As can be seen in Fig. 3 B and C, CagA appears to be inserted by a polar mechanism into the host, forming a concentric structure adjacent to the bacterium.
Figure 3.
Deconvolution immunofluorescence and 3D modeling of H. pylori attached to AGS cells. H. pylori strain G27 (A–F), strain 87A300 (G–I). (A) H. pylori attached to AGS cells and stained for H. pylori (red) and CagA (green). Colocalization is yellow. The field is a 0.2-μm image. (B) H. pylori attached to AGS cells and stained for H. pylori (red) and CagA (green). Colocalization is yellow. The field is a volume composite of 0.2-μm images. (C) The region indicated by the arrow in B is magnified in C. (D) H. pylori attached to AGS cells and stained for H. pylori (blue), CagA (green), and actin (red). Colocalization of green and red appears yellow, of blue and green, cyan, and of red and blue, magenta. The field is a volume composite of 0.2-μm images. The region indicated by the arrow in D was used to generate the 3D solid models shown in E and F. F is a side view of E. (E and F) H. pylori is blue, CagA is green, and actin is red. (G) H. pylori (small pink arrow) attached to AGS cells and stained for H. pylori (blue), CagA (green), and actin (red). Colocalization of green and red appears yellow, of blue and green, cyan, and of red and blue, magenta. The field is a 0.2-μm image. The field in G was used to generate the 3D wire model shown in H. (H) H. pylori is blue, CagA is green, and actin is red. (I) H. pylori (small pink arrow) attached to AGS cells were stained with DAPI [which stains the host-cell nucleus (large pink arrow) and bacterial nuclear DNA blue], anti-CagA (green), and actin (red). Colocalization of green and red appears yellow, of blue and green, cyan, and of red and blue, magenta. The field is a volume composite of 0.2-μm images. Imaged and modeled on an Applied Precision DeltaVision Deconvolution System.
Data generated to produce the images in Fig. 3 D and G were used to generate 3D solid and wire models. 3D modeling of the IF images in Fig. 3D is shown in Fig. 3 E and F. These models confirm the data presented in Fig. 2, which shows the formation of CagA into a cylindrical structure. The CagA cylinder was most often associated with a bacterium inside, although vacant CagA cylinders were also seen; it was often found to be colocalized with a region of dynamic actin mobilization, such as microspike formation (Fig. 3 G and H) and cell ruffles (Fig. 3I). Not all attached H. pylori appeared to produce a CagA cylinder. These results suggest that, at early times after attachment, CagA is inserted onto or within the host cell in a polar fashion by H. pylori. Subsequently, a CagA cylinder is formed adjacent to or surrounding the bacterium; such structures are often found in close proximity to regions of actin recruitment.
Induction of a Growth Factor-Like Response in Host Gastric Cells by Type I H. pylori.
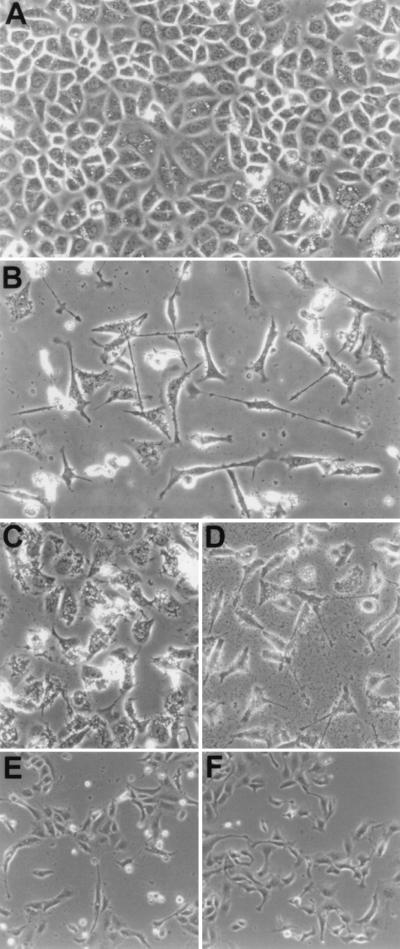
Conditions that maximized the interaction of host cells with H. pylori (multiplicity of infection >10:1) induced a growth factor-like response in AGS cells (Fig. 4). This phenotype is characterized by spreading and elongated growth of the cell, the presence of lamellipodia (thin actin sheets present at the edge of the cell), and filapodia (finger-like protrusions containing a tight bundle of actin filaments); we have labeled this the hummingbird phenotype (Fig. 4B). MDCK cells also exhibit this response after attachment of H. pylori (Fig. 4E). Induction of this phenotype is specific to type I H. pylori and is dose and time dependent (data not shown). Analysis of isogenic mutants in the PAI that had previously been shown to affect phosphorylation demonstrated that the hummingbird phenotype is correlated with the ability of isolates to induce tyrosine phosphorylation of the 145-kDa protein (data not shown). These results provide a direct link between type I virulent H. pylori isolates, the PAI, phosphorylation of CagA, and induction of host cellular growth changes.
Figure 4.
Phase contrast microscopy of AGS and MDCK cells after H. pylori attachment. (A) AGS control, 30 hr. (B) AGS plus H. pylori G27, 30 hr. (C) AGS plus H. pylori G27/cagA, 30 hr. (D) AGS plus H. pylori G27/vacA, 30 hr. (E) MDCK plus H. pylori 87A300, 24 hr. (I) MDCK plus HGF, 24 hr.
The hummingbird phenotype induced in AGS cells appeared similar to that reported for activation of the c-Met receptor by HGF in MDCK cells (6). We therefore used MDCK cells in attachment assays as above to observe whether H. pylori was able to induce a similar cellular phenotype. The phenotype produced after attachment of H. pylori to MDCK cells appeared identical to that produced on the addition of purified HGF to the cell monolayer (Fig. 4 E and F).
A Morphogenic Phenotype Induced by Type I and Type II H. pylori.
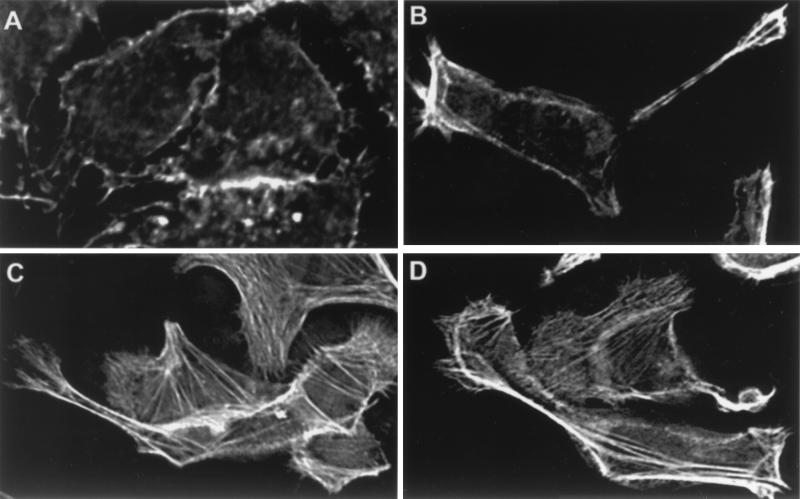
A microscopic analysis of an isogenic CagA mutant of H. pylori strain G27 provided evidence of a second phenotype, characterized by production of filapodia, multinucleation, spreading, and increased vacuolization of host cells (Fig. 4C). This phenotype became apparent for type I H. pylori at a lower multiplicity of infection (<10:1) or at earlier time points after attachment. Immunofluorescent analysis showed a strikingly high amount of stress fibers produced in host cells infected with the CagA knockout (Fig. 5) as compared with wild type; we have labeled this the stress fiber associated (SFA) phenotype. Production of this second phenotype is independent of CagA and is observed for both type I and type II H. pylori on varying the conditions of infection. Analysis of an isogenic VacA mutant and a CagA/VacA double knockout mutant of strain G27 showed that VacA is not necessary to produce either of the two phenotypes described above (Figs. 4D and 5D).
Figure 5.
Deconvolution immunofluorescence of H. pylori attached to AGS cells for 5 hr (0.2-μm slice). All fields are stained for actin. (A) AGS control, (B) plus H. pylori G27, (C) plus H. pylori G27/cagA, (D) plus H. pylori G27/cagA/vacA. Imaged on an Applied Precision DeltaVision Deconvolution System.
Discussion
One of the most intently studied proteins of H. pylori has been CagA, yet its function has not been determined. Data presented here (Figs. 1 and 2) identify CagA as the tyrosine-phosphorylated protein previously called the 145-kDa protein, and show that phosphorylation of CagA is necessary to produce a growth factor-like response of host cells. A percentage of bacteria attached to the cell surface is associated with the formation of a high concentration of CagA, which appears to form an extracellular cylindrical structure most often surrounding the bacterium (Figs. 2 and 3). It is not known why only some attached Helicobacter produce the CagA cylinders. One possibility is that the event occurs at different times after attachment for individual bacteria. Another explanation would be the involvement of a host-cell factor, either on the cell surface or in the cytoplasm, which is necessary for generation of the CagA cylinders. The locations of the CagA cylinders are often associated with regions of active actin reorganization, such as microspike formation and ruffles. This association might indicate that the CagA cylinders function (by an unknown mechanism) to direct host-cell movement by directing cell elongation and motion. The CagA cylinder located midway up the ruffle in Fig. 3I is not associated with a bacterium, although there are bacteria present at the base of the ruffle. This occurrence suggests that actin reorganization might result after formation of a CagA cylinder.
Insertion of CagA into the host cell appears to occur via the H. pylori type IV secretion system encoded by the cag PAI (M. Stein, R. Rappuoli, and A. Covacci, personal communication). This characteristic, along with the occurrence of phosphorylation of CagA after attachment to host cells and its association with cytoskeletal rearrangements, allows an analogy to be drawn with the enteropathogenic Escherichia coli Tir protein (7). Tir, encoded by the bacterial EspE gene, was originally believed to be a eukaryotic protein. Subsequent to secretion of Tir into the host membrane by the bacterial type III secretion system, Tir becomes tyrosine phosphorylated and acts as a receptor for intimin binding on the bacterial surface, inducing host-cell signaling pathways.
We have shown that H. pylori is able to induce cellular changes on attachment to cultured gastric epithelial cells. The phenotypic changes induced by H. pylori are time and dose dependent. This characteristic is reminiscent of that produced by bacterial toxins on host cells and draws attention to the fact that many of the changes induced by toxins result from interference of the same signal transduction factors as those induced by eukaryotic growth factors (for a review, see ref. 8). One of the identified cellular changes (hummingbird) is the dramatic elongation and spreading of host cells, including production of filapodia and lamellipodia. The hummingbird response is induced only by type I H. pylori and depends on phosphorylation of the bacterial CagA protein. This response mimics that observed for HGF activation of the c-Met receptor (6). The second host response (SFA), characterized by production of numerous stress fibers, filapodia, multinucleation, cell spreading, and increased vacuolization, is induced by both type I and type II H. pylori and is CagA independent. This cellular response is similar to that produced by the E. coli CNF-1 toxin, which activates the Ras GTPases Rho, Rac, and cdc42 (9, 10). The SFA cellular phenotype is also similar to that produced by activation of the guanine nucleotide exchange factor Tiam1, which activates Rac (11) and has been demonstrated to enhance or suppress cell–cell adhesion and migration, depending on cell type and substrate (12, 13). The vacuolating toxin of H. pylori (VacA), which interferes with vesicle trafficking by causing accumulation of endosomal-lysosomal vacuoles containing Rab7, does not play a role in either of the described host response phenotypes (Figs. 4 and 5).
We have shown that tyrosine phosphorylation of CagA occurs and is correlated with pathogenesis induced by type I H. pylori to gastric cells. The cellular motility induced by the type I H. pylori may play an important role in the carcinogenesis associated with type I infection. The host cellular changes associated with CagA (hummingbird) literally overshadowed the second category of alterations (SFA) induced by both type I and II H. pylori. Type II H. pylori have not been associated with gastric cancer and appear to induce only a mild inflammatory cell response. We have identified virulence traits present in Type II H. pylori, suggesting that the SFA phenotype may also play a role in the pathogenesis of gastritis. This discovery may shed light onto how type II H. pylori cause disease.
Acknowledgments
We gratefully acknowledge R. Rappouli and A. Covacci for sharing data and for their personal communications. This research was supported by National Institutes of Health Grant AI23796 (to L.S.T.).
Abbreviations
PAI
pathogenicity island
VacA
vacuolating cytotoxin
DAPI
4′,6-diamidino-2-phenylindole
IF
immunofluorescence
3D
three-dimensional
HGF
hepatocyte growth factor
SFA
stress fiber associated
MDCK
Madin–Darby canine kidney
References
- 1.Logan R P. Lancet. 1994;344:1078–1079. doi: 10.1016/s0140-6736(94)91729-9. [DOI] [PubMed] [Google Scholar]
- 2.Censini S, Lange C, Xiang Z, Crabtree J E, Ghiara P, Borodovsky M, Rappuoli R, Covacci A. Proc Natl Acad Sci USA. 1996;93:14648–14653. doi: 10.1073/pnas.93.25.14648. [DOI] [PMC free article] [PubMed] [Google Scholar]
- 3.Segal E D, Falkow S, Tompkins L S. Proc Natl Acad Sci USA. 1996;93:1259–1264. doi: 10.1073/pnas.93.3.1259. [DOI] [PMC free article] [PubMed] [Google Scholar]
- 4.Segal E D, Lange C, Covacci A, Tompkins L S, Falkow S. Proc Natl Acad Sci USA. 1997;94:7595–7599. doi: 10.1073/pnas.94.14.7595. [DOI] [PMC free article] [PubMed] [Google Scholar]
- 5.Fernandez J, Gharahdaghi F, Mische S M. Electrophoresis. 1998;19:1036–1045. doi: 10.1002/elps.1150190619. [DOI] [PubMed] [Google Scholar]
- 6.Ridley A J, Comoglio P M, Hall A. Mol Cell Biol. 1995;15:1110–1122. doi: 10.1128/mcb.15.2.1110. [DOI] [PMC free article] [PubMed] [Google Scholar]
- 7.Kenny B, DeVinney R, Stein M, Reinscheid D J, Frey E A, Finlay B B. Cell. 1997;91:511–520. doi: 10.1016/s0092-8674(00)80437-7. [DOI] [PubMed] [Google Scholar]
- 8.Popoff M R. Toxicon. 1998;36:665–685. doi: 10.1016/s0041-0101(97)00100-1. [DOI] [PubMed] [Google Scholar]
- 9.Fiorentini C, Fabbri A, Flatau G, Donelli G, Matarrese P, Lemichez E, Falzano L, Boquet P. J Biol Chem. 1997;272:19532–19537. doi: 10.1074/jbc.272.31.19532. [DOI] [PubMed] [Google Scholar]
- 10.Lerm M, Selzer J, Hoffmeyer A, Rapp U R, Aktories K, Schmidt G. Infect Immun. 1999;67:496–503. doi: 10.1128/iai.67.2.496-503.1999. [DOI] [PMC free article] [PubMed] [Google Scholar]
- 11.Michiels F, Habets G G, Stam J C, van der Kammen R A, Collard J G. Nature (London) 1995;375:338–340. doi: 10.1038/375338a0. [DOI] [PubMed] [Google Scholar]
- 12.Hordijk P L, ten Klooster J P, van der Kammen R A, Michiels F, Oomen L C, Collard J G. Science. 1997;278:1464–1466. doi: 10.1126/science.278.5342.1464. [DOI] [PubMed] [Google Scholar]
- 13.Saunders N J, Peden J F, Hood D W, Moxon E R. Mol Microbiol. 1998;27:1091–1098. doi: 10.1046/j.1365-2958.1998.00768.x. [DOI] [PubMed] [Google Scholar]


