Whole Chromosome alterations predict survival in high risk neuroblastoma without MYCN amplification (original) (raw)
. Author manuscript; available in PMC: 2009 Sep 1.
Abstract
Purpose
Patients with stage 4 neuroblastoma over the age of 500 days without MYCN amplification have a survival rate of less than 30% and there are currently no reliable means of predicting which of these patients will survive or succumb from the disease. The goal of this study is to develop a DNA copy number based prognostic profile for these patients.
Experimental Design
We have used comparative genomic hybridization (CGH) to identify genome copy number changes that can predict outcome in patients with stage 4 neuroblastoma without MYCN amplification.
Results
A strong correlation of patient survival with the presence of whole chromosome changes (WCC ≥2) was observed, even in the group of patients older than 500 days at time of diagnosis. This novel prognostic marker demonstrated a significant dependence on the date of diagnosis; patients with WCC ≥2 diagnosed after 1998 had a significantly higher probability of survival compared to those diagnosed earlier. At the same time, no such time dependence was found among the samples with WCC<2, suggesting that medical progress patients in recent years has particularly benefited those patients with a stage 4 non MYCN amplified disease if WCC ≥2 were present.
Conclusions
In this pilot study, we present a novel prognostic marker for survival of high risk NB patients over age of 500 days without MYCN amplification and diagnosed after 1998. Further validation study is required to establish this risk stratification for these patients.
Keywords: Neuroblastoma, Comparative Genomic Hybridization, Prognosis Prediction
Introduction
Neuroblastoma (NB), the most common solid extracranial tumor of childhood, is derived from the sympathetic nervous system and is the cause for 15% of all cancers related to death of children in the United States(1). A hallmark of the disease is its heterogeneity (2), the outcome ranges from spontaneous regression to death. Treatment options vary accordingly, from observation only via a minimal therapy using surgery alone to an aggressive use of high-dose chemo- and radio therapy combined with autologous bone marrow transplant, depending on the expected aggressiveness of the tumor. Correct stratification of a diagnosed tumor is thus a key in determining a patient’s treatment. In North America the Children’s Oncology Group’s (COG) currently stratifies patients into three groups (low, intermediate and high risk) based on a well-characterized panel of clinical and tumor biological factors. The survival probability for patients with low risk disease exceeds 90%, however it is currently only approximately 30% (3) in the high risk group. Although the survival rate for high risk patients is very low, there is some evidence of modest improvement in this rate compared to ~20 years ago when the survival rate was approximately 10% (4).
COG’s risk stratification is based on INSS stage, Shimada histology, patient’s age and MYCN amplification status (5). The lower, localized stages (INSS stage 1 and 2a/b) are most of the time associated with a “low” risk while more advanced stages (INSS stage 3 and 4) imply “intermediate” or high” risk. Specific combinations of the other factors modify this assessment: if all other negative factors, namely age > 365 days, unfavorable Shimada histology and MYCN amplification, are present simultaneously in stage 2, the disease is stratified as high risk. Conversely, the aggressiveness of NB is slightly lowered (to “intermediate”) if both, MYCN amplification is absent and the patient is either young (< 365 days), or only in stage 3 NB, the tumor has a favorable Shimada histology. An effort by the International Neuroblastoma Risk Group (INRG) to develop a new risk stratification is underway (1), aiming to replace the currently regionally varying risk assessments. While still in a draft stage, the new risk stratification will very likely adjust the age cut-off from one year to 18 month to adapt for recent observations (6) that this higher cutoff improves prognostic precision.
The advent of high throughput molecular profiling techniques has led to increased efforts to identify additional molecular prognostic markers in NB, probably motivated in part by the hope to further refine the existing risk stratification, ultimately leading to better informed treatment decisions. In recent years microarray techniques have been used to analyze NB mRNA transcript levels, DNA copy number (7–11) and micro-RNA expression levels (12). Five studies (13–17) reported development of prognostic classifiers based on mRNA level analysis. The various gene sets overlapped only slightly, thus making a biologic interpretation more difficult and slowing down a potential adaptation in the clinic. A significant part of the complexity of mRNA transcription profiles arises from the unknown dynamics of the transcription regulation network. The absence of any dynamic regulation makes classifiers derived from DNA copy number alterations much simpler in this respect. Furthermore, the “normal” state of a cell, two DNA copies (up to copy number polymorphisms), is exactly known, which further reduces the complexity of copy number based analysis compared to expression profiles, where much less is known about the “ground state” of expression levels in the corresponding normal cell. Besides MYCN amplification which is a major factor in the current risk stratification, other genomic alterations were also reported to correlate with outcome. Near triploidy correlates with positive outcome, however only in patients younger than one year (18). Loss of chromosome 11q23 is frequently observed in single copy MYCN neuroblastoma and was found to correlate with negative outcome (19, 20). Also combinations of complex cytogenetic aberration patterns and expression profiles were recently shown to be complementary usable as predictive markers for patient survival (21).
The goal of this study was to develop a DNA copy number based prognostic profile for high risk NB which complements the existing stratification factors. Array based comparative genomic hybridization (A-CGH) was used to generate DNA copy number data. Earlier work had indicated a strong correlation of the diverse factors in the current risk stratification of NB (11, 22) such as stage and MYCN status with the pattern of recurrent genomic alterations. We focused in this report on INSS stage 4 neuroblastomas without MYCN amplification for which there remains no currently available methods to predict which of them over the age of 500 days will survive on current conventional therapy.
Materials and Methods
Tumor Samples
Fifty-eight pretreatment primary neuroblastoma tumor samples with outcome annotations and follow up for at least 3 years were obtained retrospectively from three sources presenting time of diagnosis between 1992 and 2002 (Table 1). Of these, 32 samples came from patients older than 500 days at time of diagnosis. Metastatic stage 4 neuroblastomas in patients older than approximately 18 month are considered high risk while in younger patients the disease is currently stratified as an intermediate risk. All of the patients were treated according to local or national guidelines that followed similar protocols. All of the samples were anonymized, and our protocol was deemed exempt from the NIH Multiple Project Assurance. Pretreatment tumor samples were snap-frozen in liquid nitrogen after removal. Tumors were diagnosed as neuroblastoma by local centers experienced in the management of these cancers. Patients were divided into two outcome groups: the “good-outcome” group had event-free survival (i.e., neither relapsed nor neuroblastoma progression) (n = 29), and “poor-outcome” died due to the disease (n = 29).
Table 1. Sample Details.
Fifty-eight pre-treatment tumor samples from stage 4 without MYCN amplification were used. Of those, 29 survived without event for at least 3 years (denoted by a “+” in the outcome column) and 29 died of the disease (“−”). Patients were diagnosed between 1991 and 2002 (Diagnosis date), the age at date of diagnosis is given in days. Column “BP17” indicates presence (“yes”) or absence (“no”) of a breakpoint leading to a gain on chromosome 17; column “11q−BP” indicates a breakpoint leading to loss of genomic material on the q-arm of chromosome 11. BP, a chromosomal breakpoint. Columns “1” to “22” and “X”, “Y” indicate gain (“+”), loss (“−”) or no (“0“) whole chromosome change of the corresponding chromosome.
| ID | Surv | DoD | Age | 17q+ BP | 11q− BP | 1 | 2 | 3 | 4 | 5 | 6 | 7 | 8 | 9 | 10 | 11 | 12 | 13 | 14 | 15 | 16 | 17 | 18 | 19 | 20 | 21 | 22 | Σ |
|---|---|---|---|---|---|---|---|---|---|---|---|---|---|---|---|---|---|---|---|---|---|---|---|---|---|---|---|---|
| NB571:+ | + | 02/94 | 4 | No | No | + | 0 | 0 | 0 | 0 | + | 0 | + | 0 | 0 | − | + | + | 0 | + | 0 | + | 0 | 0 | 0 | + | + | 10 |
| NB24:+ | + | 10/00 | 15 | No | No | 0 | 0 | − | − | 0 | 0 | + | − | 0 | − | − | 0 | + | 0 | − | − | + | 0 | 0 | − | 0 | 0 | 11 |
| NB508:+ | + | 09/00 | 75 | No | No | 0 | 0 | − | 0 | 0 | + | + | 0 | 0 | − | 0 | + | 0 | − | − | − | + | + | 0 | 0 | − | 0 | 11 |
| NB502:+ | + | 11/99 | 103 | Yes | Yes | 0 | 0 | 0 | 0 | 0 | 0 | 0 | 0 | 0 | 0 | 0 | 0 | 0 | 0 | 0 | 0 | 0 | 0 | 0 | 0 | 0 | 0 | 0 |
| NB506:+ | + | 05/00 | 119 | No | No | 0 | 0 | + | − | 0 | + | + | + | + | + | 0 | + | + | − | 0 | − | + | 0 | − | 0 | + | 0 | 14 |
| NB504:+ | + | 03/00 | 124 | No | No | + | + | + | 0 | 0 | + | + | + | 0 | + | 0 | + | + | 0 | + | 0 | + | + | + | 0 | 0 | + | 14 |
| NB516:+ | + | 11/00 | 151 | No | No | 0 | + | 0 | 0 | 0 | + | + | 0 | 0 | + | 0 | + | + | − | 0 | 0 | + | 0 | 0 | 0 | 0 | + | 9 |
| NB519:+ | + | 03/99 | 156 | No | No | 0 | + | − | 0 | 0 | + | + | 0 | 0 | + | − | 0 | + | − | 0 | 0 | + | + | 0 | 0 | 0 | 0 | 10 |
| NB565:+ | + | 06/93 | 161 | No | No | + | + | 0 | 0 | + | + | + | 0 | + | 0 | 0 | + | 0 | 0 | 0 | 0 | + | 0 | 0 | 0 | 0 | + | 9 |
| NB523:+ | + | 07/99 | 181 | Yes | No | 0 | 0 | 0 | 0 | 0 | 0 | 0 | 0 | 0 | 0 | 0 | 0 | 0 | 0 | 0 | 0 | 0 | 0 | 0 | 0 | 0 | 0 | 0 |
| NB510:+ | + | 12/00 | 201 | No | No | 0 | 0 | 0 | 0 | 0 | 0 | 0 | − | − | 0 | 0 | + | + | − | − | − | + | 0 | 0 | − | 0 | + | 10 |
| NB517-2:+ | + | 03/01 | 267 | No | No | 0 | 0 | + | 0 | 0 | + | 0 | + | − | − | 0 | 0 | 0 | 0 | 0 | − | + | + | 0 | − | + | + | 11 |
| NB30:+ | + | 11/97 | 270 | Yes | Yes | 0 | 0 | 0 | 0 | 0 | 0 | + | 0 | 0 | 0 | 0 | 0 | 0 | 0 | 0 | 0 | 0 | 0 | 0 | 0 | 0 | 0 | 1 |
| NB26:+ | + | 04/00 | 365 | Yes | Yes | 0 | 0 | 0 | 0 | 0 | 0 | 0 | 0 | 0 | 0 | 0 | 0 | 0 | 0 | 0 | 0 | 0 | 0 | 0 | 0 | 0 | 0 | 0 |
| NB538:+ | + | 02/99 | 418 | No | No | 0 | + | 0 | 0 | + | + | + | 0 | 0 | 0 | 0 | + | + | 0 | 0 | 0 | + | + | 0 | + | 0 | + | 10 |
| NB32:+ | + | 02/98 | 425 | Yes | No | 0 | 0 | 0 | 0 | 0 | 0 | + | − | 0 | 0 | 0 | + | 0 | − | 0 | 0 | 0 | 0 | 0 | 0 | 0 | 0 | 4 |
| NB35:+ | + | 04/97 | 915 | Yes | Yes | 0 | 0 | 0 | 0 | 0 | 0 | 0 | 0 | 0 | 0 | 0 | 0 | 0 | 0 | 0 | 0 | + | + | 0 | 0 | 0 | + | 3 |
| NB505:+ | + | 04/00 | 1030 | Yes | Yes | 0 | 0 | 0 | 0 | 0 | + | + | 0 | 0 | 0 | 0 | + | + | 0 | 0 | 0 | 0 | 0 | 0 | 0 | 0 | + | 5 |
| NB259:+ | + | 10/94 | 1143 | Yes | No | 0 | 0 | 0 | 0 | 0 | 0 | 0 | 0 | 0 | 0 | 0 | 0 | 0 | 0 | 0 | 0 | 0 | 0 | 0 | 0 | 0 | 0 | 0 |
| NB246:+ | + | 05/01 | 1305 | Yes | Yes | 0 | 0 | 0 | 0 | 0 | 0 | 0 | 0 | 0 | 0 | 0 | 0 | 0 | 0 | 0 | 0 | 0 | + | 0 | 0 | 0 | 0 | 1 |
| NB242:+ | + | 10/99 | 1360 | Yes | Yes | 0 | 0 | 0 | 0 | 0 | + | + | 0 | − | 0 | 0 | + | + | + | − | − | + | + | − | 0 | − | 0 | 12 |
| NB515:+ | + | 06/01 | 1408 | Yes | Yes | 0 | + | 0 | + | 0 | + | + | + | 0 | + | 0 | + | + | 0 | + | 0 | + | + | 0 | + | + | + | 14 |
| NB503:+ | + | 03/00 | 1410 | Yes | Yes | 0 | 0 | 0 | 0 | 0 | 0 | 0 | 0 | 0 | 0 | 0 | 0 | + | 0 | 0 | 0 | 0 | + | 0 | 0 | 0 | 0 | 2 |
| NB282:+ | + | 01/99 | 1460 | Yes | Yes | + | + | − | − | 0 | 0 | + | + | − | − | − | − | + | 0 | 0 | 0 | 0 | + | + | 0 | 0 | 0 | 13 |
| NB555:+ | + | 01/01 | 1806 | Yes | Yes | 0 | 0 | 0 | 0 | 0 | + | + | 0 | + | 0 | 0 | + | 0 | + | − | 0 | 0 | + | + | + | + | + | 11 |
| NB119:+ | + | unknown | 1808 | Yes | Yes | 0 | 0 | 0 | 0 | 0 | 0 | + | 0 | 0 | 0 | 0 | + | + | 0 | 0 | 0 | + | + | + | + | 0 | 0 | 7 |
| NB500:+ | + | 04/95 | 1844 | Yes | Yes | 0 | 0 | 0 | 0 | 0 | 0 | + | + | + | + | 0 | + | 0 | 0 | 0 | + | + | + | + | + | 0 | 0 | 10 |
| NB88:+ | + | 07/01 | 2445 | Yes | Yes | 0 | 0 | 0 | 0 | + | 0 | + | 0 | 0 | 0 | 0 | 0 | + | 0 | 0 | 0 | 0 | + | 0 | 0 | 0 | 0 | 4 |
| NB514:+ | + | 05/01 | 4248 | No | No | 0 | 0 | − | 0 | 0 | + | + | 0 | 0 | 0 | 0 | + | 0 | 0 | − | 0 | + | + | 0 | 0 | − | 0 | 8 |
| NB598:- | − | 05/98 | 177 | No | No | 0 | 0 | 0 | + | 0 | 0 | 0 | 0 | 0 | 0 | 0 | 0 | + | 0 | 0 | 0 | 0 | 0 | 0 | + | 0 | 0 | 3 |
| NB524:- | − | 04/93 | 182 | No | No | 0 | + | − | + | 0 | + | + | 0 | − | 0 | − | + | + | − | 0 | 0 | + | + | 0 | + | 0 | + | 14 |
| NB576:- | − | 10/02 | 210 | No | No | 0 | 0 | 0 | 0 | 0 | 0 | 0 | 0 | 0 | 0 | 0 | + | 0 | 0 | 0 | 0 | 0 | 0 | 0 | 0 | 0 | 0 | 1 |
| NB553:- | − | 01/01 | 325 | Yes | Yes | 0 | 0 | 0 | − | 0 | 0 | 0 | 0 | 0 | 0 | 0 | 0 | 0 | 0 | 0 | 0 | 0 | 0 | 0 | 0 | 0 | 0 | 1 |
| NB284:- | − | 10/97 | 550 | Yes | Yes | 0 | 0 | 0 | 0 | 0 | 0 | 0 | 0 | 0 | 0 | 0 | 0 | 0 | 0 | 0 | 0 | 0 | 0 | 0 | 0 | 0 | 0 | 0 |
| NB275:- | − | 11/95 | 575 | Yes | No | 0 | 0 | 0 | 0 | 0 | 0 | 0 | 0 | 0 | 0 | 0 | 0 | 0 | 0 | 0 | 0 | 0 | 0 | 0 | 0 | 0 | 0 | 0 |
| NB548:- | − | 08/00 | 587 | Yes | Yes | 0 | 0 | 0 | 0 | 0 | 0 | 0 | 0 | 0 | 0 | 0 | 0 | 0 | 0 | 0 | 0 | 0 | 0 | 0 | 0 | 0 | 0 | 0 |
| NB202:- | − | 12/94 | 613 | Yes | Yes | 0 | 0 | 0 | 0 | 0 | 0 | 0 | 0 | 0 | 0 | 0 | 0 | 0 | 0 | 0 | 0 | 0 | 0 | 0 | 0 | 0 | 0 | 0 |
| NB279:- | − | 06/00 | 730 | Yes | Yes | 0 | 0 | 0 | 0 | 0 | 0 | 0 | 0 | 0 | 0 | 0 | 0 | 0 | 0 | 0 | 0 | 0 | 0 | 0 | 0 | 0 | 0 | 0 |
| NB217b:- | − | 11/96 | 730 | Yes | Yes | + | + | 0 | − | − | + | + | − | − | − | 0 | + | 0 | 0 | − | 0 | + | + | 0 | + | 0 | 0 | 14 |
| NB526:- | − | 05/93 | 778 | Yes | Yes | 0 | 0 | 0 | 0 | + | 0 | + | 0 | 0 | 0 | 0 | 0 | + | 0 | 0 | 0 | 0 | + | 0 | 0 | 0 | 0 | 4 |
| NB276:- | − | 01/96 | 910 | No | No | 0 | 0 | 0 | 0 | 0 | 0 | + | + | − | 0 | − | 0 | + | 0 | 0 | − | + | + | 0 | 0 | 0 | 0 | 8 |
| NB210:- | − | 01/96 | 910 | No | No | 0 | + | 0 | 0 | 0 | 0 | + | + | − | 0 | − | − | + | − | 0 | − | + | + | 0 | 0 | 0 | 0 | 11 |
| NB206:- | − | 02/95 | 970 | Yes | Yes | 0 | 0 | 0 | 0 | 0 | 0 | 0 | 0 | 0 | 0 | 0 | 0 | 0 | 0 | 0 | 0 | 0 | 0 | 0 | 0 | 0 | 0 | 0 |
| NB550:- | − | 10/00 | 1115 | Yes | Yes | 0 | 0 | 0 | 0 | 0 | 0 | 0 | 0 | 0 | 0 | 0 | 0 | 0 | 0 | 0 | 0 | 0 | 0 | 0 | 0 | 0 | 0 | 0 |
| NB540:- | − | 01/99 | 1238 | Yes | Yes | 0 | 0 | 0 | 0 | 0 | 0 | 0 | 0 | 0 | 0 | 0 | 0 | 0 | 0 | 0 | 0 | 0 | 0 | 0 | 0 | 0 | 0 | 0 |
| NB591:- | − | 11/97 | 1403 | Yes | No | 0 | 0 | 0 | 0 | 0 | 0 | 0 | 0 | 0 | 0 | 0 | 0 | 0 | 0 | 0 | 0 | + | 0 | 0 | 0 | 0 | 0 | 1 |
| NB205:- | − | 03/95 | 1425 | Yes | Yes | 0 | 0 | 0 | 0 | 0 | + | 0 | + | 0 | 0 | 0 | 0 | + | 0 | − | 0 | 0 | 0 | − | 0 | 0 | 0 | 5 |
| NB273:- | − | 08/95 | 1460 | Yes | Yes | 0 | 0 | 0 | 0 | 0 | 0 | 0 | 0 | 0 | 0 | 0 | 0 | + | 0 | 0 | 0 | 0 | 0 | 0 | 0 | 0 | 0 | 1 |
| NB287:- | − | 10/93 | 1460 | Yes | Yes | 0 | 0 | 0 | 0 | 0 | 0 | 0 | 0 | 0 | 0 | 0 | 0 | 0 | 0 | 0 | 0 | 0 | 0 | 0 | 0 | 0 | 0 | 0 |
| NB207:- | − | 05/95 | 1610 | Yes | Yes | 0 | 0 | 0 | 0 | 0 | 0 | 0 | 0 | 0 | 0 | 0 | 0 | 0 | 0 | 0 | 0 | 0 | + | 0 | 0 | 0 | 0 | 1 |
| NB586:- | − | 06/94 | 1622 | Yes | Yes | 0 | 0 | − | − | 0 | 0 | + | 0 | 0 | 0 | 0 | 0 | + | 0 | 0 | 0 | 0 | 0 | 0 | 0 | 0 | 0 | 4 |
| NB8:- | − | 04/98 | 1697 | Yes | Yes | 0 | 0 | 0 | 0 | 0 | 0 | 0 | 0 | 0 | 0 | 0 | 0 | + | 0 | 0 | 0 | 0 | + | 0 | 0 | 0 | 0 | 2 |
| NB283:- | − | 04/99 | 1900 | Yes | Yes | 0 | 0 | 0 | 0 | 0 | 0 | + | 0 | 0 | 0 | 0 | + | + | 0 | 0 | 0 | 0 | + | 0 | 0 | 0 | 0 | 4 |
| NB522:- | − | 04/96 | 1990 | Yes | Yes | 0 | 0 | 0 | 0 | 0 | 0 | + | 0 | 0 | 0 | 0 | 0 | 0 | 0 | 0 | 0 | 0 | 0 | 0 | 0 | 0 | 0 | 1 |
| NB532:- | − | 09/91 | 2948 | Yes | No | 0 | 0 | 0 | 0 | 0 | 0 | 0 | 0 | 0 | 0 | 0 | 0 | + | 0 | 0 | 0 | 0 | 0 | 0 | 0 | 0 | 0 | 1 |
| NB575:- | − | 11/94 | 3428 | Yes | Yes | 0 | 0 | 0 | 0 | 0 | 0 | 0 | − | − | 0 | 0 | + | 0 | 0 | 0 | 0 | 0 | + | 0 | 0 | 0 | 0 | 4 |
| NB543:- | − | 08/99 | 4171 | Yes | No | 0 | 0 | 0 | 0 | 0 | 0 | + | 0 | 0 | 0 | 0 | 0 | 0 | 0 | 0 | 0 | 0 | 0 | 0 | 0 | 0 | 0 | 1 |
| NB59:- | − | 06/95 | 5500 | No | No | 0 | 0 | − | 0 | 0 | 0 | 0 | 0 | 0 | 0 | 0 | 0 | 0 | 0 | 0 | 0 | 0 | 0 | − | 0 | 0 | 0 | 2 |
Oligonucleotide and cDNA Array CGH
Patient tumor genomic DNA samples were extracted from interphase of a Trizol preparation according to the manufacturer’s instructions (Invitrogen, Gaithersburg, MD). Genomic DNA was treated with RNase A and protease (Qiagen, Valencia, CA), and purified by phenol/chloroform extraction followed by ethanol precipitation. Control (reference) male human genomic DNA samples (Promega, Madison, WI) were used in all hybridizations. For oligonucleotide array CGH experiments, array construction, DNA labeling, hybridization, and washing were performed as described in detail by Selzer et al. (9). Briefly, the tiling-path CGH arrays were designed for whole-genome analysis with up to 385,000 oligonucleotides from unique sequence regions that are of variable length to achieve a melting temperature of 76°C. Genomic DNA was randomly fragmented by sonication to a size range of 500–2,000 bp. Each DNA sample is directly labeled by random primer extension labeling (Cy3 for tumor sample and Cy5 for the reference DNA). The Cy3 labeled tumor sample and Cy5 labeled reference sample were combined and applied for hybridization as described (9). Data was extracted from scanned images using NimbleScan 2.0 extraction software (NimbleGen Systems, Inc.). For cDNA array CGH experiments, cDNA microarray preparation, DNA labeling, hybridization, and washing were performed as described previously (7, 22). The fluorescent ratios were normalized for each array using a pin-based normalization method.
Data Normalization, Identification of whole chromosome changes
DNA copy number log-ratios between tumor DNA and reference DNA on each microarray were standardized by mode centering: a histogram of DNA copy numbers was created for each microarray, the numerical value of the center of the maximal peak in this histogram was then subtracted from the unprocessed, raw log-ratio data. In other words, “no copy number change” was associated with the most frequent copy number level, thus removing ploidy information. The data entering the histogram was pre-processed by using a running average smoothing kernel with length l=50 adjacent probes in order to regularize the histogram. A chromosome was identified with “whole chromosome gain (loss)” if the running average (l=100) along the chromosome was s = 3 standard deviations larger (or smaller) than zero for at least 95% of all loci. The delineation of whole chromosome changes did not overly depend on the number of standard deviations, varying this parameter within reasonable limits _s_=2.5 … 4 did not change the results of our analysis. Localized copy number alterations (a p-value for the presence of an aberration) were identified using the topological statistics algorithm (23).
Statistical analysis, evaluation of prognosis in survival
The frequency
of localized genomic alterations was estimated using a parameter free method (7, 22). Rather than counting the number of samples Nw of the total number Nt with gains (or losses) by selecting those samples exceeding a preset threshold, this method obtains an estimator for the frequency by calculating the average p-value of gains (or losses, respectively). This quantity is proportional to the frequency, as can be seen by calculating the expectation value
p¯≈(0.5×Nnochange)+(0×Nw)Nt=(1−ν)×0.5,
The probability of survival was calculated using the Kaplan-Meier method, and the significance of the difference between Kaplan-Meier curves was calculated using the log rank test.
Results
A particular interest of CGH studies lies in the identification of recurrent genomic alterations as those regions may code for products relevant for the biology of that cancer. Figure 1 displays an estimator for the frequencies of gains or losses across the genome, the average p-value for the presence of a gain (or loss) across all samples (22). This quantity is a parameter free estimator of the familiar frequency of gains and losses (see methods section for details), an average p-value p < 0.5/N ~ 0.01 (with N=58 samples) indicates gain (or loss) in all samples, while p ~ 0.5 indicates gain (loss) in none of the samples. The plot confirms earlier findings of recurrent alterations typical for stage 4 NB without MYCN amplification (7, 10, 22): loss on chromosome 11q, 3p and gains on chromosome 17q. Whole chromosome gains were also visible, most notably for chromosome 7, 12 and 17. Beyond these established copy number variations, no novel recurrent alterations were identified in this analysis.
Fig. 1. Recurrent genomic alterations.
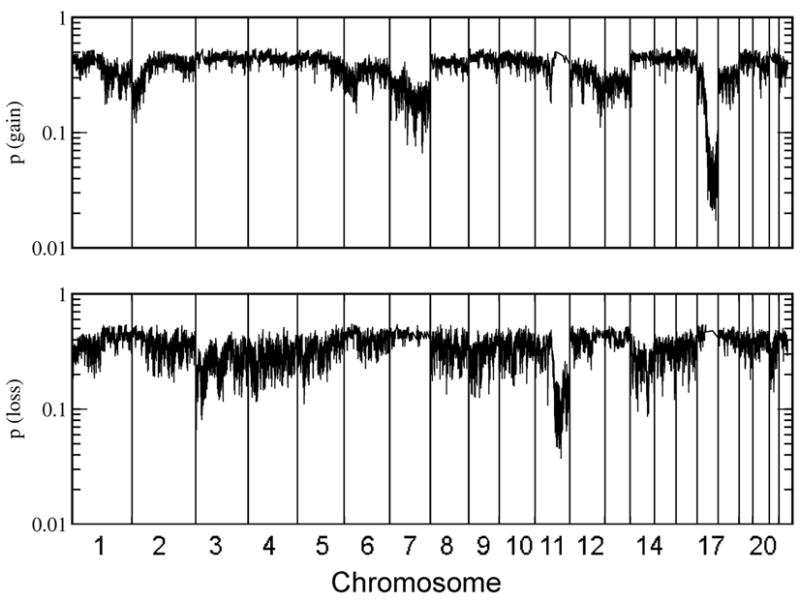
Shown is the average _p_-value for the presence of gain (top panel) or loss (bottom panel) of genomic material. A low average _p_-value indicates a frequent genomic variation among samples, a value around 0.5 indicates that none of the samples had a lost at a given location (22).
Loss of chromosome 11q has been linked (19) with negative outcome. In this study samples with loss of part of the q-arm of chromosome 11 (relative to the global copy number of the entire chromosome) were identified (table 1) and it was found that loss of 11q was more frequent in samples from the deceased patients. This is compatible with the reported negative prognostic feature of 11q loss, even though the result by itself was not significant (_p_=0.14, table 2a). Similarly gains on 17q: for all samples 17q gain was more frequent in the negative outcome group (_p_=0.07), while 17q gain was slightly more frequent in samples with a positive outcome when restricted to patients older than 500 days.
Table 2. Association Analysis.
Association of localized loss of genomic material on 11q, localized gain on 17q and whole chromosome gains/losses with patient survival for (A) all samples and (B) the subset of samples from patients older than 500 days at time of diagnosis. Each column shows the number of samples with the corresponding characteristic separated for deceased/survived patients. In each column a p-value for association of the observed distribution with the patient’s death pdeceased or survival psurvived is given. BP, a chromosomal breakpoint.
| A. | |||||
|---|---|---|---|---|---|
| ALL | 11q− BP | 17q+ BP | WCC >=1 | WCC >=2 | |
| Survived | 29 | 14 | 17 | 25 | 23 |
| Deceased | 29 | 19 | 23 | 20 | 12 |
| All | 58 | 33 | 40 | 45 | 35 |
| pdeceased | - | 0.140 | 0.07 | 0.97 | 0.999 |
| psurvived | - | 0.940 | 0.97 | 0.10 | 0.003 |
| B. | |||||
| >500 days | 11q−BP | 17q+ BP | WCC >=1 | WCC >=2 | |
| Survived | 13 | 11 | 12 | 12 | 11 |
| Deceased | 25 | 18 | 22 | 16 | 10 |
| All | 38 | 29 | 34 | 28 | 21 |
| pdeceased | - | 0.90 | 0.83 | 0.99 | 0.999 |
| psurvived | - | 0.33 | 0.58 | 0.06 | 0.009 |
We next analyzed if whole chromosome copy number changes are indicative for survival. Figure 2 panel (A) shows, for each chromosome, the frequency f of samples with whole chromosome copy number alterations (WCC), separately for good or poor outcome samples. Compared to the poor outcome group, the fraction f of samples with WCC was larger in the good outcome group, often by more than a factor two. Chromosome 10, for example, was most informative (_p_=0.002) with f = 0.34 (10 out of 29 samples from the positive outcome group) compared to f = 0.03 (1 out of 29 poor outcome samples). Not all chromosomes were equally informative partially because some chromosome copy number alterations were relatively infrequent rendering the observed differences statistically not significant. For example chromosome 1 was changed in only five of the 58 total samples and the differences between the positive and negative outcome group, _f_=0.10 and _f_=0.07 respectively, was not significant. The observation that all chromosomes were affected by whole chromosome changes and that changes were always more frequent in the positive outcome group suggested that survival is not associated with the change of a specific chromosome, but that the aggregate number of changes is indicative for survival. In panel (B) of Figure 2 the frequency of samples with at least one (histogram column labeled “A”) whole chromosome changes is plotted. Roughly 80% of all samples in the study fall in this category, but the distinction of the positive and negative outcome groups was poor (p = 0.1). A much clearer distinction (p = 0.003) with 23 of the 29 positive and 12 of 29 negative outcome samples was obtained when counting only samples with at least two whole chromosomes changes (“B” and “C”). The effect of further changing the chromosome number threshold is demonstrated in the ROC analysis in Figure 3A, where each square symbol in the graph represents a different number of altered chromosomes as a copy number cut-off. The symbol in the upper right corner at (1,1) includes all samples, regardless of the number of whole chromosome changes. Every step further towards lower sensitivity increases the threshold by one. This analysis also shows that the prognostic power remained strong in patients older than 500 days at time of diagnosis since the ROC curve was not strongly changed when we removed the samples from the 20 patients <500 days (see Figure 3A and Table 1).
Fig. 2. Whole chromosome changes.

Fraction of samples with whole chromosome variations (gain or loss). Panel A shows the frequency of changes for each of the autosomal chromosomes. Panel B plots the frequency of samples with at least one (column labeled “A”) or two (“B”, “C”) whole chromosome changes, regardless of which specific chromosome are affected. The column labeled “C” in that additionally restricts samples to be from patients diagnosed after 1998.
Fig. 3. A. ROC curve.
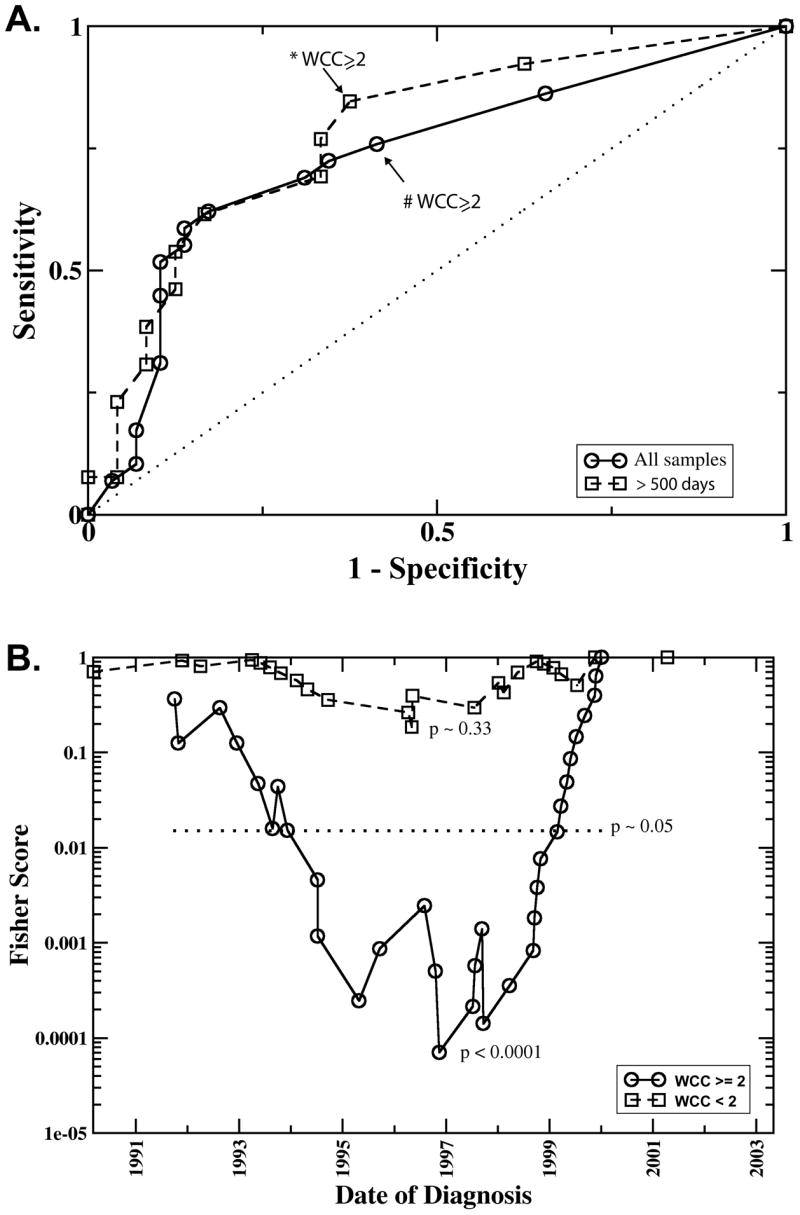
Sensitivity and specificity in predicting survival based on different numbers of whole chromosome changes (WCC). The points plotted on co-ordinates (1,1) represents the sensitivity and 1-specificity for predicting survival regardless of the number of WCC. Every step further towards co-ordinates (0,0) increases the threshold by one. Thus the points marked with * and # represent the sensitivity and specificity at the threshold of WCC ≥2. The circles plot the results including all samples, the squares were obtained including only samples older than 500 days at time of diagnosis. The dotted line represents a completely inefficient, random classifier. B. “Running cutoff” analysis. This analysis tests if patients diagnosed after a given date had a higher probability of survival compared to those diagnosed earlier. Plotted is the p-value (denoted as “Fishers Score”) derived with Fisher’s exact test as a function of the cutoff-date. The symbols, squares and circles, represent the date of diagnosis of the individual samples, where the solid line (circles) represent samples with whole chromosome changes (WCC>=2), the dashed line (squares) the one for samples with WCC <2., The date where the Fisher Score attains its minimal value best separates lower/higher survival rates. The likelihood of obtaining such a minimal value by chance was estimated by a random permutation test. The 5% significance level is represented by the horizontal dotted line denoted by p.
Of interest on further investigation of our data, this marker’s prognostic power sensitively depended on the date of diagnosis as demonstrated by comparison of histogram columns “B” and “C” in Figure 2B. While both indicate a significantly higher frequency of WCC ≥ 2 in the group of surviving patients, the difference between the two groups is much more pronounced when, as in “C”, the samples are restricted to those diagnosed after 1998. After this date copy number alterations occurred almost exclusively in the good outcome samples (p < 0.0001). So for patients with WCC ≥ 2, date of diagnosis was a marker for the patient’s survival. Figure 3B plots the p-values obtained for a “running cutoff”, asking if patients after the respective cutoff date had a survival advantage over patients diagnosed earlier. In this graph, a low p-value for a specific year indicates that a significant difference in the survival probability exists between patients diagnosed before and after that date. The “dip” in the curve for patients with WCC ≥ 2 indicates that the survival rates changed significantly over time, with the clearest separation set around 1997–1999. The maximum likelihood estimate of the survival probability with WCC ≥2 diagnosed before and including 1998 was approximately 0.3, after that it the survival rate changed to over 90% (only one out of 17 patients with WCC ≥ 2 died after 1998). In the group of patients with WCC < 2, no significant signal for a change in survival rates was visible at any time-point. For example, using 1998 as the cut-off date, the maximum likelihood estimate of survival rates before (psurv = 0.23) and after (psurv = 0.3) that cutoff differed only within the margin of errors.
Kaplan-Meier survival analysis showed that the patients with or without WCC ≥ 2 have significantly different survival probabilities (Figure 4A). In this analysis, WCC ≥ 2 is significantly correlated with survival for the patients diagnosed after 1998, but not for the patient diagnosed before or in 1998 (Figure 4B–C). The difference of correlation between WCC ≥2 and survival in patients diagnosed before and after 1998 also exists in the patients older than 500 days (Figure 4D).
Fig 4. Kaplan-Meier survival analysis.

The survival probabilities of patients with WCC >=2 or WCC<2 are compared. **A.** All samples with survival information (n=51). The patients classified based on the WCC status had significantly different survival probabilities (_p_= 0.01). **B.** The patients diagnosed before or in 1998 (n=23). **C.** The patients diagnosed after 1998 (n=27). **D.** The patients diagnosed after 1998 with age > 500 days (n=15).
Discussion
The current COG risk stratification homogeneously classifies all stage 4 neuroblastomas occurring in patients older than 18 month as a high risk disease. Currently available clinical pathological assays do not allow further determining which of the high risk patients will benefit from the standard multimodal aggressive therapies with 13-Cis-Retinoic acid in minimal residual disease. This study demonstrated that gain or loss of two or more whole chromosomes reliably predicted survival of patients with high risk NB, including patients older than 500 days. The established risk factors “stage” and “MYCN amplification status” were kept constant among the samples used in this study. The resulting marker is therefore not confounded with these factors, but rather identifies a molecularly defined sub-group with a high survival probability within the current high risk group of patients. WCC thus complements (and is independent from) existing factors used in COG’s current risk stratification. The focus of this study was on high risk NB samples with INSS stage 4 without MYCN amplification. Even though samples from patients younger than 500 days (intermediate risk) were used in parts of the analysis, the observed prognostic power of WCC was demonstrated to remain in the high risk group of patients older than 500 days. This finding sets WCC apart from earlier study (24) reporting that hyperdiploidy in stage 4 NB without MYCN amplification predicted survival in patients younger than 18 month. By definition of near triploidy, gain of 12–36 additional whole chromosome copies in humans, WCC includes near triploid (and near tetraploid) cells. Near triploidy was shown to indicate positive outcome, however this finding was found to be valid only in patients younger than one year (18). By design of microarray experiments and the need to standardize the numerical values obtained from scanning the arrays, this technology is not able to measure the global copy number (ploidy) of samples.
From the original experimental setup of this study, built around high resolution CGH microarrays, it was not anticipated to find such a low complexity prognosis prediction marker as whole chromosome changes. This observation has not been described before possibly because previous analysis took into consideration patients diagnosed before 1999 when the pattern simply did not predict outcome, at least not as clearly. Our analysis indicated that the survival probability of patients with WCC ≥2 has significantly improved recently as shown in Figure 3B: in the group of high risk NB patients with WCC ≥2, time of diagnosis predicts survival. The most significant separation was observed when the cutoff for the diagnosis date was set on or around 1998. Since outcome is generally the result of interplay of tumor biology and available treatment options, the improvement in outcome reflects medical progress, assuming that the NB biology has not changed.
The subgroup of samples with WCC <2 did not show a significant signal for medical progress, at least with the number of samples used in the current study. This observation implies that WCC is a potential pharmaco-genomic marker: within the group of stage 4 high risk NB without MYCN amplification it identifies a specific sub-group of patients (those with WCC) for which a certain therapy is predicted to be on benefit. Compared to markers that “only” predict survival, but do not link the predicted outcome to a treatment alternative, this aspect has the potential to add significant value in guiding treatment decisions. Unfortunately, our clinical annotation data did not permit to identify which specific recent protocol changes caused the increased survival rates. It is nevertheless tempting to speculate what this might be. One candidate is the combination of high dose chemotherapy, autologous bone marrow transplantation (ABMT) and subsequent treatment with 13-cis retinoic acid (4). Study 3891 of the Children’s Oncology Group had demonstrated a statistically significant improvement in event free survival for patients consolidated with ABMT compared to patients treated with continuation chemotherapy after initial high dose chemotherapy. Subsequent treatment with 13-cis retinoic acid was found to be most efficient for patients with minimal residual disease. According to this study the survival probability of patients with high risk NB increased from 11 +/− 4% for patients receiving only chemotherapy to 29 +/− 7% for patients consolidated with ABMT and retinoic acid. The resulting publication in 1999 (4), close to the “optimal” cut-off date of our data, suggested as the “basis for treatment of patients with high risk NB”, a group including the samples used in this study.
Chromosomes were affected with unequal frequencies as demonstrated in Figure 2A, where chromosome 7 was most and chromosome 1 least frequently affected. This uneven distribution suggests that gene dosage effects, which are known to alter expression levels in neuroblastoma (25), impact the biology of the tumor. Specific combinations may offer advantages in the development of the tumor while others my cause disadvantages, leading to a certain selective pressure in the micro-evolution (26) of the disease. Still, patient survival was to a large degree independent from the specific set of affected chromosomes, and gain and loss of any (two or more) whole chromosomes was a superior marker compared to any single chromosome. This makes it very likely that whole chromosome changes themselves are not causal for the increased susceptibility to treatment, but consequential of a more susceptible tumor-biology. This suggests that high risk NB with WCC follows a different developmental path, supporting earlier speculations (10, 27) of multiple molecular sub-types of NB.
A direct estimate of the fraction of patients presenting in WCC from the samples used in this study is difficult because the samples were not epidemiologically distributed. Nevertheless, the increase in survival rate reported previously (4) can be used to obtain a rough estimate if one uses the observation that predominantly patients demonstrating WCC have benefited. Even though attributing the entire difference in survival rates, 20–30%, to the WCC group is somewhat too simplistic, it still indicates that a significant fraction of patients in the clinic diagnosed with stage 4 high risk NB without MYCN amplification will demonstrate WCC.
The observed time dependence of WCC as a marker for survival is a reminder of the fact that the typical use-cases of markers, namely definition, comparison and application, always need to consider the “universe” of samples in which the marker operates. Use of pre-treatment samples in molecular screenings does not necessarily isolate the study from treatment parameters, as the treatment is intimately linked to the endpoints used in association studies. In fact, it is quite likely that some of the earlier studies analyzing mRNA levels for survival include this convolving time dependent factor.
While finalizing this manuscript, two studies (11, 21) reported results of cytogenetic aberrations in Neuroblastoma. Both identified a correlation of characteristic patterns of copy number alterations with the known phenotypic classification, extending earlier results (22). Both studies additionally identified specific cytogenetic aberrations that correlate with patient survival in a broad set of Neuroblastoma samples covering the entire spectrum of risk categories. Differently, in this study samples were restricted to a homogeneous subset of the highest risk category. This strategy was employed in order to further reduce and eliminate confounding with the already well established risk factors. However, restricting samples for a comparatively rare tumor like Neuroblastoma added to the difficulty of obtaining very large sample sets, even though the current study is among the largest CGH study for this high risk subtype. The estimated significance level _p_=0.003 of our primary finding, the association of WCC>2 with survival, is by itself highly significant, but a note on multiple hypothesis testing may be in place because this study not only tested WCC, but also alteration of the 22 autosomal chromosomes, partial loss of 11q23 and gain of 17q. Bonferroni correction for multiple comparisons ensures that the entire list of hypothesis determined as significant does not contain a single error at a pre-determined level of significance. One may be concerned that using this correction might render the presented results non significant. If one counts N = 22 (autosomes) + 2 (partial loss) = 24 hypothesis, change of chromosome 10 (individual p-value 0.001, p = N * p ~ 0.03) remains significant, but for WCC, π=0.003 * 24 = 0.072, exceeds the generally accepted threshold 0.05. However, this naïve application of Bonferroni’s correction is overly conservative, because the tested hypothesis were not independent (it is known a-prioiri that whole chromosome changes tend to affect multiple chromosomes simultaneously) leading to an overestimation of N. Even if one insists on treating the different hypothesis as independent, it would be more appropriate to consider the “false discovery” rate, which one can interpret to imply that a larger study may identify a modification of the WCC>2 rule as the best classifier.
In summary, this study presented a novel marker prognostic for survival of high risk NB patients (stage 4 NB without MYCN amplification), even for patients older than 500 days. For patients with WCC >= 2, date of diagnosis was a strong predictive factor and patients diagnosed after 1998 with this marker had a survival probability 90 %, comparable to patients with neuroblastoma currently stratified as low risk. Although statistically significant, the numbers in this study is relatively low and requires a large controlled study to validate and translate these potentially significant findings to the clinic.
Acknowledgments
We thank Drs. John Maris, Wendy London of the Children’s Oncology Group (COG), Steven Qualman of the Cooperative Human Tissue Network (CHTN), Daniel Catchpoole at the Children’s Hospital at Westmead, Australia, Frank Westermann, Manfred Schwab of German Cancer Research Center and Frank Berthold, University of Cologne, Germany for the tumor samples and patient demographic information. This research was supported by the Intramural Research Program of the NIH, National Cancer Institute, Center for Cancer Research. It has been funded in whole or in part with federal funds from the National Cancer Institute, National Institutes of Health, under contract N01-CO-12400. The content of this publication does not necessarily reflect the views or policies of the Department of Health and Human Services, nor does mention of trade names, commercial products, or organizations imply endorsement by the U.S. Government.
References
- 1.Maris JM, Hogarty MD, Bagatell R, Cohn SL. Neuroblastoma. Lancet. 2007;369:2106–20. doi: 10.1016/S0140-6736(07)60983-0. [DOI] [PubMed] [Google Scholar]
- 2.Maris JM. The biologic basis for neuroblastoma heterogeneity and risk stratification. Current Opinion in Pediatrics. 2005;17:7–13. doi: 10.1097/01.mop.0000150631.60571.89. [DOI] [PubMed] [Google Scholar]
- 3.Pearson AD. TP Prognosis of low-risk and high-risk neuroblastoma. In: Brodeur GM, Sawada T, Tsuchida Y, Voute PA, editors. Neuroblastoma. Amsterdam: Elsevier Science; 2000. p. 555. [Google Scholar]
- 4.Matthay KK, Villablanca JG, Seeger RC, et al. Treatment of high-risk neuroblastoma with intensive chemotherapy, radiotherapy, autologous bone marrow transplantation, and 13-cis-retinoic acid. New England Journal of Medicine. 1999;341:1165–73. doi: 10.1056/NEJM199910143411601. [DOI] [PubMed] [Google Scholar]
- 5.Brodeur GM, Maris JM. Neuroblastoma. In: Pizzo PA, Poplack DG, editors. Principles and practice of prediatric oncology. 4. Philadelphia: Lippincott Williams & Wilkins; 2002. pp. 895–937. [Google Scholar]
- 6.London WB, Castleberry RP, Matthay KK, et al. Evidence for an age cutoff greater than 365 days for neuroblastoma risk group stratification in the Children’s Oncology Group. Journal of Clinical Oncology. 2005;23:6459–65. doi: 10.1200/JCO.2005.05.571. [DOI] [PubMed] [Google Scholar]
- 7.Chen QR, Bilke S, Wei JS, et al. cDNA array-CGH profiling identifies genomic alterations specific to stage and MYCN-amplification in neuroblastoma. BMC Genomics. 2004;5:70. doi: 10.1186/1471-2164-5-70. [DOI] [PMC free article] [PubMed] [Google Scholar]
- 8.Plantaz D, Vandesompele J, Van Roy N, et al. Comparative genomic hybridization (CGH) analysis of stage 4 neuroblastoma reveals high frequency of 11Q deletion in tumors lacking MYCN amplification. International Journal of Cancer. 2001;91:680–6. doi: 10.1002/1097-0215(200002)9999:9999<::aid-ijc1114>3.0.co;2-r. [DOI] [PubMed] [Google Scholar]
- 9.Selzer RR, Richmond TA, Pofahl NJ, et al. Analysis of chromosome breakpoints in neuroblastoma at sub-kilobase resolution using fine-tiling oligonucleotide array CGH. Genes Chromosomes & Cancer. 2005;44:305–19. doi: 10.1002/gcc.20243. [DOI] [PubMed] [Google Scholar]
- 10.Vandesompele J, Speleman F, Van Roy N, et al. Multicentre analysis of patterns of DNA gains and losses in 204 neuroblastoma tumors: How many genetic subgroups are there? Medical and Pediatric Oncology. 2001;36:5–10. doi: 10.1002/1096-911X(20010101)36:1<5::AID-MPO1003>3.0.CO;2-E. [DOI] [PubMed] [Google Scholar]
- 11.Mosse YP, Diskin SJ, Wasserman N, et al. Neuroblastomas have distinct genomic DNA profiles that predict clinical phenotype and regional gene expression. Genes Chromosomes & Cancer. 2007;46:936–49. doi: 10.1002/gcc.20477. [DOI] [PubMed] [Google Scholar]
- 12.Chen YX, Stallings RL. Differential patterns of microRNA expression in neuroblastoma are correlated with prognosis, differentiation, and apoptosis. Cancer Research. 2007;67:976–83. doi: 10.1158/0008-5472.CAN-06-3667. [DOI] [PubMed] [Google Scholar]
- 13.Asgharzadeh S, Pique-Regi R, Sposto R, et al. Prognostic significance of gene expression profiles of metastatic neuroblastomas lacking MYCN gene amplification. Journal of the National Cancer Institute. 2006;98:1193–203. doi: 10.1093/jnci/djj330. [DOI] [PubMed] [Google Scholar]
- 14.Oberthuer A, Berthold F, Warnat P, et al. Customized oligonucleotide microarray gene expression based classification of neuroblastoma patients outperforms current clinical risk stratification. Journal of Clinical Oncology. 2006;24:5070–8. doi: 10.1200/JCO.2006.06.1879. [DOI] [PubMed] [Google Scholar]
- 15.Ohira M, Oba S, Nakamura Y, et al. Expression profiling using a tumor-specific cDNA microarray predicts the prognosis of intermediate risk neuroblastomas. Cancer Cell. 2005;7:337–50. doi: 10.1016/j.ccr.2005.03.019. [DOI] [PubMed] [Google Scholar]
- 16.Schramm A, Vandesompele J, Schulte JH, et al. Translating expression profiling into a clinically feasible test to predict neuroblastoma outcome. Clinical Cancer Research. 2007;13:1459–65. doi: 10.1158/1078-0432.CCR-06-2032. [DOI] [PubMed] [Google Scholar]
- 17.Wei JS, Greer BT, Westermann F, et al. Prediction of clinical outcome using gene expression profiling and artificial neural networks for patients with neuroblastoma. Cancer Res. 2004;64:6883–91. doi: 10.1158/0008-5472.CAN-04-0695. [DOI] [PMC free article] [PubMed] [Google Scholar]
- 18.Bowman LC, Castleberry RP, Cantor A, et al. Genetic staging of unresectable or metastatic neuroblastoma in infants: A Pediatric Oncology Group Study. Journal of the National Cancer Institute. 1997;89:373–80. doi: 10.1093/jnci/89.5.373. [DOI] [PubMed] [Google Scholar]
- 19.Attiyeh EF, London WB, Mosse YP, et al. Chromosome 1p and 11q deletions and outcome in neuroblastoma. New England Journal of Medicine. 2005;353:2243–53. doi: 10.1056/NEJMoa052399. [DOI] [PubMed] [Google Scholar]
- 20.Attiyeh EF, Mosse YP, Wang Q, et al. Chromosome arm 11q deletion predicts for neuroblastoma outcome: A Children’s Oncology Group study. Journal of Clinical Oncology. 2005;23:2S–S. [Google Scholar]
- 21.Tomioka N, Oba S, Ohira M, et al. Novel risk stratification of patients with neuroblastoma by genomic signature, which is independent of molecular signature. Oncogene. 2007;27:441–9. doi: 10.1038/sj.onc.1210661. [DOI] [PubMed] [Google Scholar]
- 22.Bilke S, Chen QR, Westerman F, Schwab M, Catchpoole D, Khan J. Inferring a tumor progression model for neuroblastoma from genomic data. Journal of Clinical Oncology. 2005;23:7322–31. doi: 10.1200/JCO.2005.03.2821. [DOI] [PubMed] [Google Scholar]
- 23.Bilke S, Chen QR, Whiteford CC, Khan J. Detection of low level genomic alterations by comparative genomic hybridization based on cDNA micro-arrays. Bioinformatics. 2004 doi: 10.1093/bioinformatics/bti133. [DOI] [PubMed] [Google Scholar]
- 24.George RE, London WB, Cohn SL, et al. Hyperdiploidy plus nonamplified MYCN confers a favorable prognosis in children 12 to 18 months old with disseminated neuroblastoma: A Pediatric Oncology Group Study. Journal of Clinical Oncology. 2005;23:6466–73. doi: 10.1200/JCO.2005.05.582. [DOI] [PubMed] [Google Scholar]
- 25.Chen QR, Bilke S, Wei JS, et al. Increased WSB1 copy number correlates with its over-expression which associates with increased survival in neuroblastoma. Genes Chromosomes & Cancer. 2006;45:856–62. doi: 10.1002/gcc.20349. [DOI] [PubMed] [Google Scholar]
- 26.Nowell PC. Clonal evolution of tumor-cell populations. Science. 1976;194:23–8. doi: 10.1126/science.959840. [DOI] [PubMed] [Google Scholar]
- 27.Warnat P, Oberthuer A, Fischer M, Westermann F, Eils R, Brors B. Cross-study analysis of gene expression data for intermediate neuroblastoma identifies two biological subtypes. BMC Cancer. 2007:7. doi: 10.1186/1471-2407-7-89. [DOI] [PMC free article] [PubMed] [Google Scholar]