Carbon nanotubes as photoacoustic molecular imaging agents in living mice (original) (raw)
. Author manuscript; available in PMC: 2008 Oct 7.
Published in final edited form as: Nat Nanotechnol. 2008 Aug 17;3(9):557–562. doi: 10.1038/nnano.2008.231
Abstract
Photoacoustic imaging of living subjects offers higher spatial resolution and allows deeper tissues to be imaged compared with most optical imaging techniques1–7. As many diseases do not exhibit a natural photoacoustic contrast, especially in their early stages, it is necessary to administer a photoacoustic contrast agent. A number of contrast agents for photoacoustic imaging have been suggested previously8–15, but most were not shown to target a diseased site in living subjects. Here we show that single-walled carbon nanotubes conjugated with cyclic Arg-Gly-Asp (RGD) peptides can be used as a contrast agent for photoacoustic imaging of tumours. Intravenous administration of these targeted nanotubes to mice bearing tumours showed eight times greater photoacoustic signal in the tumour than mice injected with non-targeted nanotubes. These results were verified ex vivo using Raman microscopy. Photoacoustic imaging of targeted single-walled carbon nanotubes may contribute to non-invasive cancer imaging and monitoring of nanotherapeutics in living subjects16.
Recently, we reported on the conjugation of cyclic RGD containing peptides to single-walled carbon nanotubes17 (SWNT–RGD) that is stable in serum. The single-walled carbon nanotubes, which were 1–2 nm in diameter and 50–300 nm in length were coupled to the RGD peptides through polyethylene glycol-5000 grafted phospholipid (PL–PEG5000). These SWNT–RGD conjugates bind with high affinity to αvβ3 integrin, which is overexpressed in tumour neovasculature, and to other integrins expressed by tumours but with lower affinity18,19. We also synthesized non-targeted single-walled carbon nanotubes (that is, plain single-walled carbon nanotubes) by conjugating them solely to PL–PEG5000 (Fig. 1a). Our photoacoustic instrument20 used a single-element focused transducer to raster scan the object under study, which was illuminated through a fibre head (see Methods and Supplementary Information, Fig. S1). In a phantom study we measured the photoacoustic signal of plain single-walled carbon nanotubes and SWNT–RGD at wavelengths of 690–800 nm (Fig. 1b; shorter wavelengths are less desirable as the depth of penetration through the tissues is reduced21). These photoacoustic spectra suggest that 690 nm is the preferable wavelength, because the photoacoustic signal of the single-walled carbon nanotubes is highest at that wavelength. Furthermore, the ratio of single-walled carbon nanotubes to haemoglobin signal is higher at this wavelength when compared with other wavelengths. Importantly, the photoacoustic signal of single-walled carbon nanotubes was found to be unaffected by the RGD peptide conjugation. This finding was validated through measurements of the optical absorbance of the two single-walled carbon nanotubes conjugates (see Supplementary Information, Fig. S2). In a separate non-absorbing and non-scattering phantom study, we also validated that the photoacoustic signal produced by single-walled carbon nanotubes is in linear relationship with their concentration (Fig. 1c) with _R_2 = 0.9997.
Figure 1. Characterization of the photoacoustic properties of single-walled carbon nanotubes.

a, Illustration of plain single-walled carbon nanotubes (plain SWNT) and SWNT – RGD. The phospholipid binds to the sidewall of the single-walled carbon nanotubes connecting the PEG5000 to the nanotubes. The RGD allows the single-walled carbon nanotubes to bind to tumour integrins such as αvβ3. b, The photoacoustic spectra of plain single-walled carbon nanotubes and SWNT –RGD are overlaid on the known optical absorbance of HbO2 and Hb. The spectral overlap between plain single-walled carbon nanotubes and SWNT –RGD suggests that the RGD conjugation does not perturb the photoacoustic signal. c, The photoacoustic signal produced by single-walled carbon nanotubes was observed to be linearly dependent on the concentration (_R_2 = 0.9997).
We then subcutaneously injected the lower back of a mouse with 30 μl of mixtures of single-walled carbon nanotubes and matrigel at concentrations between 50 and 600 nM (n = 3 for each concentration). Matrigel alone produced no photoacoustic signal (data not shown). Upon injection, the matrigel solidified, fixing the single-walled carbon nanotubes in place. Three-dimensional (3D) ultrasound and photoacoustic images of the inclusions were then acquired (Fig. 2a). The ultrasound images showed the mouse anatomy (for example, skin and inclusion edges), and the photoacoustic images revealed the single-walled carbon nanotubes contrast in the mouse. The photoacoustic signal from each inclusion was quantified using a 3D region of interest drawn over the inclusion. We observed a linear correlation (_R_2 = 0.9929) between the single-walled carbon nanotubes concentration and the corresponding photoacoustic signal (Fig. 2b). Importantly, this linear relation can only be expected in special cases where the dye concentration does not perturb the tissue light distribution significantly. We concluded that the photoacoustic signal produced by tissues (background) was equivalent to the photoacoustic signal produced by 50 nM of single-walled carbon nanotubes (that is, a signal-to-background ratio of 1). This experimental result correlates well with the theoretical analysis (see Supplementary Information), which predicts a background signal equal to 7–70 nM of single-walled carbon nanotubes, depending on the location of the nanotubes in the body.
Figure 2. Photoacoustic detection of single-walled carbon nanotubes in living mice.

a, Mice were injected subcutaneously with single-walled carbon nanotubes at concentrations of 50– 600 nM. One vertical slice in the 3D photoacoustic image (green) was overlaid on the corresponding slice in the ultrasound image (grey). The skin is visible in the ultrasound images, and the photoacoustic images show the single-walled carbon nanotubes. The dotted lines on the images identify the edges of each inclusion. b, The photoacoustic signal from each inclusion was calculated. The background level represents the endogenous signal measured from tissues. The error bars represent standard error (n = 3). The linear regression is calculated on the five most concentrated inclusions (_R_2 = 0.9929).
We then injected two groups of mice bearing U87MG tumour xenografts (~100 mm3) through the tail-vein (IV) with either 200 μl of plain single-walled carbon nanotubes (n = 4) or SWNT–RGD (n = 4) at a concentration of 1.2 μM. Three-dimensional ultrasound and photoacoustic images of the tumour and its surroundings were acquired before and up to 4 h after injection. We found that mice injected with SWNT–RGD showed a significant increase of photoacoustic signal in the tumour compared with control mice injected with plain single-walled carbon nanotubes (Fig. 3a). The images from the different time points were aligned with one another using simple vertical translations to account for small vertical movements in the transducer positioning. This alignment allowed quantification of the photoacoustic signal at all time points using a single region of interest. We then calculated a subtraction image between the photoacoustic image taken at 4 h post-injection and the photoacoustic image taken before injection. The subtraction image better visualizes the real distribution of the single-walled carbon nanotubes as it removes, to a large extent, the background signal. For example, in the mouse injected with plain single-walled carbon nanotubes (Fig. 3a), a high photoacoustic signal, likely produced by a large blood vessel, was seen in the pre-injection and post-injection images. However, the subtraction image showed a much lower signal from this area, reflecting the likely low concentration of plain single-walled carbon nanotubes there. We calculated the photoacoustic signal by drawing a 3D region of interest around the tumour (tumour boundaries were clearly visualized in the ultrasound images). The photoacoustic signal increase was quantified as a function of time (Fig. 3b). Although SWNT–RGD led to a consistently higher photoacoustic signal, plain single-walled carbon nanotubes led only to a temporary increase in the photoacoustic signal of the tumour (P < 0.001 when comparing entire time-curves, and P < 0.05 when comparing the signals at each time point independently). The temporary photoacoustic signal observed for plain single-walled carbon nanotubes is likely caused by circulating nanotubes that are eventually cleared from the bloodstream. Conversely, SWNT–RGD bind to the tumour vasculature, creating a consistent photoacoustic signal from the tumour. On average, at 4 h post-injection, the SWNT–RGD resulted in ~8 times greater increase in photoacoustic signal compared with plain single-walled carbon nanotubes. The percentage injected dose per gram of tissue was calculated to be ~14 %ID g−1 (see Supplementary Information).
Figure 3. Single-walled carbon nanotube targets tumour in living mice.
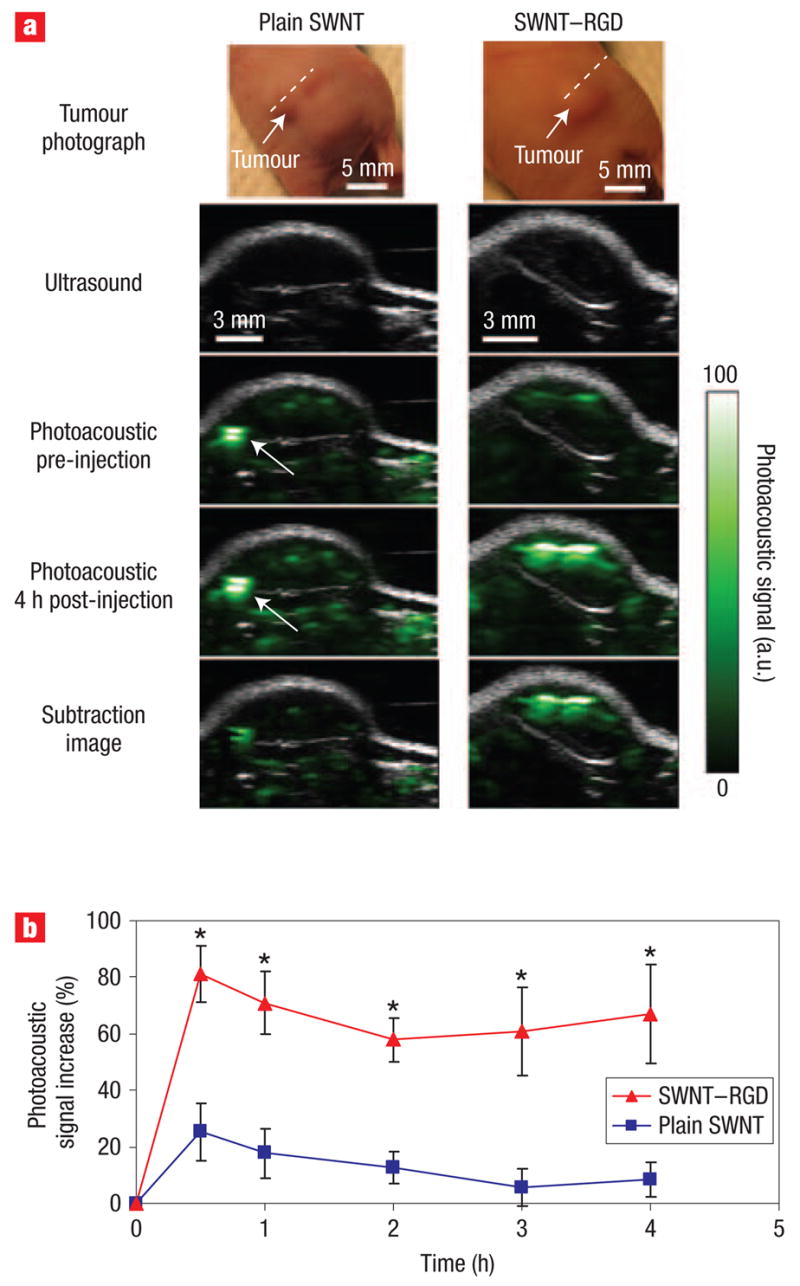
a, Ultrasound (grey) and photoacoustic (green) images of one vertical slice (white dotted line) through the tumour. The ultrasound images show the skin and tumour boundaries. Subtraction images were calculated as the 4 h post-injection image minus the pre-injection image. The high photoacoustic signal in the mouse injected with plain single-walled carbon nanotubes (indicated with a white arrow) is not seen in the subtraction image, suggesting that it is due to a large blood vessel and not single-walled carbon nanotubes. b, Mice injected with SWNT –RGD showed a significantly higher photoacoustic signal than mice injected with plain single-walled carbon nanotubes (P < 0.001). The error bars represent standard error (n = 4). *P < 0.05.
We further validated our photoacoustic results using a Raman microscope, as an independent method for detection of single-walled carbon nanotubes. At the conclusion of the photoacoustic study, 4 h post-injection, the mice were sacrificed; the tumours were surgically removed and scanned ex vivo under a Raman microscope. The two-dimensional Raman images of the excised tumours were found to match the photoacoustic images (Fig. 4a). The mean Raman signal from the tumours was calculated from the Raman images. Similarly to the photoacoustic results, the Raman signal from the tumours was ~4 times higher in mice injected with SWNT–RGD than in mice injected with plain single-walled carbon nanotubes (Fig. 4b).
Figure 4. Validation of the in vivo photoacoustic images by Raman ex vivo microscopy.

a, Photographs of the tumours in mice and the corresponding photoacoustic subtraction images (green) shown as horizontal slices through the tumours. After the photoacoustic scan, the tumours were excised and scanned using a Raman microscope (red). Mice injected with plain single-walled carbon nanotubes (left-hand column) showed both low photoacoustic and Raman signals compared with mice injected with SWNT – RGD (right-hand column). The tumours are in the same orientation in all images. b, Comparison between the photoacoustic signal of the tumours in vivo (left) and the Raman signal acquired from the excised tumours (right). *P < 0.05.
Unlike photoacoustic imaging, optical imaging suffers from relatively poor spatial resolution as well as exponentially degraded sensitivity as tissue depth increases22. We showed the superiority of our photoacoustic strategy by comparing it with fluorescence imaging of tumour-targeted quantum dots. The quantum dots were conjugated to RGD peptides23 (QD–RGD) and imaged 6 h post-injection using a fluorescence imaging instrument (Fig. 5a). Although the quantum dot and single-walled carbon nanotube conjugates might have different biodistributions, the photoacoustic images of single-walled carbon nanotubes from the tumour illustrated the depth-information and the greater spatial resolution achieved by photoacoustic imaging compared with fluorescence imaging (Fig. 5b–d). The smeared signal from the tumour in the fluorescence image is due to light scattering. However, the photoacoustic images showed the 3D distribution of SWNT–RGD in the tumour with high spatial resolution. Similar results were also observed in a phantom study (see Supplementary Information, Fig. S4).
Figure 5. Comparison between photoacoustic imaging using single-walled carbon nanotubes and fluorescence imaging using quantum dots.

a, Fluorescence image (red) of a mouse injected with QD– RGD. The white arrow indicates the tumour location. The other bright spots on the image represent the different organs in which QD– RGD non-specifically accumulated. b, Tumor photograph. c, Horizontal (xy plane) and d, vertical (xz plane) slices in the 3D photoacoustic image of a mouse injected with SWNT – RGD. The black dotted line shows the vertical slice orientation and the white dotted line shows the height of the horizontal slice in the vertical slice. The location of the single-walled carbon nanotubes in the tumour is visualized with high spatial resolution.
We have demonstrated that single-walled carbon nanotubes can be exploited as photoacoustic contrast agents to non-invasively image tumours. Intravenous injection of targeted single-walled carbon nanotubes in mice led to 8 times higher photoacoustic signal in the tumour compared with mice injected with non-targeted single-walled carbon nanotubes. Our photoacoustic images were verified using Raman microscopy on the surgically removed tumours. Furthermore, our results agreed with a previous study17 where radiolabelled SWNT–RGD were monitored using small animal positron emission tomography (microPET). In that study SWNT–RGD were found to accumulate ~3–5 times more in tumours than plain single-walled carbon nanotubes. That study also showed that the SWNT–RGD did not accumulate in the tissue surrounding the tumour.
Most previous work on photoacoustic contrast agents in vivo is limited to non-targeted agents such as gold nanocages used for highlighting the blood vessels in a rat’s brain11. A recent preliminary study13 showed that an indocyanine green derivative (IRDye-800-c(KRGDf)) may be applicable for photoacoustic spectroscopic imaging of U87MG tumours; however, the study was carried out on a single mouse and statistical validation of the agent has yet to be shown. Various gold nanoparticles have been previously suggested, primarily for their high absorption characteristics and the ability to control their spectra, which allows multiplexing studies9. However, their main limitation is their relatively large size, which will lead to their rapid clearance by the reticuloendothelial system (RES) upon intravenous injection. It is possible that single-walled carbon nanotubes, due to their unique high aspect ratio (~1:100) and high surface area to volume ratio, are capable of minimizing RES uptake while having an increased affinity for molecular targets due to multivalency effects17. A concentration of 50 nM of single-walled carbon nanotubes was found to produce a photoacoustic signal equivalent to mouse tissues (background); however, the minimum detectable concentration of single-walled carbon nanotubes is likely to be less than 50 nM. This is because photoacoustic images were acquired before and after the administration of the contrast agent, thus making it possible to separate the contrast agent signal from the background signal. Further background reduction can be achieved by performing photoacoustic spectral imaging, improving hardware/reconstruction software, or by enhancing the single-walled carbon nanotubes’ photoacoustic signal. With respect to acquisition time, our current instrument acquires a single photoacoustic image in ~20–30 minutes for a tumour ~100 mm3 in size. However, by using lasers with higher repetition rates, scan duration can be greatly reduced.
We are currently investigating the potential of single-walled carbon nanotubes to extravasate out of the leaky vasculature of tumours. Single-walled carbon nanotube extravasation is of particular interest, because upon exiting the vasculature, the nanotubes would have access to many more molecular targets that exist only on the cancer cell’s membranes. Future work should optimize the particles’ extravasation as well as bring new technologies to help quantify the degree of nanotube extravasation. Moreover, future studies can monitor various nanotherapeutic applications such as drug-eluting single-walled carbon nanotubes using photoacoustic imaging. Such nanotherapeutic and cancer imaging applications would gain further clinical interest as single-walled carbon nanotubes continue to show no toxic effects24. Although single-walled carbon nanotubes have the capability to efficiently bind to molecular targets, their high photoacoustic signal allows for high-resolution 3D photoacoustic images with substantial depth of penetration. None of the other molecular imaging modalities compares with the precise depth information and submillimetre resolution at nanomolar sensitivity that is achieved by photoacoustic imaging. We expect this work to stimulate further studies of biologically relevant problems using photoacoustic molecular imaging.
METHODS
SYNTHESIS OF SINGLE-WALLED CARBON NANOTUBE CONJUGATES
A complete description of the synthesis of SWNT–RGD and plain single-walled carbon nanotubes can be found elsewhere17. The single-walled carbon nanotubes used in this work were 50–300 nm in length and 1–2 nm in diameter. The molar concentrations25 were based on an average molecular weight of 170 kDa per single-walled carbon nanotube (150 nm in length and 1.2 nm in diameter).
STATISTICAL METHODS
For the single-walled carbon nanotube tumour targeting experiments, we used a random-effects regression to test the hypothesis that mice injected with SWNT–RGD showed an increased photoacoustic signal over time in the tumour compared with the control group injected with plain single-walled carbon nanotubes. We also performed the one-tailed student’s _t_-test at each time point independently to test whether the previous effect will be observed by sampling the photoacoustic signal at a single time point instead. For the cell uptake studies, we used the one-tailed student’s _t_-test to test whether the group in which U87MG cells were exposed to SWNT–RGD had a statistically higher signal than each of the other groups independently.
PHOTOACOUSTIC INSTRUMENTATION
Our in-house photoacoustic system20 is illustrated in the Supplementary Information, Fig. S1. A tuneable pulsed laser with a repetition rate of 10 Hz and a pulsewidth of 5 ns (Nd:YAG Surelight-III-10 connected to Surelite OPO Plus, Continuum) illuminated the object through a fibre-optic ring light (50–1353 Ringlight, Fiberoptic Systems). The average energy density of the laser at 690 nm wavelength was measured to be ~9 mJ cm−2 at the target site, which is below the ANSI limitation for laser skin exposure26. A 5 MHz focused transducer (25.5 mm focal length, 4 MHz bandwidth, F number of 2.0, depth of focus of 6.5 mm, lateral resolution of 600 μm and axial resolution of 380 μm; A309S-SU-F-24.5-MM-PTF, Panametrics) was used to acquire both pulse-echo and photoacoustic images. In addition, high-resolution ultrasound images were acquired using a 25 MHz focused transducer (27 mm focal length, 12 MHz bandwidth, F number of 4.2, depth of focus of 7.5 mm, lateral resolution of 250 μm and axial resolution of 124 μm; V324-SU-25.5-MM, Panametrics). A precision xyz-stage (U500, Aerotech) with minimum step size of 1 μm was used to move the transducer and the fibre ring along a planar 2D trajectory. At every position, the acquired signal was averaged over 16 laser pulses. The time of arrival and the intensity of the laser pulses were recorded using a silicon photodiode (DET10A, Thorlabs). This information was used to synchronize the acquisition and compensate for pulse-to-pulse variations in laser intensity. The analogue photoacoustic signals were amplified using a 40 dB preamplifier (5676/115VAC, Panametrics) and digitized using an oscilloscope (Infiniium 54825A, Agilent). The photoacoustic and ultrasound images were reconstructed as follows: the a-scan from each position of the transducer was bandpass-filtered with 100% fractional bandwidth, compensated for laser intensity variation and envelope detected. The a-scans were then combined to reconstruct a 3D intensity image of the target. No further post-processing was carried out on the images. The ultrasound images acquired using the 5 MHz and 25 MHz transducers were aligned together using small vertical translations so that the object’s skin level matched in both images. The photoacoustic and high-frequency ultrasound images were analysed, co-registered, and displayed using AMIDE27 software.
SINGLE-WALLED CARBON NANOTUBE TUMOUR TARGETING IN LIVING MICE
All animal experiments were performed in compliance with the Guidelines for the Care and Use of Research Animals established by the Stanford University Animal Studies Committee. Two groups of female nude mice (n = 3 in each group), 6–8 weeks old were inoculated subcutaneously at their lower right back with 107 U87MG cells (American Type Culture Collection, ATCC) suspended in 50 μl of saline (PBS, pH 7.4 1 ×, Invitrogen). The tumours were allowed to grow to a volume of ~100 mm3. Before the injection of single-walled carbon nanotubes, photoacoustic and ultrasound images of the mice were taken. Photoacoustic excitation light was 690 nm. The single-walled carbon nanotubes were sonicated for 5 min under 1 W r.m.s. (Sonifier 150, Branson) to separate single-walled carbon nanotubes that may have aggregated. The mice were then injected with 200 μl of 1.2 μM single-walled carbon nanotubes into the tail-vein. During the injection the positioning of the mice was not changed. After injection, photoacoustic and ultrasound images were acquired at 0.5, 1, 2, 3 and 4 h post injection. The scanning area varied between mice depending on the tumour orientation, but typically was ~80 mm2, with a step size of 0.25 mm. At 4 h post-injection, the mice were killed and their tumours surgically removed for further ex vivo analysis. The ultrasound images from the different time points were aligned with one another by vertically translating the images (translation was typically less than 0.5 mm). The same alignment was then applied to the photoacoustic images. Using AMIDE software, a 3D region of interest was drawn over the tumour volume (which was clearly illustrated in the ultrasound images). The mean photoacoustic signal in the tumour region of interest was calculated for each photoacoustic image.
Supplementary Material
Acknowledgments
We would like to thank J. Rosenberg for the statistical analysis. This work was supported, in part, by National Cancer Institute (NCI) Center for Cancer Nanotechnology Excellence (CCNE) U54 (to S.S.G.) and NCI In-Vivo Cancer Molecular Imaging Center (ICMIC) P50 CA114747 (to S.S.G.).
Footnotes
Author contributions
A.D. built the photoacoustic instrument, designed and performed the experiments and wrote the paper. C.Z. designed, performed and analysed the Raman experiments. S.K. built the photoacoustic instrument and designed the experiments. S.V. designed and built the photoacoustic instrument. S.B. performed the experiments and helped write the paper. Z.L. synthesized the single-walled carbon nanotube conjugates. J.L. performed the cell uptake studies. B.R.S. helped write the paper. T.M. and O.O. helped design the photoacoustic instrument. Z.C. helped perform the comparison to fluorescence imaging. X.C. provided the RGD peptides, performed the fluorescence imaging of QD-RGD conjugates and helped write the manuscript. H.D. was responsible for single-walled carbon nanotube conjugation synthesis. B.T.K. was responsible for building the photoacoustic instrument. S.S.G. was responsible for experimental design and wrote the paper.
References
- 1.Xu MH, Wang LHV. Photoacoustic imaging in biomedicine. Rev Sci Instrum. 2006;77:041101. [Google Scholar]
- 2.Oh JT, et al. Three-dimensional imaging of skin melanoma in vivo by dual-wavelength photoacoustic microscopy. J Biomed Opt. 2006;11:34032. doi: 10.1117/1.2210907. [DOI] [PubMed] [Google Scholar]
- 3.Zhang HF, Maslov K, Stoica G, Wang LV. Imaging acute thermal burns by photoacoustic microscopy. J Biomed Opt. 2006;11:054033. doi: 10.1117/1.2355667. [DOI] [PubMed] [Google Scholar]
- 4.Wang X, Xie X, Ku G, Wang LV, Stoica G. Noninvasive imaging of haemoglobin concentration and oxygenation in the rat brain using high-resolution photoacoustic tomography. J Biomed Opt. 2006;11:024015. doi: 10.1117/1.2192804. [DOI] [PubMed] [Google Scholar]
- 5.Zhang HF, Maslov K, Stoica G, Wang LV. Functional photoacoustic microscopy for high-resolution and noninvasive in vivo imaging. Nat Biotechnol. 2006;24:848–851. doi: 10.1038/nbt1220. [DOI] [PubMed] [Google Scholar]
- 6.Manohar S, et al. Initial results of in vivo non-invasive cancer imaging in the human breast using near-infrared photoacoustics. Opt Express. 2007;15:12277–12285. doi: 10.1364/oe.15.012277. [DOI] [PubMed] [Google Scholar]
- 7.Ermilov S, et al. Detection and noninvasive diagnostics of breast cancer with 2-colour laser optoacoustic imaging system. Proc SPIE. 2007;6437:643703. [Google Scholar]
- 8.Eghtedari M, et al. High sensitivity of in vivo detection of gold nanorods using a laser optoacoustic imaging system. Nano Lett. 2007;7:1914–1918. doi: 10.1021/nl070557d. [DOI] [PubMed] [Google Scholar]
- 9.Li PC, et al. Photoacoustic imaging of multiple targets using gold nanorods. IEEE Trans Ultrason Ferroelectr Freq Control. 2007;54:1642–1647. doi: 10.1109/tuffc.2007.435. [DOI] [PubMed] [Google Scholar]
- 10.Kim G, et al. Indocyanine-green-embedded PEBBLEs as a contrast agent for photoacoustic imaging. J Biomed Opt. 2007;12:044020. doi: 10.1117/1.2771530. [DOI] [PubMed] [Google Scholar]
- 11.Yang X, Skrabalak SE, Li ZY, Xia Y, Wang LV. Photoacoustic tomography of a rat cerebral cortex in vivo with Au nanocages as an optical contrast agent. Nano Lett. 2007;7:3798–3802. doi: 10.1021/nl072349r. [DOI] [PubMed] [Google Scholar]
- 12.Zharov VP, et al. Photoacoustic flow cytometry: principle and application for real-time detection of circulating single nanoparticles, pathogens and contrast dyes in vivo. J Biomed Opt. 2007;12:051503. doi: 10.1117/1.2793746. [DOI] [PubMed] [Google Scholar]
- 13.Li ML, et al. Simultaneous molecular and hypoxia imaging of brain tumours in vivo using spectroscopic photoacoustic tomography. Proc IEEE. 2008;96:481–489. [Google Scholar]
- 14.Wei CW, et al. In vivo photoacoustic imaging with multiple selective targeting using bioconjugated gold nanorods. Proc SPIE. 2008;6856:68560J. [Google Scholar]
- 15.Kim K, et al. In vivo imaging of inflammatory responses by photoacoustics using cell-targeted gold nanorods (GNR) as contrast agent. Proc SPIE. 2008;6856:68560H. [Google Scholar]
- 16.Bianco A, Kostarelos K, Prato M. Applications of carbon nanotubes in drug delivery. Curr Opin Chem Biol. 2005;9:674–679. doi: 10.1016/j.cbpa.2005.10.005. [DOI] [PubMed] [Google Scholar]
- 17.Liu Z, et al. In vivo biodistribution and highly efficient tumour targeting of carbon nanotubes in mice. Nature Nanotech. 2007;2:47–52. doi: 10.1038/nnano.2006.170. [DOI] [PubMed] [Google Scholar]
- 18.Mizejewski GJ. Role of integrins in cancer: survey of expression patterns. Proc Soc Exp Biol Med. 1999;222:124–138. doi: 10.1177/153537029922200203. [DOI] [PubMed] [Google Scholar]
- 19.Janssen ML, et al. Tumour targeting with radiolabelled alpha(v)beta(3) integrin binding peptides in a nude mouse model. Cancer Res. 2002;62:6146–6151. [PubMed] [Google Scholar]
- 20.Vaithilingam S, et al. Ultrasonics Symposium. 2007:2413–2416. 2007. [Google Scholar]
- 21.Weissleder R, Ntziachristos V. Shedding light onto live molecular targets. Nature Med. 2003;9:123–128. doi: 10.1038/nm0103-123. [DOI] [PubMed] [Google Scholar]
- 22.Keren S, Gheysens O, Levin CS, Gambhir SS. A comparison between a time domain and continuous wave small animal optical imaging system. IEEE Trans Med Imaging. 2008;27:58–63. doi: 10.1109/TMI.2007.902800. [DOI] [PMC free article] [PubMed] [Google Scholar]
- 23.Cai W, et al. Peptide-labelled near-infrared quantum dots for imaging tumour vasculature in living subjects. Nano Lett. 2006;6:669–676. doi: 10.1021/nl052405t. [DOI] [PubMed] [Google Scholar]
- 24.Schipper ML, et al. A pilot toxicology study of single-walled carbon nanotubes in a small sample of mice. Nature Nanotech. 2008;3:216–221. doi: 10.1038/nnano.2008.68. [DOI] [PubMed] [Google Scholar]
- 25.Kam NW, O’Connell M, Wisdom JA, Dai H. Carbon nanotubes as multifunctional biological transporters and near-infrared agents for selective cancer cell destruction. Proc Natl Acad Sci USA. 2005;102:11600–11605. doi: 10.1073/pnas.0502680102. [DOI] [PMC free article] [PubMed] [Google Scholar]
- 26.American National Standards Institute. ANSI Standard Z136.1–2000. ANSI; New York: 2000. American national standard for the safe use of lasers. [Google Scholar]
- 27.Loening AM, Gambhir SS. AMIDE: a free software tool for multimodality medical image analysis. Mol Imaging. 2003;2:131–137. doi: 10.1162/15353500200303133. [DOI] [PubMed] [Google Scholar]
Associated Data
This section collects any data citations, data availability statements, or supplementary materials included in this article.