The Dynamin-like Protein DLP1 Is Essential for Normal Distribution and Morphology of the Endoplasmic Reticulum and Mitochondria in Mammalian Cells (original) (raw)
Abstract
The dynamin family of large GTPases has been implicated in vesicle formation from both the plasma membrane and various intracellular membrane compartments. The dynamin-like protein DLP1, recently identified in mammalian tissues, has been shown to be more closely related to the yeast dynamin proteins Vps1p and Dnm1p (42%) than to the mammalian dynamins (37%). Furthermore, DLP1 has been shown to associate with punctate vesicles that are in intimate contact with microtubules and the endoplasmic reticulum (ER) in mammalian cells. To define the function of DLP1, we have transiently expressed both wild-type and two mutant DLP1 proteins, tagged with green fluorescent protein, in cultured mammalian cells. Point mutations in the GTP-binding domain of DLP1 (K38A and D231N) dramatically changed its intracellular distribution from punctate vesicular structures to either an aggregated or a diffuse pattern. Strikingly, cells expressing DLP1 mutants or microinjected with DLP1 antibodies showed a marked reduction in ER fluorescence and a significant aggregation and tubulation of mitochondria by immunofluorescence microscopy. Consistent with these observations, electron microscopy of DLP1 mutant cells revealed a striking and quantitative change in the distribution and morphology of mitochondria and the ER. These data support very recent studies by other authors implicating DLP1 in the maintenance of mitochondrial morphology in both yeast and mammalian cells. Furthermore, this study provides the first evidence that a dynamin family member participates in the maintenance and distribution of the ER. How DLP1 might participate in the biogenesis of two presumably distinct organelle systems is discussed.
INTRODUCTION
The dynamins constitute a superfamily of large GTPases implicated in vesicle trafficking. Numerous studies in a variety of different cell models have suggested that dynamin may participate in the liberation of nascent vesicles from the plasma membrane (Herskovits et al., 1993; Damke et al., 1994; Henley et al., 1998; Oh et al., 1998), the Golgi apparatus (Henley and McNiven, 1996; Maier et al., 1996; Jones et al., 1998), and endosomal compartments (Llorente et al., 1998). Subsequent to the initial identification and cloning of the neuron-specific dynamin 1 from mammalian brain (Shpetner and Vallee, 1989; Obar et al., 1990), two additional dynamin genes have been identified. Dynamin 2 is found in all tissues examined (Cook et al., 1994; Sontag et al., 1994), whereas dynamin 3 is expressed in testis, muscle, brain, and lung (Nakata et al., 1993; Cook et al., 1996; Cao et al., 1998). The transcripts encoded by these genes are highly similar (>75%) and are expressed as a variety of alternatively spliced forms that may occupy distinct cellular locations (Cao et al., 1998; for recent reviews on the dynamin family, see Warnock and Schmid, 1996; Urrutia et al., 1997; McNiven, 1998). In addition to the conventional family of dynamins in mammals, dynamin-related genes have been identified in the yeast Saccharomyces cerevisiae. These proteins, Vps1p and Dnm1p, show a high degree of similarity to the mammalian dynamins in the N-terminal GTP-binding domain but lack a C-terminal proline-rich domain and a pleckstrin homology domain. Temperature-sensitive mutations in VPS1 cause a mislocalization and aberrant secretion of proteins normally trafficked to the vacuole (Vater et al., 1992), suggesting that Vps1p participates in Golgi-to-vacuole membrane trafficking.
Recently, we (Yoon et al., 1998) and others (Shin et al., 1997; Kamimoto et al., 1998) have identified a novel dynamin-like protein (DLP1) that shares 40 and 42% homology to Vps1p and Dnm1p, respectively. This protein is also referred to as DVLP (Dnm1/Vps1-like protein) (Shin et al., 1997) and dymple (dynamin family member proline-rich C-terminal domainless) (Kamimoto et al., 1998). As these acronyms suggest, DLP1 is more closely related to the yeast proteins described above than to the mammalian dynamins and does not possess a C-terminal proline-rich domain. Currently, the function of DLP1 is undefined, although morphological and biochemical studies (Yoon et al., 1998) have shown that DLP1 does not associate with endocytic organelles but instead resides on small punctate vesicles that are intimately associated with the endoplasmic reticulum (ER). Very recently, two independent laboratories have provided strong evidence that DLP1 is the mammalian equivalent to yeast Dnm1p and may participate in mitochondrial morphogenesis. Studies in yeast demonstrated that DNM1 is identical to the yeast gene MDM29 (mitochondrial distribution and morphology) (Shaw et al., 1997). Mdm29p/Dnm1p localizes to the yeast mitochondrial network, whereas mdm29 mutants induce the collapse of mitochondria into a tubular compartment, suggesting that Mdm29p/Dnm1p is involved in the maintenance of mitochondrial morphology (Shaw et al., 1997). A similar phenotype is observed in cultured mammalian cells expressing mutant DLP1 protein (Smirnova et al., 1998).
In this study, we have combined the expression of dominant-negative DLP1 constructs and antibody microinjection with extensive computer-assisted light and electron microscopic morphometric analysis to further define the role of DLP1 in a mammalian cell line (Clone 9). We found that a disruption of DLP1 function has no effect on endocytosis but dramatically alters the distribution and morphology of not only mitochondria but the ER as well. This study provides the first evidence suggesting that a dynamin family member participates in the maintenance of normal ER morphology and distribution.
MATERIALS AND METHODS
Cell Culture
All experiments were performed with the cultured normal rat liver cell line Clone 9 (CRL-1439, American Type Culture Collection, Rockville, MD) maintained at 37°C, 5% CO2 in Ham’s F-12K medium containing 10% FBS, 100 U/ml penicillin, and 100 μg/ml streptomycin (Life Technologies, Bethesda, MD).
Antibodies and Immunofluorescence
The rabbit polyclonal anti-DLP1 antibody was described previously (Yoon et al., 1998). Organelles were labeled with the following antibodies: mouse monoclonal anti-α mannosidase II (BAbCO, Richmond, CA) to label Golgi; mouse monoclonal anti-protein disulfide isomerase (PDI), rabbit polyclonal anti-calreticulin (both from Affinity BioReagents, Golden, CO), and rabbit polyclonal anti-sec61β (a gift from Dr. Tom Rapoport, Harvard University, Cambridge, MA) to label ER; human polyclonal autoimmune serum specific for the human M2 mitochondrial autoantigen dihydrolipoamide acetyltransferase (a gift from Dr. Vanda Lennon, Mayo Clinic, Rochester, MN) to label mitochondria; and mouse monoclonal anti-ERGIC-53 to label the intermediate compartment (a gift from Dr. Hans-Peter Hauri, Biocenter, Basel Switzerland). For secondary antibodies, FITC- (Kirkegaard and Perry Laboratories, Gaithersburg, MD) or Texas Red–conjugated goat anti-rabbit, goat anti-human, or goat anti-mouse immunoglobulin G or Cascade Blue–conjugated goat anti-mouse immunoglobulin G (Molecular Probes, Eugene, OR) was used to recognize primary antibodies. Cells were rinsed briefly with 37°C PBS, submerged in 37°C fixative [100 mM piperazine-N,_N_′-bis(2-ethanesulfonic acid), pH 6.95, 3 mM MgSO4, 1 mM EGTA, 2.5% formaldehyde], and incubated for 20 min at room temperature. For indirect immunocytochemistry, fixed cells were permeabilized with PBS containing 0.1% Triton X-100 and then incubated with the appropriate antibodies, as described previously (Henley and McNiven, 1996). Cells were rinsed three times with PBS and once with distilled water, followed by mounting in ProLong antifade reagent (Molecular Probes).
Generation of Constructs
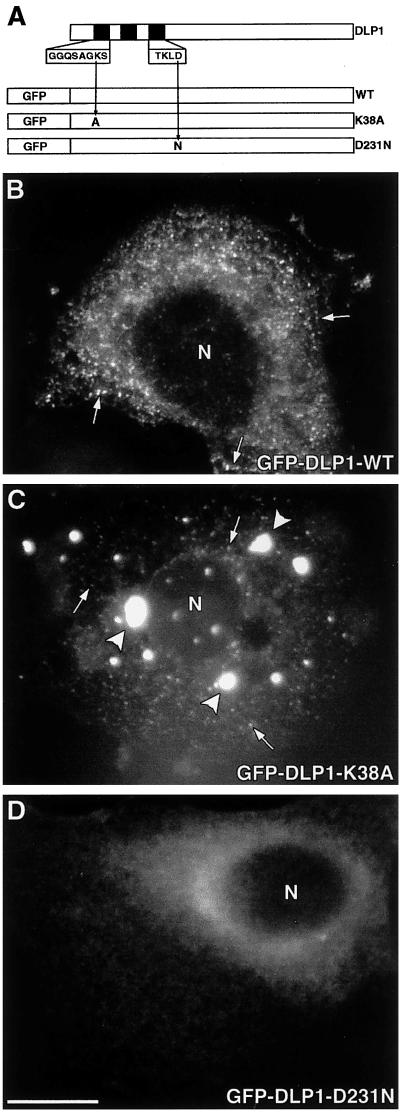
The point mutants K38A and D231N were generated with the use of standard site-directed mutagenesis techniques. PCR was performed with the use of the Expand High Fidelity PCR system (Boehringer Mannheim, Mannheim, Germany). PCR products were subcloned into pCR3.1 (Invitrogen, San Diego, CA) and sequenced on an automated DNA sequencer at the Mayo Molecular Biology Core Facility. Wild-type DLP1 (DLP1 WT), K38A, and D231N constructs were then cloned into pEGFP-C1 (Clontech, Palo Alto, CA) with either _Bsp_EI (New England Biolabs, Beverly, MA) or _Bgl_II (5′ end) and _Eco_RI (3′ end) (Life Technologies) in frame with green fluorescent protein (GFP), placing the GFP tag at the N-terminal end of the constructs (see Figure 1).
Figure 1.
GFP-tagged WT, K38A, and D231N show different localizations. (A) Diagram of full-length, untagged DLP1 with the N-terminal GTP-binding elements represented as black boxes. The amino acid sequences for the first and third elements are enlarged, and the GFP tag is situated at the N-terminal end of each construct. WT indicates wild-type GFP-DLP1, and the GFP-tagged point mutants are referred to as K38A and D231N. When transiently expressed in Clone 9 cells, these proteins show markedly distinct cellular distributions. WT DLP1 distributes to punctate vesicle-like structures (B, arrows) similar to the distribution described for endogenous DLP1. In contrast, K38A (C) accumulates into large aggregates (arrowheads) and also smaller punctate foci (arrows) similar to those observed in the WT cells. D231N exhibits a diffuse cytosolic distribution (D), suggesting a loss of membrane targeting. N, nucleus. Bar, 10 μm.
Transfections
All constructs were purified for transfections with plasmid purification columns (Qiagen, Hilden, Germany). Clone 9 cells were plated at 50–60% confluence 24 h before transfection in 35-mm tissue culture dishes with glass coverslips. Transfections were performed with the use of LipofectAMINE (Life Technologies) according to the manufacturer’s instructions. The cells were rinsed five times with HBSS (Sigma, St. Louis, MO) 16–24 h after transfection and processed for immunofluorescence as described above.
Microinjections
Microinjections were performed as described previously (Henley et al., 1998). Anti-DLP1 antibodies were dialyzed and concentrated (10–20 mg/ml) against microinjection buffer (10 mM KH2PO4, pH 7.2, 75 mM KCl). Cascade Blue hydrazide (trilithium salt, Molecular Probes) and Cascade Blue–conjugated dextran (3000 molecular weight, Molecular Probes) were added to antibody solutions at final concentrations of 2.5 mM and 2 mg/ml, respectively. Solutions for control injections were either microinjection buffer or heat-inactivated antibodies with fluorescent markers. Injected cells were allowed to recover for 2–8 h and then were fixed and processed for immunofluorescence or electron microscopy. DNA injections were performed by injecting the nuclei of cells with 0.05 mg/ml DNA diluted in reverse PBS (4 mM Na2HPO4, 1 mM KH2PO4, 140 mM KCl, pH 7.3). Tetramethyl rhodamine–conjugated dextran was added to DNA solutions at a final concentration of 0.2 mM. Injected cells were allowed to recover for 16–24 h before processing for microscopy.
Endocytosis Assay
Receptor-mediated and fluid-phase endocytosis were assayed with the use of fluorescent low-density lipoprotein (LDL) or dextran, respectively. Cells plated onto coverslips and expressing GFP constructs (vector alone, WT, K38A, or D231N) were incubated for 1.5 h at 37°C, 5% CO2 in serum-free medium. Cells were then incubated under the following conditions: 2, 5, 10, or 20 min at 37°C in the presence of 5 μg/ml Alexa594-conjugated transferrin (Molecular Probes); 20 min at 37°C in the presence of 6 μg/ml 1,1′-dioctadecyl-3,3,3′,3′-tetramethylindocarbocyanine perchlorate (DiI)-conjugated LDL (Molecular Probes); or 2 h at 37°C in the presence of 100 μM tetramethyl rhodamine–conjugated dextran. For LDL and dextran uptake, cells were washed three times for 1 min in HBSS and processed for fluorescence microscopy as described. For transferrin uptake, cells were acid washed in 1 ml of medium at pH 3.5, rinsed three times in HBSS, rinsed once in PBS, and processed for fluorescence microscopy as described. One hundred transfected cells from GFP vector, WT, K38A, or D231N coverslips were viewed and scored positive if fluorescent marker had been internalized. The transferrin time-course data confirmed 100% uptake at each time point (our unpublished results). The LDL and dextran data are expressed as mean number of cells internalizing marker.
Quantitation
Images were acquired with a Zeiss Axiovert 35 epifluorescence microscope (Carl Zeiss, Thornwood, NJ) equipped with a 100× objective (Zeiss Plan-Neofluar; numerical aperture, 1.30) and a Sensys cooled charge-coupled device camera (1400 × 1000 pixels; Photometrics, Tucson, AZ) driven by Metamorph 3.6 imaging software (Universal Imaging, West Chester, PA). Fluorescence images were acquired with identical camera settings and optics. For quantitation of transferrin, dextran, and LDL uptake, cells were counted positive for ligand uptake if fluorescent transferrin, dextran, or LDL could be visualized in the cytoplasm. These data were normalized to cells expressing GFP vector alone. For quantitation of mitochondrial and ER phenotypes, fluorescence images (taken 16 h after transfection or 8 h after injection) were processed with the use of MATLAB 5.2 (The MathWorks, Natick, MA). The cytoplasm of the cell was defined, with the use of phase-contrast images, as the region within the plasma membrane and outside of the nucleus. The total fluorescence intensity within the cytoplasm was measured for each cell used in the quantitation of the ER phenotype, and the mean intensity (±95% confidence interval) of each set of cells was calculated. Quantitation of the mitochondrial phenotype was performed by defining the fluorescent pixels within the cytoplasm as a single object. This object was then thresholded to within 70% of the maximum fluorescence value. This thresholding defined a new set of objects (contiguous patches of bright fluorescence) within the original object. The number of these new objects describes the discreteness of fluorescence and, in turn, mitochondrial discreteness. Cells with mitochondria dispersed throughout the cytoplasm have a large number of objects because the brightly fluorescent pixels are less contiguous. Conversely, cells with less discrete mitochondria have a small number of objects because most of the brightly fluorescent pixels are tightly clustered around the nucleus and are contiguous. The computer counted the number of objects for each cell in a set, and these data were expressed as discreteness of mitochondria (±95% confidence interval).
Quantitation of ER and mitochondrial volume density was performed by planimetry (Glauert, 1977; Weibel, 1979) with the use of digitized electron micrographs. ER was classified as thin membrane tubules in control cells (typically ribosome studded) and mutant-expressing cells (typically a mixture of both ribosome-studded and ribosomeless membrane tubules). ER and mitochondrial profiles were traced from digital images, and volume density measurements were made with Metamorph 3.6 software (Universal Imaging). Total ER and mitochondrial volume densities are expressed as percentages of total cell volume density, and the data from five control and five mutant cells were expressed as mean percentages of cell volume density (±SEM).
Electron Microscopy
Cells were rinsed with 37°C PBS, submerged in 37°C primary fixative (100 mM NaPO4, pH 7.2, 50 mM sucrose, 3.0% glutaraldehyde), and incubated for 1 h at room temperature. Cells then were incubated for 30 min at room temperature in 1% osmium tetroxide. Fixed cells were subsequently incubated for 30 min at room temperature in 1% uranyl acetate, dehydrated in a graded series of ethanol, embedded in Quetol 651 (Ted Pella, Redding, CA), and processed as described previously (Henley et al., 1998).
RESULTS
Transient Expression of Mutant DLP1 in Cultured Cells
To define the cellular function of DLP1 in mammalian cells, site-directed mutagenesis was used. Two point mutations within the GTP-binding elements of DLP1 were generated. The K38A mutation in DLP1 is equivalent to the K44A mutation in conventional dynamin, which has been shown to reduce its GTPase activity (van der Bliek et al., 1993; Damke et al., 1994). A mutation similar to D231N of DLP1 in ras p21 leads to a 100-fold reduced affinity for GTP (Feig et al., 1986) or a complete abolishment of GTP binding (Clanton et al., 1986). These point mutants, along with DLP1 WT, were cloned into a eukaryotic expression vector in frame with the C-terminal end of GFP for transfection into Clone 9 cells, a normal rat hepatocyte cell line. The GFP-tagged constructs are shown in Figure 1A. The lysine-to-alanine mutation (K38A) is located in the first GTP-binding element, and the aspartic acid-to-asparagine mutation (D231N) is located in the third GTP-binding element of DLP1. Throughout this study, we will refer to the GFP-tagged DLP1 constructs as WT, K38A, and D231N. Although cells expressing WT remained healthy indefinitely, mutant cells were viable for only 2–3 d. Thus, because the DLP1 mutations are lethal, all of the studies conducted here used transiently transfected cells. Consistent with the observation that the viability of Clone 9 cells is unaffected by the expression of WT, we have observed previously that the cytoplasmic distribution of WT (Figure 1B) appears identical to that of the endogenous protein in cells stained with a DLP1-specific antibody. Mainly, DLP1 associates with small punctate vesicular structures that often align along microtubules and tubules of the ER (Yoon et al., 1998). In striking contrast to this normal distribution, the DLP1 mutant proteins were either clustered into large cytoplasmic aggregates (K38A; Figure 1C) or were diffuse and cytosolic (D231N; Figure 1D). Clone 9 cells expressing the untagged DLP1 K38A mutant also showed large cytoplasmic aggregates (our unpublished results), suggesting that the localization and function of the expressed GFP-tagged DLP1 mutants are not artifacts of the epitope tag.
DLP1 Mutant Proteins Have No Effect on Endocytic Processes
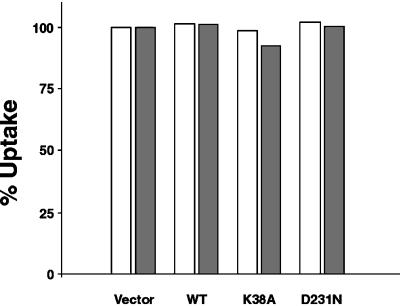
It has been shown that cells expressing the K44A mutation in conventional dynamin are defective in receptor-mediated endocytosis (Damke et al., 1994). However, as reported previously, endogenous DLP1 does not associate with endocytosed ligands or with dynamin or clathrin, two proteins involved in endocytic processes (Yoon et al., 1998). To confirm that DLP1 does not participate in endocytosis, we tested if DLP1-defective cells could internalize fluorescently labeled LDL or dextran, markers for receptor-mediated endocytosis or fluid-phase endocytosis, respectively. Clone 9 cells transfected with GFP vector, WT, K38A, or D231N were challenged to internalize fluorescently labeled LDL or dextran 16 h after transfection. Quantitation of LDL and dextran uptake revealed that cells expressing K38A or D231N showed no obvious differences in the size, shape, and distribution of endocytic compartments (not shown) or an impairment in ligand internalization compared with cells expressing WT or GFP vector alone (Figure 2). These findings are consistent with recent studies reporting no endocytic defect in a yeast DNM1 knockout (Otsuga et al., 1998) or in COS-7 cells expressing mutant DLP1 (Smirnova et al., 1998). Time-course experiments in transfected cells with fluorescently labeled transferrin revealed that DLP1 mutant–expressing cells were indistinguishable from untransfected cells at 2, 5, 10, or 20 min, further suggesting that mutants of DLP1 do not affect endocytosis (our unpublished results).
Figure 2.
DLP1 mutants do not affect endocytosis. Clone 9 cells expressing GFP vector alone, WT, K38A, or D231N were incubated with Texas Red–conjugated dextran or DiI-LDL, fixed, and observed by fluorescence microscopy. Cells containing fluorescent marker in the cytoplasm were counted positive for marker uptake. Quantitation of transfected cells reveals that DLP1 mutants do not affect the endocytosis of dextran (white bars) or LDL (gray bars) relative to cells expressing GFP vector alone. Time-course experiments in transfected cells with the use of Alexa-conjugated transferrin showed that DLP1 mutant–expressing cells were indistinguishable from untransfected cells at 2, 5, 10, or 20 min (our unpublished results). Data are expressed as percentage uptake normalized to cells expressing GFP vector alone.
Marked Changes in ER and Mitochondrial Morphology Occur When DLP1 Function Is Perturbed
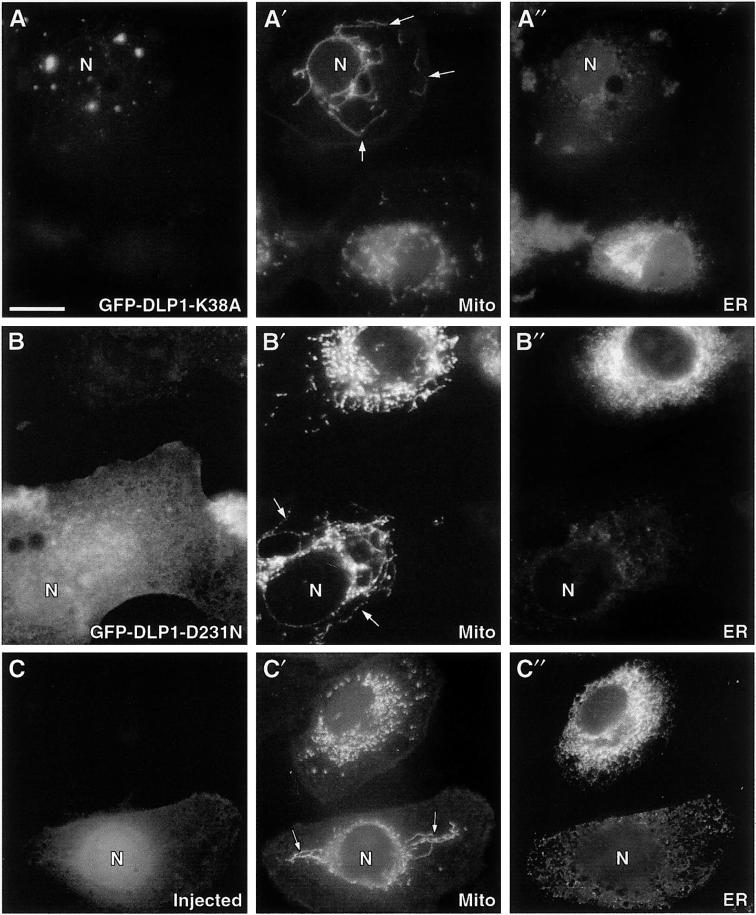
To determine whether DLP1 mutations affect cytoplasmic organization and organelle morphology, we immunostained cells 16 h after transfection with marker antibodies for the Golgi apparatus (α-mannosidase II), the ER (PDI), the intermediate compartment (ERGIC-53), and mitochondria (dihydrolipoamide acetyltransferase). Nuclear morphology was assessed by phase-contrast microscopy. As with the endosomal labeling described above, we observed no obvious alterations in the size, shape, number, and distribution of the Golgi, the intermediate compartment, or the nucleus. In contrast, cells expressing either of the two DLP1 mutants showed a dramatic alteration in the distribution and morphology of both the mitochondria and the ER. Figure 3 shows both DLP1 mutant–expressing cells and untransfected cells that have been labeled for mitochondria and ER. Cells expressing either K38A (Figure 3, A–A") or D231N (Figure 3, B–B") exhibited a pronounced collapse of mitochondria into the cell center. In many cells, mitochondria were aggregated and wrapped around the nucleus. These collapsed mitochondria also appeared to be connected into longer, tubule-like structures, in contrast to the many discrete structures found in control cells. In the same transfected cells, we also observed a substantial reduction in ER staining, indicating that normal ER morphology was compromised. Both the mitochondria and the ER phenotypes were dramatic compared with cells expressing WT, GFP vector alone (our unpublished results), or untransfected control cells (Figure 3, same fields).
Figure 3.
Inhibition of DLP1 function induces aberrant mitochondrial and ER phenotypes. Cells transfected with GFP-DLP1-K38A or GFP-DLP1-D231N or microinjected with inhibitory DLP1 antibodies were immunostained with antibodies to mitochondria (dihydrolipoamide acetyltransferase) and ER (PDI). (A) Cells expressing K38A show a reduction in uniform punctate DLP1 structures and the appearance of large aggregates. In the same cells, mitochondria appear to collapse toward the cell center, forming long tubules encircling the nucleus (A′, arrows) and losing the discrete size and shape observed in adjacent untransfected control cells. ER staining in these mutant cells is markedly reduced compared with that in adjacent untransfected control cells (A"). (B) Cells expressing D231N show a diffuse and markedly different distribution from cells expressing K38A or endogenous DLP1. Despite the difference in the distribution of the mutant D231N protein, these cells display the same aberrant mitochondrial (B′, arrows) and ER (B") phenotypes found in K38A-expressing cells. (C) A cell injected with DLP1 antibodies. The lower cell displays Cascade Blue–conjugated dextran concentrated in the nucleus and peripheral cytoplasm, confirming a successful injection. Mitochondrial staining in the same injected cell shows long tubular structures (C′, arrows) collapsed about the nucleus, similar to the aberrant mitochondria observed in the mutant cells. Note the collapse of the ER about the nucleus (C") and the reduced staining intensity, as in the mutant cells. N, nucleus of transfected or injected cells. Bar, 10 μm.
As an alternative method to inhibit DLP1 function, affinity-purified DLP1 antibodies were microinjected into Clone 9 cells. These antibodies have been shown to immunoprecipitate native DLP1 specifically from crude tissue homogenates and to stain the same punctate cytoplasmic structures to which WT GFP-DLP1 localizes (Yoon et al., 1998). After an 8-h recovery period, mock injected and antibody-injected cells were fixed and stained for the different cytoplasmic organelles described above. As shown in Figure 3, C–C", cells injected with DLP1 antibodies showed the same morphological changes observed in mutant cells, revealing elongated mitochondria that have collapsed around the nucleus and a pronounced reduction in ER staining.
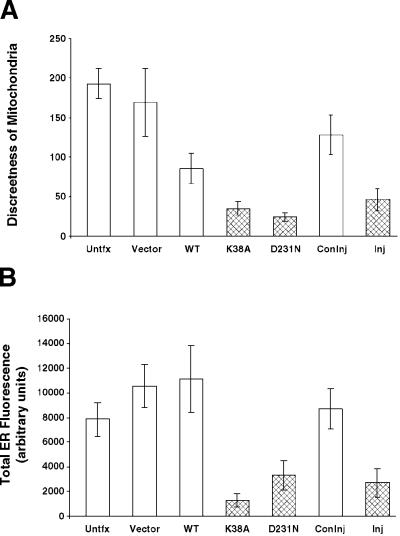
Transfected or microinjected cells often were easily identified by either collapsed mitochondria or reduced ER fluorescence. These characteristics allowed us to perform statistical analyses on large numbers of untransfected, transfected, and microinjected cells (see MATERIALS AND METHODS). Figure 4A shows that cells expressing either DLP1 mutant had fewer discrete mitochondria compared with untransfected control cells or cells expressing GFP vector, suggesting that the mitochondrial phenotype is a clustering event. The same effect was quantitated for cells injected with DLP1 antibodies compared with control injected cells (Figure 4A). Quantitation of the ER phenotype showed that cells either expressing DLP1 mutants or microinjected with antibodies exhibited a marked decrease in cytoplasmic ER fluorescence compared with control cells (Figure 4B). Expression of WT induced a modest clustering of mitochondria compared with DLP1 mutant–expressing cells, and no ER effect was evident. By quantitating the mitochondrial collapse and ER reduction, the frequencies of both phenotypes could be predicted with a high degree of confidence, regardless of the method of DLP1 inhibition.
Figure 4.
Quantitation of altered mitochondrial and ER phenotypes in DLP1 mutant–expressing cells or DLP1 antibody–injected cells. (A) The mitochondrial phenotype was quantitated by generating objects that correspond to mitochondrial discreteness (see MATERIALS AND METHODS). These objects were counted, and the data are expressed as the mean number of mitochondria ± 95% confidence intervals. In mutant cells (stippled bars), there are fewer discrete mitochondria than in control cells (white bars). Cells injected with inhibitory DLP1 antibodies (Inj, stippled bar) show a similarly decreased value compared with control injected cells (Coninj, white bar). (B) The ER phenotype was quantitated by measuring the total cytoplasmic fluorescence of cells stained for the ER (see MATERIALS AND METHODS). In mutant cells (stippled bars), a marked reduction in total ER fluorescence is observed compared with control cells (white bars). Cells injected with inhibitory DLP1 antibodies (Inj, stippled bar) show a similar reduction compared with control injected cells (Coninj, white bar). Data were collected from cells either 16 h after transfection or 8 h after injection.
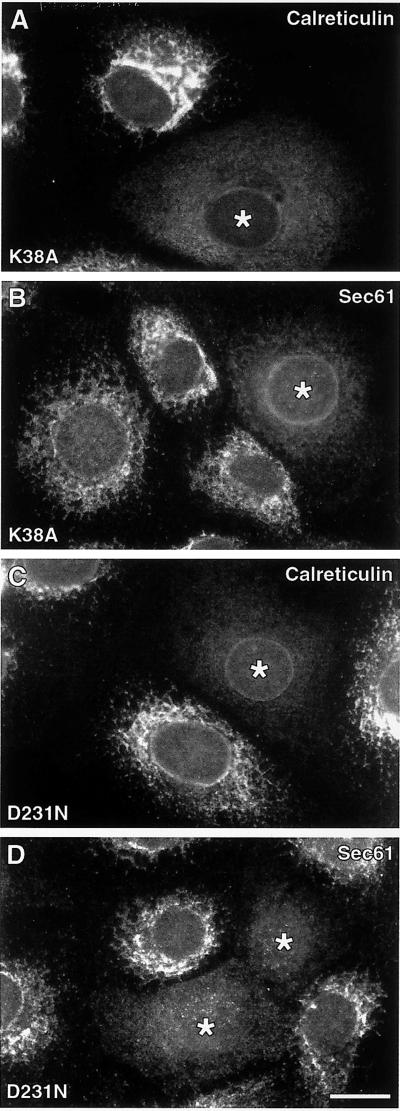
Although the mitochondrial phenotype we observed has been reported by others in DLP1 mutant cells (Otsuga et al., 1998; Smirnova et al., 1998), we were surprised to observe the dramatic alteration in ER staining. To ensure that this marked change was a reflection of an alteration in the ER membrane proper and not the result of an irrelevant technical change, we further characterized the ER phenotype in DLP1 mutant cells with the use of two additional ER-specific organelle markers, calreticulin and Sec61β. Calreticulin is a soluble ER luminal protein that functions as a molecular chaperone, and Sec61β is an ER transmembrane protein and a component of the ER protein translocation complex. Using these two markers, we observed the same change in ER morphology. Again, cells expressing either of the DLP1 mutants showed reduced ER profiles when stained with either the ER luminal or membrane markers (Figure 5). The ER profiles in these cells appeared vesiculated and blurred, accompanied by a general and substantial reduction in fluorescence intensity, consistent with the observations made in DLP1-defective cells stained for PDI (Figure 3). Thus, the fluorescence quantitation of the mutant cells stained for PDI depicted in Figure 4B is consistent with the ER staining of mutant cells with the use of other ER-specific markers.
Figure 5.
Cells expressing DLP1 mutant proteins exhibit ER abnormalities assessed by multiple ER markers. Cells transfected and expressing either untagged DLP1-K38A (A and B) or GFP-DLP1-D231N (C and D) were immunostained with either calreticulin, a soluble ER luminal marker (A and C), or Sec61β, an ER transmembrane protein (B and D). In every case, cells deficient in DLP1 function show a reduction in total ER fluorescence, consistent with the fluorescence quantitation data obtained with DLP1-defective cells stained with PDI, a soluble ER luminal marker (see Figure 4B). Asterisks, mutant-expressing cells. Bar, 10 μm.
Ultrastructural Changes in Mitochondria and ER Morphology in Cells Defective in DLP1 Function
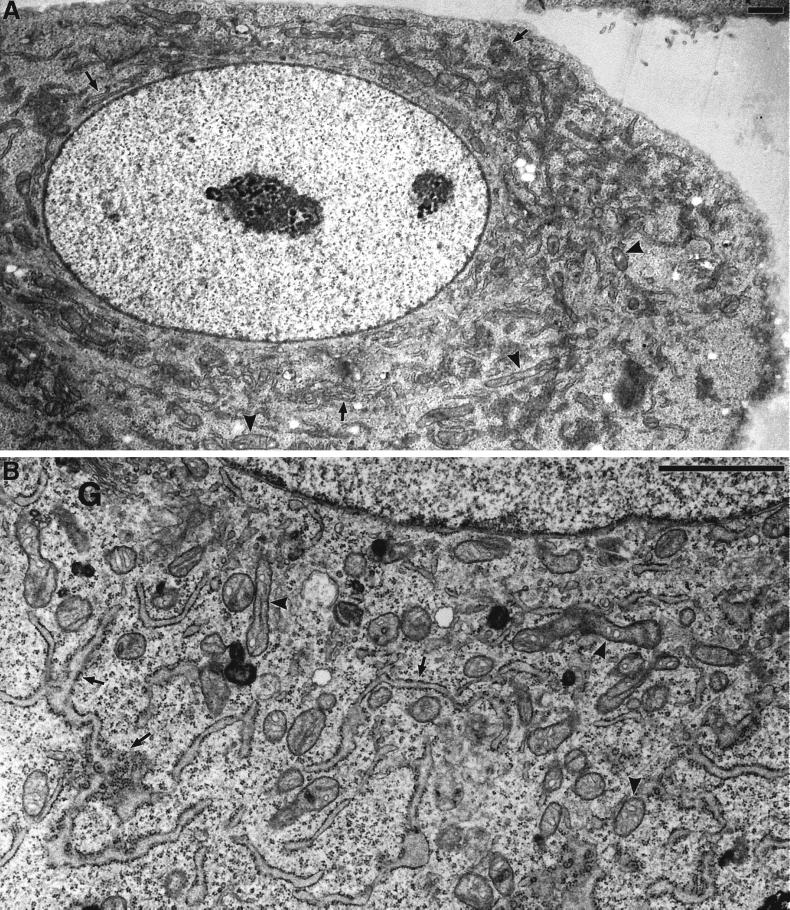
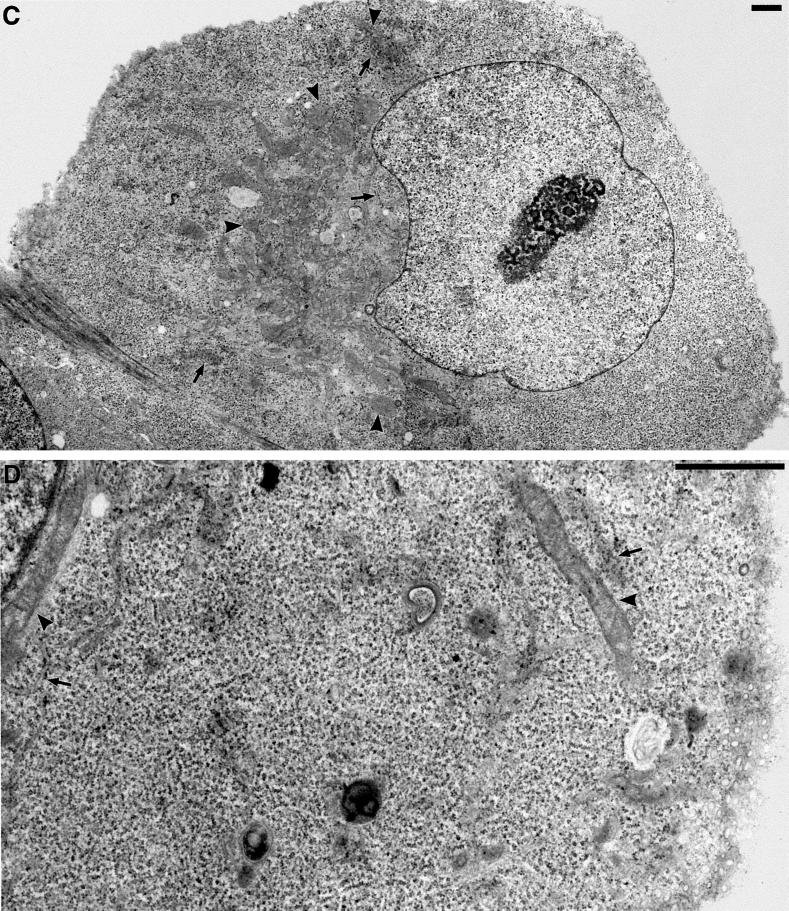
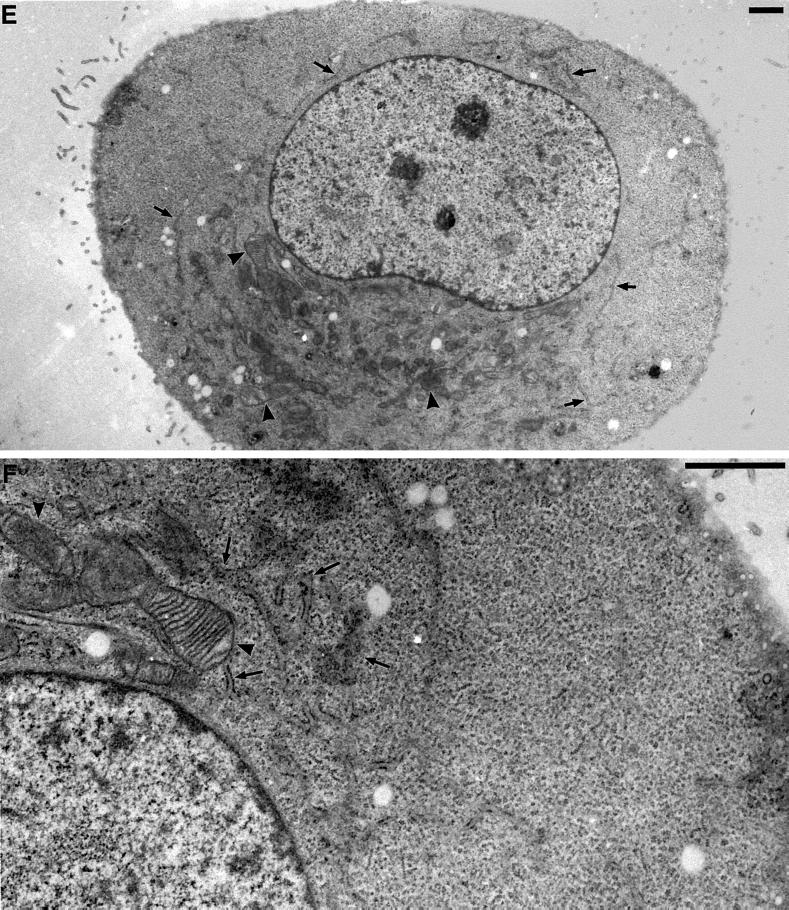
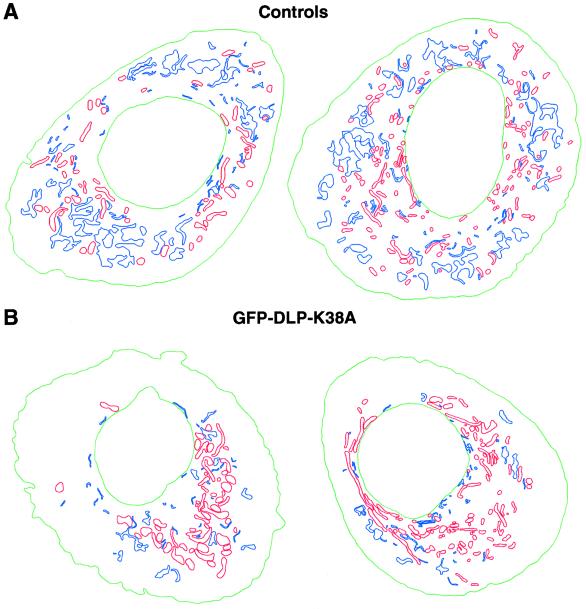
To further characterize the pleiomorphic phenotypes observed and quantitated by immunofluorescence microscopy, we performed thin-section electron microscopy on Clone 9 cells microinjected with GFP-tagged DLP mutant constructs or inhibitory antibodies to DLP1. Nuclear injections produced nearly 100% transfection efficiency and a population of cells that were known to express the transgene by virtue of their GFP tag. Micrographs of uninjected cells showed substantial amounts of ER cisternae distributed randomly throughout the cytoplasm (Figure 6A) interspersed with mitochondria of uniform size. At higher magnification, the ER cisternae in these cells exhibited discrete membranes studded with ribosomes. Both inner and outer mitochondrial membranes and cristae were also easily resolved (Figure 6B). In stark contrast, GFP-DLP1-K38A–injected cells exhibited a striking reduction in the number of ER profiles in the cytoplasm. This reduction of ER did not constitute a total loss of cellular ER, because short ER cisternae could be seen compacted together along with mitochondrial clusters close to the nuclear envelope (Figure 6, C and D, arrows). The large expanses of cytoplasm in mutant cells completely devoid of ER profiles contrasted markedly with control cells (Figure 6, A and B). Other organelles, such as the Golgi apparatus, plasma membrane, and nuclear envelope, appeared normal. However, the mitochondria in mutant cells appeared enlarged and elongated while maintaining highly resolved membranes and cristae. The mitochondria were collapsed to the nucleus, consistent with our observations by immunofluorescence (Figure 3) and with observations reported recently (Otsuga et al., 1998; Smirnova et al., 1998). In support of these observations in mutant cells, the same ultrastructural phenotypes were seen in cells injected with inhibitory DLP1 antibodies (Figure 6, E and F) or with GFP-DLP1-D231N (our unpublished results), suggesting that these reagents affect the ability of DLP1 to function properly in a process common to both the ER and the mitochondria. To better visualize any changes in the spatial organization of the ER and mitochondria, low-magnification electron micrographs of five control uninjected and five GFP-DLP1-K38A–injected cells were digitized, and both ER and mitochondrial profiles were traced (see MATERIALS AND METHODS). When organelle profiles from control and DLP1 mutant cells were traced and compared with each other, the differences in the spatial arrangement of the two organelles became even more striking. Control cells (Figure 7A) had large numbers of ER (blue) and mitochondrial (red) profiles distributed evenly throughout the section. In contrast, DLP1 mutant–expressing cells (Figure 7B) showed a drastic reduction of ER profiles and a collapse of mitochondria to a perinuclear region.
Figure 6.
Electron microscopy of changes in ER and mitochondrial distribution and morphology in DLP1-defective cells. Selected transmission electron microscopic images from control uninjected cells, cells fixed for 16–24 h after nuclear injection with GFP-DLP1-K38A, or cells injected with inhibitory DLP1 antibodies. In control cells, the cytoplasm is filled with long strands of interconnected rough ER (A, arrows) interspersed with mitochondria of uniform size (A, arrowheads). A higher magnification resolves the normal morphology of these prevalent organelles (B, arrows and arrowheads). In contrast, cells injected with GFP-DLP1-K38A (C and D) or inhibitory DLP1 antibodies (E and F) show mitochondria collapsed to a perinuclear region (C and E, arrowheads). These cells possessed shortened, ill-defined ER profiles close to the nuclear envelope (C and E, arrows) and large cytoplasmic expanses completely devoid of ER (compare A, C, and E). At higher magnification, the ER cisternae appear less defined and in close proximity to mitochondria, and the mitochondria appear swollen, elongated, and branched with highly resolved cristae (D and F, arrowheads). Bars, 1 μm.
Figure 7.
Spatial analysis of ER and mitochondrial profiles in control versus GFP-DLP1-K38A–injected cells. Tracings of ER and mitochondria from two control cells or two GFP-DLP1-K38A–expressing cells. (A) Control cells exhibit a uniform distribution of numerous ER profiles (blue) and mitochondria (red). (B) In contrast, cells expressing GFP-DLP1-K38A show a striking reduction in the number of ER profiles (blue) and a marked collapse, swelling, and tubulation of mitochondria (red). Nuclei are shown in green.
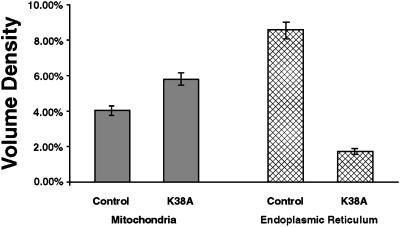
Computer-aided morphometric techniques were used to quantitate the ultrastructural changes in the defective cells described above. When total ER and mitochondrial volume densities were calculated by planimetry (Glauert, 1977; Weibel, 1979), two important observations were made. First, there was a 43% increase in total mitochondrial volume density (Figure 8, gray bars). Second, and most importantly, there was a striking 80% decrease in the total ER volume density (Figure 8, stippled bars). Both of these observations are consistent with our findings with qualitative and quantitative immunofluorescence and suggest that normal DLP1 function is necessary to maintain proper ER and mitochondrial morphology in mammalian cells.
Figure 8.
Ultrastructural quantitation of ER and mitochondrial phenotypes in GFP-DLP1-K38A–injected cells. ER and mitochondrial profiles were traced as depicted in Figure 7, and total ER and mitochondrial volume densities were calculated for five control and five K38A-expressing cells, as described in MATERIALS AND METHODS. The data are expressed as a percentage of total cell volume density ± SEM. In mutant cells, total mitochondrial volume density (gray bars) increased 43% over control. Strikingly, mutant cells exhibited an 80% decrease in the total ER volume density (stippled bars).
DLP1 Localizes to Mitochondria
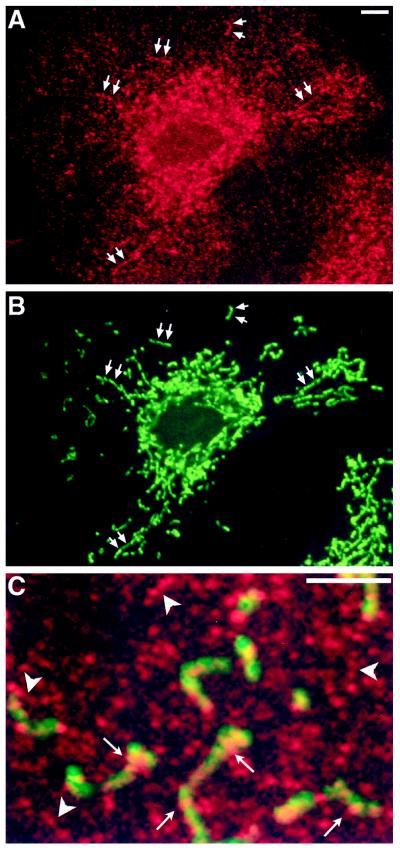
Based on the morphological observations described above, one would predict that DLP1 would associate with both the ER and the mitochondria. As we have described previously with the use of Western blot analysis of subcellular fractions, immunofluorescence microscopy, and immunoelectron microscopy (Yoon et al., 1998), DLP1 localizes to small cytoplasmic vesicles and ER tubules in mammalian cells. To determine if DLP1 associates with mitochondria, Clone 9 cells were fixed, permeabilized, and double stained with antibodies to DLP1 and mitochondria. As shown in Figure 9, DLP1-positive structures are distributed along the length of the mitochondria. Although these spots clearly align along mitochondria in a nonrandom manner, the incidence of this colocalization is low compared with that in the entire cytoplasmic DLP1 population. Indeed, very little DLP1 was found in a highly enriched mitochondrial fraction isolated from rat liver (our unpublished results), and the majority of DLP1-positive spots were cytoplasmic and arranged in linear, nonmitochondrial arrays (Figure 9C) previously shown to represent microtubules and ER cisternae. Together, these findings suggest that although DLP1 clearly associates with mitochondria, this interaction is not exclusive and is likely to be transient.
Figure 9.
DLP1 localizes along mitochondria. Immunofluorescence double labeling of Clone 9 cells for DLP1 (red) and mitochondria (green) reveals that DLP1-positive structures (A and B, arrows) align along mitochondria. Note that although this structural association is convincing (C, arrows), the majority of DLP1-positive structures are cytoplasmic and arranged in linear arrays (C, arrowheads) where no mitochondria are present. These linear, nonmitochondrial arrays of DLP1 have been shown previously to represent microtubules and ER cisternae. Bar, 2 μm.
DISCUSSION
In this study, we have combined two different experimental approaches, expression of dominant-negative mutants and microinjection of inhibitory antibodies, to provide insights into the cellular function of DLP1. All transfected or microinjected cells were scrutinized extensively by either fluorescence microscopy with organelle-specific markers (Figures 3 and 5) or electron microscopy (Figure 6). Using this approach, we have observed that inhibition of normal DLP1 function has profound effects on the morphology and distribution of both the ER and the mitochondria.
Mutations in DLP1 Alter Its Cytoplasmic Distribution and Are Lethal
Cultured Clone 9 cells expressing GFP-tagged mutant DLP1 (either K38A or D231N) revealed aberrant distributions of both DLP1 mutant proteins (Figure 1, C and D) compared with cells expressing wild-type GFP-DLP1 (Figure 1B). The K38A mutation in DLP1 is comparable to the K44A mutation in conventional dynamin, which has been shown to exhibit reduced binding and GTPase activity (van der Bliek et al., 1993; Damke et al., 1994). A mutation similar to D231N of DLP1 in ras p21 leads to an abolishment of GTP binding (Clanton et al., 1986; Feig et al., 1986). Although K38A protein appeared to associate into large cytoplasmic structures, the D231N protein was diffuse in distribution, as if association with membranes was prevented. These altered distributions suggest that GTP binding and hydrolysis regulate DLP1 localization. Despite these obvious differences in DLP1 distribution, cells expressing either mutant protein showed identical phenotypic changes in organelle morphologies, which led to cell death by 72 h after transfection. However, in the first 24 h after transfection (during which all studies were conducted), cells expressing DLP1 mutant protein appeared healthy by phase-contrast microscopy, showed normal nuclear, Golgi, intermediate compartment, and endosomal morphologies by fluorescence microscopy, and exhibited normal endocytic uptake of LDL, dextran (Figure 2B), and transferrin at multiple time points (our unpublished results).
Pleiomorphic Phenotypes Induced by Inhibition of DLP1
It has recently been reported that mutants of DLP1 in mammalian cells and in yeast produce dramatic changes in mitochondrial morphology. COS-7 cells expressing K38A (termed Drp1-K38A) possess mitochondria that form long tubular structures collapsed to a perinuclear region, as viewed by fluorescence and electron microscopy (Smirnova et al., 1998). In yeast harboring mutations in the putative DLP1 homologue Dnm1p, there is a collapse of the tubular mitochondrial network to one side of the cell cortex, as viewed by fluorescence microscopy (Otsuga et al., 1998).
Although an abnormal mitochondrial phenotype was observed in our study (Figures 3 and 6), supporting the findings of others (Otsuga et al., 1998; Smirnova et al., 1998), we also found that cells either expressing DLP1 mutant protein or microinjected with DLP1 antibodies showed a concomitant and striking change in ER morphology. In these cells, immunostaining for one integral and two soluble ER resident proteins revealed a reproducible reduction in ER fluorescence (Figures 3–5), suggesting a significant change in ER morphology. In support of these observations, electron microscopy of mutant cells revealed that mutant cells were largely devoid of ER cisternae except along the perinuclear region (Figure 6, D and F). It is important to note that this residual ER in mutant cells is altered in morphology as well as in distribution. Individual ER cisternae become significantly reduced in number, are short and fragmented, and possess “wispy” profiles reflecting membrane atrophy. Furthermore, ER profiles in these mutant cells appeared collapsed together with mitochondria, suggesting an intimate physical relationship between these two organelles. The ER phenotype is specific to the inhibition of DLP1, because ER morphology was unaltered in cells expressing the K44A mutant of conventional dynamin (our unpublished results).
Dynamic Interactions Involving ER and Mitochondria: A Regulatory Role for DLP1?
The morphological changes of the ER observed in cells expressing DLP1 mutants or injected with DLP1 antibodies suggest that the early secretory pathway in these cells could be impaired. However, Smirnova et al. (1998) have reported qualitative data showing no impairment in the trafficking of GFP-VSVG-tsO45 through the secretory pathway in DLP1 mutant cells. We tested the ability of DLP1 mutant–expressing cells to reform Golgi stacks after brefeldin A treatment and washout (ER-to-Golgi trafficking) and to transport VSV-G protein from the ER to the Golgi and to the cell surface (ER-to-Golgi trafficking and secretion) and observed no significant impairment (our unpublished results). In contrast to these findings, another group has shown a quantitative reduction (51%) in the secretion of a luciferase marker in CHO cells expressing DLP1-K38E (Imoto et al., 1998). Although this secretory impairment may not occur via a direct impairment of ER-to-Golgi trafficking, it could be representative of a secondary effect of the dramatic changes the ER sustains upon inhibition of DLP1.
What cellular functions does DLP1 provide to account for the pleiomorphic defects found in our mutant cells? It has been suggested that DLP1 functions in mitochondrial fission or branching (Otsuga et al., 1998; Smirnova et al., 1998). However, we believe that this prediction of DLP1 function may be oversimplified for several reasons. First, time-course experiments conducted in our current study have revealed that antibody-injected cells exhibit an aberrant mitochondrial phenotype as early as 1 h after injection (our unpublished results). Thus, this brief perturbation period would seem to be too short to account for a fission-dependent change in mitochondrial morphology. Second, we have observed that DLP1 localizes to a large number of vesicles in addition to the ER and mitochondria. These vesicles are abundant in the cytoplasm and are uniform in size. DLP1-positive vesicles have been shown to associate with microtubules and to exhibit directed movement, presumably as a result of this interaction (Yoon et al., 1998). The association of DLP1 with mitochondria shown in Figure 9, although convincing, represents a very modest amount of the total cytoplasmic DLP1. These data suggest that although DLP1 may function at mitochondria, it is likely to participate in a process other than mitochondrial fission or branching.
Although it is premature to predict the precise function of DLP1, several possibilities exist. Based on our observations that show that (1) both mitochondria and the ER exhibit phenotypic changes upon inhibition of DLP1, (2) the onset of these phenotypes in DLP1 antibody–injected cells is rapid, (3) DLP1 is localized to both the ER (Yoon et al., 1998) and the mitochondria (Figure 9), and (4) a significant amount of DLP1 is present in a vesicular population, it is possible that DLP1 regulates dynamic interactions between the ER and the mitochondria. These interactions could include (but are not limited to) several possibilities. First, DLP1 could regulate transient fusion events leading to membrane and/or protein flux between the two organelles. Indeed, physiological and structural interactions between mitochondria and the ER have been observed for some time. Physiological studies focused on phosphatidylserine (PS) transfer from the ER (the site of PS synthesis) to mitochondria (the site of PS decarboxylation to phosphatidylethanolamine [PE]) have led to the isolation of a mitochondria-associated membrane (MAM) fraction that exhibits many characteristics of the ER (Vance, 1990). Several lipid-synthesis reactions involving mitochondrially derived PE have been localized to the MAM, including PE _N_-methylation to phosphatidylcholine (Cui et al., 1993) and glycosylphosphatidylinositol synthesis steps requiring PE (Vidugiriene et al., 1999), suggesting that the MAM serves as a functionally specialized subcompartment of the ER that communicates with associated mitochondria. DLP1 may promote transient MAM-mitochondria interactions that facilitate lipid and/or protein movement back and forth between the two organelles. In this scenario, DLP1 may act to regulate MAM-mitochondria connections by severing the membrane bridge formed at collision-competent ER domains. Therefore, inhibition of DLP1 function would allow unchecked fusion and perhaps loss of ER membrane to mitochondria. This model would agree with our data showing that in cells expressing GFP-DLP1-K38A a 43% increase in mitochondrial volume density was observed along with an 80% decrease in ER volume density (Figure 8). Second, the association of DLP1 with a vesicle population prompted us to speculate about a novel vesicle-mediated membrane or protein flux between these two organelles. A recent report has convincingly demonstrated the transport of an N-linked glycosylated protein from the ER to the mitochondria (Chandra et al., 1998), further demonstrating that the ER and mitochondria possess the ability to exchange obligate biosynthetic reaction components, possibly via a vesicle-mediated process involving DLP1.
In light of the substantial morphological changes in both the ER and the mitochondria owing to mutations in, or inhibition of, DLP1 described in our report, another possible function of DLP1 could be to maintain and regulate the close ER and mitochondria apposition required for the efficient transfer of Ca2+ waves. It has recently been reported that when Ca2+ is released from the ER via inositol-1,4,5-trisphosphate–gated channels, mitochondria are exposed to a higher Ca2+ concentration than the surrounding bulk cytoplasm, suggesting that an organized spatial relationship between the two organelles must exist to facilitate proper Ca2+ signaling (Rizzuto et al., 1998). It has been shown that mitochondrial Ca2+ uptake is an important mechanism for activating mitochondrial metabolism (Denton and McCormack, 1990; Rutter et al., 1996), and recent electron microscopic tomography studies of rat liver ER/mitochondria clusters revealed multiple connections between the two organelles (Mannella et al., 1998), lending support to the idea of regulated spatial arrangement. Although there are no data linking such a spatial arrangement to DLP1 function, our data clearly support the hypothesis that DLP1 functions in a process involving both the ER and the mitochondria. Future studies measuring the flux of lipids and proteins between these two organelle systems in mutant cells may provide insights into the precise function of DLP1.
ACKNOWLEDGMENTS
Thanks to Dr. Vanda Lennon (Mayo Clinic, Rochester, MN) and Dr. Hans-Peter Hauri (Biocenter, Basel, Switzerland) for providing antibodies to dihydrolipoamide acetyltransferase and ERGIC-53, respectively. Thanks to Dr. Tom Rapoport (Harvard University, Cambridge, MA) for providing antibodies to Sec61β. The authors thank T. Pitts and T. Oliphant (Ultrasound Imaging Laboratory, Mayo Clinic) for help in developing the MATLAB scripts for quantitation of ER and mitochondrial phenotypes. We are grateful to B.J. Oswald for technical research assistance and figure formatting and to R.R. Torgerson, H.M. Thompson, and Dr. J.R. Henley for critical evaluation of the manuscript. K.R.P. is the recipient of an American Liver Foundation Predoctoral Research Fellowship (1998). This work was supported by a National Research Service Award postdoctoral fellowship from the National Institute of Diabetes and Digestive and Kidney Diseases (DK09574) to Y.Y. and National Institutes of Health grant DK44650 to M.A.M.
REFERENCES
- Cao H, Garcia F, McNiven MA. Differential distribution of dynamin isoforms in mammalian cells. Mol Biol Cell. 1998;9:2595–2609. doi: 10.1091/mbc.9.9.2595. [DOI] [PMC free article] [PubMed] [Google Scholar]
- Chandra NC, Spiro MJ, Spiro RG. Identification of a glycoprotein from rat liver mitochondrial inner membrane and demonstration of its origin in the endoplasmic reticulum. J Biol Chem. 1998;273:19715–19721. doi: 10.1074/jbc.273.31.19715. [DOI] [PubMed] [Google Scholar]
- Clanton DJ, Hattori S, Shih TY. Mutations of the ras gene product p21 that abolish guanine nucleotide binding. Proc Natl Acad Sci USA. 1986;83:5076–5080. doi: 10.1073/pnas.83.14.5076. [DOI] [PMC free article] [PubMed] [Google Scholar]
- Cook TA, Mesa K, Urrutia R. Three dynamin-encoding genes are differentially expressed in developing rat brain. J Neurochem. 1996;67:927–931. doi: 10.1046/j.1471-4159.1996.67030927.x. [DOI] [PubMed] [Google Scholar]
- Cook TA, Urrutia R, McNiven MA. Identification of dynamin 2, an isoform ubiquitously expressed in rat tissues. Proc Natl Acad Sci USA. 1994;91:644–648. doi: 10.1073/pnas.91.2.644. [DOI] [PMC free article] [PubMed] [Google Scholar]
- Cui Z, Vance JE, Chen MH, Voelker DR, Vance DE. Cloning and expression of a novel phosphatidylethanolamine N-methyltransferase: a specific biochemical and cytological marker for a unique membrane fraction in rat liver. J Biol Chem. 1993;268:16655–16663. [PubMed] [Google Scholar]
- Damke H, Baba T, Warnock DE, Schmid SL. Induction of mutant dynamin specifically blocks endocytic coated vesicle formation. J Cell Biol. 1994;127:915–934. doi: 10.1083/jcb.127.4.915. [DOI] [PMC free article] [PubMed] [Google Scholar]
- Denton RM, McCormack JG. Ca2+ as a second messenger within mitochondria of the heart and other tissues. Annu Rev Physiol. 1990;52:451–466. doi: 10.1146/annurev.ph.52.030190.002315. [DOI] [PubMed] [Google Scholar]
- Feig LA, Pan B-T, Roberts TM, Cooper GM. Isolation of ras GTP-binding mutants using an in situ colony-binding assay. Proc Natl Acad Sci USA. 1986;83:4607–4611. doi: 10.1073/pnas.83.13.4607. [DOI] [PMC free article] [PubMed] [Google Scholar]
- Glauert AM. Quantitative methods in biology. In: Glauert AM, editor. Practical Methods in Electron Microscopy. Vol. 6. New York: North Holland; 1977. pp. 29–31. [Google Scholar]
- Henley JR, Krueger EWA, Oswald BJ, McNiven MA. Dynamin-mediated internalization of caveolae. J Cell Biol. 1998;141:85–99. doi: 10.1083/jcb.141.1.85. [DOI] [PMC free article] [PubMed] [Google Scholar]
- Henley JR, McNiven MA. Association of a dynamin-like protein with the Golgi apparatus in mammalian cells. J Cell Biol. 1996;133:761–775. doi: 10.1083/jcb.133.4.761. [DOI] [PMC free article] [PubMed] [Google Scholar]
- Herskovits JS, Burgess CC, Obar RA, Vallee RB. Effects of mutant rat dynamin on endocytosis. J Cell Biol. 1993;122:565–578. doi: 10.1083/jcb.122.3.565. [DOI] [PMC free article] [PubMed] [Google Scholar]
- Imoto M, Tachibana I, Urrutia R. Identification and functional characterization of a novel human protein highly related to the yeast dynamin-like GTPase Vps1p. J Cell Sci. 1998;111:1341–1349. doi: 10.1242/jcs.111.10.1341. [DOI] [PubMed] [Google Scholar]
- Jones SM, Howell KE, Henley JR, Cao H, McNiven MA. Role of dynamin in the formation of transport vesicles from the trans-Golgi network. Science. 1998;279:573–577. doi: 10.1126/science.279.5350.573. [DOI] [PubMed] [Google Scholar]
- Kamimoto T, Nagai Y, Onogi H, Muro Y, Wakabayashi T, Hagiwara M. Dymple, a novel dynamin-like high molecular weight GTPase lacking a proline-rich carboxyl-terminal domain in mammalian cells. J Biol Chem. 1998;273:1044–1051. doi: 10.1074/jbc.273.2.1044. [DOI] [PubMed] [Google Scholar]
- Llorente A, Rapak A, Schmid SL, van Deurs B, Sandvig K. Expression of mutant dynamin inhibits toxicity and transport of endocytosed ricin to the Golgi apparatus. J Cell Biol. 1998;140:553–563. doi: 10.1083/jcb.140.3.553. [DOI] [PMC free article] [PubMed] [Google Scholar]
- Maier O, Knoblich M, Westermann P. Dynamin II binds to the trans-Golgi network. Biochem Biophys Res Commun. 1996;223:229–233. doi: 10.1006/bbrc.1996.0876. [DOI] [PubMed] [Google Scholar]
- Mannella CA, Buttle K, Rath BK, Marko M. Electron microscopic tomography of rat-liver mitochondria and their interaction with the endoplasmic reticulum. Biofactors. 1998;8:225–228. doi: 10.1002/biof.5520080309. [DOI] [PubMed] [Google Scholar]
- McNiven MA. Dynamin: a molecular motor with pinchase action. Cell. 1998;94:151–154. doi: 10.1016/s0092-8674(00)81414-2. [DOI] [PubMed] [Google Scholar]
- Nakata T, Takemura R, Hirokawa N. A novel member of the dynamin family of GTP-binding proteins is expressed specifically in the testis. J Cell Sci. 1993;105:1–5. doi: 10.1242/jcs.105.1.1. [DOI] [PubMed] [Google Scholar]
- Obar RA, Collins CA, Hammarback JA, Shpetner HS, Vallee RB. Molecular cloning of the microtubule-associated mechanochemical enzyme dynamin reveals homology with a new family of GTP-binding proteins. Nature. 1990;347:256–261. doi: 10.1038/347256a0. [DOI] [PubMed] [Google Scholar]
- Oh P, McIntosh DP, Schnitzer JE. Dynamin at the neck of caveolae mediates their budding to form transport vesicles by GTP-driven fission from the plasma membrane of endothelium. J Cell Biol. 1998;141:101–114. doi: 10.1083/jcb.141.1.101. [DOI] [PMC free article] [PubMed] [Google Scholar]
- Otsuga D, Keegan BR, Brisch E, Thatcher JW, Hermann GJ, Bleazard W, Shaw JM. The dynamin-related GTPase, Dnm1p, controls mitochondrial morphology in yeast. J Cell Biol. 1998;143:333–349. doi: 10.1083/jcb.143.2.333. [DOI] [PMC free article] [PubMed] [Google Scholar]
- Rizzuto R, Pinton P, Carrington W, Fay FS, Fogarty KE, Lifshitz LM, Tuft RA, Pozzan T. Close contacts with the endoplasmic reticulum as determinants of mitochondrial Ca2+ responses. Science. 1998;280:1763–1766. doi: 10.1126/science.280.5370.1763. [DOI] [PubMed] [Google Scholar]
- Rutter GA, Burnett P, Rizzuto R, Brini M, Murgia M, Pozzan T, Tavare JM, Denton RM. Subcellular imaging of intramitochondrial Ca2+ with recombinant targeted aequorin: significance for the regulation of pyruvate dehydrogenase activity. Proc Natl Acad Sci USA. 1996;93:5489–5494. doi: 10.1073/pnas.93.11.5489. [DOI] [PMC free article] [PubMed] [Google Scholar]
- Shaw JM, Otsuga D, Keegan B, Hermann G, Bleazard W. The dynamin-like GTPase, Dnm1p, is required for maintenance of yeast mitochondrial network morphology. Mol Biol Cell. 1997;8:425a. [Google Scholar]
- Shin HW, Shinotsuka C, Torii S, Murakami K, Nakayama K. Identification and subcellular localization of a novel mammalian dynamin-related protein homologous to yeast Vps1p and Dnm1p. J Biochem. 1997;122:525–530. doi: 10.1093/oxfordjournals.jbchem.a021784. [DOI] [PubMed] [Google Scholar]
- Shpetner HS, Vallee RB. Identification of dynamin, a novel mechanochemical enzyme that mediates interactions between microtubules. Cell. 1989;59:421–432. doi: 10.1016/0092-8674(89)90027-5. [DOI] [PubMed] [Google Scholar]
- Smirnova E, Shurland DL, Ryazantsev SN, van der Bliek AM. A human dynamin-related protein controls the distribution of mitochondria. J Cell Biol. 1998;143:351–358. doi: 10.1083/jcb.143.2.351. [DOI] [PMC free article] [PubMed] [Google Scholar]
- Sontag J-M, Fykse EM, Ushkaryov Y, Liu J-P, Robinson PJ, Sudhof TC. Differential expression and regulation of multiple dynamins. J Biol Chem. 1994;269:4547–4554. [PubMed] [Google Scholar]
- Urrutia R, Henley JR, Cook T, McNiven MA. The dynamins: redundant or distinct functions for an expanding family of related GTPases? Proc Natl Acad Sci USA. 1997;94:377–384. doi: 10.1073/pnas.94.2.377. [DOI] [PMC free article] [PubMed] [Google Scholar]
- Vance JE. Phospholipid synthesis in a membrane fraction associated with mitochondria. J Biol Chem. 1990;265:7248–7256. [PubMed] [Google Scholar]
- van der Bliek AM, Redelmeier TE, Damke H, Tisdale EJ, Meyerowitz EM, Schmid SL. Mutations in human dynamin block an intermediate stage in coated vesicle formation. J Cell Biol. 1993;122:553–563. doi: 10.1083/jcb.122.3.553. [DOI] [PMC free article] [PubMed] [Google Scholar]
- Vater CA, Raymond CK, Ekena K, Howald-Stevenson I, Stevens TH. The VPS1 protein, a homolog of dynamin required for vacuolar protein sorting in Saccharomyces cerevisiae, is a GTPase with two functionally separable domains. J Cell Biol. 1992;119:773–786. doi: 10.1083/jcb.119.4.773. [DOI] [PMC free article] [PubMed] [Google Scholar]
- Vidugiriene J, Sharma DK, Smith TK, Baumann NA, Menon AK. Segregation of glycosylphosphatidylinositol biosynthetic reactions in a subcompartment of the endoplasmic reticulum. J Biol Chem. 1999;274:15203–15212. doi: 10.1074/jbc.274.21.15203. [DOI] [PubMed] [Google Scholar]
- Warnock DE, Schmid SL. Dynamin GTPase, a force-generating molecular switch. Bioessays. 1996;18:885–893. doi: 10.1002/bies.950181107. [DOI] [PubMed] [Google Scholar]
- Weibel ER. Practical Methods for Biological Morphometry. New York: Academic Press; 1979. pp. 106–108. [Google Scholar]
- Yoon Y, Pitts KR, Dahan S, McNiven MA. A novel dynamin-like protein associates with cytoplasmic vesicles and tubules of the endoplasmic reticulum in mammalian cells. J Cell Biol. 1998;140:779–793. doi: 10.1083/jcb.140.4.779. [DOI] [PMC free article] [PubMed] [Google Scholar]
