Selective saturation of slow endocytosis at a giant glutamatergic central synapse lacking dynamin 1 (original) (raw)
Abstract
Exocytosis of synaptic vesicles is rapidly followed by compensatory plasma membrane endocytosis. The efficiency of endocytosis varies with experimental conditions, but the molecular basis for this control remains poorly understood. Here, the function of dynamin 1, the neuron-specific member of a family of GTPases implicated in vesicle fission, was investigated with high temporal resolution via membrane capacitance measurements at the calyx of Held, a giant glutamatergic synapse. Endocytosis at dynamin 1 KO calyces was the same as in wild type after weak stimuli, consistent with the nearly normal ultrastructure of mutant synapses. However, following stronger stimuli, the speed of slow endocytosis, but not of other forms of endocytosis, failed to scale with the increased endocytic load. Thus, high level expression of dynamin 1 is essential to allow the slow, clathrin-mediated endocytosis, which accounts for the bulk of the endocytic response, to operate efficiently over a wide range of activity.
Keywords: calyx of Held, clathrin, exocytosis, synaptic transmission, vesicle recycling
A distinctive property of presynaptic terminals is their high endocytic capacity. This property, which allows rapid recycling of synaptic vesicle membranes, enables synapses to function reliably even during high frequency axonal firing (1–4). A major pathway of synaptic vesicle membrane retrieval is clathrin-mediated endocytosis (5–8). Additional mechanisms of synaptic vesicle endocytosis have been suggested based on electrophysiology, live cell imaging and electron microscopy (2–4, 9).
Dynamin, a large GTPase, was proposed to have a global and essential function in all forms of synaptic vesicle endocytosis based on studies of dynamin mutants (shibire) in Drosophila (10), peptide microinjection studies (11) and pharmacological block (12–14). However, all of these experimental models result in an inhibited dynamin protein that may have dominant-negative effects mediated by the extensive network of protein–protein interactions in which dynamin participates. The occurrence of dynamin-independent mechanisms of synaptic vesicle retrieval after very intense repetitive stimulation has been reported recently (15). Thus, to fully understand the contribution of dynamin to different modes of synaptic vesicle recycling, it will be useful to examine these processes in neurons from dynamin KO mice.
Recently, endocytosis was investigated in neurons lacking dynamin 1 (16), the neuron-specific dynamin isoform and by far the most abundant dynamin in neuronal cells. Imaging studies of these neurons based on the pH-sensitive synaptic vesicle probe synaptopHluorin demonstrated a selective block of endocytosis during high frequency stimulation. Electron microscopy revealed a striking accumulation of endocytic clathrin-coated pits at a subset of synapses (predominantly inhibitory synapses), but a massive occurrence of bulk endocytosis after acute stimulation with a prolonged depolarizing stimulus (16, 17). One interpretation of these ultrastructural observations is that dynamin is implicated primarily or exclusively in clathrin-coated vesicle fission, but not in bulk endocytosis.
To gain further insight into the impact of the lack of dynamin 1 on different modes of synaptic vesicle retrieval, we have now examined this process with high precision and temporal resolution at the calyx of Held, a giant glutamatergic synapse in the brainstem. We report a selective contribution of dynamin 1 to slow endocytosis, a process thought to be accounted for predominantly by clathrin-mediated endocytosis (5, 12).
Results and Discussion
Ultrastructure of Calyces of Held Lacking Dynamin 1.
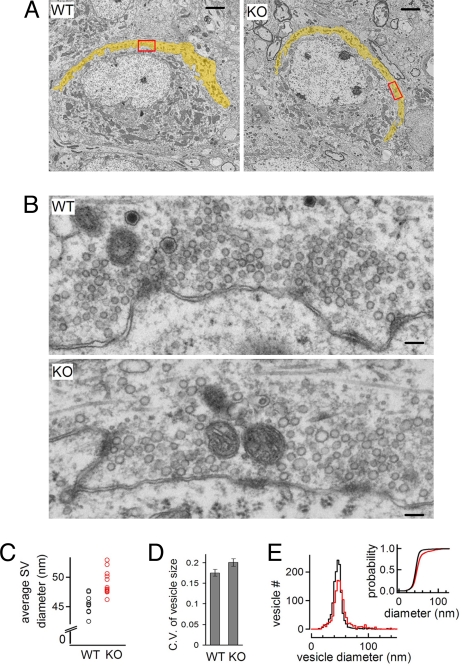
The overall appearance of dynamin 1 KO and wild-type (WT) calyces was very similar (Fig. 1A, yellow area). In both genotypes, synaptic vesicles, including vesicles docked at active zones (AZs), were abundant (Fig. 1B), although synaptic vesicles of mutant calyces were slightly larger and more heterogeneous in size (Fig. 1 B–E), as previously observed in dynamin 1 KO neurons in culture (16). The massive accumulation of clathrin-coated pits that is present at a subset of dynamin 1 KO neurons in culture, and which may reflect cell-type specific properties or spontaneous network activity (17), was not observed at mutant calyces.
Fig. 1.
Loss of dynamin 1 has no major impact on the ultrastructure of the calyx of Held. (A) Representative EM micrographs of MNTB neurons half-wrapped by the calyx of Held (yellow) in WT and KO mice. (B) High magnification view of the areas outlined by a red rectangle in A. Note the abundance of synaptic vesicles in the presynapse of both genotypes and that vesicles in the KO nerve terminal are more heterogeneous in size (see also D and E). Scale bar, 1 μm in (A) and 100 nm in (B). (C) Synaptic vesicle (SV) size is slightly larger at KO calyces (48.9 ± 0.55 nm, n = 13 synapses) than at WT calyces (45.4 ± 0.45 nm, n = 11 synapses; P < = 0.01). Each point represents an average value from one synapse. (D) The coefficient of variance (C.V.) of synaptic vesicle diameter is slightly larger at KO than WT synapses (0.18 ± 0.008, n = 11 synapses from 2 WT mice; 0.20 ± 0.009, n = 13 synapses from 2 KO mice; P = 0.047, unpaired t test), indicating that synaptic vesicle size at KO is less homogenous than that of WT calyces. (E) Histogram of the vesicle diameter (including larger vacuole) from WT (n = 11) and KO (n = 13) synapses. Inset shows the cumulative probability plot of vesicle diameter. Only the vesicles between 20 and 80 nm were included for analysis in C and D.
Endocytosis Is Not Affected After Weak Secretory Stimuli.
Pilot experiments revealed that various parameters of synaptic transmission [such as frequency and amplitude of miniature excitatory postsynaptic currents (mEPSCs), or kinetics of EPSCs] were not significantly different between controls and KOs. However, the amplitude of EPSCs elicited by action potentials was smaller at the KO synapses (data not shown).
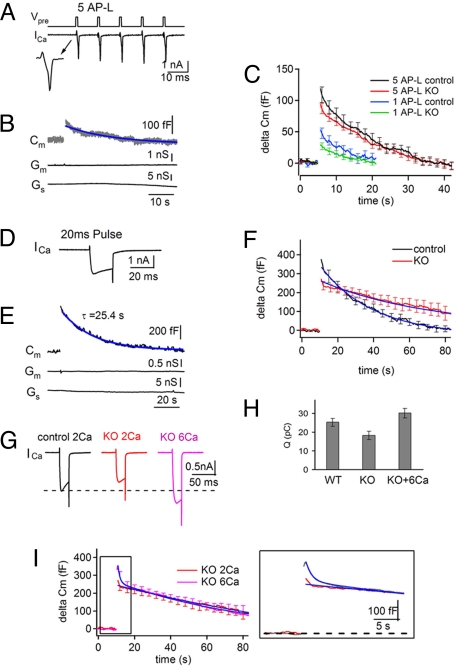
Compensatory endocytosis, which occurs in response to stimulation was monitored by membrane capacitance (Cm) measurements (18) via direct patch-clamping of the calyx (19–21). When 5 action potential-like (AP-L) depolarization pulses (1 ms, +20 mV at 100 Hz) were applied to a control presynapse (Fig. 2A Top), a brief presynaptic calcium current was activated in response to each pulse (Fig. 2A Bottom). No changes in membrane conductance (Gm) (with the exception of a very transient increase upon interruption of the stimulus) or in series conductance (Gs) were produced by each pulse. However, a small, transient increase in Cm was detected immediately after the short train (Fig. 2B), reflecting the net increase in the surface area of the presynaptic membrane induced by the stimulus-dependent exocytic response. The Cm increase recovered to the base line (endocytosis) with a rapid mono-exponential decay (Fig. 2B). While the time course of Cm recovery varied widely from synapse to synapse, the average time constant was 18.6 ± 2 s (n = 15) (Fig. 2C), which is comparable with the results obtained at the rat calyx of Held by Cm measurements (13, 22) and at small central synapses by pHluorin measurements (5, 14, 23, 24).
Fig. 2.
Stimulation-dependent impairment of vesicle endocytosis at dynamin 1 KO synapses. (A) Presynaptic calcium currents (Bottom) evoked by 5 AP-L pulses (1 ms, +20 mV at 10 ms interval, top). The inset shows the first calcium current at an expanded time scale. (B) Membrane capacitance (Cm, Top, the blue line is the fitted single exponential curve), membrane conductance (Gm, Middle) and series conductance (Gs, Bottom) induced by 5 AP-L presynaptic pulses. Note the jump in Cm after 5 AP-L stimuli and its subsequent decay to baseline (τ = 14 s), while Gm and Gs do not show any correlated change. (C) Averaged Cm signals evoked by a single AP-L and 5 AP-L pulses in control (black) and dynamin 1 KO (red) synapses. (D and E) Representative ICa (Top) and Cm trace (Middle) evoked by a single 20 ms (+10 mV) presynaptic pulse at a control synapse. The Cm increase was observed immediately after a presynaptic calcium influx and decayed to baseline with a single exponential (τ = 25.4 s). Gm and Gs (Bottom) did not change during recording. (F) Averaged Cm traces elicited at several calyces by a single 20 ms (+10 mV) pulse reveal a smaller increase in Cm and a slower recovery at KO synapses (red, τ = 62.7 ± 6.6 s, n = 9 synapses) relative to controls (black, τ = 30.7 ± 4.7s, n = 7 synapses; P = 0.0012 s). (G and H) Averaged ICa traces (G) and total calcium influx (H) evoked by a single pulse (20 ms, +10 mV) at control (black, n = 7) and KO synapses in 2 mM CaCl2, (red, n = 9) and 6 mM CaCl2 (pink, n = 6). (I) Averaged Cm changes evoked by a single pulse (20 ms, +10 mV) at KO synapses in 2 mM CaCl2 (red) and 6 mM CaCl2 (pink). Note that higher calcium influx did not affect the slow phase of Cm recovery but induced the appearance of an early fast component of recovery. In all fields, blue lines represent fitted curves.
When the same experiments were performed at dynamin1 KO synapses, a smaller increase in Cm was observed, consistent with the smaller EPSC amplitudes described above. However, a time course of membrane recovery (τ = 20.4 ± 3 s, n = 12; P = 0.63 compared with control) similar to that recorded in controls was observed (Fig. 2C). Cm recoveries in response to the (smaller) secretory responses evoked by a single AP-L stimulation were also comparable in KO and control synapses (τ = 12.1 ± 1.7 s, n = 6 for control; τ = 10.6 ± 1.4 s, n = 7 for KO; P = 0.51) (Fig. 2C).
Endocytosis Fails to Scale with an Increased Secretory Response.
The effect of a stronger stimulus on the time course of endocytosis was then tested. Stimulation of a control synapse with a 20 ms (+10 mV) depolarization triggered a large presynaptic calcium influx (Fig. 2D), and in turn a large Cm increase, without affecting in a substantial way Gm and Gs. Cm subsequently recovered to baseline with an exponential decay (Fig. 2E). After this stimulus, the amplitude of Cm increase was higher in control than in KO synapses (Fig. 2F). More importantly, the Cm decay in this case had a significantly slower time course in KO (τ = 62.7 ± 6.6 s) than in control synapses (τ = 30.7 ± 4.7 s; P = 0.0012) (Fig. 2F). In fact, recovery of Cm occurred nearly in a linear fashion, suggesting saturation of endocytic capacity at KO synapses.
Unexpectedly, presynaptic calcium currents evoked by a 20 ms pulse were smaller in dynamin1 KO synapses (Fig. 2 G and H). This finding, which may reflect the impact of the lack of dynamin 1 on the traffic of calcium channels, or on their regulation via indirect effects on signaling pathways, was not further investigated. To assess the potential impact of decreased calcium influx on endocytosis at KO synapses, extracellular CaCl2 was increased from 2 mM to 6 mM to compensate for the lower calcium permeability. Elevated extracellular CaCl2 (6 mM) clearly over-compensated for the decreased calcium influx at the KO synapses (Fig. 2 G and H) and induced a slightly larger Cm increase. Cm recovery under these conditions exhibited a double-exponential decay with the presence of a fast component that was barely detectable at physiological calcium concentrations (Fig. 2I). The predominant (slow) component of Cm recovery, however, was not affected by the increased calcium concentration. The occurrence of fast endocytosis upon increase of extracellular CaCl2 may reflect a direct action of calcium on endocytosis or be the consequence of an enhanced secretory response produced by higher calcium. For example, fast endocytosis may be unmasked only when the secretory response exceeds a certain threshold.
The Speed of Fast Endocytosis Is Not Affected by the Lack of Dynamin 1.
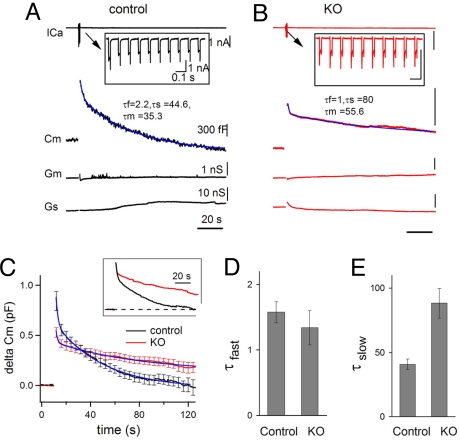
Fast and slow endocytosis were shown to coexist in several model nerve terminals after intense stimulation (12, 22, 25–27). To determine a potential differential impact of the absence of dynamin 1 on these two phases of endocytosis, an even stronger stimulus, i.e., a series of 10 depolarization pulses (20 ms, +10 mV, 10 Hz), was applied (Fig. 3 A and B). This stimulus elicited a large Cm increase at wild type synapses and the poststimulus Cm recovery clearly exhibited both a fast and a slow component, which fit a double exponential function (Fig. 3A). The fast component was generally smaller at KO (136 ± 15.9 fF, 24.5 ± 2% of total recovery, n = 12; P = 0.005) than at control synapses (351 ± 66 fF, 39.3 ± 4.6% of total recovery, n = 11), possibly due, at least in part, to a smaller secretory response (Fig. 3C). However, the time constant of this fast component was the same in KO and in controls (Fig. 3D). Once again, the slow component of Cm recovery was slower at KO synapses (Fig. 3E).
Fig. 3.
Fast and slow endocytosis elicited by strong stimuli at the calyx of Held. (A and B) Biphasic Cm recovery in response to a strong presynaptic stimulus (10 pulses at 10 Hz, each pulse was + 10 mV and 20 ms) recorded at a control (A) and a KO (B) synapse. Note the biphasic nature of the Cm recovery with distinct fast and slow components that are fitted by a double exponential function (τ fast = 2.2 s, τ slow = 44.6 s, weighted τ m = 35.3 s in (A)). Scale bars in (B) are the same as in (A). (C) Averaged Cm traces evoked by the same stimulus at control (n = 11) and KO (n = 12) calyces. The inset shows the time course of endocytosis after normalization of the two averaged curves to their peak amplitude. (D and E) The fast component of Cm recovery (C) has a similar time constant (D) but the slow component at KO synapses was much slower than control (E).
Saturation of Slow Endocytosis at Dynamin 1 KO Synapses.
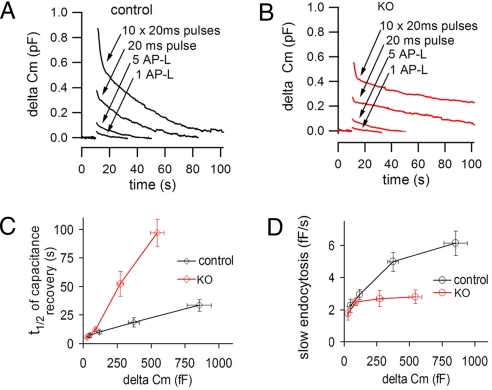
When the data shown in Figs. 2 C and F and 3C were pooled, the differential impact of the progressively stronger secretory bursts (i.e., Cm increase) on the time course of endocytosis became apparent. At control synapses, but not at KO synapses, the overall speed of endocytic recovery scaled with the increase in surface area (i.e., with the increase in Cm) at the end of the stimulus (Fig. 4 A and B). This difference was mainly accounted for by a difference in the speed of the slow component of the compensatory endocytic response, i.e., the component that accounts for the majority of Cm recovery. Plotting the half-time (t1/2) of the Cm recovery mediated by slow endocytosis against the Cm increase shows that control and KO curves overlap after very weak stimuli and then strongly diverge, with a much longer t1/2 at KO synapses (Fig. 4C). More strikingly, plotting endocytosis speed against Cm changes reveals a trend toward saturation of endocytosis speed in both genotypes. However, maximal speed is lower, and is reached after much smaller increases in surface area, at dynamin 1 KO synapses. The previous study of synaptic vesicle endocytosis in dynamin 1 KO neuronal cultures employing pHluorin-based assays also revealed an activity-dependent requirement for dynamin 1, but had suggested that dynamin 1 was not required for endocytosis upon interruption of the strong stimulus (16). While the reason for this difference remains to be explained, the present data unambiguously reveal an endocytic defect after a strong stimulus at an excitatory synapse in the central nervous system.
Fig. 4.
Rapid saturation of slow endocytosis after a brief stimulus at dynamin 1 KO synapses. (A and B) Averaged Cm traces from the experiments illustrated in Figs. 2 C and F and 3C are displayed together for each genotype. (C) t1/2 of endocytosis after different stimulatory conditions in control (black) and KO (red) synapses. The t1/2 became increasingly different as the size of the secretory response (i.e., Cm jump) increased. In C and D, only the slow phase of capacitance recovery was used for the calculations in the case of the10 Hz (10 pulses) stimulation. (D) The speed of endocytic membrane recovery was similar in control and KO synapses after small secretory responses, but quickly reached a plateau in KO synapses after larger secretory bursts.
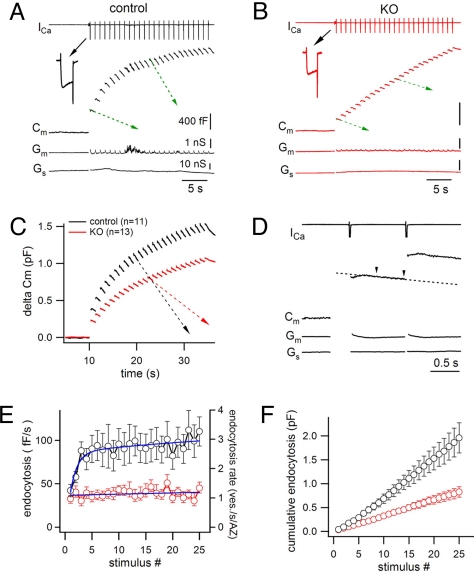
To analyze this saturation in more detail, progressive changes in the rate of endocytosis during the build up of an increasing endocytic load were examined. Because continuous capacitance measurements cannot be performed during high frequency stimulation, a low frequency train was used. Changes in Cm signals (Fig. 5A Middle) were recorded during the stimulation intervals of a train of 25 depolarization pulses (20 ms, + 10 mV) at 1 Hz (Fig. 5A Top). During such intervals Gm and Gs were stable, except for a very transient increase (τ = ∼73.6 ms) of Gm immediately following each pulse (Fig. 5A Bottom). To avoid this stimulation artifact (13, 22), only the last 500 ms of each 960 ms interval (between arrows, Fig. 5D) were used for subsequent analysis (Fig. 5 E and F). Calcium currents and step-like Cm increases were observed after each pulse in the train (Fig. 5A) and the amplitude of each Cm step gradually decreased, reflecting a progressive decrease of neurotransmitter release. The Cm decay after each pulse was strongly accelerated at control synapses during the first several pulses and then it appeared to reach a plateau (Fig. 5 A, C, and E). In contrast, at KO synapses, Cm decay after each pulse occurred with similar speed throughout the train (≈38 fF/s, see supporting information (SI) Materials and Methods) (Fig. 5 B, C, and E), suggesting that the endocytic capacity is already saturated after the first stimulus.
Fig. 5.
Saturation of endocytic capacity during continuous stimulation. (A) A control calyx was subjected to a train of 25 pulses (20 ms, 10 mV at 1 Hz) while the calcium influx (Top) was monitored. Cm changes (Middle), as well as Gm and Gs (Bottom), were also recorded before stimulation and after each pulse (see also D). Note the different slopes of Cm decay at different times (green arrows). (B) Representative recording from a dynamin1 KO synapse stimulated as in (A). The slope of the Cm recovery (green arrows) was very similar throughout the train. Scale bars are the same as (A). (C) Averaged capacitance changes during the 1 Hz train in control (n = 11) and dynamin 1 KO (n = 13) synapses. (D) Magnified view of the traces shown in A in response to the first two pulses. The rate of membrane recovery was calculated as the slope of a line that fits the Cm signal during the last 500 ms interval (between two arrow heads) after each pulse. (E) At control synapses (black trace, n = 11), the endocytic rate increased during the first few pulses of the 1 Hz train, and then reached a relatively stable level. In contrast, the endocytosis rate was constant during the entire train at KO synapses (red trace, n = 13). The right ordinate shows the predicted endocytic capacity (vesicles/s/AZ), based on published estimates of the number of AZ per calyx. (F) The cumulative retrieval of presynaptic membrane during the train was approximately double in control compared with KO synapses.
The increase in endocytic speed at control synapses may reflect a progressive engagement of fast endocytosis, which does not appear to occur under the 1 Hz stimulation at KO synapses (Fig. 5E). As a result of the difference in endocytic speed, cumulative membrane retrieval at KO synapses fell behind control synapses early in the train and was half of control levels at the end of the train (Fig. 5F). A main conclusion of these experiments is that even with this protocol of stimulation, the key difference between control and KO synapses is an earlier saturation of the endocytic capacity. Note that the overall increase in Cm was lower at KO than control synapses throughout the train, as seen above for other patterns of stimulation. Because endocytosis at control synapses better offsets the increase in Cm during the stimulus train, the observed difference in Cm increase between the two genotypes underestimates the overall difference in the secretory response.
Clathrin-Mediated Endocytosis Is Impaired at Stimulated Mutant Synapses.
It had been proposed that fast and slow endocytosis represent clathrin-independent and clathrin-dependent membrane retrieval, respectively (5, 12, 28). Consistent with this possibility, previous ultrastructural studies of dynamin 1 KO synapses revealed a striking activity-dependent accumulation of clathrin-coated pits, while bulk endocytosis induced by a strong stimulus still occurred (17). To determine whether the endocytic delay observed in dynamin 1 KO calyces is because of an impairment of clathrin-mediated endocytosis, electron microscopy on stimulated calyces was performed. Inspection of preparations subjected to electrical stimulations revealed a poor preservation of morphology that was incompatible with reliable ultrastructural analysis. Such analysis was therefore performed on calyces from brainstem slices incubated for 90 s in high (90 mM) K+ solution (Fig. 6).
Fig. 6.
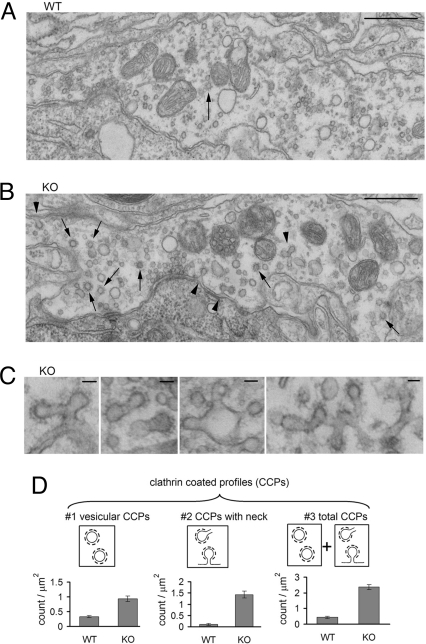
Clathrin-mediated endocytosis is impaired at stimulated dynamin 1 KO synapses. (A and B) Ultrastructure of WT (A) and dynamin 1 KO (B) calyces after 90 s high K+ stimulation. Clathrin-coated profiles (CCPs) are more numerous in the KO nerve terminal. Arrow heads = CCPs with a tubular neck, arrows = vesicular CCPs. (Scale bar, 500 nm.) (C) Gallery of CCPs with tubular necks from stimulated KO nerve terminals. (Scale bar, 50 nm.) (D) CCPs are significantly more abundant at dynamin 1 KO synapses (n = 10) than at WT synapses (n = 8) after high K+ stimulation.
While clathrin-coated endocytic intermediates were observed in both WT (Fig. 6A) and KO synapses (Fig. 6B), the number of such intermediates was much higher in KO synapses (Fig. 6D). Furthermore, clathrin-coated pits with a long tubular neck, reflecting a defect in vesicle fission, were only observed in KO synapses (Fig. 6 C and D). Most likely, based on previous tomographic studies of dynamin 1 KO synapses (16, 17), even-coated profiles without a neck represent buds rather than free vesicles. These results strongly support the hypothesis that the slower endocytic recovery observed at dynamin 1 KO synapses is primarily or exclusively because of an impairment of clathrin-mediated endocytosis (12).
Very Large Endocytic Events Do Not Require Dynamin 1.
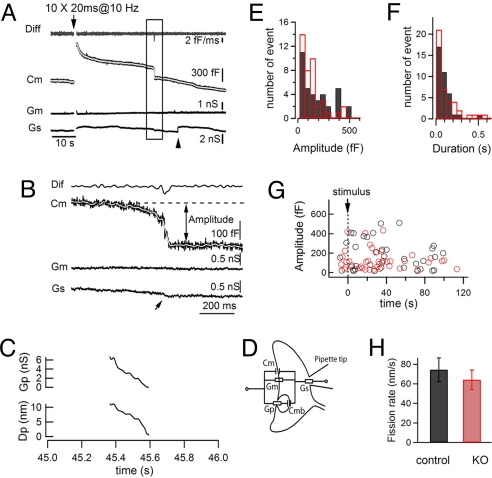
Recently, Wu and Wu reported the occurrence of large downward Cm steps at the calyx of Held, thought to reflect large endocytic events (29). The nature of these events is unclear because the size of the vacuoles involved, as predicted by capacitance measurements [20–500 fF, corresponding to a diameter of 0.8–4.1 μm for a spherical vesicle (29)], greatly exceeds the size of typical vacuoles involved in bulk endocytosis (range from 100 to 400 nm in diameter), as documented by electron microscopy studies (7, 17, 30, 31). The same events have been described at pituitary nerve terminals (32). Occasionally, during our Cm recordings, similar stepwise downward capacitance events were observed (Fig. 7 A–C). Note that Gm did not change and that Gs only underwent a very minor and transient change. Based on the equivalent electrical circuit of the recording (Fig. 7D) and on the amplitude of the capacitance change involved in each endocytic step, the conductance (Gp) and the diameter (Gd) of the fission pore can also be derived with high temporal resolution (29, 32), thus yielding information about the time course of fusion pore closure. In the example shown in Fig. 7 A and B, the fission pore diameter decreased from ≈10 nm to 0 (i.e., fission) within ≈220 ms (Fig. 7C).
Fig. 7.
Loss of dynamin 1 does not affect the kinetics of very large membrane retrieval events. (A) A typical large downward stepwise event observed during Cm recording from a control synapse. The trace representing the rate of Cm change (Diff) to identify the timing of such an event is shown at the top. No clear Gs and Gm changes were observed when the event occurred. The low-pass filtered (30 Hz) Cm trace is shown in gray. (B) Same event as in A is shown at an expanded time scale. (C) Fission pore conductance (Gp) and fission pore diameter (Dp) derived from the event shown in (B) based on the equivalent electrical circuit (D) of recording at the calyx of Held and equations (1)–(3) (see SI Materials and Methods). (D) Equivalent electrical circuit of recording at the calyx of Held. (E–G) Amplitude (E), 20–80% duration (F) and timing (G) of downward stepwise events recorded from both control (black, 36 events from16 synapses) and KO (red, 41 events from 20 synapses) synapses. (H) Average speed of fission pore closure in both genotypes. Data from control and KO synapses are shown in black and red, respectively.
A population of these events were recorded at both control (36 events from 16 synapses) and dynamin 1 KO (41 events from 20 synapses) synapses. In both groups their size varied widely, with the smallest steps occurring more frequently (Fig. 7E). Their time course was also quite variable, ranging from tens to hundreds ms (Fig. 7F). While they were more frequently observed during the recovery of capacitance after a strong stimulation, they also occurred at random during the control recording before stimulation (Fig. 7G). No significant differences in their properties, including the speed of fission pore closure (Fig. 7H), were observed between the two genotypes, ruling out a role for dynamin 1 in their occurrence.
Concluding Remarks.
We conclude that the critical difference between control and dynamin 1 KO calyces of Held synapses is the efficiency of slow endocytosis. In the absence of dynamin 1, this predominant component of the endocytic response still occurs and leads to complete membrane recovery. However, the speed of this process no longer scales with the endocytic load and capacitance recovery following a strong increase in surface area is delayed. Thus, a main function of dynamin 1, i.e., the dynamin isoform that accounts for the overwhelming majority of total dynamin in nerve terminals (16), is to enable the presynapse to accommodate high levels of slow endocytosis in response to a strong endocytic load. It is of interest, in this respect, that both dynamin 1 levels (16, 33) and endocytic capacity (27) increase during the maturation of the nervous system.
Fast endocytosis, which becomes prominent after a very strong high frequency stimulus and which may be mediated by bulk endocytosis (28), can still occur, and with a similar time course, in the absence of dynamin 1. The occurrence of bulk endocytosis at dynamin 1 KO synapses was clearly demonstrated by electron tomography and by electron microscopy studies of the uptake of extracellular tracers (17). One piece of evidence for the role of dynamin in fast endocytosis is the blocking effect by GTPγS (12). We note, however, that GTPγS also has strong effects on GTPases that control actin dynamics, a process likely to participate in bulk endocytosis (34).
Because the rate and time course of the slow component of endocytosis increases in a continuous fashion in response to progressive Cm increases, this component is likely to be accounted for by a single endocytic mechanism. Our previous and present ultrastructural studies indicate that clathrin-dependent endocytosis likely accounts for this slow form of recovery (5, 7, 12). A major (or exclusive) contribution of clathrin-mediated endocytosis to slow endocytosis is consistent with previous conclusions obtained at wild type synapses based on dynamic imaging of pHluorin-tagged synaptic vesicle proteins (5).
It will be of interest to determine whether the remaining dynamin 1-independent slow endocytosis depends on dynamin 2 and/or 3. The presence of the highly abundant dynamin 1 may become critical only when a high endocytosis speed is needed. After weak secretory responses, the absence of dynamin 1 may not be rate limiting and the demand for dynamin activity may be met by dynamin 2 and/or 3.
Materials and Methods
Dynamin 1 KO mice were outbred to mice of the CD-1 genetic background for 2–3 generations. This genetic background helped to more reliably prolong their lifespan to ≈2 weeks thus facilitating experiments at the calyx of Held. All of the experiments were performed on littermate offspring at 8–11 days of age (P8–11), roughly the age of hearing onset in mice (P12–13).
Preparation of mouse brainstem slices (160–200 μm) including the Medial Nucleus of the Trapezoidal Body (MNTB) and whole-cell patch clamp recordings (EPC10–2, HEKA) at the calyx of Held were carried out as described previously (20). The internal solution contained (in mM) 135 cesium gluconate, 20 tetraethylammonium chloride (TEA-Cl), 5 Na2-phosphocreatine, 10 Hepes, 4 MgATP, 0.3 Na2GTP (pH 7.3, 300–310 mOsm) and EGTA (0.2 or 5 mM for pre- and postsynaptic recording respectively). Cm measurements were performed at the presynapse by the Sine + DC technique (18, 35). A linear regression line obtained from the Cm trace before stimulation (5–10 s) was subtracted from the Cm trace to correct the Cm baseline drift (13, 22, 27). The first 400 ms of Cm after each pulse were omitted for analysis unless otherwise specified to avoid capacitance changes unrelated to synaptic transmission (13, 22). Average traces were calculated across individual Cm traces, error bars were shown every several seconds for clarity. Large endocytic events were analyzed as described (29, 32), using detection threshold of 15 fF. Detailed methods are described in the SI Materials and Methods. Endocytic rates were measure at RT (20–22°C) and they may be an underestimate of in vivo rates because of the temperature dependence of endocytosis (27).
For electron microscopy, pups (P 8–11) were perfused transcardially with 2% paraformaldehyde-2% glutaraldehyde in 0.1 M sodium cacodylate buffer (pH 7.4) and then processed as described previously (16, 17) (see SI Materials and Methods). For the high K+ stimulation, slices prepared as described for electrophysiology were transferred to a 90 mM K+ buffer for 90 sec at RT, and finally fixed and processed for electron microscopy as above. Ultrastructure quantification was performed by using the iTEM software (Olympus).
All of the data were analyzed by using Igor Pro. 6.03A (Wavemetrics). Values were given as mean ± SEM. The significance of the difference was evaluated by the Student's t tests (two-tailed distribution) unless otherwise noted. P < 0.05 was taken as the level of significance.
Supplementary Material
Supporting Information
Acknowledgments.
We thank Frank Wilson and Lijuan Liu for outstanding assistance. This work was supported in part by National Institutes of Health Grants NS36251 and DK45735 and by the G. Harold and Leila Y. Mathers Charitable Foundation. S.M.F. was supported by a postdoctoral fellowship from the Canadian Institutes of Health Research.
Footnotes
The authors declare no conflict of interest.
References
- 1.Royle SJ, Lagnado L. Endocytosis at the synaptic terminal. J Physiol. 2003;553:345–355. doi: 10.1113/jphysiol.2003.049221. [DOI] [PMC free article] [PubMed] [Google Scholar]
- 2.Murthy VN, De Camilli P. Cell biology of the presynaptic terminal. Annu Rev Neurosci. 2003;26:701–728. doi: 10.1146/annurev.neuro.26.041002.131445. [DOI] [PubMed] [Google Scholar]
- 3.Wu LG, Ryan TA, Lagnado L. Modes of vesicle retrieval at ribbon synapses, calyx-type synapses, and small central synapses. J Neurosci. 2007;27:11793–11802. doi: 10.1523/JNEUROSCI.3471-07.2007. [DOI] [PMC free article] [PubMed] [Google Scholar]
- 4.Harata NC, Aravanis AM, Tsien RW. Kiss-and-run and full-collapse fusion as modes of exo-endocytosis in neurosecretion. J Neurochem. 2006;97:1546–1570. doi: 10.1111/j.1471-4159.2006.03987.x. [DOI] [PubMed] [Google Scholar]
- 5.Granseth B, Odermatt B, Royle SJ, Lagnado L. Clathrin-mediated endocytosis is the dominant mechanism of vesicle retrieval at hippocampal synapses. Neuron. 2006;51:773–786. doi: 10.1016/j.neuron.2006.08.029. [DOI] [PubMed] [Google Scholar]
- 6.Balaji J, Ryan TA. Single-vesicle imaging reveals that synaptic vesicle exocytosis and endocytosis are coupled by a single stochastic mode. Proc Natl Acad Sci USA. 2007;104:20576–20581. doi: 10.1073/pnas.0707574105. [DOI] [PMC free article] [PubMed] [Google Scholar]
- 7.Heerssen H, Fetter RD, Davis GW. Clathrin dependence of synaptic-vesicle formation at the Drosophila neuromuscular junction. Curr Biol. 2008;18:401–409. doi: 10.1016/j.cub.2008.02.055. [DOI] [PMC free article] [PubMed] [Google Scholar]
- 8.Zenisek D, Steyer JA, Feldman ME, Almers W. A membrane marker leaves synaptic vesicles in milliseconds after exocytosis in retinal bipolar cells. Neuron. 2002;35:1085–1097. doi: 10.1016/s0896-6273(02)00896-6. [DOI] [PubMed] [Google Scholar]
- 9.LoGiudice L, Matthews G. Endocytosis at ribbon synapses. Traffic. 2007;8:1123–1128. doi: 10.1111/j.1600-0854.2007.00591.x. [DOI] [PubMed] [Google Scholar]
- 10.Koenig JH, Ikeda K. Disappearance and reformation of synaptic vesicle membrane upon transmitter release observed under reversible blockage of membrane retrieval. J Neurosci. 1989;9:3844–3860. doi: 10.1523/JNEUROSCI.09-11-03844.1989. [DOI] [PMC free article] [PubMed] [Google Scholar]
- 11.Shupliakov O, et al. Synaptic vesicle endocytosis impaired by disruption of dynamin-SH3 domain interactions. Science. 1997;276:259–263. doi: 10.1126/science.276.5310.259. [DOI] [PubMed] [Google Scholar]
- 12.Jockusch WJ, Praefcke GJ, McMahon HT, Lagnado L. Clathrin-dependent and clathrin-independent retrieval of synaptic vesicles in retinal bipolar cells. Neuron. 2005;46:869–878. doi: 10.1016/j.neuron.2005.05.004. [DOI] [PubMed] [Google Scholar]
- 13.Yamashita T, Hige T, Takahashi T. Vesicle endocytosis requires dynamin-dependent GTP hydrolysis at a fast CNS synapse. Science. 2005;307:124–127. doi: 10.1126/science.1103631. [DOI] [PubMed] [Google Scholar]
- 14.Newton AJ, Kirchhausen T, Murthy VN. Inhibition of dynamin completely blocks compensatory synaptic vesicle endocytosis. Proc Natl Acad Sci USA. 2006;103:17955–17960. doi: 10.1073/pnas.0606212103. [DOI] [PMC free article] [PubMed] [Google Scholar]
- 15.Xu J, et al. GTP-independent rapid and slow endocytosis at a central synapse. Nat Neurosci. 2008;11:45–53. doi: 10.1038/nn2021. [DOI] [PubMed] [Google Scholar]
- 16.Ferguson SM, et al. A selective activity-dependent requirement for dynamin 1 in synaptic vesicle endocytosis. Science. 2007;316:570–574. doi: 10.1126/science.1140621. [DOI] [PubMed] [Google Scholar]
- 17.Hayashi M, et al. Cell- and stimulus-dependent heterogeneity of synaptic vesicle endocytic recycling mechanisms revealed by studies of dynamin 1-null neurons. Proc Natl Acad Sci USA. 2008;105:2175–2180. doi: 10.1073/pnas.0712171105. [DOI] [PMC free article] [PubMed] [Google Scholar]
- 18.Gillis KD. Admittance-based measurement of membrane capacitance using the EPC-9 patch-clamp amplifier. Pflugers Arch. 2000;439:655–664. doi: 10.1007/s004249900173. [DOI] [PubMed] [Google Scholar]
- 19.Korogod N, Lou X, Schneggenburger R. Posttetanic potentiation critically depends on an enhanced Ca(2+) sensitivity of vesicle fusion mediated by presynaptic PKC. Proc Natl Acad Sci USA. 2007;104:15923–15928. doi: 10.1073/pnas.0704603104. [DOI] [PMC free article] [PubMed] [Google Scholar]
- 20.Lou X, Korogod N, Brose N, Schneggenburger R. Phorbol esters modulate spontaneous and Ca2+-evoked transmitter release via acting on both Munc13 and protein kinase C. J Neurosci. 2008;28:8257–8267. doi: 10.1523/JNEUROSCI.0550-08.2008. [DOI] [PMC free article] [PubMed] [Google Scholar]
- 21.Lou X, Scheuss V, Schneggenburger R. Allosteric modulation of the presynaptic Ca2+ sensor for vesicle fusion. Nature. 2005;435:497–501. doi: 10.1038/nature03568. [DOI] [PubMed] [Google Scholar]
- 22.Wu W, Xu J, Wu XS, Wu LG. Activity-dependent acceleration of endocytosis at a central synapse. J Neurosci. 2005;25:11676–11683. doi: 10.1523/JNEUROSCI.2972-05.2005. [DOI] [PMC free article] [PubMed] [Google Scholar]
- 23.Fernandez-Alfonso T, Ryan TA. The kinetics of synaptic vesicle pool depletion at CNS synaptic terminals. Neuron. 2004;41:943–953. doi: 10.1016/s0896-6273(04)00113-8. [DOI] [PubMed] [Google Scholar]
- 24.Balaji J, Armbruster M, Ryan TA. Calcium control of endocytic capacity at a CNS synapse. J Neurosci. 2008;28:6742–6749. doi: 10.1523/JNEUROSCI.1082-08.2008. [DOI] [PMC free article] [PubMed] [Google Scholar]
- 25.Hull C, von Gersdorff H. Fast endocytosis is inhibited by GABA-mediated chloride influx at a presynaptic terminal. Neuron. 2004;44:469–482. doi: 10.1016/j.neuron.2004.10.010. [DOI] [PMC free article] [PubMed] [Google Scholar]
- 26.Thomas P, Lee AK, Wong JG, Almers W. A triggered mechanism retrieves membrane in seconds after Ca(2+)-stimulated exocytosis in single pituitary cells. J Cell Biol. 1994;124:667–675. doi: 10.1083/jcb.124.5.667. [DOI] [PMC free article] [PubMed] [Google Scholar]
- 27.Renden R, von Gersdorff H. Synaptic vesicle endocytosis at a CNS nerve terminal: Faster kinetics at physiological temperatures and increased endocytotic capacity during maturation. J Neurophysiol. 2007;98:3349–3359. doi: 10.1152/jn.00898.2007. [DOI] [PubMed] [Google Scholar]
- 28.Clayton EL, Evans GJ, Cousin MA. Bulk synaptic vesicle endocytosis is rapidly triggered during strong stimulation. J Neurosci. 2008;28:6627–6632. doi: 10.1523/JNEUROSCI.1445-08.2008. [DOI] [PMC free article] [PubMed] [Google Scholar]
- 29.Wu W, Wu LG. Rapid bulk endocytosis and its kinetics of fission pore closure at a central synapse. Proc Natl Acad Sci USA. 2007;104:10234–10239. doi: 10.1073/pnas.0611512104. [DOI] [PMC free article] [PubMed] [Google Scholar]
- 30.de Lange RP, de Roos AD, Borst JG. Two modes of vesicle recycling in the rat calyx of Held. J Neurosci. 2003;23:10164–10173. doi: 10.1523/JNEUROSCI.23-31-10164.2003. [DOI] [PMC free article] [PubMed] [Google Scholar]
- 31.Heuser JE, Reese TS. Evidence for recycling of synaptic vesicle membrane during transmitter release at the frog neuromuscular junction. J Cell Biol. 1973;57:315–344. doi: 10.1083/jcb.57.2.315. [DOI] [PMC free article] [PubMed] [Google Scholar]
- 32.Rosenboom H, Lindau M. Exo-endocytosis and closing of the fission pore during endocytosis in single pituitary nerve terminals internally perfused with high calcium concentrations. Proc Natl Acad Sci USA. 1994;91:5267–5271. doi: 10.1073/pnas.91.12.5267. [DOI] [PMC free article] [PubMed] [Google Scholar]
- 33.Cnops L, et al. Age- and experience-dependent expression of dynamin I and synaptotagmin I in cat visual system. J Comp Neurol. 2007;504:254–264. doi: 10.1002/cne.21415. [DOI] [PubMed] [Google Scholar]
- 34.Jaffe AB, Hall A. Rho GTPases: Biochemistry and biology. Annu Rev Cell Dev Biol. 2005;21:247–269. doi: 10.1146/annurev.cellbio.21.020604.150721. [DOI] [PubMed] [Google Scholar]
- 35.Wolfel M, Lou X, Schneggenburger R. A mechanism intrinsic to the vesicle fusion machinery determines fast and slow transmitter release at a large CNS synapse. J Neurosci. 2007;27:3198–3210. doi: 10.1523/JNEUROSCI.4471-06.2007. [DOI] [PMC free article] [PubMed] [Google Scholar]
Associated Data
This section collects any data citations, data availability statements, or supplementary materials included in this article.
Supplementary Materials
Supporting Information
