Laminar Specificity of Functional Input to Distinct Types of Inhibitory Cortical Neurons (original) (raw)
Abstract
Despite the presence of numerous inhibitory cell types, laminar excitatory input has only been characterized for limited identified types, and it is unknown whether there are differences between cell types in their laminar sources of inhibitory input. In the present study, we characterized sources of local input to nine distinct types of layer 2/3 inhibitory neurons in living slices of mouse somatosensory cortex. Whole-cell recordings from identified cell types, facilitated by use of transgenic mice expressing green fluorescent protein in limited inhibitory neuron populations, were combined with laser scanning photostimulation. We found that each inhibitory cell type received distinct excitatory and inhibitory laminar input patterns. Excitatory inputs could be grouped into three categories. All inhibitory cell types received strong excitation from layer 2/3, and for calretinin (CR)-positive Martinotti cells and burst-spiking interneurons, this was their dominant source of excitatory input. Three other cell types, including fast-spiking basket cells, CR-negative Martinotti cells, and bipolar interneurons, also received strong excitatory input from layer 4. The remaining four inhibitory cell types, including chandelier cells, neurogliaform cells, irregular spiking basket cells, and regular spiking presumptive basket cells, received strong excitatory input from layer 5A and not layer 4. Laminar sources of inhibitory input varied between cell types and could not be predicted from the sources of excitatory input. Thus, there are cell-type specific differences in laminar sources of both excitation and inhibition, and complementary input patterns from layer 4 versus layer 5A suggest cell type differences in their relationships to lemniscal versus paralemniscal pathways.
Keywords: photostimulation, barrel cortex, transgenic, GFP, interneurons, somatosensory cortex
Introduction
Cerebral cortex contains many distinct types of inhibitory neurons, and understanding their connectivity within the cortex is essential for understanding cortical information processing. Although previous research has revealed much about characteristics of individual types of inhibitory neurons (Kawaguchi, 1995; Somogyi et al., 1998; Markram et al., 2004), knowledge about their functional connections (particularly laminar and columnar organization), both with excitatory cells and other inhibitory cells, is relatively limited (Dantzker and Callaway, 2000; Yoshimura and Callaway, 2005; Kapfer et al., 2007; Silberberg and Markram, 2007). This knowledge is, however, critical because a neuron's function is strongly influenced by its synaptic inputs.
Functional connections to interneurons have been investigated in depth with paired or multiple intracellular recordings, but laser scanning photostimulation combined with whole-cell patch clamping has its unique advantage in extensively mapping local inputs to a single recorded neuron. By using this technique, studies of local connections to layer 2/3 pyramidal cells in rat and mouse barrel cortex and rat visual cortex reveal that they have similar input patterns; as predicted from anatomical observations, they receive strong feedforward input from layer 4 and recurrent connections from within layer 2/3, as well as weaker input from layers 5a and 5b (Dantzker and Callaway, 2000; Shepherd and Svoboda, 2005; Shepherd et al., 2005; Bureau et al., 2006). In contrast, limited studies of functional connections to layer 2/3 inhibitory neurons in rat visual cortex indicate that their connectivity cannot be predicted from light level anatomical observations (Dantzker and Callaway, 2000). Despite the fact that only two different classes of inhibitory neurons were distinguished [fast-spiking (FS) basket cells and non-FS interneurons], different cell types were shown to receive excitatory input from different sources. In the previous study, comprehensive analyses of functional input to the numerous other inhibitory cell types were hindered by technical difficulties. Specifically, the use of differential interference contrast (DIC) optics to visualize neurons in live slices allowed recordings to be biased toward inhibitory neurons, but it was difficult to target particular types of inhibitory neurons, particularly those that are rare.
In the present study, we were able to carefully study many types of inhibitory neurons, as their recordings were facilitated by visualization of green fluorescent proteins (GFPs) in limited subsets of inhibitory neurons in transgenic mice expressing GFP under the control of the glutamic acid decarboxylase (GAD) promoter. To correlate sources of input with other features unique to each cell type, we identified morphological, electrophysiological, and neurochemical features of nine inhibitory cell types, and characterized their laminar sources of excitatory and inhibitory synaptic input within local cortical circuits by combining whole-cell patch-clamp recordings with laser scanning photostimulation in living brain slices. Our data indicate that different types of inhibitory neurons in mouse S1 layer 2/3 exhibit distinct laminar patterns of both excitatory and inhibitory input, indicating that their differential input sources, together with their different intrinsic properties, contribute to their different functions within intact cortical circuits.
Materials and Methods
Slice preparation.
All animals were handled and experiments were conducted in accordance with procedures approved by the Institutional Animal Care and Use Committee at The Salk Institute for Biological Studies. The G42 transgenic mice were generated in the laboratory of Josh Huang at the Cold Spring Harbor Laboratory (Chattopadhyaya et al., 2004). We obtained the “GIN” (GFP-expressing inhibitory neurons) transgenic mice (Oliva et al., 2000) from The Jackson Laboratory. The G30 transgenic mice were originally generated in the laboratory of Gábor Szabó at the Department of Functional Neuroanatomy at the Institute of Experimental Medicine in Budapest, Hungary (López-Bendito et al., 2004).
To prepare living brain slices, animals (postnatal day 17–23) were deeply anesthetized with Nembutal (>100 mg/kg, i.p.), rapidly decapitated, and their brains removed. A vibratome was used to cut 400-μm-thick coronal brain slices from somatosensory cortex of the mice. Slices were cut in ice-cold artificial CSF (ACSF: 124 mm NaCl, 5 mm KCl, 1.25 mm KH2PO4, 1.3 mm MgSO4, 3.2 mm CaCl2, 26 mm NaHCO3, and 10 mm glucose) with a broad-spectrum excitatory amino acid antagonist kynurenic acid (1 mm) and then were stored in an interface holding chamber aerated with 95% O2–5% CO2 at 34°C for at least 30 min before they were transferred to a recording chamber containing recirculating ACSF with no kynurenic acid and with 90 μm MNI-caged glutamate (4-methoxy-7-nitroindolinyl-caged l-glutamate; Tocris Bioscience) bubbled with 95% O2–5% CO2 at room temperature.
Coronal slices were used because this cutting plane tends to preserve the complete morphology of the recorded cells and their laminar connections. In addition, this allows us to compare data with previously published studies using similarly cut slices in rat S1 cortex (Schubert et al., 2003; Shepherd et al., 2003; Shepherd and Svoboda, 2005).
Basic electrophysiology.
Whole-cell recordings were made from cells in layer 2/3 of the barrel region of primary somatosensory cortex (S1) of the mouse. Inhibitory cell types were first identified and selected based on visualization of GFP expression under a DIC/fluorescent Olympus microscope; recordings were subsequently performed under visual control aided by infrared DIC video monitoring through the microscope and a video camera (VE 1000; Mti-Dage). Cell bodies of recorded neurons were at least 50 μm below the slice cutting surface. Glass electrodes (4–8 MΩ resistance) were filled with an internal solution consisting of 130 mm K-gluconate, 6 mm KCl, 2 mm MgCl2, 0.2 mm EGTA, 10 mm HEPES, 2.5 mm Na2ATP, 0.5 mm Na2GTP, 10 mm K-phosphocreatine, and 0.5% biocytin, adjusted with KOH to pH 7.3–7.4. For some recordings in which IPSCs were measured, potassium was replaced with cesium.
Resting potentials were measured immediately after electrodes broke into the cells after formation of a gigaohm seal. Before collection of photostimulation data, hyperpolarizing and depolarizing current pulses were injected to examine each cell's basic electrophysiological properties. We focused on analyzing interspike intervals, spike frequency adaptation, as well as shapes of single spikes elicited by depolarizing current pulses near threshold strength. Spike frequency adaptation index was calculated as the ratio of the first interspike interval and the last interspike interval of a spike train. Spike shape analysis was conducted similar to Murphy and du Lac (2001). Briefly, action potential height was defined as the difference in membrane potential between threshold and the peak. Action potential width was defined as the time from spike threshold to the threshold crossing during repolarization. Afterhyperpolarization (AHP) amplitude was defined as the difference between action potential threshold and the most negative membrane potential attained during the AHP. The duration of AHP was defined as AHP time, the time from the action potential peak to the trough of the AHP.
Photostimulation.
Once stable whole-cell recordings were achieved with good access resistance (usually <20 MΩ), laser scanning photostimulation experiments were conducted. Focal uncaging of caged glutamate was through a 10 ms pulse of UV laser light that was focused on the plane of the brain slice through a 40× microscope objective. To map the locations of input to a single cell, 300–800 sites spaced at 50 μm apart from neighboring sites were stimulated, and stimulation sites were located throughout a rectangular area surrounding the recorded neuron, typically extending 200–300 μm laterally on either side of the cell and vertically from the white matter to layer 1. The order in which the points were stimulated was patterned to assure that adjacent sites were never stimulated within 8 s. This was done because glutamate receptors desensitize but recover completely within a few seconds. Photostimulation trials were interleaved with control trials (no stimulation) to obtain spontaneous postsynaptic currents. At each site, the control trial was immediately after the stimulation trial. For both photostimulation and control trials, data were acquired for a total duration of 400 ms. However, only the responses within 150 ms after stimulation onset were analyzed (see below). For each cell, high-resolution maps of the locations of neurons providing monosynaptic excitatory and/or inhibitory input were obtained. Whole-cell voltage-clamp recordings (at −65 mV) were made from the recorded postsynaptic neurons, and inward EPSCs were measured for both stimulation trials and no-stimulation control trials. Outward IPSCs were measured by changing the holding potentials of neurons to close to 0 mV.
After completion of photostimulation and recordings from a cell, the laser was used to burn alignment sites into the slice so that x–y photostimulation coordinates could be assigned to their corresponding positions in the tissue. In addition, slice images were taken in the bath chamber to register the positions of the recording electrodes and cortical layers. Lesions were detected with cytochrome oxidase staining of the brain slices (Dantzker and Callaway, 2000), and laminar borders were determined using the combined information from live slice images, 4′,6′-diamidino-2-phenylindole dihydrochloride staining and CO staining of slices. Identification of the barrel- or septum-related columns were also confirmed in the CO-stained slices.
Photostimulation map analysis.
For excitatory responses, laser-induced photolysis of caged glutamate can induce two major forms of activity: (1) a direct response (inward currents) to activation of the recorded neuron's glutamate receptors; and (2) synaptically mediated responses (EPSCs) resulting from the suprathreshold activation of presynaptic excitatory neurons. Responses within the 10 ms window from laser onset were assigned as direct, as they had a distinct shape (longer rise-time) and occurred immediately after glutamate uncaging (shorter latency) (see supplemental Fig. S3, available at www.jneurosci.org as supplemental material). Synaptic currents with such short latencies are not possible because they occur before the generation of action potentials in photostimulated neurons (Dantzker and Callaway, 2000; Yoshimura et al., 2005). Photostimulation around the recorded cell sometimes induced direct currents that exceeded 200 pA and decayed >100 ms, preventing synaptic input from being separately identified at these locations, and, thus, these sites were excluded from analysis. The average percentages of eliminated sites were calculated for each cell type and considered when comparing input patterns across cell types. There were no systematic differences in these values for most cell types. In addition, at some locations, synaptic responses could be resolved from the relatively small direct responses. In these cases, the synaptic contribution was subtracted from the direct response to isolate the synaptic input used for further analysis (supplemental Fig. S3, available at www.jneurosci.org as supplemental material).
For inhibitory responses, uncaging of caged glutamate can induce three types of activity: (1) a direct inward current response to strong activation of the recorded cell's glutamate receptors; (2) short latency “direct” outward current presumed to result from direct activation of glutamate receptors on the presynaptic terminals of inhibitory neurons; and (3) synaptically mediated responses (IPSCs) resulting from the suprathreshold somatic activation of presynaptic inhibitory neurons, which can be identified based on their latencies and shapes (e.g., see site 3) (supplemental Fig. S3, available at www.jneurosci.org as supplemental material). We only include actual presynaptic inhibitory input (resulting from somatic firing of inhibitory neurons at stimulated locations) to construct inhibitory input maps.
As virtually all layer 1 neurons are inhibitory cells, and pyramidal neurons with apical dendritic tufts in layer 1 could fire action potentials when their tufts were stimulated in layer 1 (Dantzker and Callaway, 2000), EPSCs detected after photostimulation in layer 1 were not included for analyses. However, because layer 1 neurons can provide inhibition to layer 2/3 neurons, we did analyze IPSCs detected after photostimulation in layer 1.
To construct maps of synaptic input, the average current amplitudes (EPSCs or IPSCs) in a response window of the first 150 ms after the laser stimulation were measured for both photostimulation and control trials at each stimulation site using custom programs written in Matlab (Mathworks) software. The control response was subtracted from the stimulation response of the same site. These values are expressed as picoamperes for the specified window of analysis (i.e., the first 150 ms after the laser stimulation). The window was chosen because photostimulated neurons fire most of their action potentials during this time (Dantzker and Callaway, 2000; Yoshimura et al., 2005). EPSC or IPSC measurements for each stimulation site were assigned to their cortical layer, and their amplitudes for all stimulation sites within a layer were summed together to calculate average laminar evoked input (EI). The estimated EI from each layer was calculated by subtracting the mean amplitude for control trials from the mean amplitude for photostimulation trials in that layer. For the purpose of visual display, we created color-coded, linearly interpolated maps to illustrate overall input patterns to selected cells. To quantitatively compare laminar input strength across cell types, we also calculated the relative strength of the excitatory or inhibitory input (percentage-evoked input; %EI) to each cell from each layer by expressing the average value from each layer as a percentage of the summed values from all the layers examined (see Figs. 7, 8). We also calculated statistical significance of measured responses from stimulation sites in each layer by comparing the measured mean current amplitudes at photostimulation trials with those of control trials (background spontaneous activity) (supplemental Table S1, available at www.jneurosci.org as supplemental material). In addition, an unsupervised cluster analysis was performed on the %EI data matrix to distinguish any clusters of laminar input patterns (see the cluster dendrogram in supplemental Fig. S4, available at www.jneurosci.org as supplemental material). The cluster analysis was performed using a Euclidian distance calculation of within-cluster distances and Ward's linkage method (using a Matlab program) (Briggs and Callaway, 2005).
Figure 7.
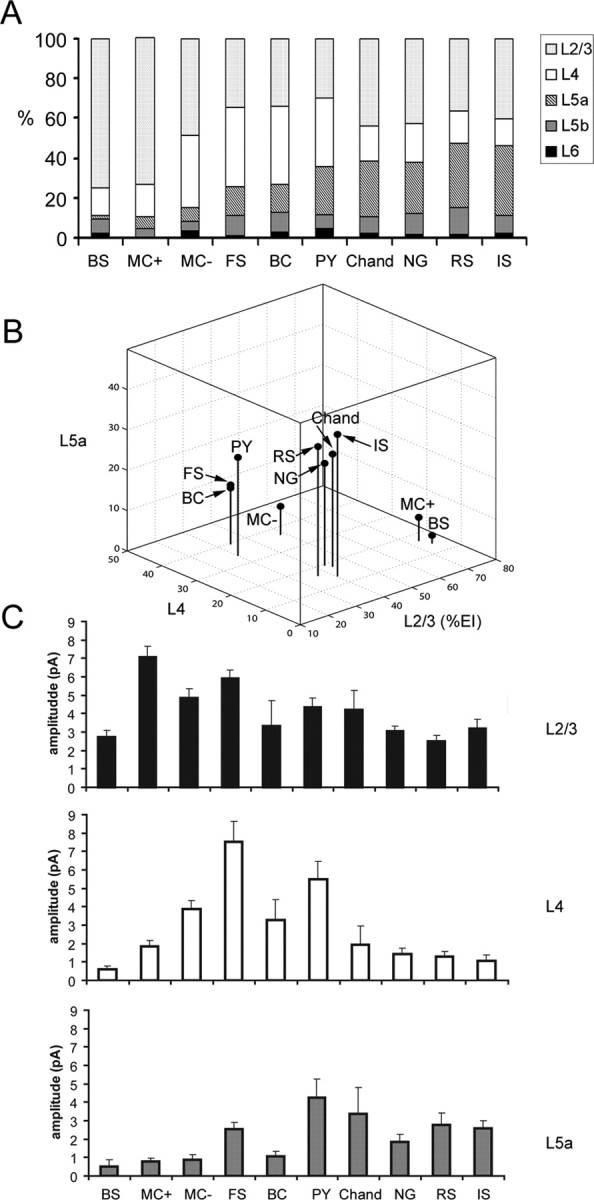
Summary of excitatory input patterns across all the cell types examined. A, A series of cumulative histograms with average percentages of excitatory input (%EI) from all the layers examined (layers 2/3, 4, 5a, 5b, and 6) for all the cell types examined: BS cells, SOM+/CR+ Martinotti cells (MC+), SOM+/CR− Martinotti cells (MC−), FS basket cells, BC, pyramidal cells (PY), chandelier cells (Chand), neurogliaform cells (NG), RS cells, and IS cells. B, A three-dimensional plot that shows average excitatory %EIs of layers 2/3, 4, and 5a for the cell types examined. C, Average excitatory EI amplitudes from layers 2/3, 4, and 5a for the cell types examined. Bars represent mean ± SE.
Figure 8.
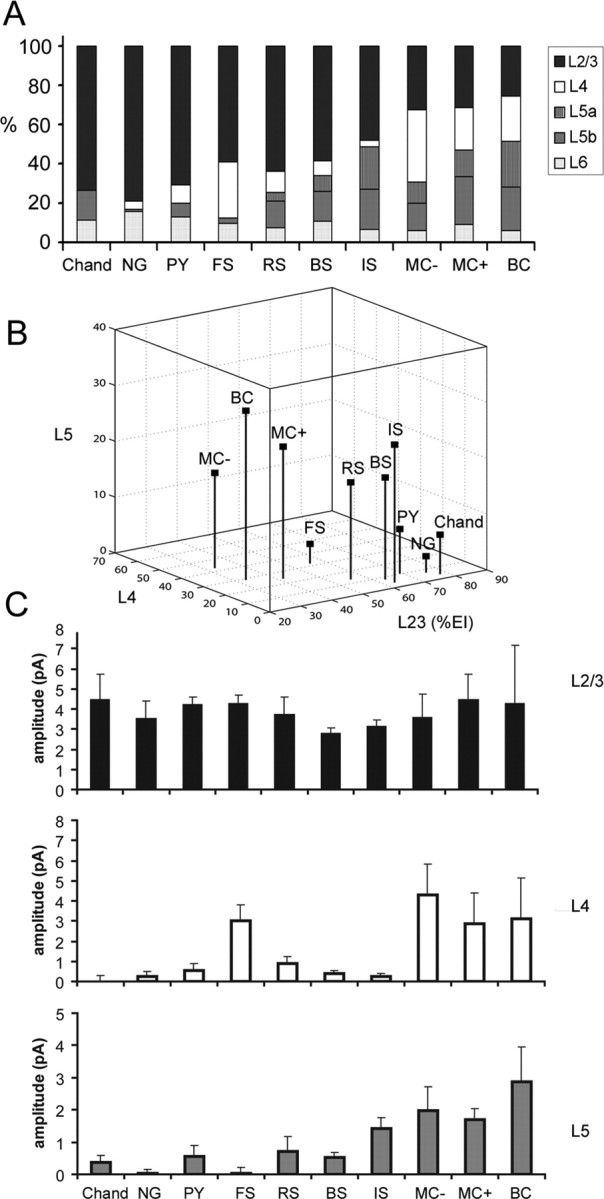
Summary of inhibitory input patterns across all the cell types examined. A, Cumulative histograms of percentages of inhibitory input (%EI) from layers 2/3, 4, 5a, 5b, and 6 for all the cell types examined: chandelier cells (Chand), neurogliaform cells (NG), pyramidal cells (PY), FS basket cells, RS cells, BS cells, IS cells, SOM+/CR− Martinotti cells (MC−), SOM+/CR+ Martinotti cells (MC+), and BC. B, A three-dimensional plot that shows average inhibitory %EIs of layers 2/3, 4, and 5 for the cell types examined. In B (unlike in A), the %EIs of layers 5a and 5b were pooled into the %EIs of layer 5. Also note that the recalculated %EIs for layers 2/3 and 4 in B are slightly different than for A, but the overall patterns are similar. C, Average inhibitory EI amplitudes from layers 2/3, 4, and 5a for the cell types examined. Bars represent mean ± SE.
Statistical comparisons of the cells' input strength (including absolute and relative laminar input values) between two groups were performed with the Mann–Whitney U test, except that paired t tests were used to compare average current amplitudes of control and photostimulation conditions at each layer for the sampled cells as shown in supplemental Table S1, available at www.jneurosci.org as supplemental material. For comparisons across >2 groups, we used the Kruskal–Wallis test (nonparametric one-way ANOVA) and the Mann–Whitney U test for group comparisons. Alpha levels of p ≤ 0.05 were considered significant. All means are presented with SEs unless specified otherwise.
Morphological and neurochemical examination, and cell-type identification.
After all physiological assays were completed, brain slices were fixed in 4% paraformaldehyde overnight, then transferred to 30% sucrose solution in PBS. The slices were frozen over dry ice and thawed once, and then the recorded cells were revealed by staining of biocytin with 1:1000 Cy3-conjugated streptavidin (Jackson ImmunoResearch Laboratories). Cell morphology was examined with confocal microscopy, which also confirmed that each recorded cell was indeed the GFP-expressing interneuron originally targeted. Selected neurons were reconstructed using a computerized Neurolucida reconstruction system to examine confocal projection images.
The 400-μm-thick slices were often resectioned to 80 μm thickness, and the recorded cells in resectioned slices were further immunostained with selected antibodies such as parvalbumin antibody [Swant; rabbit α-parvalbumin (PV-28), 1:1000], calretinin (CR) antibody [Swant; rabbit α-calretinin (796), 1:500], or vasoactive intestinal peptide (VIP) antibody [ImmunoStar; rabbit α-VIP (20077), 1:1000]. Neurochemical features were assessed from staining with selected antibodies. Finally, analyses of all these features as well as intrinsic electrophysiological characteristics were combined to arrive at the final cell type classification.
Results
Identification and characterization of cell types
In this study, we examined excitatory and inhibitory input to nine different inhibitory cell types in layer 2/3 of the barrel region of mouse S1. Before describing investigations of the sources of input to each cell type, we describe results demonstrating the methods used to reliably sample from and characterize each inhibitory cell type. Although the methods that we have used clearly distinguish different cell types, for some of these it is not possible to clearly relate the cell types studied to those identified in previous studies (Kawaguchi, 1995; Markram et al., 2004). These relationships are further considered and relevant publications cited in the context of each of the cell types described below. A recent review of cortical inhibitory neuron classification and nomenclature is also instructive (Ascoli et al., 2008).
All of the inhibitory neurons described in this study were sampled from three transgenic mouse lines in which enhanced GFP was expressed in limited subsets of inhibitory neurons (Table 1). Thus, our studies are limited to those inhibitory cell types which express GFP in these mouse lines and exclude other inhibitory cell types. For each recorded cell, its type is further determined based on a combination of intrinsic physiological properties, protein expression, and morphology. Careful characterization of GFP-positive cells in each line indicated that expression is reliably limited to only particular neuron types, obviating the need to measure every property in every GFP-positive neuron. Nevertheless, the intrinsic physiology and morphology, as well as the presence of GFP expression, were characterized for every neuron in our sample.
Table 1.
GFP+ cell types in the transgenic mouse lines
| G42 | GIN | G30 |
|---|---|---|
| FS | SOM+/CR+ Martinotti | Multipolar (IS, RS, BS) |
| Chandelier | SOM+/CR− Martinotti | Bipolar |
| Neurogliaform |
We recorded from GFP-expressing inhibitory neurons in the S1 region of mouse brain slices, facilitated by using three transgenic mouse lines in which enhanced GFP was expressed in limited subsets of inhibitory neurons. These lines were G42 transgenic mice which express GFP under the control of a murine GAD67 bacterial artificial chromosome clone (Chattopadhyaya et al., 2004), GIN transgenic mice which express GFP under a 2.8 kbp fragment of the murine GAD67 promoter (Oliva et al., 2000), and G30 transgenic mice expressing GFP under a 6.5 kb fragment of the murine GAD65 promoter (López-Bendito et al., 2004). In these mouse lines, GFP+ cells are bright enough for targeted recordings in living brain slices. Generally GFP+ cells in G30 and GIN mouse sections are brighter than those in G42 mouse sections. GFP+ cells are mostly distributed in upper layers in GIN and G30, whereas G42 GFP+ cells are more concentrated in deeper layers.
GFP+ cells in G42 mice have been previously identified as parvalbumin-positive, and those which have been described physiologically are FS basket cells (Chattopadhyaya et al., 2004; Sugino et al., 2006). Layer 2/3 of G42 mouse barrel cortex has a relatively low density of GFP+ cells, compared with deeper layers. We confirmed that a great majority of GFP+ cells in layer 2/3 were FS cells; they were distinguished from other inhibitory cell types by having high firing rates with little or no spike frequency adaptation (supplemental Fig. S1_C_, available at www.jneurosci.org as supplemental material). Their spikes had short durations and typically had deep, fast AHPs. Under somatic current injections of moderate strength (∼300 pA) in our experimental conditions, their mean spiking adaptation index was 0.87 ± 0.05 (mean ± SE, N = 9). The mean spike AHP time of FS cells was 1.57 ± 0.15 ms, and their average AHP amplitude was 21.0 ± 1.3 mV. The FS cells were immunopositive for parvalbumin, and they had large somata, long dendrites, and lengthy axons running horizontally or vertically (supplemental Fig. S1_A_, available at www.jneurosci.org as supplemental material). Overall, they had the appearance of large basket cells.
In addition, we found that a small minority of the recorded GFP+ cells were chandelier cells, as they had the hallmark feature of axons that bring about many candlestick-like axonal terminals (“axon cartridges”) (supplemental Fig. S1_D_, available at www.jneurosci.org as supplemental material). These cells appeared to have weaker GFP expression than FS cells (supplemental Fig. S1_B_,E, available at www.jneurosci.org as supplemental material). The chandelier cells had dendrites extending upward into layer 1 and had their axonal branches localized in layer 2/3. This morphology is similar to other chandelier cells reported in mouse and rat cortex (Kawaguchi, 1995; Borrell et al., 2005). Under our recording conditions, these chandelier cells were not typical fast spiking, as they exhibited spiking frequency adaptation in response to current injections and their spikes did not have deep and fast AHPs (supplemental Fig. S1_F_, available at www.jneurosci.org as supplemental material). Their mean spiking adaptation index was 0.63 ± 0.07 (N = 4). For two of the chandelier cells analyzed for spike shape parameters, their spike AHPs were different from those of FS cells (see above), as their mean AHP time of spikes was 9.0 ms, and their average AHP amplitude was 15.6 mV.
Although G42 mice could be used to reliably facilitate recordings from PV-positive fast-spiking and chandelier cells, it is important to note that not all PV-positive cells in this mouse line express GFP. It is therefore likely that the fast-spiking neurons represented in this sample may not include the complete range of PV-expressing fast-spiking cell types that have been observed in the cortex (cf. Markram et al., 2004; Uematsu et al., 2008).
GFP expression in GIN mice has been extensively characterized and described in previous publications (Oliva et al., 2000; Halabisky et al., 2006; Xu et al., 2006). Layer 2/3 GFP+ cells in GIN mouse S1 are a subpopulation of somatostatin (SOM) immunopositive interneurons. These cells can be further divided into distinct subtypes based on immunochemical identification of CR [SOM+/CR− and SOM+/CR+ Martinotti cells (MCs)] (see supplemental Fig. S1_G–L_, available at www.jneurosci.org as supplemental material) (see also Xu et al., 2006). Both subtypes had the appearance of Martinotti cells, as they had ascending axons to layer 1, where they ramified into a terminal arborization (supplemental Fig. S1_G_,J, available at www.jneurosci.org as supplemental material). There are, however, noticeable differences between SOM+/CR− and SOM+/CR+ Martinotti cells, as SOM+/CR+ cells have relatively smaller and round somata, more primary processes from the soma, and more horizontally extended dendritic fields (supplemental Fig. S1_G_,J, available at www.jneurosci.org as supplemental material) (see also Xu et al., 2006). Both cell types had similar accommodating spike-firing patterns (supplemental Fig. S1_I_,L, available at www.jneurosci.org as supplemental material). Closer examination of their spike parameters indicated that they differed significantly in quantitative aspects of spike shapes, as SOM+/CR− cells had narrower action potential widths and faster AHP than did SOM+/CR+ cells (for more detailed descriptions of these differences, see Xu et al., 2006).
We distinguished five subtypes of inhibitory neurons in G30 mice. All GFP+ cells in G30 transgenic mice were non-fast-spiking cells, and none were SOM-positive Martinotti cells. Thus, there is no overlap between the cell types sampled in G30 versus G42 or GIN mice. Our immunochemical characterization revealed that most GFP+ cells in these mice were VIP/CR-expressing inhibitory neurons, as ∼40% of GFP cells in layer 2/3 were immunopositive for VIP, and another 20% of these cells were immunopositive for CR (unpublished data). The majority had a multipolar dendritic morphology and tended to be located in upper layer 2/3 (supplemental Fig. S2_A–I_, available at www.jneurosci.org as supplemental material). (These are distinct from those with a bipolar dendritic morphology, see below.) We divided multipolar cells into three subtypes based on their intrinsic firing patterns. A subset of GFP+ cells in this mouse line have been previously characterized as irregular-spiking cells which are positive for cholecystokinin and express type 1 cannabinoid receptors (Galarreta et al., 2004; Sugino et al., 2006). We also recorded from this subpopulation which fired with an irregular spiking (IS) pattern in response to current injections. For example, IS cells showed considerable variability in interspike intervals both within and between trials (supplemental Fig. S2_B_,C, available at www.jneurosci.org as supplemental material), even in response to identical current injections (supplemental Fig. S2_B_, available at www.jneurosci.org as supplemental material). At moderate current injection strength (∼300 pA), their average interspike interval of single response traces of five or more spikes was 46.0 ± 3.5 ms (N = 13). The average value of their coefficients of variation (defined as the ratio of the SD to the mean) was 0.87 ± 0.07 (see also Galarreta et al., 2004). At high amplitudes of current injections, these cells tended to have initial bursting (supplemental Fig. S2_C_, available at www.jneurosci.org as supplemental material).
The other multipolar GFP+ cells include regular spiking (RS) cells and burst-spiking (BS) cells. The multipolar RS cells had regular spiking patterns after depolarizing suprathreshold current injections both from their resting membrane potentials (supplemental Fig. S2_E_, available at www.jneurosci.org as supplemental material) and from hyperpolarized membrane potentials (supplemental Fig. S2_F_, available at www.jneurosci.org as supplemental material). The BS cells had regular spiking patterns from their resting membrane potentials (supplemental Fig. S2_H_, available at www.jneurosci.org as supplemental material) but showed bursting patterns from hyperpolarized membrane potentials (supplemental Fig. S2_I_, available at www.jneurosci.org as supplemental material). The interspike intervals of the bursting spikes of the BS cells were 7.9 ± 0.46 ms (N = 8), which were significantly shorter than the interspike intervals of the first three spikes of the RS cells (28.8 ± 4.0 ms; N = 7) (p < 0.001; Mann–Whitney U test).
All three of these types of multipolar, non-FS cells appeared to belong to the larger category of basket cells, as they had putative axonal boutons surrounding the somata of other cells (Galarreta et al., 2004). Multipolar IS and BS cells often had their dendrites and axons extended horizontally in layers 2/3 and 1, whereas multipolar RS cells tended to have a more extensive spread of dendrites and axons in layers 2/3 and 4 (supplemental Fig. S2_A_,D,G, available at www.jneurosci.org as supplemental material). Although the IS cells we sampled correspond to the same cell type sampled by Galarreta et al. (2004), the relationships between our RS or BS cells and previously described cell types are not known.
In addition, a minority of GFP+ cells in G30 mice were identified as bipolar cells (BCs) or neurogliafrom cells based on their characteristic morphological features and intrinsic physiology. Bipolar cells were small cells with fusiform or ovoid somata, and they had slender and vertical bitufted dendrites with axons that yield a thin plexus of axonal collaterals (supplemental Fig. S2_J_, available at www.jneurosci.org as supplemental material). They showed accommodating spiking patterns in response to current injections (supplemental Fig. S2_L_, available at www.jneurosci.org as supplemental material). Neurogliaform cells had a spiderweb-like appearance with a small round soma, short dendrites, and densely arborizing axons. They exhibited characteristics of late spiking as they had slow depolarization ramps before firing spikes in response to threshold current injections (supplemental Fig. S2_O_, available at www.jneurosci.org as supplemental material) (Kawaguchi, 1995; Kawaguchi and Kondo, 2002). They displayed weak or no accommodation when firing multiple spikes (supplemental Fig. S2_O_, available at www.jneurosci.org as supplemental material).
Finally, we also recorded pyramidal cells in brain slices from these lines of mice. The pyramidal cells were confirmed by their regular spiking patterns and morphological features such as triangular somata and spiny dendrites. We examined excitatory and inhibitory input to pyramidal cells in layer 2/3 for comparison.
In summary, inhibitory cell types studied include the following: two cell types (FS basket cells and chandelier cells) expressing GFP in G42 mice (Chattopadhyaya et al., 2004), two subtypes of MCs which express GFP in GIN mice (Oliva et al., 2000; Xu et al., 2006) and five subtypes of non-fast-spiking cells expressing GFP in G30 mice (López-Bendito et al., 2004) (multipolar cells with IS, BS, or RS intrinsic physiology, bipolar cells, and neurogliaform cells) (Table 1).
Characterization of local input patterns
We found that, although input patterns were similar for all pyramidal cells, inhibitory cells had diverse input patterns which were conserved for cells of the same type. Although some inhibitory cell types had laminar input patterns similar to those described previously for rat visual cortex (Dantzker and Callaway, 2000; Yoshimura and Callaway, 2005), others had novel input patterns. Below we begin by illustrating examples of the typical laminar patterns of local excitatory and inhibitory input observed for each cell type. Then we compare and summarize excitatory and inhibitory laminar input sources across these cell types.
We used laser scanning photostimulation to map local excitatory and inhibitory input sources for all 10 cell types described above. This functional assay allowed high resolution mapping of laminar distributions of presynaptic input sources to single neurons (Dantzker and Callaway, 2000; Yoshimura and Callaway, 2005; Yoshimura et al., 2005). Photostimulation data were collected from 18 FS basket cells, 15 excitatory pyramidal cells, 30 SOM+/CR+ Martinotti cells, 22 SOM+/CR− Martinotti cells, 15 multipolar IS cells, nine multipolar RS cells, 12 multipolar BS cells, four chandelier cells, five bipolar cells, and four neurogliaform cells, all of which had somata in layer 2/3 of mouse S1 cortex. For most of these cells, both excitatory and inhibitory input maps were sampled. However, for many cells, only one map (excitatory or inhibitory) was sampled. For a complete description of the numbers of cells in each sample, see supplemental Table S1, available at www.jneurosci.org as supplemental material.
We do not separately describe data for cells located above barrels versus septa. First, such differences were not expected; in mouse S1, there are no significant differences in laminar patterns of excitatory input from either layer 4 or from layer 5a to layer 2/3 pyramidal neurons above barrels versus septa (Bureau et al., 2006). Previous studies of S1 cortex have, however, revealed differences between species in the columnar organization of excitatory connections related to the lemniscal versus paralemniscal pathways. For example, in rat S1 cortex, layer 2 pyramidal neurons located above septa receive strong excitatory connections from layer 5a rather than layer 4, whereas neurons above barrels receive strong input from layer 4 (Shepherd and Svoboda, 2005). Furthermore, the great majority of our cells were located above barrels, precluding systematic comparison. Finally, although we have identified systematic differences in excitatory and inhibitory inputs from layer 4 versus layer 5a to different inhibitory cell types (see below), comparisons of cells above barrels to our limited samples above septa revealed no differences in input sources. The descriptions below can therefore be considered as representative of inputs to cells above barrels, but we cannot rule out the possibility that further studies could reveal a different pattern of input to some types of septal cells.
Excitatory pyramidal cells and FS basket cells
We start by describing local input to layer 2/3 pyramidal cells and FS basket cells in mouse S1 cortex, because input patterns of these two cell types have been described unambiguously in a previous study of rat visual cortex (Dantzker and Callaway, 2000), and input to pyramidal cells has been described in rat and mouse barrel cortex (Shepherd and Svoboda, 2005; Shepherd et al., 2005; Bureau et al., 2006). Studies of local synaptic input to pyramidal cells and FS cells of layer 2/3 in previous studies revealed that these two cell types have similar laminar input patterns; both receive strong excitatory input from cortical layers 4, and 2/3 and weaker input from deeper layers, and they receive most of their inhibitory input from layer 2/3. In the present study, we found comparable input patterns for pyramidal cells and FS cells in layer 2/3 of mouse S1 cortex.
The pyramidal cells received strong excitatory input from layers 2/3, 4 and 5a, and received much weaker input from layers 5b and 6. Figure 1, A–D, illustrates results from layer 2/3 pyramidal neurons. A typical excitatory input map is shown in Figure 1A. The cell body is located in layer 2/3, and a reconstruction of major dendrites is shown in black over the color-coded excitatory input map. To map excitatory input in this and other cell types, whole-cell voltage-clamp recordings (at −65 mV) were made from the neuron to measure synaptic currents while photostimulating candidate presynaptic neurons with laser scanning uncaging of caged glutamate across hundreds of sites. Examples of inward EPSC responses (sites i and ii) of the pyramidal cell are shown in Figure 1A. The input map was constructed based on evoked input measured from the recorded pyramidal cell with photostimulation at various locations across cortical layers (for details, see Materials and Methods and supplemental Fig. S3, available at www.jneurosci.org as supplemental material). In the color-coded excitatory map, the scale codes evoked excitatory input in units of picoamperes, averaged over a response window of 150 ms after photostimulation. The red range indicates strong excitatory input; the blue range indicates no or weak excitatory input. Overall, for the 10 excitatory pyramidal cells, the excitatory EI (measured currents minus spontaneous currents, see Materials and Methods) averaged across stimulation sites in layers 2/3, 4, and 5a were 4.34 ± 0.50 pA (mean ± SE), 5.48 ± 0.96 pA, and 4.26 ± 0.99 pA, respectively, whereas those of layers 5b and 6 were 1.19 ± 0.48 pA, and 0.60 ± 0.11 pA, respectively (supplemental Table S1, available at www.jneurosci.org as supplemental material; see also Fig. 7C). We also normalized laminar input strength as %EI by expressing the average evoked input from each layer as a percentage of the summed input from all the layers examined. As illustrated in Figure 1C, the average excitatory %EIs for layers 2/3, 4, 5a, 5b, and 6 for the pyramidal cells were 30.0 ± 2.9% (mean ± SE), 34.1 ± 2.4%, 24.4 ± 0.04%, 7.0 ± 2.1%, and 4.5 ± 0.8%, respectively.
Figure 1.
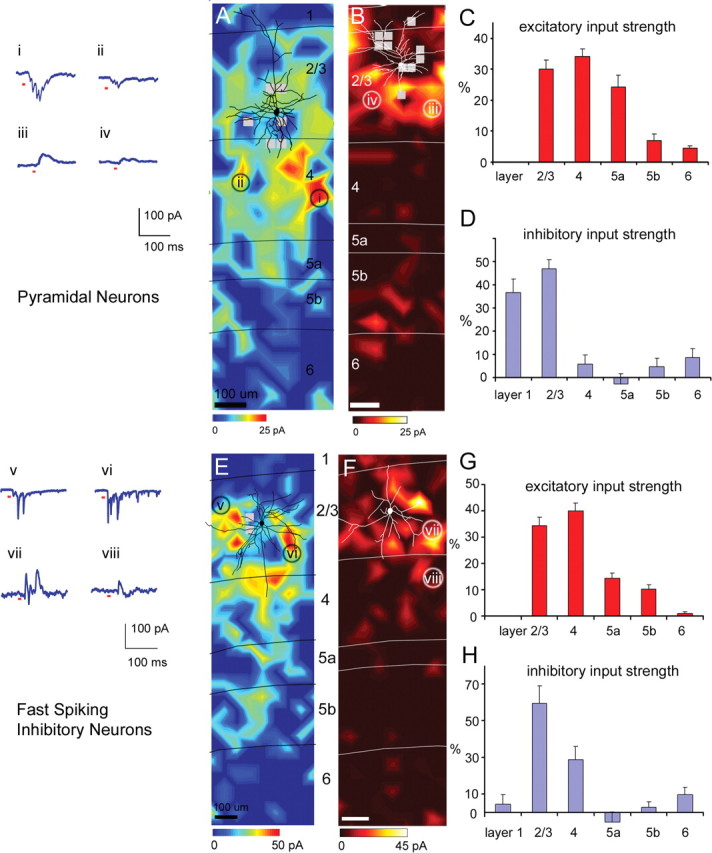
Laminar patterns of excitatory and inhibitory input to pyramidal cells and fast-spiking cells. A, An example map of excitatory input to one pyramidal neuron. A reconstruction of the neuron's cell body and major dendrites is shown in black over the color-coded excitatory input map. The color scale codes evoked input in units of picoamperes, calculated by subtracting the mean spontaneous currents from the mean currents measured after photostimulation for each stimulation site during the 150 ms analysis window (see Materials and Methods). Values for each position are calculated from a linear interpolation of values at discrete stimulation sites. Red indicates strong excitatory input, and blue range indicates no or weak excitatory input as indicated by the color scale beneath the map. The thin black lines delineate borders between layers which are labeled to the right. B, An example map of inhibitory input to a different pyramidal cell in layer 2/3. The cell drawing is shown in white. The inhibitory input map uses a different color scale, where the yellow/white range indicates strong inhibitory input, and the dark red range indicates no or weak inhibitory input, as indicated by the color scale beneath the map. The thin white lines delineate laminar boundaries. In both A and B, small gray squares indicate stimulation sites omitted from quantitative analysis because of interference of large direct currents during photostimulation (see Materials and Methods and supplemental Fig. S3, available at www.jneurosci.org as supplemental material). Examples of excitatory (sites i and ii in A) and inhibitory (sites iii and iv; B) postsynaptic current responses of the pyramidal cells are shown in A. Only the 200 ms duration of the 400 ms recorded traces are shown, with short red marks beneath the traces indicating the 10 ms of the laser on time. C, The summary data of laminar excitatory input strength (%EI) for 10 pyramidal cells. D, The summary data of laminar inhibitory input strength (%EI) pooled from seven pyramidal cells. Bars in C and D represent mean ± SE values. Note that negative values indicate that spontaneous activity during control trials was greater than the level of activity during stimulation trials, but it was not statistically significant (see supplemental Table S1, available at www.jneurosci.org as supplemental material). E, F, Examples of excitatory and inhibitory input maps from two different fast-spiking cells, respectively (for morphological and electrophysiological features of fast-spiking cells, see supplemental Fig. S1_A–C_, available at www.jneurosci.org as supplemental material). Examples of excitatory (sites v and vi; E) and inhibitory (sites vii and viii; F) postsynaptic current responses of the fast-spiking cells are shown by E. G, H, Summary data of laminar input strength (mean ± SE; %EI) based on 12 excitatory input maps and 11 inhibitory input maps, respectively. Scale bars, 100 μm.
Pyramidal cells in layer 2/3 generally received most inhibition from layers 2/3 and 1 (Fig. 1B,D). To collect inhibitory responses from this and other cell types, whole-cell voltage-clamp recordings (at or close to 0 mV) were made from the recorded cell to map its IPSC responses from stimulated locations (see Materials and Methods and supplemental Fig. S3, available at www.jneurosci.org as supplemental material, for construction of an inhibitory input map). Examples of outward IPSC responses (sites iii and iv) of the pyramidal cell are shown to the left of Figure 1A. Inhibitory input maps are illustrated with a different color scale, where the yellow/white range indicates strong inhibitory input, and the dark red range indicates no or weak inhibitory input (Fig. 1B). The scale represents evoked inhibitory input (measured minus spontaneous) in units of picoamperes, averaged over a response window of 150 ms after photostimulation. The summary data of laminar inhibitory input strength for the pyramidal cells are shown in Figure 1D and supplemental Table S1, available at www.jneurosci.org as supplemental material. The average inhibitory EIs for the seven pyramidal cells for layers 1 and 2/3 were 3.44 ± 0.65, and 4.20 ± 0.37 pA, respectively, and their average inhibitory %EIs were 36.6 ± 5.8% and 47.0 ± 3.8%, respectively (Fig. 1D). For the pyramidal cells, inhibitory inputs from layers 1 and 2/3 were statistically significant compared with nonstimulation control conditions (background spontaneous activity). Other cortical layers (4, 5a, 5b, and 6) did not provide statistically significant inhibitory input above background activity (see supplemental Table S1, available at www.jneurosci.org as supplemental material).
FS inhibitory cells received strong excitatory input from layers 2/3, 4, and 5. As shown in Figure 1E, the example cell received strong excitatory input from layers 2/3 and 4 and moderate input from layers 5a and 5b. FS cells often had multiple strong EPSCs from stimulated presynaptic locations. Examples of inward EPSC responses (sites v and vi) of the FS cell are shown by Figure 1E. The average evoked excitatory inputs for the 12 FS cells for layers 2/3, 4, 5a, and 5b were 5.93 ± 0.43 pA, 7.53 ± 1.08 pA, 2.55 ± 0.37 pA, and 1.93 ± 0.36 pA, respectively. The corresponding values for excitatory %EIs were 34.5 ± 3.0%, 39.9 ± 3.0%, 14.4 ± 2.0%, and 10.3 ± 1.8%, respectively (Fig. 1G).
FS cells received inhibition predominantly from layers 2/3 and 4 (Fig. 1G,H). Examples of outward IPSC responses (sites vii and viii) of the example FS cell are shown to the left of Figure 1E. Averaged across the 11 FS cells, the inhibitory %EIs for layers 2/3 and 4 were 59.5 ± 9.7% and 28.8 ± 7.2%, respectively (see Fig. 6D; supplemental Table S1, available at www.jneurosci.org as supplemental material). Layer 6 provided small but significant inhibition to the FS cells, with its inhibitory %EI being 9.8 ± 4.0%. Other cortical layers did not provide significant inhibitory input compared with control conditions.
Figure 6.

Laminar patterns of excitatory and inhibitory input to bipolar cells. A, Excitatory input map from a bipolar cell, while B shows an inhibitory input map from another bipolar cell (for morphological and electrophysiological features of the bipolar cell illustrated in A, see supplemental Fig. S2_J–L_, available at www.jneurosci.org as supplemental material). C, Average laminar strength for excitatory input from the bipolar cells, and D shows their average inhibitory input strength. Conventions are as in previous figures.
Generally, FS cells and pyramidal cells in mouse barrel cortex received strong excitatory and inhibitory input from cortical layers 4 and 2/3 and weaker input from deeper layers, but the pyramidal cells received a larger proportion of their excitatory input from layer 5a than did the FS cells (excitatory %EI, 24.4 ± 0.04% vs 14.4 ± 2.0%; p < 0.02; Mann–Whitney U test). Although both FS cells and pyramidal cells received their strongest inhibition from layer 2/3, the pyramidal cells examined received significant and strong input from layer 1 (inhibitory %EI, 36.6 ± 5.8%), whereas the FS cells did not receive significant inhibition from layer 1 (inhibitory %EI, 4.5 ± 5.1%), but received relatively strong inhibition from layer 4 (inhibitory %EI, 28.8 ± 7.2%).
SOM+/CR+ and SOM+/CR− Martinotti cells
We previously described two subtypes of MCs expressing GFP in the cortex of GIN mice. Both are immunopositive for SOM, but one subtype is also immunopositive for CR (SOM+/CR+), and the other one is not (SOM+/CR−) (Xu et al., 2006). We mapped excitatory input to 18 SOM+/CR− MCs and 25 SOM+/CR+ MCs, all of which were expressing GFP in GIN mice and found that these two subtypes received significantly different excitatory input patterns. As illustrated in Figure 2, A, B, and E, SOM+/CR− MCs received strong excitatory input from both layers 2/3 and 4, whereas SOM+/CR+ MCs received significantly more excitatory input from layer 2/3 and significantly less from layer 4. On average, both types received much weaker input from deeper layers (i.e., layers 5a, 5b, and 6) than superficial layers (Fig. 2E; supplemental Table S1, available at www.jneurosci.org as supplemental material). For SOM+/CR− MCs, their average excitatory %EIs for layers 2/3 and 4 were 48.3 ± 4.2% and 36.6 ± 3.1%, respectively. In comparison, for SOM+/CR+ MCs, their average excitatory %EIs for layers 2/3 and 4 were 73.2 ± 2.8% and 16.8 ± 1.9%, respectively. These two subtypes also differed highly significantly in their prenormalization excitatory input strength (supplemental Table S1, available at www.jneurosci.org as supplemental material; see Fig. 7C) both for input from layer 2/3 and from layer 4 (p < 0.005; Mann–Whitney _U_ test), indicating that the differences between cell types in their %EIs resulted from differences in absolute input strength for both layers 2/3 and 4. SOM+/CR+ MCs had much stronger evoked input from layer 2/3 than from layer 4 (7.07 ± 0.61 pA vs 1.83 ± 0.33 pA; _p_ < 0.001) and SOM+/CR− MCs had more balanced input from layers 2/3 and 4 (4.86 ± 0.51 pA vs 3.88 ± 0.48 pA, _p_ > 0.1). The ratios of layer 2/3 to layer 4 input for the SOM+/CR+ versus SOM+/CR− cells were 3.46 ± 0.43 versus 1.56 ± 0.30, respectively (p < 0.001). Thus, the SOM+/CR− cells received relatively balanced excitation from layers 2/3 and 4, whereas input to SOM+/CR+ cells was dominated by layer 2/3.
Figure 2.
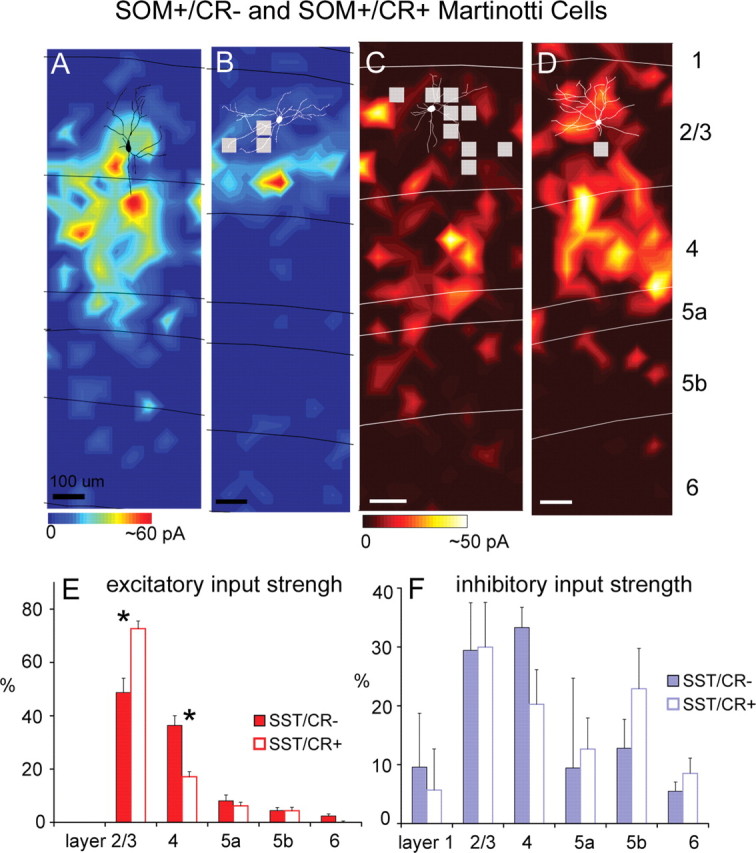
Laminar patterns of excitatory and inhibitory input to two subtypes of Martinotti cells. A, B, Example excitatory input maps from a SOM+/CR− Martinotti cell and a SOM+/CR+ Martinotti cell, respectively (for morphological, immunochemical, and electrophysiological features of the SOM+/CR− and SOM+/CR+ cells illustrated in A and B , see supplemental Fig. S1_G–L_, available at www.jneurosci.org as supplemental material). C, D, Example inhibitory input maps from a different SOM+/CR− Martinotti cell and a different SOM+/CR+ Martinotti cell, respectively. Scales bars: A–D, 100 μm. E, Average laminar strength of excitatory input (%EI) for SOM+/CR− cells (N = 18; solid red bars) versus SOM+/CR+ cells (N = 25; open bars). These two subtypes differed significantly both in their input strength (% EI) from layer 2/3 and from layer 4 (p < 0.005). (Asterisks denote statistical significance.) F, Average laminar strength of inhibitory input (%EI) for SOM+/CR− cells (N = 6; solid blue bars) versus SOM+/CR+ cells (N = 9; open bars). Generally, the two subtypes have similar inhibitory input patterns. Conventions as in Figure 1.
For both subtypes of MCs, we also examined their inhibitory input. As illustrated in Figure 2, C, D, and F, SOM+/CR− cells and SOM+/CR+ cells both tended to receive extensive inhibition from layers 2/3, 4, and 5. All layers except layer 1 provided statistically significant inhibitory input. The average inhibitory %EIs for layers 2/3, 4, 5a, and 5b for SOM+/CR− MCs (N = 6) were 29.4 ± 8.1%, 33.3 ± 3.4%, 9.4 ± 15.3%, and 12.8 ± 4.9%, respectively. Similarly, the average inhibitory %EIs for layers 2/3, 4, 5a, and 5b for SOM+/CR+ MCs (N = 9) were 30.0 ± 7.6%, 20.3 ± 5.9%, 12.7 ± 5.3%, and 22.9 ± 6.8%, respectively. Both types of MCs had strong inhibitory input from layers 2/3 and 4, and their inputs from deep layers (i.e., layers 5a and 5b) were also notably large, in contrast with FS cells and pyramidal cells, as well as those layer 2/3 inhibitory cell types previously described in rat visual cortex (Dantzker and Callaway, 2000). Although previous studies have not identified strong inhibitory input from deeper layers, it has been known that layer 5 inhibitory cells send axons to and make synaptic contacts in layer 2/3 (Ma et al., 2006; Silberberg and Markram, 2007). Overall, SOM+/CR− and SOM+/CR+ MCs had similar inhibitory input strengths across cortical layers with no statistically significant differences (Fig. 2F; supplemental Table S1, available at www.jneurosci.org as supplemental material).
Multipolar non-fast-spiking inhibitory neurons
We mapped and compared local input to multipolar BS, IS, and RS cells that expressed GFP in G30 mice. Similar to SOM+/CR+ MCs, BS cells tended to receive the great majority of their excitatory input from layer 2/3 (Fig. 3A,C). Their average excitatory %EIs (N = 8) for layers 2/3 and 4 were 74.7 ± 12.2% and 14.2 ± 4.7%, respectively (Fig. 3C). Layers 5a, 5b, and 6 provided little or insignificant excitatory input to BS cell (Fig. 3C; supplemental Table S1, available at www.jneurosci.org as supplemental material). BS cells also received strong inhibitory input primarily from layer 2/3 (Fig. 3B,D), similar to the pattern of inhibition onto pyramidal cells and most layer 2/3 inhibitory cell types examined in rat visual cortex (Dantzker and Callaway, 2000). Despite the weak inhibitory input from other layers, it was typically significant above background spontaneous activity. BS cells received statistically significant inhibitory input from layers 2/3, 4, 5b, and 6, and their %EIs (N = 9) were 48.4 ± 4.1%, 6.4 ± 1.8%, 12.7 ± 3.7%, and 8.8 ± 3.4%, respectively (Fig. 3D; supplemental Table S1, available at www.jneurosci.org as supplemental material).
Figure 3.

Laminar patterns of excitatory and inhibitory input to burst-spiking cells. A, B, Example maps of excitatory and inhibitory input from a BS cell (for morphological and electrophysiological features of BS cells, see supplemental Fig. S2_G–I_, available at www.jneurosci.org as supplemental material). C, D, Summary data of laminar input strength (mean ± SE; %EI), calculated from eight excitatory input maps and nine inhibitory input maps from BS cells. Scale bars, 100 μm. Conventions are as in previous figures.
We found that several cell types received strong excitation from layers 2/3 and 5a but not layer 4. This input pattern has not been observed in previous studies of other cortical areas and/or cell types. As shown in the example input maps and summary histograms in Figure 4, A, C, E, and G, IS cells and RS cells received strong excitatory input from layers 2/3 and 5a, but they tended to receive relatively weak or no input from layer 4, leaving a gap between the zones of strong input. This input pattern was observed consistently across the cells of these types and was distinct from input patterns for pyramidal cells, FS cells, Martinotti cells, and BS cells (see below; see Fig. 7).
Figure 4.
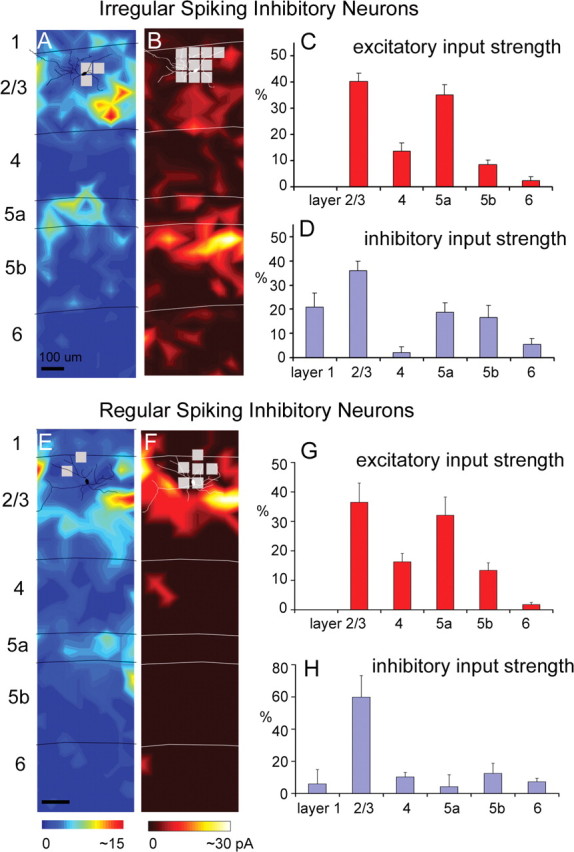
Laminar patterns of excitatory and inhibitory input to multipolar irregular-spiking cells and regular-spiking cells. A, B, Example maps of excitatory and inhibitory input from an IS cell (for morphological and electrophysiological features of the example IS cell illustrated in A and B, see supplemental Fig. S2_A–C_, available at www.jneurosci.org as supplemental material). C, D, Summary data of laminar input strength (mean ± SE; %EI), calculated from 11 excitatory input maps and nine inhibitory input maps from IS cells. E, F, Example maps of excitatory and inhibitory input from an RS cell (for morphological and electrophysiological features of RS cells, see supplemental Fig. S2_D–F_, available at www.jneurosci.org as supplemental material). G, H, Summary data of laminar input strength (mean ± SE; %EI), calculated from seven excitatory input maps and six inhibitory input maps from RS cells. Conventions are as in previous figures.
For IS cells, their average excitatory %EIs (N = 11) for layers 2/3 and 5a were 40.2 ± 3.2% and 35.2 ± 3.8%, respectively, both of which were much stronger than for layer 4 (13.7 ± 3.2%). Compared with pyramidal cells and FS cells, this input pattern can be attributed to a significant decrease in the strength of evoked inputs from layer 4 (1.05 ± 0.33 pA for IS cells, compared with 5.48 ± 0.96 pA and 7.53 ± 1.08 pA for pyramidal cells and FS cells, respectively) (supplemental Table S1, available at www.jneurosci.org as supplemental material). In contrast, absolute amplitudes of input from layers 2/3 and 5a (3.18 ± 0.50 pA and 2.58 ± 0.42 pA, respectively) for IS cells were comparable with pyramidal and FS cells (supplemental Table S1, available at www.jneurosci.org as supplemental material). Similarly, for RS cells, their average excitatory %EIs (N = 7) for layers 2/3 and 5a were 36.5 ± 6.5% and 32.1 ± 6.2%, respectively, whereas the %EI for layer 4 was only about half as strong (16.3 ± 2.9%) (supplemental Table S1, available at www.jneurosci.org as supplemental material).
The pattern of inhibitory input to IS cells mirrored the pattern of excitatory input. IS cells received strong inhibition from layers 1, 2/3, and 5 and quite weak inhibitory input from layer 4. This input pattern is apparent both in the example map (Fig. 4B) and in the average across IS cells (Fig. 4D). IS cells received statistically significant inhibitory input from layers 1, 2/3, 5a, and 5b with average inhibitory %EIs (N = 9) of 21.2 ± 5.0%, 38.1 ± 4.0%, 17.0 ± 3.9%, and 16.3 ± 4.5%, respectively (Fig. 4D; supplemental Table S1, available at www.jneurosci.org as supplemental material). However, inhibitory input to IS cells from layers 4 and 6 was small and statistically insignificant, with inhibitory %EIs of 2.4 ± 1.9% and 5.0 ± 2.2%, respectively (Fig. 4D; supplemental Table S1, available at www.jneurosci.org as supplemental material).
Although RS cells had an excitatory input pattern similar to IS cells, they had a different inhibitory input pattern, which is more similar to that of BS cells. As shown in Figure 4, F and H, the RS cells received strong inhibition predominantly from layer 2/3; their inhibitory %EI (N = 6) for layer 2/3 was 59.9 ± 13.4%. RS cells also received significant inhibition from layer 4 (inhibitory %EI, 10.3 ± 2.8%). Inhibitory input from layers 1, 5a, and 5b to RS cells was statistically insignificant compared with background spontaneous activity (supplemental Table S1, available at www.jneurosci.org as supplemental material).
Chandelier cells, neurogliaform cells, and bipolar cells
We also mapped input to a small number of other inhibitory cell types expressing GFP in either G42 or G30 mice, including chandelier cells, neurogliaform cells, and bipolar cells. The chandelier cell illustrated in Figure 5A received extensive excitatory input from layers 2/3, 4, and 5. Averaged across the chandelier cells sampled (N = 3), cells of this type received their strongest excitation from layers 2/3 and 5a (excitatory %EI, 43.8 ± 10.5% and 27.9 ± 4.4%, respectively) and somewhat weaker input from layer 4 (excitatory %EI, 17.9 ± 5.6%) (Fig. 5C; supplemental Table S1, available at www.jneurosci.org as supplemental material). These cells received the great majority of their inhibition from layers 1 and 2/3 (inhibitory %EI, 26.5 ± 3.4% and 67.9 ± 11.2%, respectively) (Fig. 5B,D). They did not receive statistically significant inhibitory input from layer 4 or 5a but received weak significant input from layers 5b and 6 (compared with control trials).
Figure 5.
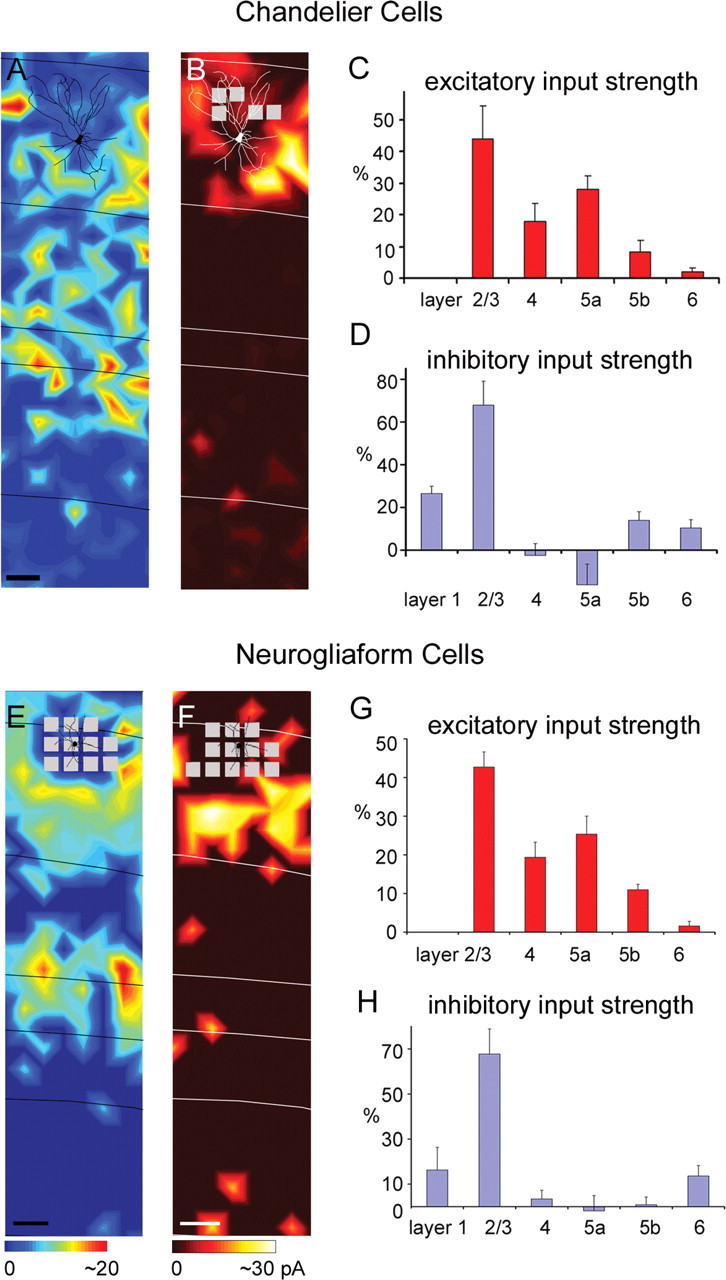
Laminar patterns of excitatory and inhibitory input to chandelier cells and neurogliaform cells. A, B, Excitatory and inhibitory input maps for an example chandelier cell (for morphological and electrophysiological features of the chandelier cell illustrated in A and B , see supplemental Fig. S1_D–F_, available at www.jneurosci.org as supplemental material). C, D, Summary data of laminar input strength (mean ± SE; %EI) from three excitatory input maps and four inhibitory input maps from chandelier cells. E, F, Example maps of excitatory and inhibitory input, respectively, for a neurogliaform cell (for morphological and electrophysiological features of the neurogliaform cell illustrated in E and F, see supplemental Fig. S2_M–O_, available at www.jneurosci.org as supplemental material). G, Average laminar strength of excitatory input for four neurogliaform cells, and H shows average inhibitory input strength from these cells. Conventions are as in previous figures.
Layer 2/3 neurogliaform cells also received strong excitation from both upper and deep layers (i.e., layers 2/3 and 5) (Fig. 5E,G). As shown by the example in Figure 5E, this cell received strong input from layer 2/3, part of layer 4 and layer 5a. Averaged across all 4 neurogliaform cells sampled, it can be seen that these cells also receive the now familiar pattern of strong excitation from layers 2/3 and 5a with weaker input from the middle of layer 4 (excitatory %EI for layers 2/3, 4, 5a, and 5b: 42.7 ± 3.9%, 19.4 ± 3.9%, 25.4 ± 4.7%, and 11.0 ± 1.4%, respectively) (Fig. 5G; supplemental Table S1, available at www.jneurosci.org as supplemental material). This pattern tends to be similar to that observed for IS and RS cells. Inhibitory input to the four neurogliaform cells was primarily from layer 2/3 (inhibitory %EI, 67.8 ± 11.1%).
Bipolar cells received excitatory input primarily from layers 2/3 and 4, similar to SOM+/CR− MCs (compare Figs. 6A, 2A). Averaged across five bipolar cells, they received significant excitation from layers 2/3, 4, 5a, and 5b (excitatory %EI: 33.8 ± 7.3%, 39.4 ± 6.4%, 14.0 ± 1.6%, and 10.0 ± 2.7%, respectively) (Fig. 6C; supplemental Table S1, available at www.jneurosci.org as supplemental material). The five bipolar cells sampled varied in their inhibitory input patterns; three of the five cells received most inhibitory input from layer 2/3, whereas the other two received most inhibition from layers 4 and 5. For the four maps analyzed, their average inhibitory %EIs for layers 2/3, 4, 5a, and 5b were 24.1 ± 10.4%, 21.5 ± 6.4%, 22.1 ± 2.1%, and 20.6 ± 11.2%, respectively (Fig. 6D; supplemental Table S1, available at www.jneurosci.org as supplemental material).
Comparison of input patterns across cell types
The excitatory input patterns of all the cell types examined are summarized in Figure 7. A series of cumulative histograms with laminar excitatory %EI are shown in Figure 7A for all 10 cell types: pyramidal cells, FS cells, SOM+/CR− MCs, SOM+/CR+ MCs, IS cells, RS cells, BS cells, chandelier cells, bipolar cells, and neurogliaform cells. From this summary, it is clear that all the cell types in layer 2/3 received strong excitation from layer 2/3 (Fig. 7C, top) and only weak or no excitatory input from layers 5b and 6. Thus, cell types differed primarily in the extent of excitation that they received from layers 4 and 5a.
These differences gave rise to three basic patterns of excitatory input for these cell types, which appear as distinct clusters in Figure 7B: layer 2/3 dominated input, layer 2/3 and 4 balanced input, weak layer 4 input but strong layer 2/3 and layer 5a input. The first pattern, dominant layer 2/3 excitatory input, was observed for SOM+/CR+ MCs (MC+) and BS cells, as they received >70% of their excitation from layer 2/3 (Fig. 7A,B). Although these cell types received similar patterns of input, they differed in the absolute strength of input (Fig. 7C, top and middle). SOM+/CR+ MCs received significantly stronger input than BS cells from both layers 2/3 and 4 (p < 0.0001).
The second excitatory input pattern, balanced excitation from layers 2/3 and 4, was observed for SOM+/CR− MCs (MC−), FS cells, and bipolar cells (Fig. 7A), which, along with pyramidal neurons, constitute another cluster in Figure 7B. Like other cell types, this group received strong excitatory input from layer 2/3 (Fig. 7C, top). However, they differed from other cell types because of their relatively strong excitatory input from layer 4 (Fig. 7C, middle). These cell types received a large proportion of their input from layer 4 based on normalized values (i.e., %EI), and they are also the cell types which received the strongest input from layer 4 before normalization (Fig. 7C, middle). FS cells had significantly larger layer 4 EIs than every other inhibitory cell type (p < 0.05), but this was balanced by additional strong excitation from layer 5a. Thus, FS cells fall into the same group as MC− and bipolar cells based on normalized %EIs despite the fact that they receive stronger input from layer 5a than other cell type in this group (Fig. 7C, bottom). A similar pattern was also observed for pyramidal neurons.
The final excitatory input pattern, relatively weak excitation from layer 4 flanked by stronger inputs from layers 2/3 and 5a, was observed for chandelier cells, neurogliaform cells, RS cells, and IS cells (Fig. 7A). These remaining cell types form a third cluster in Figure 7B. All of these cell types, along with FS cells and pyramids (see above), receive stronger absolute EIs from layer 5a than other cell types (Fig. 7C, bottom; supplemental Table S1, available at www.jneurosci.org as supplemental material). Cell types within this group did not differ significantly from each other but had significantly stronger input from layer 5a than SOM+/CR+ MCs, SOM+/CR− MCs, BS, and bipolar cells (p < 0.01).
To further explore the relationship between the laminar patterns of input to individual cells, independent of cell type, we performed an unsupervised cluster analysis based on the excitatory %EI values from layer 2/3, 4, and 5a for each cell (for further details, see Materials and Methods and supplemental Fig. S4, available at www.jneurosci.org as supplemental material). This analysis revealed three main clusters. The laminar inputs to cells in these clusters correspond to the same three patterns (predominantly layer 2/3, layers 2/3 and 5a, layers 2/3 and 4) that were identified above based on the average inputs to cells grouped according to inhibitory cell type. Furthermore, the cell types that fall into each of these three independently generated clusters correspond closely to the expected input patterns based on the average values for each cell type.
A summary of the patterns of inhibitory input to each of the 10 cell types is illustrated in Figure 8. Although there were significant differences between cell types in their inhibitory input patterns, these patterns did not separate cell types into groups as clearly as the patterns of excitatory input. Nevertheless, there were trends which we will use to summarize our findings. Examination of Figure 8C reveals that all cell types received strong local inhibition from within layer 2/3, whereas inhibition from layers 4 and 5 varied between cell types. Furthermore, it can be seen that, for a given cell type, inhibition from layer 4 was either very strong or weak, providing the potential to separate cell types into two groups based on this parameter. The dichotomy between cells with very strong versus weak or no layer 4 input is further reinforced by an unsupervised cluster analysis of inhibitory %EI values (see below and supplemental Fig. S4, available at www.jneurosci.org as supplemental material). In contrast, the strength of inhibition from layer 5 was clearly not bimodal; across the population of cell types there was a continuum of input strength ranging from zero to very strong. This relatively continuous distribution of layer 5 inhibitory input strengths is also reinforced by cluster analysis.
We will first consider cell types according to whether or not they received strong inhibition from layer 4. Five of the nine inhibitory cell types received weak or no layer 4 input but varied in the strength of inhibition that they received from layer 5. For the majority of these cell types, inhibition from layer 5 was also relatively weak, and they, therefore, received most of their inhibition from layer 2/3 and relatively little inhibition from other layers. The cell types with this inhibitory input pattern included four inhibitory cell types, chandelier, neurogliaform, RS, and BS, as well as pyramidal cells. This can be seen both in the normalized values (Fig. 8A) and in the absolute values (Fig. 8C). All of these cell types received strong input from layer 2/3, whereas input from layers 4 and 5 was either very weak and/or did not vary significantly from baseline (Fig. 8C; supplemental Table S1, available at www.jneurosci.org as supplemental material). Although these cell types vary in their inhibitory %EI from layer 5, their relatively strong layer 2/3 and weak layer 4 input places them in a contiguous space within Figure 8B that is separate from the remaining five cell types. The fifth inhibitory cell type with weak (or no) inhibition from layer 4 is the IS cell. Although IS cells are positioned near RS and BS cells in Figure 8B, the pattern of inhibitory input to IS cells is unique, as is most clear from the strength of input before normalization (Fig. 8C). IS cells received strong inhibition from both layer 2/3 and layer 5 but little or no inhibition from layer 4. Although the position of IS cells in Figure 8B (normalized values) is close to RS and BS cells, IS cells received stronger layer 5 input than either of these cells types (prenormalization).
It is noteworthy that four of the five inhibitory cell types receiving weak inhibition from layer 4, all shared a similar pattern of excitatory input from layers 2/3 and 5a, but not layer 4 (chandelier, neurogliaform, RS and IS cells). The remaining cell type, BS cells, also lacked strong excitation from layer 4, suggesting a strong correlation between layer 4 excitation and layer 4 inhibition (see also below).
Four inhibitory cell types received strong inhibition from layer 4, and three of these types clearly differed from the fourth in the strength of input from layer 5. These three cell types, SOM+/CR− MCs (MC−), SOM+/CR+ MCs (MC+) and BCs, all received strong inhibitory input from layer 5, as well as layers 2/3 and 4 (Fig. 8A,B). These cell types, along with FS cells, received more layer 4 input (Fig. 8C, absolute input values) than the other six cell types. This difference was statistically significant for SOM+/CR− MCs in comparison with all six other cell types (p < 0.05) and for SOM+/CR+ MCs and FS cells compared with five of the six cells types (not for RS cells) (p < 0.05). The stronger layer 4 inhibitory input to bipolar cells was variable across cells within the population and was significant only compared with chandelier, BS, and IS cells (p < 0.05). Although these three inhibitory cell types received inhibition from similar laminar sources, they represent two different groups based on excitatory input sources.
The remaining cell type, FS cells, had unique inhibitory input pattern (Fig. 8A–C). Only FS cells received strong inhibition from both layers 2/3 and 4 but not layer 5. This is clear both from the isolated position of FS cells in Figure 8B and from the absolute input values shown in Figure 8C, where it can be seen that, unlike other cell types receiving strong inhibition from layer 4, FS cells received essentially no inhibitory input from layer 5. It is again noteworthy that three of the four inhibitory cell types with strong layer 4 inhibition also received strong excitation from layer 4.
To further examine the relationship between the laminar patterns of inhibitory input to individual cells, we also performed an unsupervised cluster analysis based on the inhibitory %EI values from layer 2/3, 4, and 5 for each cell (see Materials and Methods and supplemental Fig. S4, available at www.jneurosci.org as supplemental material, for further details). This analysis revealed two main clusters corresponding to cells receiving either very strong layer 4 input versus weak or no layer 4 input. All of the cells in the cluster with strong layer 4 input are the same cell types identified as having strong layer 4 input based on average input patterns for each cell type. Furthermore, all of the individual cells belonging to types which on average have weak or no layer 4 input also fell into the cluster of cells which have weak or no layer 4 input. In contrast to the clear dichotomy based on layer 4 input, clear clusters related to relative strengths of either layer 2/3 or layer 5 inhibitory input did not emerge.
Functional significance of differing excitatory input patterns
Our results reveal diverse sources of excitation and inhibition for many layer 2/3 inhibitory cell types. These different input patterns likely reflect different functional roles within local cortical circuits. In the present study, we found that patterns of excitatory input to layer 2/3 inhibitory neurons fell into three distinct groups (Fig. 7). All inhibitory cell types studied received strong excitation from layer 2/3. Insofar as these same inhibitory cell types provide inhibition to neighboring layer 2/3 neurons, these neurons can be considered to provide feedback inhibition (Fig. 9, left). This potential mechanism is supported by the known synaptic connectivity between layer 2/3 inhibitory cells (e.g., FS cells, IS cells, neurogliaform cells, and multipolar bursting cells) and layer 2/3 pyramids, revealed by dual whole-cell recordings (Blatow et al., 2003; Holmgren et al., 2003; Tamás et al., 2003; Galarreta et al., 2004; Simon et al., 2005; Yoshimura and Callaway, 2005). However, this is unlikely to apply to other cell types such as calretinin-immunoreactive interneurons which are preferentially connected to other inhibitory neurons (Meskenaite, 1997; Gonchar and Burkhalter, 1999).
Figure 9.

Differing excitatory input patterns and their corresponding functional differences in local cortical circuits. A schematic drawing illustrates that (1) the layer 2/3 inhibitory neurons that receive excitatory input from layer 2/3 excitatory pyramidal cells (observed for all cell types examined) have the potential to provide feedback inhibition onto the excitatory pyramidal cells; (2) the layer 2/3 inhibitory neurons such as SOM+/CR− Martinotti cells (MC−), FS and bipolar cells that also receive strong feedforward excitation from layer 4, have the potential to exert both lemniscal feedforward inhibition and feedback inhibition onto layer 2/3 pyramidal cells; (3) the layer 2/3 inhibitory neurons such as chandelier cells, neurogliaform cells, and IS cells receive strong feedforward excitation from layer 5a, and are thus more directly influenced by the paralemniscal pathway and have the potential to exert both paralemniscal feedforward inhibition and feedback inhibition onto layer 2/3 pyramidal cells.
For SOM+/CR+ MCs and BS cells, layer 2/3 was their only source of strong excitatory input (Fig. 9, left). Other cell types, however, received additional strong excitation from either layer 4 or layer 5a but not from both layers. This suggests differences between these cell types in their relationships to the lemniscal pathway [ventral posteromedial nucleus (VPM) input to layer 4] versus the paralemniscal pathway [PO (posterior complex) input to layer 5a]. For example, FS cells, SOM+/CR− MCs, and bipolar cells receive much stronger excitation from layer 4 than from layer 5a; this dominant layer 4 input provides them with the potential to generate more feedforward inhibition related to the lemniscal than to the paralemniscal pathway (Fig. 9, middle). In contrast, IS cells, RS cells, neurogliaform cells, and chandelier cells, which receive stronger excitation from layer 5a than layer 4, can potentially provide feedforward inhibition more strongly related to the paralemniscal pathway (Fig. 9, right). Nevertheless, differential influences of the lemniscal versus paralemniscal pathways should not be taken as evidence for independence. Layer 2/3 pyramidal neurons receive strong lemniscal input from layer 4, and these layer 2/3 pyramids in turn provide excitation to every inhibitory neuron type. Thus, inhibitory neurons receiving strong layer 5a excitatory input are likely to integrate information from both lemniscal and paralemniscal pathways.
Discussion
In this study, we characterized laminar sources of excitatory and inhibitory synaptic input to nine different inhibitory cell types and to pyramidal neurons in layer 2/3 of mouse S1 cortex. We extended previous observations demonstrating cell type specificity of excitatory connections for just two different classes of inhibitory neurons in rat visual cortex (Dantzker and Callaway, 2000), to provide a more comprehensive view across numerous cell types. We found that similar cell types received similar input patterns in these different cortical areas and species. With analyses of many more inhibitory cell types, we have been able to make novel observations both of general relevance to organization of cortical circuits and of particular relevance to barrel cortex: (1) we found that despite the enormous diversity of cell types, there were only three different laminar excitatory input patterns; (2) we identified a greater diversity of inhibitory input patterns than observed previously and demonstrated that cell type specificity of functional connections is a feature not only of excitatory input but also of inhibitory input; different inhibitory cell types receive inhibition from different cortical layers; (3) although different cell types sometimes received similar patterns of excitatory input, this did not always correlate with the pattern of inhibitory input; different cell types with the same pattern of excitatory input can differ in their patterns of inhibitory input; (4) in the context of the somatosensory system, our observations suggest that distinct inhibitory cell types are differentially influenced by lemniscal versus paralemniscal circuits.
Technical considerations
Before discussing our findings in detail, it is helpful to consider technical limitations and advantages of our methods. Laser scanning photostimulation is an effective method for identifying the locations of neurons that make direct functional connections to single neurons (Dantzker and Callaway, 2000; Shepherd et al., 2003; Yoshimura and Callaway, 2005; Bureau et al., 2006). As demonstrated in control experiments conducted previously and in the present study (Dantzker and Callaway, 2000; Yoshimura et al., 2005) (supplemental Fig. S5, available at www.jneurosci.org as supplemental material), neurons located within 50–100 μm of the site of glutamate uncaging fire action potentials. Therefore, it can be inferred that evoked synaptic currents reflect direct connections onto the recorded cell, from the cell(s) near the stimulation site. Although 50 μm is a relatively small distance, in the context of some very small or thin structures, such as layer 5a of the mouse barrel cortex, it is large. Thus, photostimulation sites very near to laminar borders have the potential to activate neurons on the other side of the border, particularly, when cells at the border have dendritic arbors that do not respect the boundary. In the context of our present findings, we suspect that this potential artifact is most likely to influence estimates of functional input from layer 4 when there is strong input from layers 2/3 and 5a. Nevertheless, this could not cause artifactual conclusions about differences in input to different cell types because the stimulation parameters are the same, regardless of what cell type is recorded.
Because photostimulation activates all cell types, the cell types which are providing input from a particular location cannot always be distinguished. Because of the great diversity of inhibitory cell types, this issue is most important when considering inhibitory input sources. For example, when different cell types are observed to receive different patterns of inhibitory input, it is clear that there is in fact a true difference. However, when similar input patterns are observed, it remains possible that the cell types from which they receive input could differ, as neurons with similar laminar patterns of inhibition might nevertheless differ in the types of inhibitory cell types that provide that inhibition.
Diversity of excitatory and inhibitory input patterns
Previous studies have provided only very limited data comparing functional connections to different types of inhibitory cortical neurons. These studies have typically distinguished cell types based on their intrinsic firing properties and compare FS cells to some other cell types (Gibson et al., 1999; Dantzker and Callaway, 2000; Gupta et al., 2000). Nevertheless, even these observations have been sufficient to demonstrate that different types of inhibitory cells receive excitatory input from different sources. Studies of input from VPM to layer 4 in the mouse S1 cortex have revealed that these connections preferentially target FS cells relative to low threshold spiking cells (Gibson et al., 1999). Studies of local input to layer 2/3 neurons in rat visual cortex demonstrated differences in excitatory input to FS cells versus non-FS cells (Dantzker and Callaway, 2000).
FS cells in visual cortex of both rats (Dantzker and Callaway, 2000) and mice (our unpublished observations) receive strong excitation from layers 2/3 and 4 and weaker input from deep layers. In mouse S1 cortex, we found that layer 2/3 FS cells also received a similar pattern of local excitation. The conservation of excitatory input patterns of FS cells likely reflects a common role for these neurons in providing feedforward inhibition. In both S1 barrel cortex and in visual cortex, strong thalamic input to layer 4 is transferred by layer 4 spiny neurons to layer 2/3 pyramids. The concurrent excitation of FS cells by the same layer 4 spiny neurons, as well as strong connectivity from FS cells to layer 2/3 pyramids, is generally accepted as an important mechanism for providing gain control in this pathway (Swadlow, 2003; Cruikshank et al., 2007). Furthermore, these same FS cells also provide additional gain control through feedback inhibition via their reciprocal connections with layer 2/3 pyramids (Holmgren et al., 2003; Yoshimura and Callaway, 2005).
Observations of local excitatory input to non-FS cells in rat visual cortex revealed two different input patterns, but no further distinctions were made between these cells (Dantzker and Callaway, 2000). Approximately half of the non-FS cells received strong excitatory input predominantly from layer 2/3 in rat visual cortex. In the present study, we found a similar pattern of excitatory input for some non-FS inhibitory cell types including SOM+/CR+ MCs and BS cells in mouse S1 cortex. However, for other non-FS cells such as SOM+/CR− MCs and bipolar cells, we found that they received relatively balanced input from both layers 2/3 and 4, with weak input from deep layers. Interestingly, although the remaining non-FS cells in rat visual cortex are found to receive much stronger excitation from layer 5 than from superficial layers, we did not observe such an input pattern for any cell type in the present sample from mouse S1. This could reflect differences in sampling bias between these studies or differences between cortical areas or species.
Biasing recordings toward GFP-expressing neurons in transgenic mice enabled us to sample many additional inhibitory cell types and to reveal novel input patterns. The most striking pattern of excitation involved relatively weak input from layer 4 flanked by strong input from layers 2/3 and 5a. This pattern was observed for all four of the remaining inhibitory cell types in our sample, including IS cells, RS cells, neurogliaform cells, and chandelier cells. We also observed for the first time that cell types differ systematically in their laminar sources of inhibition. Importantly, inhibitory input to inhibitory cells is not predictable from their excitatory input sources. For example, the two subtypes of MCs had different excitatory input patterns, but they received similar patterns of inhibitory input from layers 2/3, 4, and 5. Moreover, RS, IS, neurogliaform and chandelier cells had similar excitatory input sources, but they had different inhibitory input patterns. IS cells received matched excitation and inhibition from upper and deeper layers, but RS, neurogliaform and chandelier cells received inhibition mostly from layer 2/3. Despite the lack of a one-to-one correlation between patterns of excitation and inhibition, there was a strong trend for layer 4 inhibition to be correlated with layer 4 excitation.
Conclusions
Overall, our observations indicate differences in both excitatory and inhibitory connectivity to different types of layer 2/3 inhibitory neurons. Based on these observations, it is possible to infer likely differences between the functional influences of each inhibitory cell type (Fig. 9). However, because of the complexity within multisynaptic dynamic networks, a clear understanding of the functional roles of each inhibitory cell type within the intact network will require more extensive knowledge about each inhibitory cell type as well as in vivo studies. For example, the net effect of excitation or inhibition of any given inhibitory cell type depends in turn on the postsynaptic cells and cell types that are targeted by the inhibitory cell type. Here, we have provided crucial new information about the laminar sources of excitatory and inhibitory input to a large number of inhibitory cell types in cortical layer 2/3. Future studies should investigate not only the sources of input to each cell type, as we have described here, but also the specificity of their outputs. Furthermore, the properties of synaptic connections and functional influences within a network can shift dynamically in vivo. Regardless, the connectivity observed in living brain slices is an important step toward understanding inhibitory cortical circuits and serves as a guide for interpreting possible in vivo interactions.
Footnotes
This work was supported by National Institutes of Health Grants MH063912 (E.M.C.), EY010742 (E.M.C.), and K99DA023700 (X.X.). We thank Drs. Karel Svoboda and Gordon Shepherd for providing help with data analysis programs. We thank Drs. Josh Huang and Gábor Szabó for permission to use their GFP-expressing mouse lines, and Drs. Sacha Nelson and Jay Gibson for providing founder mice. We also thank Keith Roby for excellent technical assistance.
References
- Ascoli GA, Alonso-Nanclares L, Anderson SA, Barrionuevo G, Benavides-Piccione R, Burkhalter A, Buzsáki G, Cauli B, Defelipe J, Fairén A, Feldmeyer D, Fishell G, Fregnac Y, Freund TF, Gardner D, Gardner EP, Goldberg JH, Helmstaedter M, Hestrin S, Karube F, et al. Petilla terminology: nomenclature of features of GABAergic interneurons of the cerebral cortex. Nat Rev Neurosci. 2008;9:557–568. doi: 10.1038/nrn2402. [DOI] [PMC free article] [PubMed] [Google Scholar]
- Blatow M, Rozov A, Katona I, Hormuzdi SG, Meyer AH, Whittington MA, Caputi A, Monyer H. A novel network of multipolar bursting interneurons generates theta frequency oscillations in neocortex. Neuron. 2003;38:805–817. doi: 10.1016/s0896-6273(03)00300-3. [DOI] [PubMed] [Google Scholar]
- Borrell V, Yoshimura Y, Callaway EM. Targeted gene delivery to telencephalic inhibitory neurons by directional in utero electroporation. J Neurosci Methods. 2005;143:151–158. doi: 10.1016/j.jneumeth.2004.09.027. [DOI] [PubMed] [Google Scholar]
- Briggs F, Callaway EM. Laminar patterns of local excitatory input to layer 5 neurons in macaque primary visual cortex. Cereb Cortex. 2005;15:479–488. doi: 10.1093/cercor/bhh154. [DOI] [PMC free article] [PubMed] [Google Scholar]
- Bureau I, von Saint Paul F, Svoboda K. Interdigitated paralemniscal and lemniscal pathways in the mouse barrel cortex. PLoS Biol. 2006;4:e382. doi: 10.1371/journal.pbio.0040382. [DOI] [PMC free article] [PubMed] [Google Scholar]
- Chattopadhyaya B, Di Cristo G, Higashiyama H, Knott GW, Kuhlman SJ, Welker E, Huang ZJ. Experience and activity-dependent maturation of perisomatic GABAergic innervation in primary visual cortex during a postnatal critical period. J Neurosci. 2004;24:9598–9611. doi: 10.1523/JNEUROSCI.1851-04.2004. [DOI] [PMC free article] [PubMed] [Google Scholar]
- Cruikshank SJ, Lewis TJ, Connors BW. Synaptic basis for intense thalamocortical activation of feedforward inhibitory cells in neocortex. Nat Neurosci. 2007;10:462–468. doi: 10.1038/nn1861. [DOI] [PubMed] [Google Scholar]
- Dantzker JL, Callaway EM. Laminar sources of synaptic input to cortical inhibitory interneurons and pyramidal neurons. Nat Neurosci. 2000;3:701–707. doi: 10.1038/76656. [DOI] [PubMed] [Google Scholar]
- Galarreta M, Erdélyi F, Szabó G, Hestrin S. Electrical coupling among irregular-spiking GABAergic interneurons expressing cannabinoid receptors. J Neurosci. 2004;24:9770–9778. doi: 10.1523/JNEUROSCI.3027-04.2004. [DOI] [PMC free article] [PubMed] [Google Scholar]
- Gibson JR, Beierlein M, Connors BW. Two networks of electrically coupled inhibitory neurons in neocortex. Nature. 1999;402:75–79. doi: 10.1038/47035. [DOI] [PubMed] [Google Scholar]
- Gonchar Y, Burkhalter A. Connectivity of GABAergic calretinin-immunoreactive neurons in rat primary visual cortex. Cereb Cortex. 1999;9:683–696. doi: 10.1093/cercor/9.7.683. [DOI] [PubMed] [Google Scholar]
- Gupta A, Wang Y, Markram H. Organizing principles for a diversity of GABAergic interneurons and synapses in the neocortex. Science. 2000;287:273–278. doi: 10.1126/science.287.5451.273. [DOI] [PubMed] [Google Scholar]
- Halabisky B, Shen F, Huguenard JR, Prince DA. Electrophysiological classification of somatostatin-positive interneurons in mouse sensorimotor cortex. J Neurophysiol. 2006;96:834–845. doi: 10.1152/jn.01079.2005. [DOI] [PubMed] [Google Scholar]
- Holmgren C, Harkany T, Svennenfors B, Zilberter Y. Pyramidal cell communication within local networks in layer 2/3 of rat neocortex. J Physiol. 2003;551:139–153. doi: 10.1113/jphysiol.2003.044784. [DOI] [PMC free article] [PubMed] [Google Scholar]
- Kapfer C, Glickfeld LL, Atallah BV, Scanziani M. Supralinear increase of recurrent inhibition during sparse activity in the somatosensory cortex. Nat Neurosci. 2007;10:743–753. doi: 10.1038/nn1909. [DOI] [PMC free article] [PubMed] [Google Scholar]
- Kawaguchi Y. Physiological subgroups of nonpyramidal cells with specific morphological characteristics in layer II/III of rat frontal cortex. J Neurosci. 1995;15:2638–2655. doi: 10.1523/JNEUROSCI.15-04-02638.1995. [DOI] [PMC free article] [PubMed] [Google Scholar]
- Kawaguchi Y, Kondo S. Parvalbumin, somatostatin and cholecystokinin as chemical markers for specific GABAergic interneuron types in the rat frontal cortex. J Neurocytol. 2002;31:277–287. doi: 10.1023/a:1024126110356. [DOI] [PubMed] [Google Scholar]
- López-Bendito G, Sturgess K, Erdélyi F, Szabó G, Molnár Z, Paulsen O. Preferential origin and layer destination of GAD65-GFP cortical interneurons. Cereb Cortex. 2004;14:1122–1133. doi: 10.1093/cercor/bhh072. [DOI] [PubMed] [Google Scholar]
- Ma Y, Hu H, Berrebi AS, Mathers PH, Agmon A. Distinct subtypes of somatostatin-containing neocortical interneurons revealed in transgenic mice. J Neurosci. 2006;26:5069–5082. doi: 10.1523/JNEUROSCI.0661-06.2006. [DOI] [PMC free article] [PubMed] [Google Scholar]
- Markram H, Toledo-Rodriguez M, Wang Y, Gupta A, Silberberg G, Wu C. Interneurons of the neocortical inhibitory system. Nat Rev Neurosci. 2004;5:793–807. doi: 10.1038/nrn1519. [DOI] [PubMed] [Google Scholar]
- Meskenaite V. Calretinin-immunoreactive local circuit neurons in area 17 of the cynomolgus monkey, Macaca fascicularis. J Comp Neurol. 1997;379:113–132. [PubMed] [Google Scholar]
- Murphy GJ, Du Lac S. Postnatal development of spike generation in rat medial vestibular nucleus neurons. J Neurophysiol. 2001;85:1899–1906. doi: 10.1152/jn.2001.85.5.1899. [DOI] [PubMed] [Google Scholar]
- Oliva AA, Jr, Jiang M, Lam T, Smith KL, Swann JW. Novel hippocampal interneuronal subtypes identified using transgenic mice that express green fluorescent protein in GABAergic interneurons. J Neurosci. 2000;20:3354–3368. doi: 10.1523/JNEUROSCI.20-09-03354.2000. [DOI] [PMC free article] [PubMed] [Google Scholar]
- Schubert D, Kötter R, Zilles K, Luhmann HJ, Staiger JF. Cell type-specific circuits of cortical layer IV spiny neurons. J Neurosci. 2003;23:2961–2970. doi: 10.1523/JNEUROSCI.23-07-02961.2003. [DOI] [PMC free article] [PubMed] [Google Scholar]
- Shepherd GM, Svoboda K. Laminar and columnar organization of ascending excitatory projections to layer 2/3 pyramidal neurons in rat barrel cortex. J Neurosci. 2005;25:5670–5679. doi: 10.1523/JNEUROSCI.1173-05.2005. [DOI] [PMC free article] [PubMed] [Google Scholar]
- Shepherd GM, Pologruto TA, Svoboda K. Circuit analysis of experience-dependent plasticity in the developing rat barrel cortex. Neuron. 2003;38:277–289. doi: 10.1016/s0896-6273(03)00152-1. [DOI] [PubMed] [Google Scholar]
- Shepherd GM, Stepanyants A, Bureau I, Chklovskii D, Svoboda K. Geometric and functional organization of cortical circuits. Nat Neurosci. 2005;8:782–790. doi: 10.1038/nn1447. [DOI] [PubMed] [Google Scholar]
- Silberberg G, Markram H. Disynaptic inhibition between neocortical pyramidal cells mediated by Martinotti cells. Neuron. 2007;53:735–746. doi: 10.1016/j.neuron.2007.02.012. [DOI] [PubMed] [Google Scholar]
- Simon A, Oláh S, Molnár G, Szabadics J, Tamás G. Gap-junctional coupling between neurogliaform cells and various interneuron types in the neocortex. J Neurosci. 2005;25:6278–6285. doi: 10.1523/JNEUROSCI.1431-05.2005. [DOI] [PMC free article] [PubMed] [Google Scholar]
- Somogyi P, Tamás G, Lujan R, Buhl EH. Salient features of synaptic organisation in the cerebral cortex. Brain Res Brain Res Rev. 1998;26:113–135. doi: 10.1016/s0165-0173(97)00061-1. [DOI] [PubMed] [Google Scholar]
- Sugino K, Hempel CM, Miller MN, Hattox AM, Shapiro P, Wu C, Huang ZJ, Nelson SB. Molecular taxonomy of major neuronal classes in the adult mouse forebrain. Nat Neurosci. 2006;9:99–107. doi: 10.1038/nn1618. [DOI] [PubMed] [Google Scholar]
- Swadlow HA. Fast-spike interneurons and feedforward inhibition in awake sensory neocortex. Cereb Cortex. 2003;13:25–32. doi: 10.1093/cercor/13.1.25. [DOI] [PubMed] [Google Scholar]
- Tamás G, Lorincz A, Simon A, Szabadics J. Identified sources and targets of slow inhibition in the neocortex. Science. 2003;299:1902–1905. doi: 10.1126/science.1082053. [DOI] [PubMed] [Google Scholar]
- Uematsu M, Hirai Y, Karube F, Ebihara S, Kato M, Abe K, Obata K, Yoshida S, Hirabayashi M, Yanagawa Y, Kawaguchi Y. Quantitative chemical composition of cortical GABAergic neurons revealed in transgenic venus-expressing rats. Cereb Cortex. 2008;18:315–330. doi: 10.1093/cercor/bhm056. [DOI] [PubMed] [Google Scholar]
- Xu X, Roby KD, Callaway EM. Mouse cortical inhibitory neuron type that coexpresses somatostatin and calretinin. J Comp Neurol. 2006;499:144–160. doi: 10.1002/cne.21101. [DOI] [PubMed] [Google Scholar]
- Yoshimura Y, Callaway EM. Fine-scale specificity of cortical networks depends on inhibitory cell type and connectivity. Nat Neurosci. 2005;8:1552–1559. doi: 10.1038/nn1565. [DOI] [PubMed] [Google Scholar]
- Yoshimura Y, Dantzker JL, Callaway EM. Excitatory cortical neurons form fine-scale functional networks. Nature. 2005;433:868–873. doi: 10.1038/nature03252. [DOI] [PubMed] [Google Scholar]