Genome-wide Association Study of Smoking Initiation and Current Smoking (original) (raw)
Abstract
For the identification of genes associated with smoking initiation and current smoking, genome-wide association analyses were carried out in 3497 subjects. Significant genes that replicated in three independent samples (n = 405, 5810, and 1648) were visualized into a biologically meaningful network showing cellular location and direct interaction of their proteins. Several interesting groups of proteins stood out, including glutamate receptors (e.g., GRIN2B, GRIN2A, GRIK2, GRM8), proteins involved in tyrosine kinase receptor signaling (e.g., NTRK2, GRB14), transporters (e.g., SLC1A2, SLC9A9) and cell-adhesion molecules (e.g., CDH23). We conclude that a network-based genome-wide association approach can identify genes influencing smoking behavior.
Introduction
Large-scale population-based twin and family studies have established that genetic factors contribute to individual differences in multiple aspects of smoking behavior.1 According to the World Health Organization, smoking-related diseases constitute the second leading cause of death in the world (see Web Resources). Numerous studies have shown that smoking initiation (SI) and current smoking (CS) behavior are heritable traits.1–3 A meta-analysis estimated a heritability of 37% and 55% (for males and females, respectively) for SI and a heritability of 59% and 46% (for males and females, respectively) for CS.1 Both SI and CS significantly correlated with other dimensions of smoking behavior, such as quantity of cigarettes smoked and nicotine dependence—as measured, for example, with the Fagerström Test for Nicotine Dependence.2–5 The correlation of nicotine dependence with SI and CS is attributable to genetic correlations, but the genetic overlap is only partial.2,6,7 Identification of genes underlying the vulnerability to smoking might help identify more effective prevention strategies and thus diminish smoking-related morbidity.
Linkage studies of smoking behavior identified thirteen chromosomal regions with suggestive or significant signals in at least two independent samples.8 Studies of candidate genes, which generally tend to lie outside these linkage peaks, have failed to provide replicated evidence for a contribution of these genes to smoking behavior.9,10 This might have multiple reasons, including inappropriate choice of candidate genes or small sample sizes combined with the probable small contribution of individual loci to complex behaviors such as smoking.10 Genome-wide association (GWA) studies, followed by replication in multiple data sets, offer the prospect of overcoming these shortcomings.11,12 There have been GWA studies for nicotine dependence,13,14 smoking cessation,15 number of cigarettes smoked per day,16,17 and addiction vulnerability18,19 but not for SI or CS. Although dimensions of smoking behavior are genetically correlated, the overlap is only partial.
A major challenge of the GWA approach is that because of the need to rigorously correct for the large number of genotype-phenotype tests, it tends to focus exclusively on individual genes and/or regions that have the strongest statistical evidence for association. However, individuals can be at risk for smoking through multiple genetic variants acting on different proteins in the same functional network.
When the evidence for a significant contribution of genetic variation in a region comes only from a subset of individuals, the signal strength for a single gene might be small, even in large samples. These effects are likely to be pruned out in GWA studies by the need to adjust for multiple testing.9 Pathway-based approaches have been suggested as an alternative strategy to GWA data. These approaches can yield biological insights that are not obtained by the focus on individual genes and/or regions that have the strongest statistical evidence for association.20 A pathway-based approach identifies whether single-nucleotide polymorphisms (SNPs) in genes predefined to belong in a certain pathway show more significant association results than expected by chance. It can confirm hypothesized causal pathways and disease mechanisms a priori but can also detect novel pathways and mechanisms.
In general, the grouping of genes in pathway-based approaches is based on existing knowledge of gene function. A potential disadvantage of this approach is that prior knowledge in correctly assigning genes to a certain pathway is crucial. Moreover, genes may have diverse functions, and this might not always be reflected in pathway assignment. In this paper, we aim to identify a biologically meaningful network of genes involved in SI and CS by using a novel variant of a pathway-based approach in which the grouping of genes is less restricted. Our method uses the growing knowledge of gene structure, biological function, and protein localization in the cell, along with established protein-protein interactions. In an initial discovery sample (n = 3497 subjects), a GWA approach was used in selecting genes with one or more SNPs that were associated with SI (ever smoked versus never smoked) or CS (current smoker versus never smoked or ex-smoker) at a liberal p value threshold of 5 × 10⁻³. The selected genes were then examined in three independent replication samples (Leiden study n = 405, Rotterdam study n = 5810, and GenomEUtwin project n = 1648). Genes with SNPs that were associated with SI or CS at a p value threshold of 5 × 10⁻³ were considered to be replicated. The proteins encoded by these replicated genes were visualized in a biologically meaningful network of functional groups, in which information from a manually curated expert database (Ingenuity Systems) is used to show cellular location and direct interactions between proteins. The most interesting groups of proteins thus identified include a group of glutamate receptors (e.g., GRIN2B, GRIN2A, GRIK2, GRM8), proteins involved in tyrosine kinase receptor signaling (e.g., NTRK2, GRB14), transporters (e.g., SLC1A2, SLC9A9), and cell-adhesion molecules (e.g., CDH23).
Material and Methods
Description of the Discovery Sample
The two parent projects that supplied data for the discovery sample are large-scale longitudinal studies: the Netherlands Study of Depression and Anxiety (NESDA)21 and the Netherlands Twin Registry (NTR).22 NESDA and NTR studies were approved by the Central Ethics Committee on Research Involving Human Subjects of the VU University Medical Center, Amsterdam (IRB number IRB-2991 under Federalwide Assurance 3703; IRB/institute codes, NESDA 03-183; NTR 03-180).
The sample consisted of 1777 participants from the NTR and 1763 participants from the NESDA. The mean age of the participants was 43.8 years (SD 13.4), and 65.7% of the sample was female. For participants of the NTR, longitudinal-survey data from seven waves of data collection (1991–2004) were used in determining whether a participant ever smoked. CS behavior was assessed when DNA samples were collected (2004–2007). For participants from NESDA, data on SI and CS were collected during a clinical interview between 2004 and 2007.21 Genome-wide analyses were carried out for two phenotypes: SI (ever smoked versus never smoked) and CS (current smokers versus nonsmokers). The nonsmokers group included both ex-smokers and never smokers.
Genotyping of the Discovery Sample
The genotypic data used in the discovery sample are part of one of the six initial Genetic Association Information Network (GAIN) studies sponsored by the Foundation for the National Institutes of Health (NIH).23 Sampling, data-collection characteristics, and genotype-cleaning procedures of the GAIN-major depressive disorder (MDD) study have been described in detail elsewhere.24,25 In short, individual genotyping was conducted by Perlegen Sciences (Mountain View, CA, USA) with the use of a set of four proprietary, high-density oligonucleotide arrays. The SNPs on these arrays were selected for tagging of common variation in the HapMap European and Asian panels. Of the 3820 Dutch samples sent to Perlegen, genotypes were delivered for 3761 samples (98.5%), of which 3540 subjects passed quality controls25 and were available in the final analysis data set including 1738 MDD cases and 1802 controls (96.9%).
Precautions against population stratification are detailed by Sullivan et al.25 In brief, we removed subjects with non-European descent on the basis of a principal-components analysis.25 A stratified Cochran-Mantel-Haenszel test was used as a complementary approach. The genomic inflation factors (lambda) for SI and CS in the final sample were close to 1 (1.008 and 1.009, respectively), suggesting that the observed associations are unlikely to be the result of population stratification.
The SNP quality-control process is described in detail in the Supplementary Methods of Sullivan et al.25 In brief, the unfiltered data set obtained from dbGaP, a database of genome-wide association studies, contained 599,156 unique SNPs. For inclusion in the final analysis data set, SNPs were required not to have any of the following features: gross mapping problem, ≥ 2 genotype disagreements in 40 duplicated samples, ≥ 2 Mendelian inheritance errors in 38 complete trio samples, minor allele frequency < 0.01, or > 0.05 missing genotypes in either cases or controls. A Hardy-Weinberg filter was not used, because a lack of fit to Hardy-Weinberg expectations can occur for valid reasons (e.g., a true association) and over 96% of SNPs not in Hardy-Weinberg equilibrium were removed by other filters. A total of 427,037 SNPs on chr1 to chr22 met these criteria and were included in the final association analyses with the smoking phenotypes.
Replication Samples
Replication was sought in full GWA data obtained in three independent replication samples. For all samples, the number of participants, the mean age, the percentage of female participants, the percentage of participants with the SI phenotype, and the percentage of participants with the CS phenotype are shown in Table 1. Data on SI and CS were available for all three replication samples. None of the replication-sample participants were selected on the basis of smoking behavior or psychiatric disorder.
Table 1.
Description of the Samples with Genome-wide Association Data and Smoking Phenotypes
| N Subjects | Mean Age (SD) | % Female | % Ever Smoked | % Current Smoker | |
|---|---|---|---|---|---|
| Discovery sample (The Netherlands) | 3497 | 43.8 (13.4) | 65 | 64.0 | 29.9 |
| GenomEUtwin (Europe and Australia) | 1648 | 48.0 (15.1) | 100 | 49.5 | 24.8 |
| Rotterdam (The Netherlands) | 5810 | 69.4 (9.1) | 59 | 63 | 23.0 |
| Leiden (The Netherlands) | 405 | 59.6 (7.2) | 57 | 72 | 13.3 |
Rotterdam Study
The Rotterdam Study is a prospective cohort study that started in 1990 in Ommoord, a suburb of Rotterdam, among 10,994 men and women aged 55 and over. The main objective of the Rotterdam Study is to investigate the prevalence, incidence, and risk factors for cardiovascular, neurological, locomotor, and ophthalmologic diseases in the elderly. Baseline measurements were obtained between 1990 and 1993. All participants were subsequently examined in follow-up examination rounds every 2–3 years. For this study, data from 6000 participants with GWA information were available.
Leiden Study
Families with at least two long-living siblings were included in the Leiden Longevity Study.26 The offspring of the long-living sib pairs and their partners were also enrolled. For this study, we used data from 405 (unrelated) partners.
GenomEUtwin Study
This is an unselected population-based cohort of twins from European countries and Australia.27 A subsample of twins for whom DNA samples and lipid data were available were genotyped for GWA studies. The subsample consisted of data from Finland (n = 142), Sweden (n = 302), Denmark (n = 142), Australia (n = 472), the United Kingdom (n = 341), and The Netherlands (n = 249). All subjects were monozygotic female twins. When phenotype data of both members of a twin pair were available, the subject was categorized as positive for CS or SI if at least one of the twins was a current smoker or initiated smoking.
The GenomEUtwin samples were genotyped with the Infinium II assay on the HumanHap300-Duo Genotyping BeadChips (Illumina, San Diego, CA, USA). The Rotterdam and Leiden samples were genotyped with the Affymetrix 500K SNP chip.
Statistical Power
Quanto28 was used for approximating statistical power for a log-additive genetic model with, the following parameter values for CS: two-tailed α = 1 × 10⁻⁷ (0.05 / 427,037), 1060 cases and 2458 controls, population risk of 0.25. For statistical power of 0.80 (β = 0.20), the minimum detectable genotypic relative risks are 1.67 / 1.44 / 1.39 for minor allele frequencies of 0.10 / 0.25 / 0.40. For SI, with 2272 cases and 1227 controls and a population risk of 0.50, the minimum detectable genotypic relative risks are 1.70 / 1.44 / 1.38 for the minor allele frequencies of 0.10 / 0.25 / 0.40. When α = 0.005, the minimum detectable genotypic relative risks are 1.36 / 1.25 / 1.22 for CS and 1.37 / 1.24 / 1.21 for SI.
The minimum detectable genotypic relative risk in the replication samples was estimated for two-tailed α = 5.36 × 10⁻⁵ (0.05 / 932) and a statistical power of 0.80 (β = 0.20). With the same minor allele frequencies of 0.10 / 0.25 / 0.40, the minimum detectable genotypic relative risks for SI are 1.79 / 1.49 / 1.43 for GenomEUtwin data, 1.38 / 1.25 / 1.21 for Rotterdam Study data, and 4.39 / 2.58 / 2.27 for Leiden Longevity Study data. For CS, the estimates are 1.87 / 1.57 / 1.50 for GenomEUtwin, 1.42 / 1.28 / 1.25 for Rotterdam, and 4.62 / 3.12 / 2.88 for Leiden. For α = 0.005, the minimum detectable genotypic relative risks for SI are 1.54 / 1.35 / 1.30 for GenomEUtwin, 1.27 / 1.18 / 1.16 for Rotterdam, and 2.84 / 1.99 / 1.83 for Leiden, and for CS, they are 1.61 / 1.40 / 1.36 for GenomEUtwin, 1.30 / 1.21 / 1.18 for Rotterdam, and 3.14 / 2.32 / 2.18 for Leiden.
Statistical Analyses, Software, and Bioinformatics
In the discovery sample, the GenomEUtwin sample, and the sample from the Leiden study, GWA was carried out in Plink29 with the use of a logistic-regression model with a dependent variable (ever smoked: yes/no; currently smoking: yes/no) and the covariates of age and sex (sex not used as a covariate for the GenomEUtwin sample, because the sample consisted of women only). For the Rotterdam sample, GWA was carried out through regressing smoking status on the estimated allele dosage with the use of a logistic model, with the covariates of age and sex, in ProbABEL,28 with data of measured and imputed SNPs data. Genetic imputations were performed with the use of the maximum-likelihood method, as implemented in the MACH software,30 with the HapMap release 22 CEU data used as the reference population.
Permutation tests on the gene level were performed by use of the –set-test option in Plink (–mperm 1000,–set-max 1,–set-p 0.01,–set-r2 = 0.5) in the discovery sample. It was not possible to include covariates in the permutation test. Some SNPs that reached the significance threshold in the GWA with covariates did not reach the significance threshold in the permutation test without covariates, and as a consequence, the empirical p value was not calculated for those genes.
SPSS and Haploview were used for data management, statistical analyses, and graphics. SNP annotations were created with the use of the ENSEMBL database.
Ingenuity Pathway Analysis (Ingenuity Systems, release IPA 6.0) was used for visualizing interactions between proteins (encoding the selected genes) in a network. The Ingenuity database contains a large amount of information about structure, biological function, and subcellular localization of the proteins, as well as information about direct protein-protein interactions. In the graphical representation, proteins are represented as nodes. Nodes are displayed as various shapes that represent the functional class of the gene product. Nodes were manually reorganized with the use of the “pathway designer” tool for the grouping of proteins with related structure or function. The biological relationship between two nodes is represented as a line (edge). All lines are supported by at least one reference from the literature, from a textbook, or from canonical information stored in the Ingenuity Pathways Knowledge Base.
Results
GWAS in Discovery Sample
The discovery sample consisted of 3497 Dutch subjects from the NTR or NESDA study.21,22 At the time of DNA sampling, 64% had ever smoked and 46% were current smokers. Descriptive data for the discovery sample and the replication samples are presented in Table 1.
In the discovery sample, GWA analyses were performed for 427,037 autosomal SNPs with the use of logistic regression adjusted for sex and age. Tables 2 and 3 show the top SNPs for SI and CS. SNP rs4423615 (located in GRB14) is associated with both SI and CS (p = 5.3 × 10⁻⁵ and p = 6.8 × 10⁻⁵, respectively). For SI, the smallest p value is 4.3 × 10⁻⁶ (rs10794595; chromosome 10). This SNP is not located in a gene and is not in linkage disequilibrium (LD) (>0.50) with any other SNP. For CS the smallest p value is 8.8x10⁻⁷ (rs6484176; chromosome 11). This SNP is also not located in a gene but is in LD (>0.50) with two other SNPs that both show a significant association with CS (rs1532289, p = 3.6 × 10⁻⁶ and rs10219359, p = 5.7 × 10⁻⁴).
Table 2.
Associations with p ≤ 0.0001 in Genome-wide Analyses for Smoking Initiation in the Discovery Sample
| Index SNPs with p Value < 0.0001 | SNPs in LD with Index SNP | Corresponding Genes | ||||||||||||||
|---|---|---|---|---|---|---|---|---|---|---|---|---|---|---|---|---|
| Chr | Index SNP | BP | P | OR | Minor Allele | N_ LD | NS | 01a | 05b | 001c | 0001d | LD with Index SNP & p < 0.0001 | Gene Symbol | Typee | N_ SNPs | Location of Index SNP |
| 2 | rs4608580 | 98319575 | 7.905e-5 | 0.817 | C | 4 | 0 | 0 | 1 | 3 | 0 | VWA3B | O | 1 | Intronic | |
| 2 | rs10865016 | 98447822 | 9.671e-6 | 1.356 | A | 1 | 0 | 0 | 0 | 1 | 0 | CNGA3 | IC | 11 | Intronic | |
| 2 | rs787151 | 144489568 | 2.745e-5 | 1.304 | A | 2 | 0 | 0 | 1 | 1 | 0 | |||||
| 2 | rs4423615 | 165263737 | 5.290e-5 | 0.815 | G | 1 | 0 | 0 | 1 | 0 | 0 | GRB14 | O | 18 | Intronic | |
| 3 | rs1599903 | 39930070 | 5.423e-5 | 1.238 | C | 5 | 0 | 0 | 2 | 3 | 0 | MYRIP | O | 60 | Intronic | |
| 3 | rs9824246 | 73185415 | 9.951e-5 | 1.778 | G | 0 | 0 | 0 | 0 | 0 | 0 | PPP4R2 | O | 7 | Intronic | |
| 3 | rs16860281 | 149478045 | 7.340e-6 | 0.672 | C | 1 | 0 | 0 | 0 | 1 | 0 | |||||
| 4 | rs7692181 | 64329760 | 7.625e-5 | 1.238 | T | 0 | 0 | 0 | 0 | 0 | 0 | |||||
| 6 | rs2395670 | 37190787 | 3.698e-5 | 1.257 | A | 1 | 0 | 0 | 0 | 1 | 0 | FGD2 | O | 12 | Intronic | |
| 6 | rs9321013 | 125372620 | 4.946e-5 | 1.205 | A | 1 | 0 | 0 | 1 | 0 | 0 | RNF217 | E | 1 | Intronic | |
| 7 | rs7805247 | 2883300 | 5.680e-5 | 0.763 | C | 1 | 0 | 0 | 1 | 0 | 0 | |||||
| 7 | rs6960379 | 63194667 | 6.579e-5 | 0.650 | C | 1 | 0 | 0 | 0 | 0 | 1 | rs611097 | ||||
| 7 | rs2237781 | 126269001 | 4.017e-5 | 1.608 | A | 1 | 0 | 0 | 0 | 1 | 0 | GRM8 | GR | 121 | Intronic | |
| 7 | rs4725563 | 139107440 | 2.798e-5 | 0.777 | C | 2 | 0 | 0 | 1 | 1 | 0 | TBXAS1 | E | 38 | Intronic | |
| 8 | rs4509385 | 10217606 | 8.009e-5 | 0.818 | A | 1 | 0 | 0 | 0 | 1 | 0 | MSRA | O | 144 | Intronic | |
| 8 | rs6997956 | 136553572 | 8.479e-6 | 1.257 | A | 1 | 0 | 0 | 0 | 1 | 0 | KHDRBS3 | O | 13 | Intronic | |
| 9 | rs10121807 | 82366438 | 9.379e-5 | 0.729 | G | 0 | 0 | 0 | 0 | 0 | 0 | |||||
| 9 | rs10115383 | 100450087 | 7.691e-5 | 1.256 | A | 1 | 0 | 0 | 0 | 1 | 0 | |||||
| 10 | rs10999845 | 72910367 | 5.807e-5 | 1.320 | G | 1 | 0 | 0 | 0 | 1 | 0 | CDH23 | T | 77 | Intronic | |
| 10 | rs3949478 | 97463204 | 3.203e-5 | 0.773 | A | 1 | 0 | 0 | 0 | 1 | 0 | ENTPD1 | O | 10 | Intronic | |
| 10 | rs1856801 | 112382152 | 3.787e-5 | 1.414 | T | 0 | 0 | 0 | 0 | 0 | 0 | |||||
| 10 | rs7082195 | 112417439 | 4.374e-5 | 1.345 | T | 2 | 0 | 1 | 0 | 1 | 0 | RBM20 | O | 1 | Intronic | |
| 10 | rs10794595 | 124871492 | 4.333e-6 | 0.786 | T | 0 | 0 | 0 | 0 | 0 | 0 | |||||
| 11 | rs17477949 | 12175779 | 3.733e-5 | 1.239 | T | 4 | 0 | 2 | 1 | 1 | 0 | MICAL2 | O | 91 | Intronic | |
| 11 | rs12797615 | 85944331 | 4.278e-5 | 1.255 | C | 1 | 0 | 0 | 0 | 1 | 0 | ME3 | E | 61 | Intronic | |
| 11 | rs737383 | 92304523 | 9.648e-5 | 0.818 | C | 0 | 0 | 0 | 0 | 0 | 0 | |||||
| 11 | rs4379857 | 132688814 | 9.737e-5 | 0.645 | A | 0 | 0 | 0 | 0 | 0 | 0 | OPCML | TM | 345 | Intronic | |
| 12 | rs7313149 | 13719554 | 6.733e-5 | 0.779 | C | 1 | 0 | 0 | 0 | 0 | 1 | rs2192972 | GRIN2B | IC | 147 | Intronic |
| 12 | rs4759802 | 129932057 | 7.443e-5 | 0.734 | A | 0 | 0 | 0 | 0 | 0 | 0 | |||||
| 13 | rs327127 | 28416900 | 2.283e-5 | 0.623 | C | 0 | 0 | 0 | 0 | 0 | 0 | |||||
| 13 | rs17295389 | 81213800 | 6.500e-5 | 0.738 | A | 3 | 0 | 0 | 1 | 2 | 0 | |||||
| 14 | rs8009082 | 50569094 | 5.011e-5 | 0.794 | A | 6 | 0 | 0 | 2 | 2 | 2 | rs8005389, rs11157796 | TRIM9 | O | 64 | Intronic |
| 14 | rs17252296 | 50650671 | 8.594e-5 | 0.796 | C | 2 | 0 | 0 | 1 | 1 | 0 | |||||
| 14 | rs8019291 | 92000917 | 8.087e-6 | 0.709 | T | 1 | 0 | 0 | 0 | 0 | 1 | rs7154288 | SLC24A4 | T | 49 | Intronic |
| 14 | rs999986 | 94873609 | 7.324e-5 | 0.804 | A | 0 | 0 | 0 | 0 | 0 | 0 | |||||
| 15 | rs4774925 | 55391694 | 9.852e-5 | 1.237 | T | 1 | 0 | 0 | 1 | 0 | 0 | |||||
| 16 | rs12920919 | 9845481 | 1.000e-4 | 0.809 | C | 9 | 4 | 0 | 5 | 0 | 0 | |||||
| 18 | rs17739703 | 28777286 | 6.690e-5 | 1.473 | C | 0 | 0 | 0 | 0 | 0 | 0 | C18orf34 | O | 17 | Intronic | |
| 20 | rs283277 | 52970231 | 1.582e-5 | 1.315 | A | 9 | 0 | 0 | 6 | 3 | 0 | |||||
| 21 | rs928302 | 42683153 | 1.230e-5 | 0.659 | T | 1 | 0 | 0 | 0 | 1 | 0 | TMPRSS3 | P | 16 | Coding | |
| 22 | rs16982400 | 16272098 | 4.057e-5 | 1.355 | C | 0 | 0 | 0 | 0 | 0 | 0 |
Table 3.
Associations with p ≤ 0.0001 in Genome-wide Analyses for Current Smoking in the Discovery Sample
| Chr | Index SNP | BP | P | OR | Minor Allele | N_LD | NS | 01a | 05b | 001c | 0001d | LD with Index SNP & p < 0.0001 | Gene Symbol | Typee | N_SNP | Location Index SNP |
|---|---|---|---|---|---|---|---|---|---|---|---|---|---|---|---|---|
| 1 | rs1109374 | 65345518 | 7.972e-5 | 1.276 | C | 4 | 0 | 0 | 3 | 1 | 0 | AK3L2 | O | 12 | Intronic | |
| 1 | rs12126638 | 212564091 | 9.556 e-5 | 1.277 | C | 4 | 0 | 1 | 1 | 2 | 0 | USH2A | O | 155 | Intronic | |
| 1 | rs9424490 | 229328605 | 3.618 e-5 | 1.715 | G | 1 | 0 | 0 | 0 | 1 | 0 | |||||
| 1 | rs6661946 | 233049149 | 4.108 e-6 | 2.120 | T | 2 | 0 | 0 | 0 | 2 | 0 | HEATR1 | O | 12 | Coding | |
| 2 | rs6709476 | 85355582 | 5.569 e-5 | 1.420 | A | 0 | 0 | 0 | 0 | 0 | 0 | TCF7L1 | TR | 43 | Intronic | |
| 2 | rs13400652 | 123112107 | 5.724 e-5 | 0.836 | T | 0 | 0 | 0 | 0 | 0 | 0 | |||||
| 2 | rs4423615 | 165263737 | 6.777 e-5 | 0.811 | G | 1 | 1 | 0 | 0 | 0 | 0 | GRB14 | O | 18 | Intronic | |
| 2 | rs17355446 | 179414747 | 1.381 e-5 | 2.120 | A | 1 | 0 | 0 | 0 | 1 | 0 | TTN | P | 11 | Coding | |
| 2 | rs1549738 | 217944228 | 4.878 e-5 | 1.378 | G | 0 | 0 | 0 | 0 | 0 | 0 | |||||
| 4 | rs4833652 | 121832177 | 3.412 e-5 | 1.265 | G | 1 | 0 | 0 | 0 | 1 | 0 | |||||
| 4 | rs2404646 | 136443886 | 6.478 e-6 | 0.546 | G | 0 | 0 | 0 | 0 | 0 | 0 | |||||
| 5 | rs906071 | 10162385 | 9.375 e-5 | 1.255 | C | 1 | 0 | 0 | 1 | 0 | 0 | |||||
| 5 | rs17284420 | 82748776 | 1.0e-4 | 1.400 | C | 0 | 0 | 0 | 0 | 0 | 0 | |||||
| 5 | rs2964911 | 163656859 | 6.573 e-5 | 0.752 | G | 2 | 0 | 0 | 2 | 0 | 0 | |||||
| 6 | rs6570989 | 102064106 | 7.734 e-5 | 0.736 | A | 0 | 0 | 0 | 0 | 0 | 0 | GRIK2 | IO | 114 | Intronic | |
| 7 | rs29684 | 41627892 | 8.741 e-5 | 1.046 | C | 4 | 0 | 0 | 4 | 0 | 0 | rs17706620 | ||||
| 7 | rs6972429 | 41668082 | 8.319 e-5 | 1.246 | C | 6 | 0 | 0 | 3 | 2 | 1 | rs12113526 | ||||
| 7 | rs6463462 | 47915434 | 7.957 e-5 | 0.810 | G | 5 | 0 | 0 | 0 | 5 | 0 | UPP1 | E | 3 | Intronic | |
| 8 | rs2930357 | 3697068 | 2.082 e-5 | 0.766 | C | 1 | 0 | 0 | 1 | 0 | 0 | |||||
| 9 | rs4741746 | 2608969 | 2.984e-6 | 1.432 | C | 2 | 0 | 0 | 0 | 0 | 2 | VLDLR | T | 9 | 5′ upstr | |
| 9 | rs10868236 | 84738250 | 9.642 e-5 | 0.748 | G | 1 | 0 | 0 | 1 | 0 | 0 | NTRK2 | K | 70 | Intronic | |
| 11 | rs4758405 | 6281210 | 8.407e-6 | 1.266 | A | 0 | 0 | 0 | 0 | 0 | 0 | |||||
| 11 | rs10834489 | 24794377 | 2.5 e-5 | 0.798 | T | 1 | 0 | 1 | 0 | 0 | 0 | LUZP2 | 139 | Intronic | ||
| 11 | rs6484176 | 25744207 | 8.835e-7 | 1.355 | C | 2 | 0 | 0 | 0 | 1 | 1 | rs1532289 | ||||
| 12 | rs4141130 | 1967977 | 1.51 e-5 | 0.785 | C | 0 | 0 | 0 | 0 | 0 | 0 | DCP1B | O | 8 | Intronic | |
| 12 | rs983579 | 33036065 | 1.347 e-5 | 1.452 | A | 1 | 0 | 0 | 0 | 0 | 1 | rs1113053 | ||||
| 12 | rs11109504 | 77258379 | 2.891 e-5 | 1.251 | A | 3 | 0 | 0 | 0 | 3 | 0 | |||||
| 12 | rs12302525 | 88228893 | 4.099 e-5 | 1.478 | G | 1 | 0 | 0 | 0 | 1 | 0 | |||||
| 12 | rs1036360 | 92955797 | 7.322e-6 | 0.766 | G | 0 | 0 | 0 | 0 | 0 | 0 | |||||
| 13 | rs263930 | 21136662 | 4.333 e-5 | 1.255 | G | 1 | 0 | 0 | 1 | 0 | 0 | |||||
| 13 | rs12874278 | 49833923 | 5.649 e-5 | 1.504 | T | 4 | 0 | 0 | 1 | 2 | 1 | rs12864797 | ||||
| 13 | rs17371334 | 83930328 | 4.308 e-5 | 1.254 | G | 1 | 0 | 0 | 0 | 1 | 0 | |||||
| 13 | rs9554711 | 100074885 | 5.654 e-5 | 0.791 | G | 4 | 0 | 1 | 1 | 2 | 0 | TMTC4 | O | 14 | Intronic | |
| 13 | rs2052383 | 104997529 | 3.853 e-5 | 0.747 | G | 0 | 0 | 0 | 0 | 0 | 0 | |||||
| 15 | rs3764213 | 20579108 | 9.313 e-5 | 0.741 | G | 1 | 0 | 1 | 0 | 0 | 0 | NIPA2 | O | 5 | Intronic | |
| 15 | rs7173321 | 48709892 | 3.244 e-5 | 1.428 | G | 6 | 1 | 0 | 0 | 2 | 3 | rs8042919, rs12899074, rs12898588 (PSL2) | TRPM7 | K | 12 | Intronic |
| 15 | rs11636705 | 94406916 | 5.391 e-5 | 0.758 | T | 1 | 0 | 0 | 1 | 0 | 0 | |||||
| 16 | rs2911292 | 61138447 | 2.337 e-5 | 1.260 | T | 1 | 0 | 0 | 0 | 1 | 0 | |||||
| 17 | rs8082305 | 27130700 | 7.773 e-5 | 1.325 | A | 3 | 0 | 0 | 1 | 2 | 0 | |||||
| 18 | rs17665021 | 23476209 | 6.111 e-5 | 0.597 | G | 0 | 0 | 0 | 0 | 0 | 0 | |||||
| 18 | rs16944011 | 23546361 | 9.742 e-5 | 0.664 | G | 1 | 0 | 0 | 0 | 0 | 1 | rs12606601 | ||||
| 18 | rs11082277 | 38304361 | 8.365 e-5 | 1.212 | G | 0 | 0 | 0 | 0 | 0 | 0 | |||||
| 19 | rs186715 | 6829136 | 2.503 e-5 | 0.797 | G | 0 | 0 | 0 | 0 | 0 | 0 | |||||
| 22 | rs6007413 | 43750853 | 4.804 e-5 | 0.728 | G | 2 | 0 | 1 | 0 | 0 | 1 | rs10483226 | ||||
| 22 | rs16999684 | 47388171 | 3.129 e-5 | 0.766 | C | 2 | 0 | 0 | 0 | 1 | 1 | rs5771932 | FAM19A5 | 69 | Intronic | |
| 22 | rs5771934 | 47390743 | 9.028 e-5 | 1.278 | T | 0 | 0 | 0 | 0 | 0 | 0 |
The column N_LD in Tables 2 and 3 shows the number of SNPs that are in LD with the significant index SNP. Several clusters of SNPs with low p values (within a physical distance of 250 kb from the index SNP) are found. For example, rs8009082 is associated with SI (p = 5 × 10⁻⁵) and is in LD with six other SNPs with p values < 0.05 for SI (see Table 2). All SNPs are located in the TRIM9 gene (intronic). Another example shows two SNP clusters on chromosome 7, associated with CS: rs6972429 (41,668,0820 bp, p = 8.3 × 10⁻⁵) is in LD with six other SNP (all p values < 0.05 with CS), and a nearby SNP, rs29684 (41,627,892, p = 8.7 × 10⁻⁵), is in LD with four other SNPs (all p values < 0.05 with CS; see Table 3).
The maximum effect size for the top SNPs is an odds ratio of 1.78 for rs9824246 for SI and 2.12 for rs6661946 and rs2404646 for CS. Given the high heritability of SI and CS, these effect sizes are consistent with multiple genes of modest effect contributing to smoking behavior.
Selection of Genes for Network Analysis
First, we selected all SNPs with p values < 0.005 in the discovery sample. In total, 4213 SNPs passed this filter; 1931 for SI, 2065 for CS, and 217 for both phenotypes. For SI and CS, 1195 and 1325 SNPs, respectively, were not located within a gene. The remaining SNPs were located in 1041 different genes. When predicted or uncharacterized genes (like C10orf11, NP_001018001.1, etc.) were deleted from the set, 932 genes were left: 386 genes for SI, 407 for CS, and 139 associated with both phenotypes.
Examination of these genes in the replication samples showed that almost half (48%) had one or more SNPs with p values < 0.005 in one or more of the replication samples.
We selected genes that were replicated at least twice in the replication samples (n = 193) or were replicated only once but had a structurally related family member (GO classification) that was replicated at least twice (n = 108) (see Supplemental Data, available online). The entire gene-selection procedure, from discovery set to the final set of genes for the network analysis, is shown in Figure 1.
Figure 1.

Selection Procedure for Connectivity Diagram Shown in Figure 2
The final set of selected genes (n = 302) was entered into the Ingenuity database (release IPA 6.0), and a connectivity diagram was built on the basis of direct interactions only (Figure 2). Genes were then grouped, through the “pathway designer” function, on the basis of related protein structure and/or function.
Figure 2.
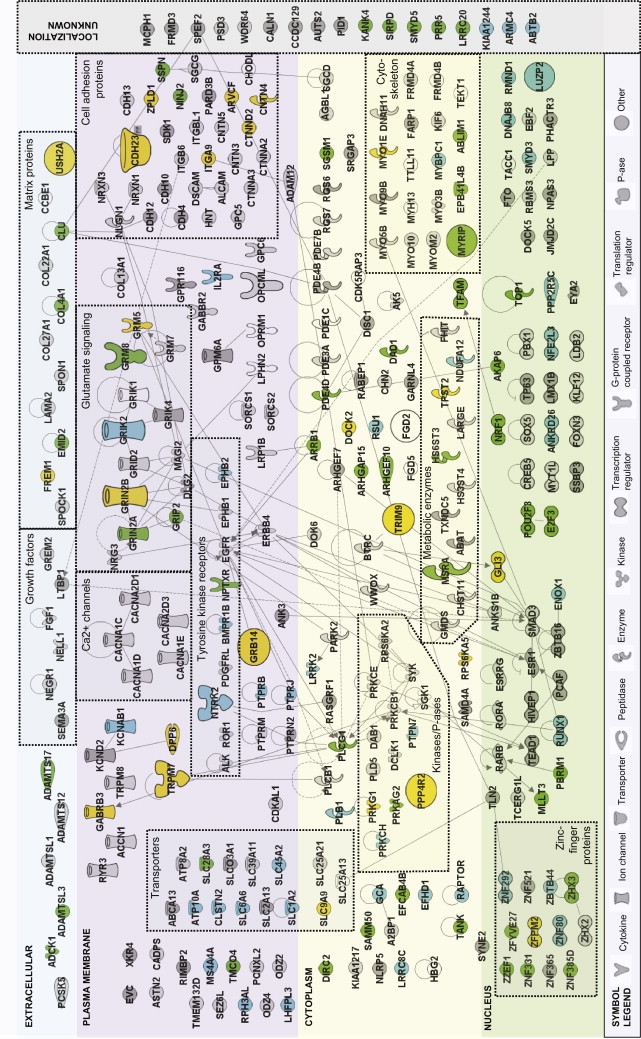
Overview of the Selected Genes and Their Subcellular Localization, Function, and Interactions
Genes were selected according to the procedure depicted in Figure 1. Ingenuity pathway analysis was used for visualizing interactions between proteins (encoded by the selected genes) in a network graph. The Ingenuity database contains a large amount of information about structure, biological function, and subcellular localization of the proteins, as well as direct protein-protein interactions. The proteins encoding the selected genes are represented as nodes. Nodes are displayed in various shapes that represent the functional class of the gene product (see symbol legend at bottom side of figure). The location of the nodes is based on the subcellular location of the gene products: extracellular, plasma membrane, cytoplasme, nucleus, or unkown localization.
Small symbols indicate genes with lowest SNP 0.005 < p value > 0.0001 in the discovery sample; large symbols indicate genes with p value < 0.0001. Depicted in green are the genes for SI; in blue are those for CS; in orange are those that are associated with both SI and CS. The light-gray-colored genes had empirical p values > 0.10, and for the dark gray symbols, 0.05 < empirical p < 0.10. The lines between symbols indicate direct connectivity between nodes, such as protein-protein interaction and/or functional regulatory relationships.
Nodes were manually reorganized with the “pathway designer” for grouping the proteins with related structure or function. Groups of genes belonging to the same functional class are enveloped with dotted lines. Of particular interest are groups of genes such as those encoding glutamate receptors, tyrosine kinase receptors, transporters, or cell-adhesion molecules (see text).
Permutation Test
Larger genes might contain more SNPs and therefore be more likely to be selected because of a significant p value.20 To adjust for gene size, we carried out permutation tests at the gene level (for the 316 selected genes), using the permutation approach implemented in Plink.29 The Supplemental Data includes the empirical p values based on the discovery sample (for some genes, the empirical p value could not be calculated; see Material and Methods). We retained all originally selected 302 genes in the connectivity diagram (Figure 2), but grayscaled the genes that had empirical p values above 0.05 when gene size was taken into account.
Groups of Genes Associated with Smoking Initiation and Current Smoking
Genes whose proteins have similar biological function have been grouped (see dotted boxes in Figure 2). In total, 12 genes involved in glutamate signaling had replicated GWAS results, including three metabotropic glutamate receptors and six ionotropic glutamate receptors. Those nine glutamate receptor genes were each replicated between one and four times in the replication samples, and several genes were also associated with smoking or addiction vulnerability in the literature. GRIN2B (MIM 138252), GRIK2 (MIM 138244), and GRM8 (MIM 601116), showed p values < 10−4 (Tables 2 and 3) in the discovery sample.
For the genes involved in tyrosine kinase signaling, NTRK2 (MIM 600456) and GRB14 (MIM 601524) show the most significant associations with smoking behavior. NTRK2 is associated with CS in the discovery sample (p = 9.6 × 10⁻⁵) and in the Rotterdam sample (p = 1.3 × 10⁻³). GRB14 shows a noteworthy association for both SI (p = 5.2 × 10⁻⁵) and CS (p = 6.7 × 10⁻⁵) in the discovery sample. It is replicated once in the Rotterdam sample (p = 4.4 × 10⁻³ for SI).
The next interesting group is that of the transporter genes. Seven transporter genes passed the permutation test (see colored symbols in Figure 2). The most significant finding within this group is found for SLC9A9 (MIM 608396), which shows an association with SI (in discovery sample, p = 6.1 × 10⁻⁴, and in all three replication samples, p < 0.005) and with CS (in discovery sample, p = 1.2 × 10⁻⁴, and in the Rotterdam sample, p = 7.5 × 10⁻⁴). Another gene worthy of note in this group is SLC1A2 (MIM 600300), a glutamate transporter, which is associated with CS (in discovery sample, p = 3.0 × 10⁻³, and in Rotterdam sample, p = 3.6 × 10⁻³).
Another noticeable group of genes is formed by the genes for the cell-adhesion molecules. The most significant finding within this group of genes is CDH23 (MIM 605516) (p = 5.8 × 10⁻⁵ for SI in the discovery sample and 3.2 × 10⁻³ for SI in the Rotterdam sample). Most other genes in this group are grayscaled, indicating that they did not pass the permutation test.
A small group is formed by two genes involved in the opioid system: OPRM1 (MIM 600018) and OPCML (MIM 600632). The most significant findings were the associations between OPCML and SI (p = 9.7 × 10⁻⁵ in the discovery sample, p = 1.9 × 10⁻³ in the Rotterdam sample, p = 4.1 × 10⁻³ in the GenomEutwin sample) and OPCML and CS (p = 1.3 × 10⁻³ in the discovery sample, p = 1.1 × 10⁻³ in the Rotterdam sample, p = 2.9 × 10⁻³ in the GenomEutwin sample).
Discussion
Although smoking is often regarded as an environmental “lifestyle” trait, behavioral-genetics studies provide strong evidence that genetic factors contribute substantially to interindividual variation in all dimensions of smoking behavior.
For detection of these genetic factors, several linkage analyses8 and association studies9,10 and, recently, some GWAS13–19 were carried out. These previous GWAS have only listed the 20–50 most significant SNPs or genes, while paying little attention to the remainder of the genes that might contribute to the trait.20 The approach used here builds upon this classic approach by first selecting genes of interest, on the basis of an (albeit liberal) significance threshold for SNPs within genes in the discovery sample, then testing these for replication of the same or other SNPs in these genes in novel samples. To the selected genes, each of which might make only very small contributions to smoking behavior, we then applied a network-based approach that grouped these genes by the biological functions, cellular locations, and possible interactions of their encoded proteins. All of this information has been gathered from multiple bioinformatics databases and from literature and placed into the Ingenuity database. This approach offers additional insights at the level of biological interpretation, insights that would have been missed by the typical SNP-by-SNP annotation of the top 10 or 20 SNPs. Our approach differs from most of the current network-based approaches (pathway analyses) that detect whether genes predefined to belong in a certain pathway are present more often than expected by chance. Although this can give insight into the role of these pathways in the phenotype, the disadvantage is that genes that are not listed a priori in a certain pathway are excluded and therefore missed. Pathway analysis has been developed as a generic tool, implying that protein functions in a specific cellular context, for instance in neurons, are largely absent. The current approach is not limited to genes that are predefined as part of a certain pathway; instead, it uses all available information about resemblance in structure, biological function, subcellular localization, and direct interactions of the encoded proteins of the selected genes. The resulting connectivity diagram showed several noteworthy groups of genes belonging to the same functional class (see dotted boxes in Figure 2), and these are described in more detail below.
Glutamate Signaling
Figure 2 shows several genes involved in glutamate signaling, whereby GRIN2B, GRIN2A, GRIK2 and GRM8 show the most significant and/or consistent associations. Both GRIN2A and GRIN2B genes code for a subunit of the NMDA receptor (a subgroup of the ionotropic glutamate receptors). GRIN2B has not been detected yet in human studies but its expression is associated with nicotine use in rats. Levels of GRIN2B were significantly increased in rat brains after chronic nicotine self-administration.31 GRIN2A was detected in a recent GWAS of smoking cessation.15 GRIK2 belongs to the kainate receptors (another subgroup of ionotropic glutamate receptors) and was also identified in a GWA for smoking cessation.15 The metabotropic receptor GRM8 has not been associated with smoking behavior or addiction vulnerability in previous studies although the family member GRM7 was found both in GWAS for nicotine dependence14 and addiction vulnerability19 as well as in the present study. These findings suggest that glutamate signaling might play an important role in smoking behavior. Glutamatergic neurotransmission is involved in most aspects of normal brain function and is affected in many neuropathologic conditions, including addiction.32
Tyrosine Kinase Signaling
Results of the present study contain several genes involved in tyrosine kinase signaling, including a strong association for NTRK2, the receptor for brain-derived neurotrophic factor (BDNF). The NTRK2 gene is located in a region on chromosome 9 that showed suggestive linkage to smoking behavior in four independent studies.8 In addition, a family-based association analysis showed an association with nicotine dependence in two samples.33 NTRK2 is also significantly regulated by nicotine at both mRNA and protein levels in various brain regions in rats.34 Tyrosine kinases regulate various cellular processes—for instance, nicotinic acetylcholine receptors, which are directly involved in the rewarding effects of smoking.35 A remarkable finding within this group is the GRB14 gene (MIM 601524). The product of this gene belongs to a small family of adaptor proteins that are known to interact with a number of receptor tyrosine kinases and signaling molecules. The protein probably has an inhibitory effect on receptor tyrosine kinase signaling and on insulin receptor signaling. This gene might play a role in signaling pathways that regulate growth and metabolism and has not been associated with smoking or addiction vulnerability in previous studies.
Transporters
Previous research suggested that the serotonin transporter (SLC6A4) and the dopamine transporter (SLC6A3) play an important role in smoking behavior.36 The current study did not detect those two transporters but found associations between smoking and several other transporter genes (see dotted box in Figure 2). In particular, SLC1A2, a high-affinity glutamate transporter, is of interest. The SLC1A2 gene codes for a membrane-bound protein that is the principal transporter that clears glutamate from the extracellular synaptic space in the central nervous system, and as such, it fits into the glutamate signaling that seems to play an important role in smoking behavior, as described above. The gene was associated with CS, not with SI (both in the discovery sample and in the Rotterdam sample). The gene was also associated with successful smoking cessation in a previous GWA study.15 The most significant transporter gene, SLC9A9, encoding a sodium and hydrogen exchanger, was not found in previous studies including smoking phenotypes or addiction vulnerability but this gene had the strongest overall association in a GWAS for ADHD.37 Inattention is a predictor of SI independent of parental smoking.38 A recent family study showed a cosegregation of smoking and ADHD, suggesting that the two disorders are cotransmitted through families more often than expected by chance,39 which means that it is possible that common genes influence both traits.
Cell-Adhesion Proteins
Nine of the cell-adhesion genes in the dotted box in Figure 2 were associated at least once with smoking or addiction vulnerability in previous studies: CDH13, CNTN4, CNTN5, CTNNA2, CTNNA3, CTNND2, DSCAM, NRXN1, and NRXN3.13–15,18,19,40 Axon-associated cell-adhesion molecules of the immunoglobulin (Ig) superfamily play important roles in the formation, maintenance, and plasticity of functional neuronal networks. CNTN4 and CNTN5 are members of the contactin subgroup of these molecules. The activity of cadherins, which mediate homophilic cell-cell Ca(2+)-dependent association, depends on their anchorage to the cytoskeleton via proteins termed catenins, of which CTNNA2, CTNNA3, CTNND2 are representatives. Alpha-neurexins NRXN1 and NRXN3 organize presynaptic terminals by functionally coupling calcium channels to the presynaptic machinery. We also identified these calcium channels (see dotted box in Figure 2), but they were not significant in our analyses after permutation analysis.
Most of those cell-adhesion molecules are large and therefore might have a higher chance of being a false positive. This was dealt with rather well by the permutation tests, and most genes in this group are grayscaled in the graphical depiction of the gene networks in Figure 2, indicating that they did not pass the permutation test. However, a remaining significant result within this group of genes was found for CDH23. SNPs within this gene also showed strong associations with extraversion,41 a strong correlate of smoking.
Opioid System
In the discovery sample, the only gene that had a p value smaller than 10−4 and did not pass the permutation test is OPCML, which encodes an opioid-binding protein. It showed an association with SI and CS both in the discovery sample and in four of the six replication studies, but the empirical p value was 0.10. The gene is large: there were 345 measured SNPs in the discovery set. The encoded protein (NCBI) is localized in the plasma membrane and might have an accessory role in opioid receptor function. In addition, OPRM1 is associated with SI (both in the discovery sample and in the Rotterdam sample) and was associated with nicotine reinforcement in a candidate-gene study.42 Several lines of evidence, from both animal studies and studies in humans, suggest interactions between the nicotinic and opioid receptor systems, particularly in the context of nicotine addiction.43 Although this indicates that OPCML is a likely candidate for smoking behavior or addiction vulnerability, because of the empirical p value in the present study, we must be cautious with this conclusion.
Known Candidate Genes for Smoking Behavior
In the past, a variety of plausible candidate genes have been examined for associations with smoking behavior. The vast majority of these studies have focused on variation in genes from apparently relevant neurotransmitter pathways, in particular dopamine and nicotinic acetylcholine receptor genes. Previous GWA studies reported associations between SNPs in the _CHRNA3_-_A5_-B4 complex16,17 or in CHRNB3 genes13 and smoking behavior. Several candidate-gene studies reported SNPs in the _CHRNA3_-_A5_-B4 complex to be associated with smoking behavior and smoking-related disease.44,45 These results suggest that nicotinic acetylcholine receptor genes might play an important role once smoking is initiated, but we could not confirm this in the present study. Evidence for a role of genetic variation in dopaminergic neurotransmission in smoking behavior is surprisingly absent. Dopaminergic genes did not dominate the top signals in either the recent GWAs for smoking behavior or the present study. Animal studies have shown that besides the mesocorticolimbic dopaminergic system, many other neurochemical systems are involved in nicotine reinforcement by interacting with the midbrain dopamine system. These systems include the glutamergic, GABA-ergic, and opioid systems.46 The present study shows a noteworthy association between smoking and genes involved in glutamate signaling. This indicates that the role of the glutamate-signaling pathway has been unjustly neglected in favor of the dopaminergic-signaling pathway and deserves more attention in future genetic research on smoking behavior.
Related Psychiatric Traits
Several psychiatric disorders, such as schizophrenia, ADHD, autism, and substance abuse, are correlated with smoking behavior, and smoking has a tentative role as self-medication in these subjects. A number of the genes that were identified in the present study as associated with smoking behavior are also involved in those disorders. Glutamate genes, including GRIN2A, GRIN2B, and GRM8, have been associated with schizophrenia, ADHD, autism, alcohol use, and heroin addiction.47–51 NTRK2 was associated with ADHD,52 and MSRA, coding for a metabolic enzyme, was recently suggested as a novel schizophrenia gene.53 These overlapping results indicate that part of the genes influencing smoking behavior reflect the genetic susceptibility to these psychiatric disorders.
Limitations of the Study
Our network analysis provides only one possible view of complex genetic determinants of disease vulnerability. The approach used here was, by definition, entirely gene-centric. This ignores the information in the significant SNPs or SNP clusters that were not located in a gene. Yet, many of these SNPs could prove to be relevant with increased understanding of the functional role of intergenic regions. The SNP with the lowest p value (rs6484176, p = 8.8 × 10⁻⁷ for CS), for instance, is located at a distance of around 570 kb from TMEM16C. BDNF, which has been associated with smoking behavior in previous studies,54,55 is located around 1900 kb from this SNP. Seven linkage studies have reported a peak, ranging between 2.1 cM and 76.1 cM, on chromosome 11,8 and in the present study, four different SNPs with p values smaller than 1 × 10⁻⁴ are detected in this region (6,281,210–25,744,207 bp). Another example is the SNP cluster on chromosome 7 (see Results section); the cluster is not located in a gene, but a linkage study of smoking quantity detected a peak in the same region (57.8–69.6 cM). These examples suggest that intergenic regions that are not picked up by the pathway-analysis approach, such as the ones on chromosomes 7 and 11, might still play an important role in smoking behavior.
A second limitation is that the discovery sample was originally selected for a case-control study of major depression, a trait that is correlated with smoking behavior. The association between smoking and depression could arise in part from genetic factors that predispose one to both smoking and depression.56 The replication samples and the existing literature did not have this selection on depression or on other psychiatric disorders. Therefore, the significant genes identified and discussed in the present study are primarily involved in smoking behavior, although we cannot exclude additional involvement in depression.
Conclusions
The present study provides evidence that genes influencing smoking behavior tend to code for proteins that have similar biological functions. Of particular interest were the proteins involved in glutamate signaling (e.g.. GRIN2B, GRIK2, GRM8, SLC1A2), transporters (e.g., SLC9A9), proteins involved in tyrosine kinase receptor signaling (e.g., NTRK2, GRB14), and cell-adhesion proteins (e.g., CDH23). We conclude that a network-based GWA approach is useful for identifying genes influencing smoking behavior and that this approach could be useful for other phenotypes, as well.
Supplemental Data
Supplemental Data include one table and are available with this article online at http://www.ajhg.org/.
Supplemental Data
Table S1. Minimal p Values for All 302 Genes in the Discovery Sample that Contained At Least One SNP with p < 0.005
Web Resources
The URLs for data presented herein are as follows:
- dbGaP, http://www.ncbi.nlm.nih.gov/sites/entrez?db=gap
- ENSEMBL database, www.ensembl.org
- Genetic Cluster Computer, www.geneticcluster.org
- GenomEUtwin study, www.genomeutwin.org
- Ingenuity, www.ingenuity.com
- NCBI, www.ncbi.nlm.nih.gov
- Netherlands Twin Registry (NTR), www.tweelingenregister.org
- Online Mendelian Inheritance in Man (OMIM), www.ncbi.nlm.nih.gov/Omim/
- World Health Organization tobacco information and statistics, www.wpro.who.int/health_topics/tobacco
Acknowledgments
We acknowledge support from The Netherlands Organization for Scientific Research (NWO) and The Netherlands Organization for Health Research and Development (ZonMW) (funding numbers 904-61-090, 904-61-193, 480-04-004, 400-05-717), NWO Genomics (SPI 56-464-14192), the Geestkracht program (10-000-1002), matching funds from universities and mental health care institutes involved in The Netherlands Study of Depression and Anxiety (NESDA), the Centre for Neurogenomics and Cognitive Research (CNCR-VU), and the European Union (EU)/Quality of Life program (Generic) RTD actions (QLRT) (2001-01254). J.M.V. is financially supported by NWO (VENI 451-06-004). Genotyping was funded by the Genetic Association Information Network (GAIN) of the Foundation for the U.S. National Institutes of Health, and analysis was supported by grants from GAIN and the U.S. National Institute of Mental Health (NIMH) (MH081802). Permutation tests were carried out on the Genetic Cluster Computer, which is financially supported by NWO (480-05-003). P.F.S. was supported by grants MH074027 and MH077139 from NIMH. J.K. and L.P. are supported by the Academy of Finland Centre of Excellence in Complex Disease Genetics. We would like to express our thanks to G.W. Montgomery for supervising sample preparation of the Australian sample. The Twins UK study is also funded by the Wellcome Trust, an NIHR fellowship, and an NIHR Biomedical Research Centre grant to Guys' and St. Thomas' Hospitals and King's College London. The Leiden Study was funded by grants from SenterNovem (IDE1014 and IGE5007) and The Netherlands Genomics Initiative (NGI)/NOW (05040202 and 050-060-810).
References
- 1.Li M.D., Cheng R., Ma J.Z., Swan G.E. A meta-analysis of estimated and environmental effects on smoking behavior in male and female adult twins. Addiction. 2003;98:23–31. doi: 10.1046/j.1360-0443.2003.00295.x. [DOI] [PubMed] [Google Scholar]
- 2.Vink J.M., Willemsen G., Boomsma D.I. Heritability of smoking initiation and nicotine dependence. Behav. Genet. 2005;35:397–406. doi: 10.1007/s10519-004-1327-8. [DOI] [PubMed] [Google Scholar]
- 3.Vink J.M., Beem A.L., Posthuma D., Neale M.C., Willemsen G., Kendler K.S., Slagboom P.E., Boomsma D.I. Linkage analysis of smoking initiation and quantity in Dutch sibling pairs. Pharmacogenomics J. 2004;4:274–282. doi: 10.1038/sj.tpj.6500255. [DOI] [PubMed] [Google Scholar]
- 4.Maes H.H., Sullivan P.F., Bulik C.M., Neale M.C., Prescott C.A., Eaves L.J., Kendler K.S. A twin study of genetic and environmental influences on tobacco initiation, regular tobacco use and nicotine dependence. Psychol. Med. 2004;34:1251–1261. doi: 10.1017/s0033291704002405. [DOI] [PubMed] [Google Scholar]
- 5.Vink J.M., Willemsen G., Beem A.L., Boomsma D.I. The Fagerstrom Test for Nicotine Dependence in a Dutch sample of daily smokers and ex-smokers. Addict. Behav. 2005;30:575–579. doi: 10.1016/j.addbeh.2004.05.023. [DOI] [PubMed] [Google Scholar]
- 6.Morley K.I., Lynskey M.T., Madden P.A., Treloar S.A., Heath A.C., Martin N.G. Exploring the inter-relationship of smoking age-at-onset, cigarette consumption and smoking persistence: genes or environment? Psychol. Med. 2007;37:1357–1367. doi: 10.1017/S0033291707000748. [DOI] [PubMed] [Google Scholar]
- 7.Broms U., Silventoinen K., Madden P.A.F., Heath A.C., Kaprio J. Genetic architecture of smoking behavior: a study of Finnish adult twins. Twin Res. Hum. Genet. 2006;9:64–72. doi: 10.1375/183242706776403046. [DOI] [PubMed] [Google Scholar]
- 8.Li M.D. Identifying susceptibility loci for nicotine dependence: 2008 update based on recent genome-wide linkage analyses. Hum. Genet. 2008;123:119–131. doi: 10.1007/s00439-008-0473-0. [DOI] [PubMed] [Google Scholar]
- 9.Munafo M.R., Clark T.G., Johnstone E.C., Murphy M.F.G., Walton R.T. The genetic basis for smoking behavior: a systematic review and meta-analysis. Nicotine Tob. Res. 2004;6:583–597. doi: 10.1080/14622200410001734030. [DOI] [PubMed] [Google Scholar]
- 10.Munafo M.R., Johnstone E.C. Genes and cigarette smoking. Addiction. 2008;103:893–904. doi: 10.1111/j.1360-0443.2007.02071.x. [DOI] [PubMed] [Google Scholar]
- 11.Barrett J.C., Cardon L.R. Evaluating coverage of genome-wide association studies. Nat. Genet. 2006;38:659–662. doi: 10.1038/ng1801. [DOI] [PubMed] [Google Scholar]
- 12.Manolio T.A., Brooks L.D., Collins F.S. A HapMap harvest of insights into the genetics of common disease. J. Clin. Invest. 2008;118:1590–1605. doi: 10.1172/JCI34772. [DOI] [PMC free article] [PubMed] [Google Scholar]
- 13.Bierut L.J., Madden P.A.F., Breslau N., Johnson E.O., Hatsukami D., Pomerleau O., Swan G.E., Rutter J.L., Bertelsen S., Fox L. Novel genes identified in a high-density genome wide association study for nicotine dependence. Hum. Mol. Genet. 2007;16:24–35. doi: 10.1093/hmg/ddl441. [DOI] [PMC free article] [PubMed] [Google Scholar]
- 14.Uhl G.R., Liu Q.R., Drgon T., Johnson C., Walther D., Rose J.E. Molecular genetics of nicotine dependence and abstinence: whole genome association using 520,000 SNPs. BMC Genet. 2007;8:10. doi: 10.1186/1471-2156-8-10. [DOI] [PMC free article] [PubMed] [Google Scholar]
- 15.Uhl G.R., Liu Q.R., Drgon T., Johnson C., Walther D., Rose J.E., David S.P., Niaura R.S., Lerman C. Molecular genetics of successful smoking cessation. Arch. Gen. Psychiatry. 2008;65:683–693. doi: 10.1001/archpsyc.65.6.683. [DOI] [PMC free article] [PubMed] [Google Scholar]
- 16.Berrettini W., Yuan X., Tozzi F., Song K., Francks C., Chilcoat H., Waterworth D., Muglia P., Mooser V. alpha-5/alpha3 nicotinic receptor subunit alleles increase risk for heavy smoking. Mol. Psychiatry. 2008;13:368–373. doi: 10.1038/sj.mp.4002154. [DOI] [PMC free article] [PubMed] [Google Scholar]
- 17.Thorgeirsson T.E., Geller F., Sulem P., Rafnar T., Wiste A., Magnusson K.P., Manolescu A., Thorleifsson G., Stefansson H., Ingason A. A variant associated with nicotine dependence, lung cancer and peripheral arterial disease. Nature. 2008;452:638–642. doi: 10.1038/nature06846. [DOI] [PMC free article] [PubMed] [Google Scholar]
- 18.Liu Q.R., Drgon T., Walther D., Johnson C., Poleskaya O., Hess J., Uhl G.R. Pooled association genome scanning: validation and use to identify addiction vulnerability loci in two samples. Proc. Natl. Acad. Sci. USA. 2005;102:11864–11869. doi: 10.1073/pnas.0500329102. [DOI] [PMC free article] [PubMed] [Google Scholar]
- 19.Liu Q.R., Drgon T., Johnson C., Walther D., Hess J., Uhl G.R. Addiction Molecular Genetics: 639,401 SNP whole genome association identifies many “cell adhesion” genes. Am. J. Med. Genet. B. Neuropsychiatr. Genet. 2006;141B:918–925. doi: 10.1002/ajmg.b.30436. [DOI] [PubMed] [Google Scholar]
- 20.Wang K., Li M., Bucan M. Pathway-based approaches for analysis of genomewide association studies. Am. J. Hum. Genet. 2007;81:1278–1283. doi: 10.1086/522374. [DOI] [PMC free article] [PubMed] [Google Scholar]
- 21.Penninx B.W., Beekman A., Smit J., Zitman F.G., Nolen W.A., Spinhoven P., Cuijpers P., De Jong P.J., Van Marwijk H.W., Assendelft W.J. The Netherlands Study of Depression and Anxiety (NESDA): Rationales, Objectives and Methods. Int. J. Methods Psychiatr. Res. 2008;17:121–140. doi: 10.1002/mpr.256. [DOI] [PMC free article] [PubMed] [Google Scholar]
- 22.Boomsma D.I., De Geus E.J.C., Vink J.M., Stubbe J.H., Distel M.A., Hottenga J.J., Posthuma D., van Beijstervelt T.C., Hudziak J.J., Bartels M. Netherlands Twin Register: from twins to twin families. Twin Res. Hum. Genet. 2006;9:849–857. doi: 10.1375/183242706779462426. [DOI] [PubMed] [Google Scholar]
- 23.Manolio T.A., Rodriguez L.L., Brooks L., Abecasis G., Ballinger D.G., Daly M.J., Donnelly P., Faraone S.V., Frazer K., The GAIN Collaborative Research Group New models of collaboration in genome-wide association studies: the Genetic Association Information Network. Nat. Genet. 2007;39:1045–1051. doi: 10.1038/ng2127. [DOI] [PubMed] [Google Scholar]
- 24.Boomsma D.I., Willemsen G., Sullivan P.F., Heutink P., Meijer P., Sondervan D., Kluft C., Smit G., Nolen W.A., Zitman F.G. Genome-wide association of major depression: description of samples for the GAIN Major Depressive Disorder Study: NTR and NESDA biobank projects. Eur. J. Hum. Genet. 2008;16:335–342. doi: 10.1038/sj.ejhg.5201979. [DOI] [PubMed] [Google Scholar]
- 25.Sullivan P.F., de Geus E.J.C., Willemsen G., James M.R., Smit J.H., Zandbelt T., Arolt V., Baune D.T., Blackwood D., Cichon S. Genomewide association for major depressive disorder: a possible role for the presynaptic protein piccolo. Mol. Psychiatry. 2008 doi: 10.1038/mp.2008.125. Published online December 9, 2008. [DOI] [PMC free article] [PubMed] [Google Scholar]
- 26.Schoenmaker M., de Craen A.J.M., de Meijer P.H.E.M., Beekman M., Blauw G.J., Slagboom P.E., Westendorp R.G.J. Evidence of genetic enrichment for exceptional survival using a family approach: The Leiden Longevity Study. Eur. J. Hum. Genet. 2006;14:79–84. doi: 10.1038/sj.ejhg.5201508. [DOI] [PubMed] [Google Scholar]
- 27.Peltonen L., GenomEUtwin GenomEUtwin: a strategy to identify genetic influences on health and disease. Twin Res. 2003;6:354–360. doi: 10.1375/136905203770326358. [DOI] [PubMed] [Google Scholar]
- 28.Aulchenko Y.S., Ripke S., Isaacs A., van Duijn C.M. GenABEL: an R library for genome-wide association analyses. Bioinformatics. 2007;23:1294–1296. doi: 10.1093/bioinformatics/btm108. [DOI] [PubMed] [Google Scholar]
- 29.Purcell S., Neale B., Todd-Brown K., Thomas L., Ferreira M.A.R., Bender D., Maller J., Sklar P., de Bakker P.I.W., Daly M.J. PLINK: A toolset for whole-genome association and population-based linkage analysis. Am. J. Hum. Genet. 2007;81:559–575. doi: 10.1086/519795. [DOI] [PMC free article] [PubMed] [Google Scholar]
- 30.Li C.Y., Willer C.J., Ding J., Scheet P., Abecasis G.R. Markov model for rapid haplotyping and genotype imputation in genome wide studies. Nat. Genet. 2008 in press. [Google Scholar]
- 31.Wang F., Chen H., Steketee D., Sharp B. Upregulation of ionotropic glutamate receptor subunits within specific mesocorticolimbic regions during chronic nicotine self-administration. Neuropsychopharmacology. 2007;32:103–109. doi: 10.1038/sj.npp.1301033. [DOI] [PMC free article] [PubMed] [Google Scholar]
- 32.Tzschentke T.M., Schmidt W.J. Glutamergic mechanisms in addiction. Mol. Psychiatry. 2003;8:373–382. doi: 10.1038/sj.mp.4001269. [DOI] [PubMed] [Google Scholar]
- 33.Beuten J., Ma J.Z., Dupont R.T., Lou X.Y., Crews K.M., Elston R.C., Li M.D. Association of specific haplotypes of neurotrophic tyrosine kinase receptor 2 gene (NTRK2) with vulnerability to nicotine dependence in African-Americans and European-Americans. Biol. Psychiatry. 2007;61:48–55. doi: 10.1016/j.biopsych.2006.02.023. [DOI] [PubMed] [Google Scholar]
- 34.Sun D., Huang W., Hwang Y.Y., Zhang Y., Zhang Q., Li M.D. Regulation by nicotine of Gpr51 and Ntrk2 expression in various rat brain regions. Neuropsychopharmacology. 2007;32:110–116. doi: 10.1038/sj.npp.1301134. [DOI] [PubMed] [Google Scholar]
- 35.Wiesner A., Fuhrer C. Regulation of nicotinic acetylcholine receptors by tyrosine kinases in the peripheral and central nervous system: same players, different roles. Cell. Mol. Life Sci. 2006;63:2818–2828. doi: 10.1007/s00018-006-6081-z. [DOI] [PMC free article] [PubMed] [Google Scholar]
- 36.Ho M.K., Tyndale R.F. Overview of the pharmacogenomics of cigarette smoking. Pharmacogenomics J. 2007;7:81–98. doi: 10.1038/sj.tpj.6500436. [DOI] [PubMed] [Google Scholar]
- 37.Lasky-Su J., Neale B.M., Franke B., Anney R.J., Zhou K., Maller J.B., Vasquez A.A., Chen W., Asherson P., Buitelaar J. Genome-wide association scan of quantitative traits for attention deficit hyperactivity disorder identifies novel associations and confirms candidate gene associations. Am. J. Med. Genet. B. Neuropsychiatr. Genet. 2008;147B:1345–1354. doi: 10.1002/ajmg.b.30867. [DOI] [PubMed] [Google Scholar]
- 38.Barman S.K., Pulkkinen L., Kaprio J., Rose R.J. Inattentiveness, parental smoking and adolescent smoking initiation. Addiction. 2004;99:1049–1061. doi: 10.1111/j.1360-0443.2004.00789.x. [DOI] [PubMed] [Google Scholar]
- 39.Monuteaux M.C., Faraone S.V., Hammerness P., Wilens T.E., Fraire M., Biederman J. The familial association between cigarette smoking and ADHD: A study of clinically referred girls with and without ADHD, and their families. Nicotine Tob. Res. 2008;10:1549–1558. doi: 10.1080/14622200802326137. [DOI] [PubMed] [Google Scholar]
- 40.Nussbaum J., Xu Q., Payne T.J., Ma J.Z., Huang W., Gelernter J., Li M.D. Significant association of the neurexin-1 gene (NRXN1) with nicotine dependence in European- and African-American smokers. Hum. Mol. Genet. 2008;1:1569–1577. doi: 10.1093/hmg/ddn044. [DOI] [PMC free article] [PubMed] [Google Scholar]
- 41.Terracciano A., Sanna S., Uda M., Deiana B., Usala G., Busonero F., Maschio A., Scally M., Patriciu N., Chen W.M. Genome-wide association scan for five major dimensions of personality. Mol. Psychiatry. 2008 doi: 10.1038/mp.2008.113. Published online October 28, 2008. [DOI] [PMC free article] [PubMed] [Google Scholar]
- 42.Ray R., Jepson C., Patterson F., Strasser A., Rukstalis M., Perkins K.A., Lynch K.G., O'Malley S., Berrettini W.H., Lerman C. Association of OPRM1 A118G variant with the relative reinforcing value of nicotine. Psychopharmacology (Berl.) 2006;188:355–363. doi: 10.1007/s00213-006-0504-2. [DOI] [PubMed] [Google Scholar]
- 43.McGehee D.S. Nicotinic and Opioid Receptor Interactions in Nicotine Addiction. Mol. Interv. 2006;6:311–314. doi: 10.1124/mi.6.6.4. [DOI] [PubMed] [Google Scholar]
- 44.Bierut L.J., Stitzel J.A., Wang J.C., Hinrichs A.L., Grucza R.A., Xuei X., Saccone N.L., Saccone S.F., Bertelsen S., Fox L. Variants in Nicotinic Receptors and Risk for Nicotine Dependence. Am. J. Psychiatry. 2008;165:1163–1171. doi: 10.1176/appi.ajp.2008.07111711. [DOI] [PMC free article] [PubMed] [Google Scholar]
- 45.Weiss R.B., Baker T.B., Cannon D.S., von Niederhausern A., Dunn D.M., Matsunami N., Singh N.A., Baird L., Coon H., McMahon W.M. A Candidate Gene Approach Identifies the CHRNA5–A3-B4 Region as a Risk Factor for Age-Dependent Nicotine Addiction. PLoS Genet. 2008;4:e1000125. doi: 10.1371/journal.pgen.1000125. [DOI] [PMC free article] [PubMed] [Google Scholar]
- 46.Watkins S.S., Koob G.F., Markou A. Neural mechanisms underlying nicotine addiction: acute positive reinforcement and withdrawal. Nicotine Tob. Res. 2000;2:19–37. doi: 10.1080/14622200050011277. [DOI] [PubMed] [Google Scholar]
- 47.Allen N.C., Bagade S., McQueen M.B., Ioannidis J.P.A., Kavvoura F.K., Khoury M.J., Tanzi R.E., Bertram L. Systematic meta-analyses and field synopsis of genetic association studies in schizophrenia: the SzGene database. Nat. Genet. 2008;40:827–834. doi: 10.1038/ng.171. [DOI] [PubMed] [Google Scholar]
- 48.Chen A.C., Tang Y., Rangaswamy M., Wang J.C., Almasy L., Foroud T., Edenberg H.J., Hesselbrock V., Nurnberger J.J., Kuperman S. Association of single nucleotide polymorphisms in a glutamate receptor gene (GRM8) with theta power of event-related oscillations and alcohol dependence. Am. J. Med. Genet. B. Neuropsychiatr. Genet. 2008 doi: 10.1002/ajmg.b.30818. Published online July 10, 2008. [DOI] [PMC free article] [PubMed] [Google Scholar]
- 49.Dorval K.M., Wigg K.G., Crosbie J., Tannock R., Kennedy J.L., Ickowicz A., Pathare T., Malone M., Schachar R., Barr C.L. Association of the glutamate receptor subunit gene GRIN2B with attention-deficit/hyperactivity disorder. Genes Brain Behav. 2007;6:444–452. doi: 10.1111/j.1601-183X.2006.00273.x. [DOI] [PMC free article] [PubMed] [Google Scholar]
- 50.Barnby G., Abbott A., Sykes N., Morris A., Weeks D.E., Mott R., Lamb J., Bailey A.J., Monaco A.P., International Molecular Genetics Study of Autism Consortium Candidate-gene screening and association analysis at the autism-susceptibility locus on chromosome 16p: evidence of association at GRIN2A and ABAT. Am. J. Hum. Genet. 2005;76:950–966. doi: 10.1086/430454. [DOI] [PMC free article] [PubMed] [Google Scholar]
- 51.Nielsen D.A., Ji F., Yuferov V., Ho A., Chen A., Levran O., Ott J., Kreek M.J. Genotype patterns that contribute to increased risk for or protection from developing heroin addiction. Mol. Psychiatry. 2008;13:417–428. doi: 10.1038/sj.mp.4002147. [DOI] [PMC free article] [PubMed] [Google Scholar]
- 52.Conner A.C., Kissling C., Hodges E., Hünnerkopf R., Clement R.M., Dudley E., Freitag C.M., Rösler M., Retz W., Thome J. Neurotrophic factor-related gene polymorphisms and adult attention deficit hyperactivity disorder (ADHD) score in a high-risk male population. Am. J. Med. Genet. B. Neuropsychiatr. Genet. 2008;147B:1476–1480. doi: 10.1002/ajmg.b.30632. [DOI] [PubMed] [Google Scholar]
- 53.Walss-Bass C., Soto-Bernardini M.C., Johnson-Pais T., Leach R.J., Ontiveros A., Nicolini H., Mendoza R., Jerez A., Dassori A., Chavarria-Siles I. Methionine sulfoxide reductase: A novel schizophrenia candidate gene. Am. J. Med. Genet. B. Neuropsychiatr. Genet., 2008 doi: 10.1002/ajmg.b.30791. in press. Published online May 27, 2008. [DOI] [PMC free article] [PubMed] [Google Scholar]
- 54.Lang U.E., Sander T., Lohoff F.W., Hellweg R., Bajbouj R., Winter M., Gallinat J. Association of the met66 allele of brain-derived neurotrophic factor (BDNF) with smoking. Psychopharmacology (Berl.) 2007;190:433–439. doi: 10.1007/s00213-006-0647-1. [DOI] [PubMed] [Google Scholar]
- 55.Beuten J., Ma J.Z., Payne T.J., Dupont R.T., Quezada P., Huang W., Crews K.M., Li M.D. Significant association of BDNF haplotypes in European-American male smokers but not in European-American female or African-American smokers. Am. J. Med. Genet. B. Neuropsychiatr. Genet. 2005;139B:73–80. doi: 10.1002/ajmg.b.30231. [DOI] [PubMed] [Google Scholar]
- 56.Lyons M., Hitsman B., Xian H., Panizzon M.S., Jerskey B.A., Santangelo S., Grant M.D., Rende R., Eisen S.A., Eaves L.J. A twin study of smoking, nicotine dependence, and major depression in men. Nicotine Tob. Res. 2008;10:97–108. doi: 10.1080/14622200701705332. [DOI] [PubMed] [Google Scholar]
Associated Data
This section collects any data citations, data availability statements, or supplementary materials included in this article.
Supplementary Materials
Table S1. Minimal p Values for All 302 Genes in the Discovery Sample that Contained At Least One SNP with p < 0.005