Genetic Control of Human Brain Transcript Expression in Alzheimer Disease (original) (raw)
Abstract
We recently surveyed the relationship between the human brain transcriptome and genome in a series of neuropathologically normal postmortem samples. We have now analyzed additional samples with a confirmed pathologic diagnosis of late-onset Alzheimer disease (LOAD; final n = 188 controls, 176 cases). Nine percent of the cortical transcripts that we analyzed had expression profiles correlated with their genotypes in the combined cohort, and approximately 5% of transcripts had SNP-transcript relationships that could distinguish LOAD samples. Two of these transcripts have been previously implicated in LOAD candidate-gene SNP-expression screens. This study shows how the relationship between common inherited genetic variants and brain transcript expression can be used in the study of human brain disorders. We suggest that studying the transcriptome as a quantitative endo-phenotype has greater power for discovering risk SNPs influencing expression than the use of discrete diagnostic categories such as presence or absence of disease.
Introduction
Our hypothesis is that genetic variation driving gene expression is integral to the processes involved in normal and pathogenic aging of the human cortex. In contrast to polymorphisms that change the amino acid sequence of genes, many single-nucleotide polymorphisms (SNPs) that are responsible for changes in gene expression might have more subtle phenotype effects that better explain diseases with complex modes of inheritance, including many diseases of late onset. We have performed whole-genome genotyping and transcriptome-expression analysis on a series of control and neuropathologically confirmed late-onset Alzheimer disease (LOAD) human brain samples to uncover human-cortex expression quantitative trait loci (eQTLs) that are relevant to both health and disease in the aged brain.
eQTLs are genomic sequence variants (as determined by genome-wide SNP analysis) that correlate with gene-expression differences (as determined by transcriptome-wide microarray experiments). eQTL studies are similar to traditional genetic-association studies, but instead of associating genetic markers with discrete traits such as disease status, eQTL studies correlate genetic markers with quantitative gene-expression levels. It has been suggested that this could be a powerful and complementary approach to detection of novel risk loci.1 The outputs from this type of screen are SNP-transcript pairs in which gene expression is correlated with genotype in a dose-dependent fashion.
Human genome- and transcriptome-wide eQTL analysis has been employed in the study of diseases such as asthma, cardiovascular disease, hypertension, and obesity with the use of human EBV-transformed immortalized B cell lines (ECLs2,3,4,5), as well as adipose5 and liver6 tissue. To our knowledge, other than our screen of control brain,7 no eQTL studies using human cortical tissues have been published. Recent tissue microarray surveys report that a significant proportion of the human transcriptome is unique to the cortex;8,9 therefore, defining the transcriptome-genome relationship in health and disease through the use of brain tissue is crucial for unlocking novel risk loci implicated in neurologic and psychiatric disorders.
Subjects and Methods
Subjects
Our LOAD cohort was obtained concurrent to our control cohort7 from 20 National Alzheimer's Coordinating Center (NACC) brain banks and from the Miami Brain Bank (see Supplemental Data, available online, for a list of sites). Our criteria for inclusion were as follows: self-defined ethnicity of European descent, neuropathologically confirmed LOAD or no neuropathology present, and age of death greater than 65. We restricted the series to samples with European ethnicity because there are known allele-frequency differences between groups with different ethnicities and these differences might distort our genomic SNP-screen results. Neuropathological diagnosis was defined by board-certified neuropathologists as per standard NACC protocols. Samples that had a clinical history of stroke, cerebrovascular disease, Lewy bodies, or comorbidity with any other known neurological disease were excluded. LOAD or control neuropathology was confirmed by plaque and tangle assessment, 43% of the entire series having Braak staging.10 Samples were de-identified before receipt, and the study met local human studies institutional review board and HIPPA regulations. This work is declared not human-subjects research and is IRB exempt under regulation 45 CFR 46. We received a total of 1174 tissue samples from the sites that replied to our request. Of those samples, ∼65% that met criteria were prepared for DNA and RNA. Total sample counts equaled 486 LOAD cases and 279 neuropathologically confirmed controls. Of the plated DNA and RNA, we chose ∼60% for inclusion in this pilot study. Inclusion at this stage was determined by assessment of RNA and DNA quality through visual inspection on gels.
Genotyping and Expression Profiling
DNA was hybridized to the Affymetrix GeneChip Human Mapping 500K Array Set (502,627 SNPs) as previously described.11,12 Genotypes were extracted with the use of both SNiPer-HD13 and BRLMM (Affymetrix, Santa Clara, CA) algorithms. Genotypes that exhibited less than 98% concordance between calls were excluded. SNPs with call rates less than 90% were excluded from the analysis. Hardy-Weinberg equilibrium (HWE) was assessed with exact tests and the PLINK analysis toolset.14 SNPs with HWE exact-test p values less than 0.05, as well as SNPs with minor-allele frequencies less than 1%, were excluded. Allele calls had a mean of 97% and a range of 90%–99%. cRNA was hybridized to Illumina Human Refseq-8 Expression BeadChip (24,357 transcripts) via standard protocols. Expression profiles were extracted and rank invariant normalized15–17 with the use of the BeadStudio software available from Illumina, with the Illumina custom error model used. Rank-invariant-normalized expression data were log10 transformed, and missing data were encoded as missing, rather than as a zero level of expression. Chips with average detection scores less than 0.99 (5% of control chips, 8% of LOAD chips) were excluded from the analysis. Transcripts that were detected in less than 90% of the case or 90% of the control series were excluded from our study. This was a modified criterion from our original report and included 36% of probes on the entire chip. This was done in an effort to enrich for primary effects, particularly in the disease cohort. We assessed correlations between 380,157 SNPs and 8650 transcripts.
Analysis
As in our prior report,7 we ran the genotypes from our cohort concurrently in STRUCTURE,18,19 with seven other populations. To determine the degree of relatedness between the samples in our cohort, we used the pairwise IBS and IBD calculators available in the PLINK analysis toolset.14 We plotted sample relatedness data in R, and we used the cmdscale function within the stats package to perform a multidimensional scaling analysis of the matrix of genome-wide IBS pairwise distances. For verification of the reported gender of samples, the sex-check functionality in the PLINK analysis toolset14 was used. Samples identified as having a gender mismatch or gender ambiguity were excluded from analysis.
Single-Locus Analysis
Prior to our analysis, transcript profiles were corrected for several covariates by use of the R suite of programs. Expression profiles were regressed against the sample data for several biological covariates (gender, apolipoprotein E [APOE; MIM +10774], allele dose, age at death, and cortical region) and several methodological covariates (day of expression hybridization, institute source of sample, postmortem interval [PMI], and a covariate based on the total number of transcripts detected in each sample). SNP genotype was not included in this model, because we were interested in covariate correction a priori to running our analysis. All covariates except age at death, APOE ɛ4 allele dose, and postmortem interval were coded as factors for this analysis. All samples had complete information for all covariates except PMI (n = 10 LOAD samples, 1 control sample). Average PMI values were used for these samples. Residuals from this analysis were employed in the single-locus eQTL analysis.
To determine our single-locus eQTL effects, we regressed the expression level of each transcript per sample on the number of minor alleles (0, 1, or 2) for the 380,157 SNPs that met the cutoff criteria. To capture both the effects that were independent of disease status and the eQTL effects in which there was an effect of disease, we included an interaction term for diagnosis in our model. To allow for situations in which the eQTL effect differs between LOAD cases and controls, we performed a two degree of freedom (2 df) test comparing a model in which transcript expression depends on the additive effects of SNP and disease status, together with their interaction term, against a model in which expression depends only on disease status. The main effect of diagnosis was included in the model for prevention of spurious associations occurring when SNP allele frequencies and overall expression levels differ independently between cases and controls. Including the interaction term allows the slope of the regression of expression on minor-allele dosage to differ between cases and controls. Allowing for differences between cases and controls via a 2 df test slightly reduces power for detection of SNP effects that are independent of disease status; however, this method greatly increases power for detection of effects that are disease specific. Furthermore, analyzing the entire cohort together considerably increases power as compared to performing separate tests in cases and controls. Uncorrected p values were retained from this analysis.
Genome-wide significance levels for each transcript were calculated by permutation of the subject labels, allowing for both non-normality of the transcript data and linkage disequilibrium (LD) among the SNPs. All permutated data sets were generated in the same manner, through randomly permuting sample identifiers in the transcript data (thus permuting all transcripts simultaneously). The replicate data sets were analyzed in the same way as the real data. Permutation analysis was performed on the Translational Genome Research Institute's IBM System Cluster 1350, which contains a total of 1024 computing nodes and is housed on the Arizona State University campus.
To capture the relative contributions of our case and control cohorts to the effects recovered in our 2 df model, we performed individual analysis on each series. We analyzed the same model without the diagnosis interaction term separately in cases and controls. Significance of effects was not determined in this modeling; therefore, permutation corrections were not performed. The correlation coefficients from these analyses were extracted with the use of the linear modeling (lm) functionality in R. The adjusted correlation coefficients (r2adj CO [controls] and r2adj CA [cases]) represent the portion of the expression variance explained by the SNP in each cohort, and the beta values (β cases and β controls) give the magnitude and direction of effects.
Fisher's exact tests20 were employed for assessing associations between SNPs and diagnosis status without considering expression profiles. These were implemented in PLINK14 and should correct for cases in which the allele frequencies of tested SNPs are sufficiently small as to make a chi-square test inappropriate.
To determine whether known SNPs mapped to the transcript probes, thus creating a possible false positive through non-biologically relevant differential hybridization, we used the Hapmap CEU data. Hapmap SNPs that were variable in the CEU cohort were mapped with respect to the transcript probes. LD was determined by the r2 statistic, and the r2 values between the significant SNP within our screen and the SNP within the probe from the CEU Hapmap data set were annotated within our results. It is presumed that SNP pairs with higher LD are more likely to be putative false positives if it is true that single SNP changes can affect the hybridization of the 50-mer transcript probes on the Illumina chips in a way that is not biologically relevant. However, all data are reported, because we have not made an independent assessment of the SNP-within-probe effect.
Network Analysis
We incorporated both transcripts that were significantly associated with allele dosage and those that were differentially expressed between LOAD cases and controls in our analysis. Our eQTL data set was defined as transcripts with a SNP-transcript correlation p value ≤ 0.01 after 1000 permutations and a SNP effect that was not in LD (r2 ≥ 0.8) with a polymorphism in the probe. Our differentially expressed data set was defined as transcripts identified through significance analysis of microarrays (SAM21) with a false discovery rate (FDR) < 1%. We used HQCUT22 to form the networks from residual corrected transcript data, the Database for Annotation, Visualization and Integrated Discovery (DAVID)23,24 to map gene ontologies to the clusters found by HQCUT, and the Network Edge Orienting program (NEO)25 to incorporate SNPs into these networks. We determined hub genes by examining the distribution of the number of links per gene (n = 1697). The cutoff level for hub genes was determined by the following formulae: Cutoff threshold = μ + (2 × S), in which μ is the mean number of links and S is the standard deviation.
Assessment of Disease-Specific Effects
We wanted to assess whether profiling a specific neuropathological disease was important in our recovery of new effects or whether these findings were simply a result of the increase in power through the doubling of our sample size. This is an important distinction, because for some diseases it might be difficult to sample from individuals with disease profiles; thus, knowing whether disease effects can be captured in nondisease tissue is important. To test this, we created a bootstrap control sample with 364 subjects by using R to sample the genotype and covariate data from the control portion of our data set with replacement and introducing a small amount of random variation (smoothed bootstrap). We used PLINK14 to evaluate the association between the minor-allele dose of each SNP and the transcript-expression level in the bootstrap sample, using the same 2 df model that we employed in the original analysis. Only SNP-transcript pairs that were significant (2 df test, α = 0.05) in our original analysis were analyzed, and these were stratified on the basis of those that had a significant interaction p value (interaction term α = 0.05, n = 665) and those that did not (interaction term α > 0.05, n = 1820). We then evaluated the proportion of SNP-transcript pairs that were detected in the LOAD and control data set and could be detected in the bootstrap control sample.
Replication
A portion of our SNP-transcript effects were replicated in our entire series through Taqman real-time PCR.26 Multiplex single-tube relative-quantification measurements were obtained with the assays Hs01028610_m1 (ITPKB [MIM 147522]) and Hs00907680_g1 (DKFZp566B183 [MIM 611623]). Primer-limited beta-2-microglobulin was used as the endogenous control. Efficiencies from simplex reactions were 97% for Hs01028610_m1 and 100% for Hs00907680_g1. Comparison of target and endogenous delta-CT values in simplex reactions showed similar efficiencies; the absolute values for slopes from delta-CT plots verses log input plots were less than < 0.1, justifying our use of the comparative delta-delta-CT method. All values were obtained from averages of three replicate reactions per sample. No-RT reactions for all assays were negative. Fold-change values were calculated relative to a normalizer sample present on all plates. Fold changes were corrected for all covariates with the use of R. Analysis was performed in PLINK as before, with the use of the corrected residuals. Multiple test adjustments were computed with a Dunn-Sidák correction.27
Results
Sample
Table S1 gives all sample information. Two LOAD samples (WGAAD-75 and WGAAD-270; see Figure S1) were found to be ethnic outliers and were excluded from our analysis. Samples were also screened for assessment of whether they had some degree of relatedness, and all LOAD samples were found to be unrelated. The following samples were removed from the analysis because their genetically predicted gender did not match their reported gender: WGACON-105 (reported female appears to be male), WGACON-108 (reported male appears ambiguous), WGACON-212 (reported male appears ambiguous), WGAAD-252 (reported male appears to be female), WGAAD-465 (reported male appears to be female), and WGAAD-479 (reported female appears to be male). Our total cohort included 364 human brain tissue samples; 176 LOAD cases and 188 controls after all exclusions.
Assessment of the expression profiles in the LOAD cohort found that approximately 58% of the transcripts on the Illumina Human RefSeq-8 Chip were expressed in at least 5% of our LOAD cohort. This is the same portion of the transcriptome that was found expressed in brain in the control series, suggesting that there is not a major skew in our LOAD-series profiles. Figure S2 graphs the portion of significant transcript effects (uncorrected α = 0.05) for each covariate in both the LOAD and the control cohorts. Note that our largest effects were with hybridization date (methodological covariate) and APOE status (biological covariate), other covariates having less of an effect. PMI was the covariate that had the smallest effect on our data.
Single-Locus Analysis
Cis effects and trans effects were defined as described previously;7 c_is_ associations were those that involved SNPs within 1 Mb of the 5′ end of the gene or 1 Mb of the 3′ end of the gene and within the gene. This criterion was utilized for consistency with our previous study. From a practical perspective, it means that for each transcript, ∼1% of the genome is defined as cis and 99% as trans. It is important to note that all analyses were performed genome-wide, such that all SNPs irrespective of location were run against each transcript and permutations were performed to obtain genome-wide significance. Thus, for any of our SNP-transcript pairs, other definitions of cis versus trans localizations can be applied, because our significance calculations do not rely on distance.
After correction with 1000 permutations, approximately 9% of the transcripts showed a genome-wide significant correlation with SNP genotype in the combined sample of cases and controls (p ≤ 0.05, 1000 permutations). We identified 1829 SNP-transcript pairs with effects in cis in the total cohort and 656 trans pairs, in which the SNP mapped greater than 1 Mb from the 5′ or 3′ end of the gene. We found that 27% of all eQTL had a significant interaction with diagnosis. For each phase of our study, 37% of cis LOAD-interacting candidate transcripts in this screen overlap with those found in our first report, which considered only control brains.7 The overlap with a large subset of candidates found in the analysis of disease-free controls suggests that end-stage neuropathological tissue does not create a bias in expression profiling and that contributions stemming from signal degradation and potential sampling differences are minimal. This also suggests that within our study, several of the SNP-transcript LOAD effects are risk factors, much like the APOE E4 allele, and appear in a portion of controls. For these effects, we assume that within LOAD, there are additional environmental or unassessed biological risk factors that cause predisposition to LOAD. There is an 18% overlap with our previous report considering both cis and trans results with no interaction with diagnosis, and there is a 9% overlap with our previous report considering all results with a positive interaction term.
Figure 1 plots the −log of the uncorrected p value (−log (p value)), the β values (slope), and the adjusted correlation coefficients (adjusted r2) versus distance from the transcription start site (TSS) for all of our cis effects. Many of our cis effects mapped far downstream or upstream of the TSS (Figure 1A). Although it is possible that there are regulatory elements that act over such long distances, finer mapping will need to be performed for determination of the extent to which they are true effects and of the extent to which they reflect LD in these regions. In Figures 1B and 1C, it is of note that the size of effect is inversely proportional to the distance from the TSS, as measured by either the proportion of variance explained (Figure 1B) or the slope (Figure 1C). This suggests that it is probable that true effects map close to the TSS. We found approximately as many cis negative correlations (minor allele is high expresser) as cis positive correlations (major allele is high expresser), greater differences being found between the alleles mapping closer to the TSS (see Figure 1C). Table 1 lists the top eQTL results in which there was a significant interaction with diagnosis, and Table 2 lists the top eQTL results in which there appeared to be no diagnosis effect. All results are listed in Tables S5 and S6.
Figure 1.
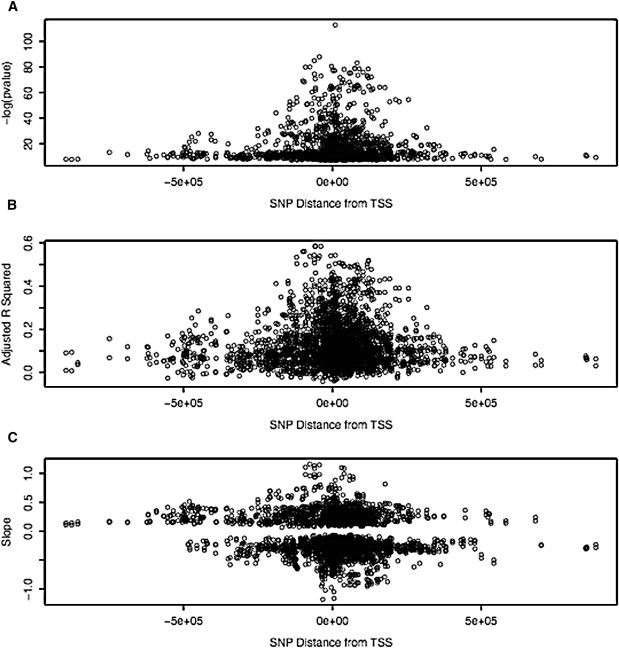
C_is_ Association Metrics Versus Distance from Transcription Start Site
Plotted on the x axis is the distance from the TSS mapped on the human genome build 36. y axis metrics are given, with slope in Figure 1C corresponding to the β values from the correlations. Note that −log(p value) values were calculated in the 2 df model with the use of the entire series, whereas the β values and the adjusted correlation coefficients were calculated separately in cases and controls, but all values are plotted.
Table 1.
Top Transcript-SNP Pairs with a Significant Effect of Diagnosis
| Probe IDa | Symbolb | Chr.c | Bp Positiond | Best SNPe | S_Chr.f | S_Pos.g | Otherh | Loc.i | Raw p Valuej | 1K p Valuek | Inter p Valuel | r2 CAm | r2 COn | Dir.o |
|---|---|---|---|---|---|---|---|---|---|---|---|---|---|---|
| GI_34147330-S | ABDH12 | 20 | 25.2–25.3 | rs6050598 | 20 | 25.3 | 40 | cis | 1.540 × 10−65 | 9.990 × 10⁻⁴ | 3.770 × 10⁻² | 0.44 | 0.38 | + |
| GI_14149802-S | ANKRD27 | 19 | 37.8–37.9 | rs259228 | 19 | 37.8 | 13 | cis | 1.190 × 10⁻³¹ | 9.990 × 10⁻⁴ | 4.160 × 10⁻² | 0.17 | 0.31 | - |
| GI_14916517-S | AP3M1 | 10 | 75.6 | rs26133 | 5 | 14.2 | 1 | trans | 3.280 × 10⁻⁹ | 1.500 × 10⁻² | 7.080 × 10⁻⁷ | 0.13 | −0.05 | +/− |
| GI_38261968-S | APG12L | 5 | 115.2 | rs2483589 | 10 | 116.4 | 1 | trans | 7.930 × 10⁻⁹ | 2.000 × 10⁻² | 9.490 × 10⁻⁴ | 0.12 | −0.04 | - |
| GI_29739147-S | ARL16 | 17 | 77.3 | rs6565624 | 17 | 77.3 | 3 | cis | 4.360 × 10⁻¹² | 9.990 × 10⁻⁴ | 4.520 × 10⁻² | 0.04 | 0.13 | - |
| GI_38327635-S | C14orf4 | 14 | 76.6 | rs1120277 | 14 | 76.5 | 0 | cis | 1.840 × 10⁻²⁷ | 9.990 × 10⁻⁴ | 2.900 × 10⁻² | 0.08 | 0.27 | - |
| GI_23346408-S | C20orf111 | 20 | 42.3 | a-2038955 | 1 | 19.6 | 0 | trans | 2.040 × 10⁻⁹ | 2.000 × 10⁻² | 3.440 × 10⁻⁶ | 0.14 | −0.05 | −/+ |
| GI_25092657-S | C7orf27 | 7 | 2.5–2.6 | rs3936086 | 16 | 13.6 | 1 | trans | 5.520 × 10⁻⁹ | 1.600 × 10⁻² | 1.050 × 10⁻⁶ | 0.15 | −0.05 | −/+ |
| GI_37059735-S | CWF19L1 | 10 | 102 | rs11594333 | 10 | 101.9 | 6 | cis | 4.650 × 10⁻¹¹ | 9.990 × 10⁻⁴ | 7.120 × 10⁻² | −0.01 | 0.13 | + |
| GI_39995081-S | FLJ20303 | 5 | 6.7 | rs4701742 | 5 | 66.7 | 10 | cis | 1.180 × 10−51 | 9.990 × 10⁻⁴ | 5.820 × 10⁻⁴ | 0.24 | 0.41 | + |
| GI_32698961-S | GDPD1 | 17 | 54.7 | rs7223491 | 17 | 54.6 | 5 | cis | 5.770 × 10⁻¹⁵ | 9.990 × 10⁻⁴ | 3.110 × 10⁻² | 0.15 | 0.01 | - |
| GI_30061497-I | GGTL3 | 20 | 32.9 | rs6087619 | 20 | 32.8 | 23 | cis | 2.220 × 10⁻³³ | 9.990 × 10⁻⁴ | 4.230 × 10⁻² | 0.14 | 0.33 | - |
| GI_22095346-S | IGSF4 | 11 | 114.5–114.9 | rs7125361 | 11 | 114.6 | 5 | cis | 3.020 × 10⁻²⁶ | 9.990 × 10⁻⁴ | 1.270 × 10⁻² | 0.24 | 0.14 | - |
| GI_29171690-I | ILVBL | 19 | 15.1 | rs11851301 | 14 | 94.2 | 0 | trans | 1.780 × 10⁻⁹ | 5.990 × 10⁻³ | 2.990 × 10⁻³ | 0.12 | −0.05 | - |
| GI_37059782-S | KIAA0980 | 20 | 25.4–25.5 | rs6132819 | 20 | 25.2 | 35 | cis | 1.750 × 10⁻²⁹ | 9.990 × 10⁻⁴ | 2.580 × 10⁻² | 0.29 | 0.15 | + |
| GI_41393558-I | KIF1B | 1 | 10.2–10.4 | rs12120191 | 1 | 10.3 | 22 | cis | 1.530 × 10−79 | 9.990 × 10⁻⁴ | 3.530 × 10⁻² | 0.5 | 0.41 | - |
| GI_42658911-S | LOC401470 | 8 | 93.2 | rs11171739 | 12 | 54.8 | 5 | trans | 4.540 × 10−58 | 9.990 × 10⁻⁴ | 3.120 × 10⁻² | 0.48 | 0.27 | + |
| GI_38455399-S | MADH5 | 5 | 135.5 | rs2483589 | 10 | 116.4 | 1 | trans | 3.010 × 10⁻⁸ | 2.100 × 10⁻² | 1.090 × 10⁻³ | 0.12 | −0.04 | - |
| GI_5174552-S | MFAP1 | 15 | 41.9 | rs17546037 | 5 | 7.3 | 1 | trans | 7.340 × 10⁻⁹ | 5.990 × 10⁻³ | 1.050 × 10⁻³ | 0.13 | −0.04 | - |
| GI_7662347-S | MONDOA | 12 | 121.0–121.2 | rs3741452 | 12 | 121.2 | 1 | cis | 2.620 × 10⁻²⁸ | 9.990 × 10⁻⁴ | 3.550 × 10⁻⁵ | 0.04 | 0.32 | - |
| GI_31881619-A | PPA2 | 4 | 106.5–106.6 | rs2866799 | 4 | 106.7 | 19 | cis | 1.260 × 10⁻²⁴ | 9.990 × 10⁻⁴ | 3.380 × 10⁻² | 0.27 | 0.1 | - |
| GI_45439315-I | PPIE | 1 | 40 | rs1180341 | 1 | 39.8 | 2 | cis | 3.260 × 10⁻¹⁴ | 9.990 × 10⁻⁴ | 2.800 × 10⁻² | 0.21 | 0.02 | - |
| GI_19557635-A | PPIL3 | 2 | 201.4–201.5 | rs6715380 | 2 | 201.9 | 14 | cis | 2.340 × 10⁻¹² | 9.990 × 10⁻⁴ | 2.470 × 10⁻² | 0.02 | 0.13 | - |
| GI_15011935-S | RPS26 | 12 | 54.7 | rs11171739 | 12 | 54.8 | 5 | cis | 1.150 × 10−70 | 9.990 × 10⁻⁴ | 2.740 × 10⁻² | 0.51 | 0.33 | + |
| GI_7657430-S | SND1 | 7 | 127.1–127.5 | rs1408015 | 13 | 106.9 | 1 | trans | 3.150 × 10⁻⁸ | 3.800 × 10⁻² | 1.790 × 10⁻³ | 0.14 | −0.05 | + |
| GI_5730084-S | TCTEL1 | 6 | 159 | rs10843090 | 12 | 28.1 | 0 | trans | 1.430 × 10⁻⁸ | 3.000 × 10⁻² | 1.760 × 10⁻³ | 0.13 | −0.04 | +/− |
| GI_8922751-S | TYW1 | 7 | 66.1–66.3 | rs6966142 | 7 | 66 | 8 | cis | 1.180 × 10⁻¹² | 9.990 × 10⁻⁴ | 2.330 × 10⁻² | 0 | 0.14 | + |
| GI_41281748-I | ZNF323 | 6 | 28.4 | rs149970 | 6 | 28.1 | 8 | cis | 8.350 × 10⁻¹⁰ | 6.990 × 10⁻³ | 2.510 × 10⁻² | 0.12 | −0.02 | + |
Table 2.
Top Transcript-SNP Pairs without a Significant Diagnosis Interaction
| Probe ID | Symbol | Chr. | Bp Position | Best SNP | S_Chr | S_Pos | Other | Loc. | Raw p Value | 1K p Value | Inter p Value | r2 CA | r2 CO | Dir. |
|---|---|---|---|---|---|---|---|---|---|---|---|---|---|---|
| GI_34147330-S | ABDH12 | 20 | 25.2–25.3 | rs4815412 | 20 | 25.3 | 40 | cis | 6.890 × 10−64 | 9.990 × 10⁻⁴ | 5.2030 × 10⁻² | 0.43 | 0.38 | + |
| GI_8923854-A | AD-017 | 3 | 52.7 | rs1961958 | 3 | 52.6 | 31 | cis | 1.450 × 10−53 | 9.990 × 10⁻⁴ | 7.0820 × 10⁻¹ | 0.34 | 0.32 | - |
| GI_22748838-S | AHSA2 | 2 | 61.3 | rs720201 | 2 | 61.2 | 19 | cis | 8.940 × 10⁻²⁴ | 9.990 × 10⁻⁴ | 2.0130 × 10⁻¹ | 0.25 | 0.13 | - |
| GI_14149802-S | ANKRD27 | 19 | 37.8–37.9 | rs438268 | 19 | 37.8 | 13 | cis | 1.840 × 10−36 | 9.990 × 10⁻⁴ | 1.3840 × 10⁻¹ | 0.23 | 0.31 | + |
| GI_23238227-S | CHST7 | X | 46.3 | rs760697 | X | 46.3 | 3 | cis | 1.890 × 10⁻²³ | 9.990 × 10⁻⁴ | 3.374 × 10⁻¹ | 0.23 | 0.19 | + |
| GI_25306276-S | EFG1 | 3 | 159.8–159.9 | rs9832803 | 3 | 159.9 | 7 | cis | 1.420 × 10⁻³⁴ | 9.990 × 10⁻⁴ | 5.860 × 10⁻¹ | 0.29 | 0.20 | - |
| GI_31542792-S | FN3K | 17 | 78.3 | rs11078015 | 17 | 78.4 | 16 | cis | 3.130 × 10−79 | 9.990 × 10⁻⁴ | 6.905 × 10⁻¹ | 0.48 | 0.45 | + |
| GI_24431963-S | HBS1L | 6 | 135.3–135.4 | rs4646871 | 6 | 135.3 | 15 | cis | 1.080 × 10⁻²⁷ | 9.990 × 10⁻⁴ | 7.053 × 10⁻¹ | 0.24 | 0.19 | - |
| GI_37059782-S | KIAA0980 | 20 | 25.4–25.5 | rs2258719 | 20 | 25.2 | 35 | cis | 1.860 × 10⁻²⁸ | 9.990 × 10⁻⁴ | 5.377 × 10⁻² | 0.27 | 0.17 | + |
| GI_21314694-S | KIAA1449 | 3 | 39.1 | rs811971 | 3 | 39.1 | 22 | cis | 5.080 × 10−39 | 9.990 × 10⁻⁴ | 2.428 × 10⁻¹ | 0.31 | 0.27 | + |
| GI_41393558-I | KIF1B | 1 | 10.2–10.4 | rs10492972 | 1 | 10.3 | 22 | cis | 1.650 × 10−66 | 9.990 × 10⁻⁴ | 8.820 × 10⁻² | 0.43 | 0.40 | - |
| GI_4826813-A | KTN1 | 14 | 55.1–55.2 | rs10137340 | 14 | 55.1 | 4 | cis | 2.650 × 10⁻²³ | 4.995 × 10⁻³ | 2.312 × 10⁻¹ | 0.12 | 0.21 | - |
| GI_24308385-S | LOC115294 | 8 | 52.9 | rs17212214 | 8 | 53 | 21 | cis | 2.020 × 10⁻²⁸ | 9.990 × 10⁻⁴ | 7.537 × 10⁻¹ | 0.24 | 0.20 | - |
| GI_37546921-S | LOC339804 | 2 | 61.2 | rs720201 | 2 | 61.2 | 13 | cis | 1.590 × 10⁻²⁵ | 9.990 × 10⁻⁴ | 2.113 × 10⁻¹ | 0.25 | 0.15 | + |
| GI_40786403-S | LOC374969 | 1 | 43.0–43.1 | rs323720 | 1 | 43 | 12 | cis | 6.260 × 10−37 | 9.990 × 10⁻⁴ | 4.611 × 10⁻¹ | 0.26 | 0.31 | + |
| GI_28603839-S | MGC10120 | 10 | 102 | rs6584356 | 10 | 102 | 3 | cis | 9.020 × 10−37 | 1.998 × 10⁻³ | 7.180 × 10⁻² | 0.27 | 0.26 | - |
| GI_33859747-S | MGC2752 | 19 | 63.8 | rs10413586 | 19 | 63.8 | 1 | cis | 3.940 × 10⁻³² | 9.990 × 10⁻⁴ | 3.401 × 10⁻¹ | 0.23 | 0.23 | - |
| GI_31652223-A | MRPL21 | 11 | 68.4 | rs478647 | 11 | 68.5 | 10 | cis | 1.850 × 10⁻³⁵ | 9.990 × 10⁻⁴ | 2.100 × 10⁻¹ | 0.31 | 0.19 | - |
| GI_28872733-I | MRPL43 | 10 | 102.7 | rs4917916 | 10 | 102.7 | 5 | cis | 1.520 × 10⁻²³ | 9.990 × 10⁻⁴ | 6.832 × 10⁻¹ | 0.22 | 0.18 | - |
| GI_29826284-A | MRPL47 | 3 | 180.8 | rs10513762 | 3 | 180.8 | 2 | cis | 1.750 × 10⁻²⁵ | 9.990 × 10⁻⁴ | 4.383 × 10⁻¹ | 0.23 | 0.12 | - |
| GI_6912539-S | NUBP2 | 16 | 1.8 | rs3848348 | 16 | 1.8 | 18 | cis | 9.170 × 10⁻³¹ | 9.990 × 10⁻⁴ | 7.720 × 10⁻¹ | 0.20 | 0.24 | + |
| GI_40288186-A | PDLIM2 | 8 | 22.5 | rs2291232 | 8 | 22.5 | 11 | cis | 8.470 × 10−43 | 9.990 × 10⁻⁴ | 6.109 × 10⁻¹ | 0.25 | 0.31 | - |
| GI_30179910-A | PILRB | 7 | 99.8 | rs1000215 | 7 | 99.4 | 6 | cis | 4.330 × 10⁻²⁸ | 9.990 × 10⁻⁴ | 9.318 × 10⁻¹ | 0.24 | 0.18 | + |
| GI_31881619-A | PPA2 | 4 | 106.5–106.6 | a-1897043 | 4 | 106.5 | 19 | cis | 3.770 × 10⁻²⁸ | 9.990 × 10⁻⁴ | 8.078 × 10⁻¹ | 0.22 | 0.20 | - |
| GI_19557635-A | PPIL3 | 2 | 201.4–201.5 | rs10205561 | 2 | 201.5 | 14 | cis | 2.210 × 10⁻³² | 9.990 × 10⁻⁴ | 6.970 × 10⁻¹ | 0.29 | 0.19 | - |
| GI_28274698-S | RAB3IP | 12 | 68.4–68.5 | rs11177823 | 12 | 68.4 | 3 | cis | 1.280 × 10−44 | 9.990 × 10⁻⁴ | 1.424 × 10⁻¹ | 0.34 | 0.26 | - |
| GI_14149701-S | RNF167 | 17 | 4.8 | rs238237 | 17 | 4.4 | 4 | cis | 2.600 × 10⁻²⁹ | 9.990 × 10⁻⁴ | 1.721 × 10⁻¹ | 0.32 | 0.14 | + |
| GI_4506738-S | RPS6KB2 | 11 | 67 | rs1476792 | 11 | 67 | 2 | cis | 1.990 × 10⁻²¹ | 9.990 × 10⁻⁴ | 5.155 × 10⁻² | 0.25 | 0.09 | - |
| GI_34147665-S | STK25 | 2 | 242.1 | rs3755400 | 2 | 242 | 1 | cis | 2.170 × 10⁻³¹ | 9.990 × 10⁻⁴ | 6.325 × 10⁻¹ | 0.25 | 0.23 | - |
| GI_6912707-S | TIMM10 | 11 | 57.1 | rs2729371 | 11 | 57.1 | 6 | cis | 1.590 × 10−72 | 9.990 × 10⁻⁴ | 2.506 × 10⁻¹ | 0.42 | 0.40 | - |
| GI_15451941-S | UBA52 | 19 | 18.5 | rs1468475 | 19 | 18.5 | 6 | cis | 3.550 × 10−81 | 9.990 × 10⁻⁴ | 3.116 × 10⁻¹ | 0.43 | 0.46 | + |
| GI_4557872-S | UROS | 10 | 127.5 | rs1571278 | 10 | 127.5 | 14 | cis | 7.880 × 10⁻²⁸ | 9.990 × 10⁻⁴ | 9.659 × 10⁻¹ | 0.20 | 0.21 | - |
| GI_37622342-A | ZNF266 | 19 | 9.4 | rs4804436 | 19 | 9.4 | 23 | cis | 6.870 × 10−44 | 9.990 × 10⁻⁴ | 5.462 × 10⁻¹ | 0.33 | 0.26 | - |
Although each SNP-transcript pair is unique to either the LOAD-interacting data set (Table 1, Table S5) or the noninteraction data set (Table 2, Table S6), some of our transcripts overlap between these lists. For our top results in Tables 1 and 2, abhydrolase domain-containing 12 (ABDH12), ankyrin repeat domain 27 (ANKRD27), ninein-like protein (KIAA0980, [MIM ∗609580]), kinesin family member 1B (KIF1B, [MIM ∗605995]), inorganic pyrophosphatase 2 (PPA2, [MIM ∗609988]), and peptidylprolyl isomerase-like protein 3 (PPIL3) all occur on both Table 1 (diagnosis interaction effect) and Table 2 (no interaction). To investigate why this overlap is occurring, we examined the SNPs mapping to these transcripts and found two effects. In the first case, the main effect appears to be with diagnosis, but some SNPs just missed our cutoff for having a significant interaction term (α = 0.05). For SNPs in ABDH12, ANKRD27, KIAA0980, and KIF1B, as the LD between the main-effect SNPs in Table 1 and the additional SNPs in the gene gets weaker, the significance of the interaction term erodes until it slips below our α = 0.05 cutoff, causing these subthreshold lower-LD SNPs to occur in Table 2. In the second case, for the transcripts PPA2 and PPIL3, there are actually separate LD blocks that both contain eQTL SNPs, but only one of the blocks has a significant interaction term. In this situation, two separate eQTL effects are observed for the single transcript, and only one of them has a significant interaction with LOAD. This effect is biologically plausible in that SNPs in each block might be changing different transcription-factor binding sites, one of which is implicated in LOAD risk and the other of which is not.
Network Analysis
In our original report, each transcript was treated as a single unit and run against the SNP profiles for the entire genome. This type of analysis does not consider the interdependence of transcript profiles or the network of effects that might occur within the human brain. To capture this additional information, we performed an initial network analysis of a subset of our eQTL transcripts. For this analysis, we also included transcripts for which there was no correlation of expression with genotype but was a significant difference in transcript expression between cases and controls. This would help in determining whether there were additional effects of our eQTL on downstream expression that were relevant to disease and would not be captured in a single-locus analysis.
Of the transcripts we used for our network analysis, ∼27% were significantly correlated with minor-allele dose (eQTL data set defined by 1000 permutations, α = 0.01). The remaining transcripts were included because they were defined as being differentially expressed through significance analysis of microarrays (SAM21) with an FDR cutoff ≤ 0.1% (differentially expressed [DE] data set). The HQCUT algorithm recovered nine clusters in this data set. Ten transcripts did not cluster within the network. These transcripts were all from our eQTL data set. Figure 2 shows the resulting adjacency matrix. Table 3 gives summary statistics for each cluster, including the major ontology group mapped with the DAVID annotation for each cluster.23,24 The full list of top ontology keywords for each cluster is given in Tables S2A and S2B. Several of these ontology groupings matched results from previous LOAD-expression-only screens.28
Figure 2.
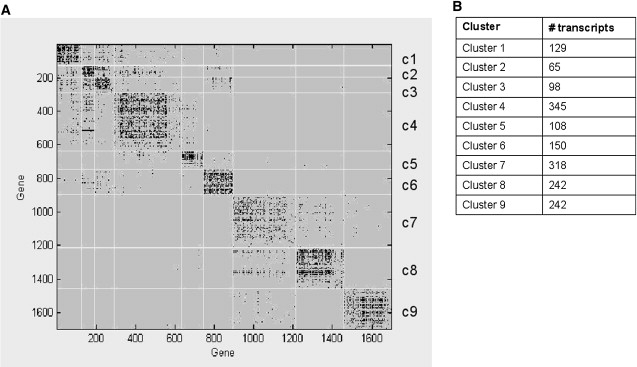
Adjacency Matrix of the eQTL and DE Network
Figure 2A shows the adjacency matrix for our HQCUT network analysis. Modules in this figure are labeled c1–c9. Genes are listed by map number (1–1697) that was assigned during the clustering procedure and is arbitrary. Dots represent inter- and intramodule relationships between transcripts. Figure 2B shows the number of transcripts per cluster.
Table 3.
Summary Statistics for the eQTL and DE Network
| Cluster | Total | eQTL | LOAD | Top Process | Score | Count | p Value |
|---|---|---|---|---|---|---|---|
| 1 | 8% | 16% | 7% | ∗organ morphogenesis | 1.72 | 8 | 2.900 × 10⁻³ |
| 2 | 4% | 42% | 34% | zinc finger, C2H2 type | 0.99 | 8 | 4.100 × 10⁻³ |
| 3 | 6% | 40% | 12% | cell growth | 1.12 | 5 | 2.400 × 10⁻² |
| 4 | 20% | 33% | 16% | ∗negative regulation of transcription, DNA dependent | 2.05 | 13 | 2.400 × 10⁻³ |
| 5 | 6% | 44% | 19% | protein kinase cascade | 2.06 | 9 | 2.200 × 10⁻³ |
| 6 | 9% | 12% | 9% | KRAB box | 2.11 | 9 | 5.500 × 10⁻⁵ |
| 7 | 19% | 21% | 10% | ligase activity, forming carbon-nitrogen bonds | 1.78 | 12 | 6.400 × 10⁻³ |
| 8 | 14% | 35% | 15% | mitochondrion | 3.02 | 33 | 8.200 × 10⁻⁶ |
| 9 | 14% | 19% | 10% | glycoprotein | 3.42 | 49 | 3.900 × 10⁻⁶ |
To further assess our network, we examined whether any transcripts within the network had an overrepresentation of links to other transcripts (“hub genes”), suggesting that they were controlling many downstream effects. The essential nature of hub genes has been demonstrated within studies using yeast.29 In our data set, the mean number of links in our network was 56 and the standard deviation was 38.78; thus, our cut off was 134 links, which is indicated in Figure S3. Within our eQTL and DE network, there were 62 hub genes, which are shown in Table 4.
Table 4.
Table of Hub Transcripts in the eQTL and DE Network
| Cluster | Probe ID | Name | Entrez | No. Links |
|---|---|---|---|---|
| 2 | GI_37620215-S | LOC253827 | 253827 | 134 |
| 4 | GI_21314672-S | CLST11240 | 51751 | 134 |
| 2 | GI_34577082-A | RSU1 | 6251 | 136 |
| 4 | GI_4505876-A | PLEC1 | 5339 | 136 |
| 7 | GI_29740938-S | KIAA1136 | 57512 | 136 |
| 7 | GI_4504482-S | HPRT1 | 3251 | 136 |
| 8 | GI_4505718-S | PEX11B | 8799 | 136 |
| 7 | GI_4503064-S | CRYM | 1428 | 137 |
| 2 | GI_21389426-S | MGC29891 | 126626 | 138 |
| 4 | GI_34577104-A | RNPC1 | 55544 | 138 |
| 4 | GI_4758085-S | CSRP1 | 1465 | 138 |
| 7 | GI_27734858-S | LOC285533 | 285533 | 139 |
| 7 | GI_37221176-S | NUDT11 | 55190 | 139 |
| 3 | GI_34222376-S | MGC44287 | 340547 | 142 |
| 4 | GI_41152085-S | SERPINB6 | 5269 | 142 |
| 4 | GI_4508040-S | ZNF91 | 7644 | 142 |
| 7 | GI_21264573-S | TM4SF13 | 27075 | 143 |
| 4 | GI_13899238-S | MGC10812 | 54858 | 144 |
| 3 | GI_37538660-S | IPLA2(GAMMA) | 50640 | 146 |
| 4 | GI_27754195-S | MTND3 | 4537 | 146 |
| 4 | GI_31982916-S | FLJ23042 | 5829 | 146 |
| 4 | GI_34147573-S | ITGB5 | 3693 | 146 |
| 4 | GI_8922566-S | FLJ10647 | 55194 | 146 |
| 4 | GI_31543199-S | C7orf21 | 83590 | 147 |
| 2 | GI_33589825-S | APG10L | 819941 | 148 |
| 3 | GI_31543151-S | MGC14817 | 84298 | 148 |
| 4 | GI_38569399-S | ITPKB | 3707 | 148 |
| 4 | GI_4755133-S | DOK1 | 1796 | 149 |
| 4 | GI_6005923-S | TU3A | 11170 | 149 |
| 1 | GI_37550007-S | KIAA0121 | 9686 | 150 |
| 3 | GI_41393596-S | CSAD | 51380 | 150 |
| 1 | GI_38788287-S | ZNF160 | 90338 | 151 |
| 4 | GI_19923329-S | CTDSP2 | 10106 | 151 |
| 1 | GI_28558992-I | TG737 | 8100 | 153 |
| 4 | GI_24308106-S | DKFZp566C0424 | 26099 | 153 |
| 7 | GI_21361148-S | RGS7 | 6000 | 155 |
| 4 | GI_38176295-I | LASS1 | 10715 | 156 |
| 8 | GI_34335244-A | NMNAT2 | 23057 | 156 |
| 4 | GI_11968040-S | DCLRE1C | 64421 | 158 |
| 4 | GI_30795118-A | FBXO18 | 84893 | 159 |
| 8 | GI_19913427-S | ATP6V1B2 | 526 | 159 |
| 1 | GI_8922963-S | SYNJ2BP | 55333 | 163 |
| 4 | GI_13376551-S | FLJ14346 | 80097 | 163 |
| 4 | GI_24308252-S | DTX2 | 113878 | 163 |
| 4 | GI_25453471-A | EEF1D | 1936 | 164 |
| 4 | GI_4755141-S | INPPL1 | 3636 | 168 |
| 2 | GI_14249467-I | C6orf29 | 80736 | 171 |
| 1 | GI_14249445-S | FLJ14431 | 84869 | 175 |
| 8 | GI_23111022-S | SNX10 | 29887 | 177 |
| 8 | GI_10863934-S | RTN1 | 6252 | 178 |
| 4 | GI_19923612-S | FLJ21128 | 80153 | 179 |
| 3 | GI_42655861-S | KIAA0492 | 57238 | 180 |
| 4 | GI_19913359-S | TBL1X | 6907 | 180 |
| 4 | GI_5803097-S | MYST3 | 7994 | 182 |
| 8 | GI_31542527-S | DKFZP566B183 | 25977 | 186 |
| 1 | GI_36030972-S | UBXD4 | 165324 | 188 |
| 4 | GI_38569463-S | SASH1 | 23328 | 195 |
| 8 | GI_20357538-A | ATP6V1G2 | 534 | 202 |
| 8 | GI_5454069-S | SLC9A6 | 10479 | 202 |
| 4 | GI_28558997-A | PTBP1 | 5725 | 209 |
| 8 | GI_45238856-S | LOC114928 | 114928 | 214 |
| 4 | GI_27478393-S | LOC285919 | 285919 | 230 |
Further examination of our network analysis found that proportionally, most of our eQTLs were located in clusters 5 (44%), 2 (42%), and 3 (40%). Thirty-four percent of cluster 2 transcripts had a significant interaction with diagnosis with at least one SNP, a higher proportion than any other cluster (see Table 3). From at our list of hub effects (see Table 4), 6% of LOAD eQTL transcripts in cluster 2 had greater than 134 genes linked to them, a greater portion of hub transcripts than in any other cluster. Thus, for clarity in this preliminary report, we focused on cluster 2; however, all data are available for analysis on the additional clusters (see Web Resources). To analyze this cluster, we used the program NEO.25 We used SNPs to anchor the edges of the network and infer causal relationships between pairs of coregulated transcripts. A portion of the resulting network is diagrammed in Figure 3.
Figure 3.
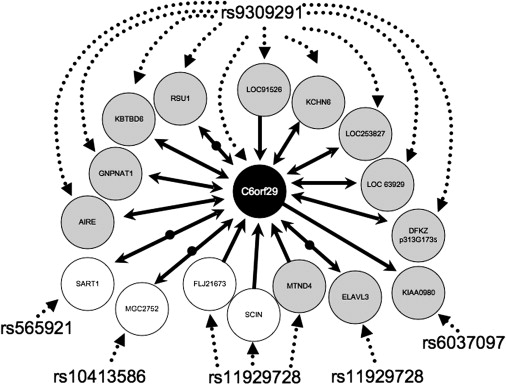
Cluster 2 C6orf29 Network
Diagrammed in the figure are the predicted transcript relationships given from our analysis using NEO25 to impart directionality on the transcript-transcript correlations that we predicted from HQCUT22 for the transcripts in cluster 2. For clarity, only transcripts that had correlations with SNP genotype and an interaction with C6orf29 are listed (25% of cluster 2). In the figure, SNP-transcript relationships are given by dashed arrows and transcript-transcript relationships by solid arrows. Transcripts are indicated by circles, gray circles indicating transcripts where there was a significant interaction with diagnosis in the eQTL analysis and white circles indicating no significant interaction term. Bidirectional arrows indicate a feedback loop between the two transcripts analyzed as predicted by NEO analysis. Bidirectional arrows divided by black circles indicate that NEO predicted an unmapped hidden confounder in the analysis of the relationship between the two transcripts.
Taqman Replication of Effects
For our data sets, we have replicated several effects via other methodologies. First, within these samples, we had previously shown that expression of the Microtubule-Associated Protein Tau gene (MAPT [MIM +157140]) is affected by SNPs mapping to the gene, by using qRT-PCR.30 Analysis of our data from the genome-wide screen is consistent with our previous data on these samples, in that alleles that occur on the major haplotype of MAPT (H1) are associated with higher Tau transcript expression. This provides an internal positive control within our full-genome screen in that looking genome-wide, we can find effects that we have seen in candidate-gene analysis of our samples. Additionally, we have replicated our SNP-transcript-diagnosis relationship for ITPKB and rs12125724 (Dunn-Sidák-adjusted 2 df test p value = 2.76 × 10⁻⁴) by using Taqman assays and the same model that we applied to the whole-genome and transcriptome data; however, for DKFZp566B133 and rs9309291, our Taqman analysis results did not survive multiple testing correction.
Candidates—cis eQTL
In terms of LOAD-specific effects, two LOAD candidate-gene studies have been performed, examining SNP variation and gene expression. We have replicated both of these results; however, more work clearly needs to be done in independent series for determination of whether a greater portion of our results replicate. In the first candidate study, Lambert et al.31 examined the Transcription Factor CP2 gene (TFCP2/LBP-1c/CP2/LSF [MIM 189889]) and found that a SNP within the 3′ UTR of the gene had a genetic association with LOAD risk. Additionally, this report examined expression in lymphoblasts from patients genotyped for the 3′ UTR polymorphism and found that absence of the A allele at this site was associated with a lower transcript expression. In our screen, although we did not obtain a significant association by considering only SNP genotypes localized to this gene, we did obtain a significant eQTL effect when considering expression in combination with genotype and diagnosis.
Our second LOAD hit that has been implicated in prior studies is the glutathione-S-transferase (GSTO 2 [MIM 612314]) locus on chromosome 10q. This gene maps within a linkage peak found in many family-based LOAD linkage screens (for meta-analysis, see Hamshere et al.32) and thus was studied as a LOAD candidate gene by Li and colleagues.33 Their approach was slightly different than a standard eQTL, in that they did not map expression profiles directly in the linkage pedigrees but instead performed expression profiling on separate samples and then looked for differentially expressed genes that mapped within linkage peaks and followed those candidates. They found associations with SNPs both in GSTO 1 (p = 0.007 [MIM 605482]) in and GSTO 2 (p = 0.005), both of which are tightly linked on chromosome 10, but only GSTO 1 was differentially expressed. We did not see a significant eQTL result with GSTO 1, and our analysis examining only expression failed to detect differential expression at this locus. We did see a GSTO 2 effect that had a significant interaction with diagnosis. Running the GSTO 2 Illumina Chip hybridization probe through Blat to determine whether there was cross-talk between GSTO 1 and GSTO 2 with respect to our hybridization signal yielded a single hit in the entire genome, mapping specifically to the 3′ UTR of GSTO 2. Given that the Li et al. study expression profiling was performed in a separate cohort that was just 3% of the size of this one (n = 6 LOAD, 2 control brains) and that we performed our expression and genotyping using the same cohort, we feel that it is likely that the true effect at this locus on chromosome 10q is with GSTO 2. This speaks to the power of examining both expression and genotypes in the same cohort because correlations will detect linear relationships with gene dosage, a method more powerful and accurate than simply looking at gene expression alone. Additionally, trans effects will be captured only by examining the relationship between SNPs and expression together and will be missed if SNPs and transcripts are assessed as separate data sets.
Finally, in both our control screen and our analysis of the entire cohort, we replicated a result from one of the first published eQTL screens using EBV-transformed lymphoblasts from the Centre d'Etude du Polymorphisme Humaine (CEPH) cohort.34 This study, using different platforms for whole-genome and transcriptome analysis than those used in our analysis, found one transcript that had a similar cis association. This transcript was ribosomal protein S26 (RPS26 [MIM 603701]), which encodes a ribosomal protein that is a component of the 40S subunit. For RPS26, Cheung and colleagues reported significant association with marker rs2271194, which is in complete LD with two out of our six associated SNPs. This replicated result suggested that this SNP-transcript pair is unlikely to be a false positive. Additionally, two more recent screens have also found an effect with RPS26, further validating the result.2,6 One of those studies, using human liver samples, has implicated RPS26 in diabetes pathways,6 and we have found it to have a significant interaction with diagnosis in our screen. These observations suggest that the function of ribosomal proteins might not be limited to stability and efficiency of the ribosome. Ribosomal proteins may participate in the regulation of specific transcripts or families of transcripts being processed by the ribosome, and many of those might be integral to disease processes.35
Candidates—trans eQTL
Although it is more difficult to capture validated trans effects because of the fact that there are no distance limitations placed upon their discovery, some trans effects are likely to be real and of great interest for disease. Conceptualization of how trans effects could occur is less obvious than that of cis effects, but it is important to remember that our screen captures only the expression profiles of poly-A tailed mRNA. Thus, trans effects could be occurring because the trans SNP is affecting an intermediary (such as miRNA) that we have not captured within our screen. Another possible scenario is that trans effects occur though interchromosomal relationships in transcription of mRNA. Nunez and colleagues used chromatin-conformation capture to demonstrate that interchromatin pairing of disparate DNA sequences (in their example genes on chromosomes 21 and 2) is a common feature of estrogen receptor-α-mediated transcription.36 Thus, there could be direct action of trans SNPs on target transcripts located on different chromosomes.
Our network analysis is informative for assessing the trans effects in our screen. In our preliminary analysis we focused on cluster 2, because this cluster contained the highest proportion of transcripts that had LOAD eQTL relative to the other clusters. Within this network, the main effects were with the transcript C6orf29 (171 links total, 58 links within cluster 2, accounting for 90% of the cluster [OMIM 606107]) and the SNP rs9309291 (significant effect with 63 transcripts; all effects had a significant interaction with diagnosis, and ten of those transcript mapped to cluster 2). C6orf29 is a member of a family of three transporters, one of which was cloned because of its ability to suppress a yeast choline transport mutation.37 Although currently the best LOAD biomarker is beta-amyloid (for review see study by J. Hardy38), it has been proposed that cholinergic systems are involved in Alzheimer disease.39 It is known that cholinergic neurons are particularly susceptible to Alzheimer disease pathogenesis, further implicating this network in the pathogenesis of LOAD. Thus, C6orf29 is a putative trans target in our screen.
Discussion
We have performed a genome- and transcriptome-wide screen to assess the downstream effects of risk variation for LOAD on mRNA expression. The importance of work and data is clear.
First, by focusing on a quantitative endo-phenotype (expression) as opposed to a discrete phenotype (diagnosis), we have considerable power to detect subtle regulatory effects in a relatively small cohort. Statistical calculations have predicted that sample sizes on the order of 100 are sufficient for 80% power for eQTL studies.40 This is an order of magnitude less than that predicted for genome-wide association studies (GWAS).41 We can clearly see this by comparing this current analysis to our previous GWAS.11 The cohort in this report was a part of our larger GWAS sample and is approximately one-quarter the sample size of that report (n = 1411 in Reiman et al.,11 364 samples in this study). In our GWAS screen with an unstratified analysis, our only result after correction for multiple testing was with APOE.12 With rank ordering of our uncorrected GWAS p values, it is of note that 6% of our permutation-corrected eQTL SNPs fall within the top 5% of our uncorrected GWAS effects. Given that these effects were statistically significant in the smaller eQTL cohort but not in the larger GWAS screen, eQTL quantitative analysis might be more powerful for detection of expression effects than discrete trait analysis. Of course, this does not obviate the need for large GWAS studies, because our approach would not capture coding changes or other types of risk variants not associated with changes in expression; however, it is clear that eQTL approaches in smaller cohorts can capture regulatory risk effects that would be found only in GWAS screens of considerably larger size.
Second, assaying the tissue relevant to the disease of interest is crucial. Expression studies profiling different human tissues have shown that the human brain transcriptome is unique.8,9 Additionally, recent eQTL work examining phenotypes involved in body mass found that there was an order of magnitude difference between the effects that they found by transcriptome sampling in blood verses adipose tissue, many more significant traits being found in adipose, their tissue of interest.5 We are focused on neurodegenerative disease; therefore, we have sampled brain tissue. A possible argument could be put forth that postmortem tissue does not have relevance for disease in living subjects; however, recent in vivo work profiling MAPT in human cerebral spinal fluid and examining the relationship between Tau levels and MAPT genotype has recapitulated our findings in postmortem samples,30,42,43 suggesting that postmortem findings are relevant to in vivo disease processes. This last point is crucial, because these eQTL targets could be the next generation of biomarkers. eQTL biomarkers have the added benefit of not only being molecular but having mapped genotype profiles, which might be easier to assay than a molecular marker. Identifying biomarkers that could further classify preclinical subgroups and identify subclasses of rapid converters would help significantly reduce the cost of drug trials.
Third, by coupling SNP variation with changes in expression, we are able to map the neurobiological consequences of our genetic findings. We began this screen because we were frustrated with our own and others' efforts in mapping novel risk factors for late onset Alzheimer disease. As of 2006, 355 additional candidate genes for LOAD have been examined.44 Of the subset of genes providing enough information for meta-analysis, only ∼20% had variants that replicated. The majority of the replicated risk variants were noncoding; thus, the biological consequences of those changes are unknown. We felt that examining downstream functionality of putative risk variants would help in distinguishing between true risk variants and those that were merely markers of disease. Clearly, our efforts have had some success, in that we are able to distinguish the genetic effects of GSTO 2, the true risk gene, from GSTO 1, which most likely associated with risk only because of high LD.
Fourth, although not crucial for detection of all effects, it was important that our study sampled disease tissue. In this study, over half the LOAD-associated effects that we detected were not seen in our screen using control tissue.7 This could be due to differences in power between the first screen and our second screen, which was approximately double the sample size; however, there is the possibility that there are effects specific to disease tissue. To examine these outcomes, we performed a bootstrap analysis to create from the control cohort data a data set that was equal to the total cohort sample size in our LOAD screen (n = 364). Comparison of the permuted control data set to our entire cohort showed that there were few differences in the profiles of the two samples (see Table S3). We then tested whether within this larger control cohort we could detect our LOAD effects. We stratified the results into those that had a significant interaction term in our 2 df model (LOAD set n = 665, α = 0.05) and those that were significant for allele dosage but did not have a diagnosis effect (non-LOAD set n = 1820, α = 0.05). The bootstrap sample captured all of the non-LOAD set effects at an α = 0.001 and 95% at an α = 1 × 10⁻⁷, which was the minimum p value that is able to survive the permutation correction. We were able to detect a much smaller portion of the effects with a significant interaction term, capturing only 66% of the LOAD set at an α = 0.001. Results are shown in Figure 4 and Tables S3 and S4. This suggests that mapping disease-associated regulatory loci is more efficient and effective if the sampling cohort includes samples with known disease phenotypes; however, it is of note that we did capture LOAD effects in control tissue; thus, for preliminary screens, disease phenotypes might not be an issue.
Figure 4.
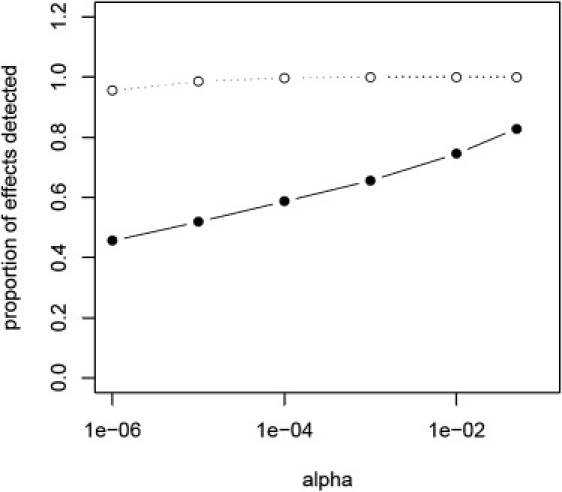
SNP-Transcripts Specific to Disease Are More Likely to Be Discovered in a Cohort with Disease-Specific Samples
The proportion of effects that we could detect from our current study, utilizing brains from LOAD cases and nondemented controls, in a sample of equal size (n = 364) generated by bootstrapping our control data is plotted. The alpha cutoff is plotted on the x axis and the proportion of effects detected is on the y axis. The proportion of eQTLs detected of those that showed a significant diagnosis interaction (α = 0.05 for the interaction term in our 2 df model) is shown by the filled circles and solid line. The proportion detected of those that did not have a significant diagnosis effect (interaction term p value ≥ 0.05) is shown by the open circles and dotted line. Counts and alphas used to generate this graph are given in Table S4.
Finally, the full public release of these data constitutes a resource to the community of researchers working on this prevalent and devastating disease. The data files and sample information used in generating the analysis for this paper are available at the website of A.J.M. Additional genotype files are available at the Translational Genomics Research Institute website. Additional expression data and information have been deposited in NCBI's Gene Expression Omnibus (GEO GSE15222). DNA from the samples employed in this screen is available on request through the National Cell Repository for Alzheimer's Disease for fine mapping of particular effects.
Supplemental Data
Supplemental Data include Supplemental Acknowledgments, three figures, and four tables and can be found with this article online at http://www.ajhg.org/.
Supplemental Data
Document S1. Supplemental Acknowledgments, Three Figures, and Four Tables
Table S5. Transcript-SNP Pairs with a Significant Effect of Diagnosis
This table shows the list of transcript and SNP pairs that had transcript-specific empirically significant p values by our 2 df model and where there was a significant diagnosis interaction term. Listed on this and Table S6 are the associated transcripts (gene), the GI illumina probe identifiers (probe id), the detection rate in cases (det cases), the detection rate in controls (det controls), the transcript chromosome (chr), whether the SNP was in cis or trans to the correlated transcript (cis/trans), the dbSNP rs number or Affymetrix identifier (SNP id), the SNP chromosome (SNP chr), the basepair location of the SNP (SNP position), the SNP position relative to the transcription start site (pos_TSS; NA indicates that the SNP is in trans), the closest gene to the SNP (SNP locus; — indicates that there is no gene near the SNP), the uncorrected p values for the 2 df model (raw pv), the p values after correction of the 2 df model with 1000 permutations (1K pv), p values for the interaction term in the 2 df model (pv inter), p values from exact chi-square tests examining SNP distributions in cases and controls (pv chi), the LD (if any) between polymorphisms located in the hybridization probe and the SNP (LD; “no value” means that there was no polymorphism in the probe), actual A and B alleles for SNP (A allele, B allele), the minor-allele frequencies for controls (MAF CO) and cases (MAF CA), the slope values for the 2 df model in cases (β cases) and controls (β controls), and the adjusted correlation coefficients for determining the portion of the expression variance explained by the SNP in each cohort (r2adj CO and r2adj CA).
Table S6. Transcript-SNP Pairs without a Significant Diagnosis Interaction
This table lists cis transcript and SNP pairs that had transcript-specific empirically significant p values by our 2 df model and where the diagnosis interaction term was not significant. All headers are as in Table S5.
Web Resources
The URLs for data presented herein are as follows:
- A.J.M.'s personal website, http://labs.med.miami.edu/myers/
- Alzgene database, http://www.alzgene.com
- Blat, http://genome.ucsc.edu/cgi-bin/hgBlat?command=start
- DAVID suite of programs, http://david.abcc.ncifcrf.gov/home.jsp
- Entrez, http://www.ncbi.nlm.nih.gov/sites/entrez?db=gene
- Hapmap, http://www.hapmap.org
- National Cell Repository for Alzheimer's Disease, http://ncrad.iu.edu/
- NACC protocols, http://www.alz.washington.edu
- NCBI's Gene Expression Omnibus, http://www.ncbi.nlm.nih.gov/geo/
- Online Mendelian Inheritance in Man (OMIM), http://www.ncbi.nlm.nih.gov/omim/
- PLINK analysis toolkit, http://pngu.mgh.harvard.edu/∼purcell/plink/index.shtml
- R suite of software, http://www.r-project.org/
- Translational Genomics Research Institute website, http://www.tgen.org/
Acknowledgments
We would like to dedicate this work to our colleague Christopher Heward, who died during this study. We thank the brain donors and their families. Many data and biomaterials were collected from several National Institute on Aging (NIA)- and National Alzheimer's Coordinating Center (NACC, grant U01 AG016976)-funded sites. Marcelle Morrison-Bogorad, Tony Phelps, Marilyn Miller and Walter Kukull are thanked for helping to coordinate the brain and data collection.
The directors, pathologists, and technicians involved include: Ruth Seemann, Juan C. Troncoso, Olga Pletnikova, Harry Vinters, Justine Pomakian, Christine Hulette, John F. Ervin, Dikran Horoupian, Ahmad Salehi, Jean Paul Vonsattel, Katerina Mancevska, E. Tessa Hedley-Whyte, Karlotta Fitch, Roger Albin, Andrew Lieberman, Lisa Bain, Eszter Gombosi, William Markesbery, Sonya Anderson, Dennis W. Dickson, Natalie Thomas, Caroll A. Miller, Jenny Tang, Dimitri Diaz, Dan McKeel, John C. Morris, Eugene Johnson, Virginia Buckles, Deborah Carter, Thomas Montine, Aimee Schantz, John Q Trojanowski, Virginia M Lee, Vivianna Van Deerlin, Terry Schuck, Ann C. McKee, Carol Kubilus, Joseph Rogers, Thomas G. Beach, Lucia I. Sue, Bruce H. Wainer, Marla Gearing, Charles L. White, III, Roger Rosenberg, Marilyn Howell, Joan Reisch, William Ellis, Mary Ann Jarvis, David A. Bennett, Julie A. Schneider, Karen Skish, Wayne T Longman, Deborah C. Mash, Margaret J Basile, and Mitsuko Tanaka.
Funding sources and site affiliations listed in the Supplemental Acknowledgements. None of the sponsors were involved in the design or conduct of the study, in the collection, analysis, and interpretation of the data, or in the preparation, review, or approval of the manuscript.
References
- 1.Schadt E.E. Exploiting naturally occurring DNA variation and molecular profiling data to dissect disease and drug response traits. Curr. Opin. Biotechnol. 2005;16:647–654. doi: 10.1016/j.copbio.2005.10.005. [DOI] [PubMed] [Google Scholar]
- 2.Dixon A.L., Liang L., Moffatt M.F., Chen W., Heath S., Wong K.C., Taylor J., Burnett E., Gut I., Farrall M. A genome-wide association study of global gene expression. Nat. Genet. 2007;39:1202–1207. doi: 10.1038/ng2109. [DOI] [PubMed] [Google Scholar]
- 3.Göring H.H., Curran J.E., Johnson M.P., Dyer T.D., Charlesworth J., Cole S.A., Jowett J.B., Abraham L.J., Rainwater D.L., Comuzzie A.G. Discovery of expression QTLs using large-scale transcriptional profiling in human lymphocytes. Nat. Genet. 2007;39:1208–1216. doi: 10.1038/ng2119. [DOI] [PubMed] [Google Scholar]
- 4.Moffatt M.F., Kabesch M., Liang L., Dixon A.L., Strachan D., Heath S., Depner M., von Berg A., Bufe A., Rietschel E. Genetic variants regulating ORMDL3 expression contribute to the risk of childhood asthma. Nature. 2007;448:470–473. doi: 10.1038/nature06014. [DOI] [PubMed] [Google Scholar]
- 5.Emilsson V., Thorleifsson G., Zhang B., Leonardson A.S., Zink F., Zhu J., Carlson S., Helgason A., Walters G.B., Gunnarsdottir S. Genetics of gene expression and its effect on disease. Nature. 2008;452:423–428. doi: 10.1038/nature06758. [DOI] [PubMed] [Google Scholar]
- 6.Schadt E.E., Molony C., Chudin E., Hao K., Yang X., Lum P.Y., Kasarskis A., Zhang B., Wang S., Suver C. Mapping the genetic architecture of gene expression in human liver. PLoS Biol. 2008;6:e107. doi: 10.1371/journal.pbio.0060107. [DOI] [PMC free article] [PubMed] [Google Scholar]
- 7.Myers A.J., Gibbs J.R., Webster J.A., Rohrer K.C., Zhao A.S., Marlowe L., Kaleem M., Leung D., Bryden L., Nath P. A Survey of Genetic Human Cortical Gene Expression. Nat. Genet. 2007;39:1494–1499. doi: 10.1038/ng.2007.16. [DOI] [PubMed] [Google Scholar]
- 8.Ge X., Yamamoto S., Tsutsumi S., Midorikawa Y., Ihara S., Wang S.M., Aburatani H. Interpreting expression profiles of cancers by genome-wide survey of breadth of expression in normal tissues. Genomics. 2005;86:127–141. doi: 10.1016/j.ygeno.2005.04.008. [DOI] [PubMed] [Google Scholar]
- 9.Shyamsundar R., Kim Y.H., Higgins J.P., Montgomery K., Jorden M., Sethuraman A., van de Rijn M., Botstein D., Brown P.O., Pollack J.R.A. DNA microarray survey of gene expression in normal human tissues. Genome Biol. 2005;6:R22. doi: 10.1186/gb-2005-6-3-r22. [DOI] [PMC free article] [PubMed] [Google Scholar]
- 10.Braak H., Braak E. Staging of Alzheimer's disease-related neurofibrillary changes. Neurobiol. Aging. 1995;16:271–278. doi: 10.1016/0197-4580(95)00021-6. [DOI] [PubMed] [Google Scholar]
- 11.Reiman E.M., Webster J.A., Myers A.J., Hardy J., Dunckley T., Zismann V.L., Joshipura K.D., Pearson J.V., Hu-Lince D., Huentelman M.J. GAB2 alleles modify Alzheimer's risk in APOE epsilon4 carriers. Neuron. 2007;54:713–720. doi: 10.1016/j.neuron.2007.05.022. [DOI] [PMC free article] [PubMed] [Google Scholar]
- 12.Coon K.D., Myers A.J., Craig D.W., Webster J.A., Pearson J.V., Lince D.H., Zismann V.L., Beach T.G., Leung D., Bryden L. A High Density Whole-Genome Association Study reveals that APOE is the major susceptibility gene for sporadic late-onset Alzheimer's disease. J. Clin. Psychiatry. 2007;68:613–618. doi: 10.4088/jcp.v68n0419. [DOI] [PubMed] [Google Scholar]
- 13.Hua J., Craig D.W., Brun M., Webster J., Zismann V., Tembe W., Joshipura K., Huentelman M.J., Dougherty E.R., Stephan D.A. SNiPer-HD: Improved genotype calling accuracy by an expectation-maximization algorithm for high-density SNP arrays. Bioinformatics. 2007;23:57–63. doi: 10.1093/bioinformatics/btl536. [DOI] [PubMed] [Google Scholar]
- 14.Purcell S., Neale B., Todd-Brown K., Thomas L., Ferreira M.A., Bender D., Maller J., Sklar P., de Bakker P.I., Daly M.J. PLINK: A tool set for whole-genome association and population-based linkage analyses. Am. J. Hum. Genet. 2007;81:559–575. doi: 10.1086/519795. [DOI] [PMC free article] [PubMed] [Google Scholar]
- 15.Workman C., Jensen L.J., Jarmer H., Berka R., Gautier L., Nielser H.B., Saxild H.H., Nielsen C., Brunak S., Knudsen S. A new non-linear normalization method for reducing variability in DNA microarray experiments. Genome Biol. 2002;3 doi: 10.1186/gb-2002-3-9-research0048. research0048. [DOI] [PMC free article] [PubMed] [Google Scholar]
- 16.Schadt E.E., Li C., Ellis B., Wong W.H. Feature extraction and normalization algorithms for high-density oligonucleotide gene expression array data. J. Cell. Biochem. Suppl. 2001;37:120–125. doi: 10.1002/jcb.10073. [DOI] [PubMed] [Google Scholar]
- 17.Tseng G.C., Oh M.K., Rohlin L., Liao J.C., Wong W.H. Issues in cDNA microarray analysis: Quality filtering, channel normalization, models of variations and assessment of gene effects. Nucleic Acids Res. 2001;29:2549–2557. doi: 10.1093/nar/29.12.2549. [DOI] [PMC free article] [PubMed] [Google Scholar]
- 18.Pritchard J.K., Stephens M., Rosenberg N.A., Donnelly P. Inference of population structure using multilocus genotype data. Genetics. 2000;155:945–959. doi: 10.1093/genetics/155.2.945. [DOI] [PMC free article] [PubMed] [Google Scholar]
- 19.Falush D., Stephens M., Pritchard J.K. Inference of population structure using multilocus genotype data: Linked loci and correlated allele frequencies. Genetics. 2003;164:1567–1587. doi: 10.1093/genetics/164.4.1567. [DOI] [PMC free article] [PubMed] [Google Scholar]
- 20.Fisher R.A. On the interpretation of χ2 from contingency tables, and the calculation of P. J. R. Stat. Soc. [Ser A] 1922;85:87–94. [Google Scholar]
- 21.Tusher V.G., Tibshirani R., Chu G. Significance analysis of microarrays applied to the ionizing radiation response. Proc. Natl. Acad. Sci. USA. 2001;98:5116–5121. doi: 10.1073/pnas.091062498. [DOI] [PMC free article] [PubMed] [Google Scholar]
- 22.Ruan J., Zhang W. Identifying network communities with a high resolution. Phys. Rev. E Stat. Nonlin. Soft Matter Phys. 2008;77:016104. doi: 10.1103/PhysRevE.77.016104. [DOI] [PubMed] [Google Scholar]
- 23.Dennis G., Sherman B.T., Hosack D.A., Yang J., Gao W., Lane H.C., Lempicki R.A. DAVID: Database for annotation, visualization, and integrated discovery. Genome Biol. 2003;4:3. [PubMed] [Google Scholar]
- 24.Hosack D.A., Dennis G., Sherman B.T., Lane H.C., Lempicki R.A. Identifying biological themes within lists of genes with EASE. Genome Biol. 2003;4:4. doi: 10.1186/gb-2003-4-10-r70. [DOI] [PMC free article] [PubMed] [Google Scholar]
- 25.Aten J.E., Fuller T.F., Lusis A.J., Horvath S. Using genetic markers to orient the edges in quantitative trait networks: the NEO software. BMC Syst Biol. 2008;2:34. doi: 10.1186/1752-0509-2-34. [DOI] [PMC free article] [PubMed] [Google Scholar]
- 26.Muller P.Y., Janovjak H., Miserez A.R., Dobbie Z. Processing of gene expression data generated by quantitative real-time RT-PCR. Biotechniques. 2002;32:1372–1379. [PubMed] [Google Scholar]
- 27.Ludbrook J. On making multiple comparisons in clinical and experimental pharmacology and physiology. Clin. Exp. Pharmacol. Physiol. 1991;18:379–392. doi: 10.1111/j.1440-1681.1991.tb01468.x. [DOI] [PubMed] [Google Scholar]
- 28.Miller J.A., Oldham M.C., Geschwind D.H. A systems level analysis of transcriptional changes in alzheimer's disease and normal aging. J. Neurosci. 2008;28:1410–1420. doi: 10.1523/JNEUROSCI.4098-07.2008. [DOI] [PMC free article] [PubMed] [Google Scholar]
- 29.Zotenko E., Mestre J., O'Leary D.P., Przytycka T.M. Why do hubs in the yeast protein interaction network tend to be essential: reexamining the connection between the network topology and essentiality. PLoS Comput Biol. 2008;4:e1000140. doi: 10.1371/journal.pcbi.1000140. [DOI] [PMC free article] [PubMed] [Google Scholar]
- 30.Myers A.J., Pittman A.M., Zhao A.S., Rohrer K., Kaleem M., Marlowe L., Lees A., Leung D., McKeith I.G., Perry R.H. The MAPT H1c risk haplotype is associated with increased expression of tau and especially of 4 repeat containing transcripts. Neurobiol. Dis. 2007;25:561–570. doi: 10.1016/j.nbd.2006.10.018. [DOI] [PubMed] [Google Scholar]
- 31.Lambert J.C., Goumidi L., Vrièze F.W., Frigard B., Harris J.M., Cummings A., Coates J., Pasquier F., Cottel D., Gaillac M. The transcriptional factor LBP-1c/CP2/LSF gene on chromosome 12 is a genetic determinant of Alzheimer's disease. Hum. Mol. Genet. 2000;9:2275–2280. doi: 10.1093/oxfordjournals.hmg.a018918. [DOI] [PubMed] [Google Scholar]
- 32.Hamshere M.L., Holmans P.A., Avramopoulos D., Bassett S.S., Blacker D., Bertram L., Wiener H., Rochberg N., Tanzi R.E., Myers A. Genome-wide linkage analysis of 723 affected relative pairs with late-onset Alzheimer's disease. Hum. Mol. Genet. 2007;16:2703–2712. doi: 10.1093/hmg/ddm224. [DOI] [PubMed] [Google Scholar]
- 33.Li Y.J., Oliveira S.A., Xu P., Martin E.R., Stenger J.E., Scherzer C.R., Hauser M.A., Scott W.K., Small G.W., Nance M.A. Glutathione S-transferase omega-1 modifiesage-at-onset of Alzheimer disease and Parkinson disease. Hum. Mol. Genet. 2003;12:3259–3267. doi: 10.1093/hmg/ddg357. [DOI] [PubMed] [Google Scholar]
- 34.Cheung V.G., Spielman R.S., Ewens K.G., Weber T.M., Morley M., Burdick J.T. Mapping determinants of human gene expression by regional and genome-wide association. Nature. 2005;437:1365–1369. doi: 10.1038/nature04244. [DOI] [PMC free article] [PubMed] [Google Scholar]
- 35.Wool I.G. Extraribosomal functions of ribosomal proteins. Trends Biochem. Sci. 1996;21:164–165. [PubMed] [Google Scholar]
- 36.Nunez E., Kwon Y.S., Hutt K.R., Hu Q., Cardamone M.D., Ohgi K.A., Garcia-Bassets I., Rose D.W., Glass C.K., Rosenfeld M.G. Nuclear receptor-enhanced transcription requires motor- and LSD1-dependent gene networking in interchromatin granules. Cell. 2008;132:996–1010. doi: 10.1016/j.cell.2008.01.051. [DOI] [PubMed] [Google Scholar]
- 37.O'Regan S., Traiffort E., Ruat M., Cha N., Compaore D., Meunier F.M. An electric lobe suppressor for a yeast choline transport mutation belongs to a new family of transporter-like proteins. Proc. Natl. Acad. Sci. USA. 2000;97:1835–1840. doi: 10.1073/pnas.030339697. [DOI] [PMC free article] [PubMed] [Google Scholar]
- 38.Hardy J. A hundred years of Alzheimer's disease research. Neuron. 2006;52:3–13. doi: 10.1016/j.neuron.2006.09.016. [DOI] [PubMed] [Google Scholar]
- 39.Bartus R.T., Dean R.L., Beer B., Lippa A.S. The cholinergic hypothesis of geriatric memory dysfunction. Science. 1982;217:408–414. doi: 10.1126/science.7046051. [DOI] [PubMed] [Google Scholar]
- 40.Schliekelman P. Statistical power of expression quantitative trait loci for mapping of complex trait loci in natural populations. Genetics. 2008;178:2201–2216. doi: 10.1534/genetics.107.076687. [DOI] [PMC free article] [PubMed] [Google Scholar]
- 41.Wray N.R., Goddard M.E., Visscher P.M. Prediction of individual genetic risk to disease from genome-wide association studies. Genome Res. 2007;17:1520–1528. doi: 10.1101/gr.6665407. [DOI] [PMC free article] [PubMed] [Google Scholar]
- 42.Laws S.M., Friedrich P., Diehl-Schmid J., Müller J., Eisele T., Bäuml J., Förstl H., Kurz A., Riemenschneider M. Fine mapping of the MAPT locus using quantitative trait analysis identifies possible causal variants in Alzheimer's disease. Mol. Psychiatry. 2007;12:510–517. doi: 10.1038/sj.mp.4001935. [DOI] [PubMed] [Google Scholar]
- 43.Kauwe J.S., Cruchaga C., Mayo K., Fenoglio C., Bertelsen S., Nowotny P., Galimberti D., Scarpini E., Morris J.C., Fagan A.M. Variation in MAPT is associated with cerebrospinal fluid tau levels in the presence of amyloid-beta deposition. Proc. Natl. Acad. Sci. USA. 2008;105:8050–8054. doi: 10.1073/pnas.0801227105. [DOI] [PMC free article] [PubMed] [Google Scholar]
- 44.Bertram L., McQueen M.B., Mullin K., Blacker D., Tanzi R.E. Systematic meta-analyses of Alzheimer disease genetic association studies: The AlzGene database. Nat. Genet. 2007;39:17–23. doi: 10.1038/ng1934. [DOI] [PubMed] [Google Scholar]
Associated Data
This section collects any data citations, data availability statements, or supplementary materials included in this article.
Supplementary Materials
Document S1. Supplemental Acknowledgments, Three Figures, and Four Tables
Table S5. Transcript-SNP Pairs with a Significant Effect of Diagnosis
This table shows the list of transcript and SNP pairs that had transcript-specific empirically significant p values by our 2 df model and where there was a significant diagnosis interaction term. Listed on this and Table S6 are the associated transcripts (gene), the GI illumina probe identifiers (probe id), the detection rate in cases (det cases), the detection rate in controls (det controls), the transcript chromosome (chr), whether the SNP was in cis or trans to the correlated transcript (cis/trans), the dbSNP rs number or Affymetrix identifier (SNP id), the SNP chromosome (SNP chr), the basepair location of the SNP (SNP position), the SNP position relative to the transcription start site (pos_TSS; NA indicates that the SNP is in trans), the closest gene to the SNP (SNP locus; — indicates that there is no gene near the SNP), the uncorrected p values for the 2 df model (raw pv), the p values after correction of the 2 df model with 1000 permutations (1K pv), p values for the interaction term in the 2 df model (pv inter), p values from exact chi-square tests examining SNP distributions in cases and controls (pv chi), the LD (if any) between polymorphisms located in the hybridization probe and the SNP (LD; “no value” means that there was no polymorphism in the probe), actual A and B alleles for SNP (A allele, B allele), the minor-allele frequencies for controls (MAF CO) and cases (MAF CA), the slope values for the 2 df model in cases (β cases) and controls (β controls), and the adjusted correlation coefficients for determining the portion of the expression variance explained by the SNP in each cohort (r2adj CO and r2adj CA).
Table S6. Transcript-SNP Pairs without a Significant Diagnosis Interaction
This table lists cis transcript and SNP pairs that had transcript-specific empirically significant p values by our 2 df model and where the diagnosis interaction term was not significant. All headers are as in Table S5.