Human Splicing Finder: an online bioinformatics tool to predict splicing signals (original) (raw)
Abstract
Thousands of mutations are identified yearly. Although many directly affect protein expression, an increasing proportion of mutations is now believed to influence mRNA splicing. They mostly affect existing splice sites, but synonymous, non-synonymous or nonsense mutations can also create or disrupt splice sites or auxiliary _cis_-splicing sequences. To facilitate the analysis of the different mutations, we designed Human Splicing Finder (HSF), a tool to predict the effects of mutations on splicing signals or to identify splicing motifs in any human sequence. It contains all available matrices for auxiliary sequence prediction as well as new ones for binding sites of the 9G8 and Tra2-β Serine-Arginine proteins and the hnRNP A1 ribonucleoprotein. We also developed new Position Weight Matrices to assess the strength of 5′ and 3′ splice sites and branch points. We evaluated HSF efficiency using a set of 83 intronic and 35 exonic mutations known to result in splicing defects. We showed that the mutation effect was correctly predicted in almost all cases. HSF could thus represent a valuable resource for research, diagnostic and therapeutic (e.g. therapeutic exon skipping) purposes as well as for global studies, such as the GEN2PHEN European Project or the Human Variome Project.
INTRODUCTION
Since its discovery more than three decades ago (1), mRNA splicing is the focus of many studies both in fundamental and applied research. Splicing is part of the pre-mRNA maturation process that occurs in each eukaryotic cell between mRNA transcription from DNA and its translation into protein. During this event, parts of the pre-mRNA transcripts are removed in a ribonucleoprotein complex (spliceosome) which is constituted of five essential small nuclear RNAs and more than 150 polypeptides (2,3). Depending on tissue localization and/or stage of development, pre-mRNA transcripts may be differentially spliced, allowing several transcripts to be built and thus different proteins to be synthesized from the same gene. A prime example of this phenomenon is the Troponin T gene for which 64 different mRNAs have been described (4). This process is called alternative splicing and it is estimated that more than 70% of human protein-coding genes are alternatively spliced (5). Understanding how splicing is regulated is thus crucial, particularly in a medical context, since genomic variations which cause aberrant splicing may represent up to 50% of all mutations that lead to gene dysfunction (6). Mutations can indeed not only alter directly the sequence that will be translated into protein, for instance, base substitutions can change a codon for an amino acid into another one or into a premature termination codon (PTC), but can also affect splicing and, as a consequence, lead to the appearance of truncated proteins or to the lack of the correct gene product.
How are exons and introns recognized during the splicing process? Exon definition (7) is the identification of splice sites located at the 5′ and 3′ ends of exon–intron–exon junctions (5′ss and 3′ss also known as donor and acceptor splice site, respectively). At 3′ end of introns, a branch point sequence and a polypyrimidine tract, which are situated upstream the 3′ss, are also used as consensus elements. These consensus sequences have probably evolved from ancestral common sequences as it has been reported for the 5′ site with the AG/guaagu prototype sequence whose eight contiguous nucleotides are complementary to nucleotides 4–11 of U1RNA (8). The divergence of splice site sequences from the prototypes has been closely associated with the creation of alternative transcripts. Moreover, in higher eukaryotes, these highly degenerated motifs can also be found in most introns, framing pseudo-exons. Pseudo-exons are intronic sequences of typical exon size that outnumber real exons and are bounded by sequences that match the 5′ and 3′ splicing signal requirements of an exon, but that are never considered as proper exons by the spliceosome. Furthermore, human transcripts contain many ‘decoy’ splice sites that are seldom used. So, while 5′ and 3′ splicing signals are mandatory for exon definition, they are not sufficient for correct splicing. In order to reliably distinguish authentic exons and splice sites from pseudo-exons and decoy splice sites, the splicing machinery must rely on auxiliary sequence features, such as intronic and exonic _cis_-elements. Among them, the Exonic Splicing Enhancers (ESEs) are the most studied. They are specific short nucleotide sequences that are targeted essentially by Serine/Argine-rich (SR) proteins which then promote exon definition (9). Conversely, the Exonic Splicing Silencers (ESSs) help the spliceosome to ignore pseudo-exons and decoy splice sites. They act as binding sites for proteins promoting exon exclusion (mainly hnRNP proteins) (10). Intronic Splicing Enhancers (ISEs) and Intronic Splicing Silencers (ISSs) are intronic _cis_-elements that play similar roles as ESEs and ESSs.
Several bioinformatics tools to study or predict splice signals have been developed and are today available online. Their approaches can vary (11) from using blastn to align a query sequence to a database of alternative splicing events and splice signals (12) to an ab initio prediction approach (13). Despite the quality of these tools and because of the complexity of sequence signals harbored by any mRNA sequence, new tools are needed to simultaneously identify putative donor and acceptor splice sites, branch points and _cis_-acting elements (ESE, ESS, ISE and ISS). In addition, since many human disease-causing mutations affect splicing, new bioinformatics tools should also be able to predict the consequence of mutations on splice signals. Such tool could be of great value not only for geneticists to better understand splicing events and the effect of mutations on mRNA splicing, but also for clinical researchers to design new therapeutic approaches based on splicing interference, such as the exon-skipping strategy used in Duchenne Muscular Dystrophy (DMD) (14) or gene and exon silencing through manipulation of mRNA splicing (15).
In this article, we present a new bioinformatics tool, the Human Splicing Finder (HSF) software that is freely available online (http://www.umd.be/HSF/). It includes new algorithms derived from the Universal Mutation Database (UMD) (16,17) to allow the evaluation of the strength of 5′ss, 3′ss and branch points. In addition, in order to identify _cis_-acting elements it includes already published algorithms, such as the RESCUE-ESE (18) and ESE-Finder (19) as well as new algorithms designed to use available or newly created matrices. To allow the study of virtually any human sequence, HSF includes all genes and alternative transcripts as well as intronic sequences that were extracted from the Ensembl human genome database (http://www.ensembl.org/) (20). To evaluate the predictive potential of HSF web interface (version 2.4; http://www.umd.be/HSF/), we used a set of mutations for which the effect on splicing has been experimentally demonstrated.
MATERIAL AND METHODS
Software development and database design
HSF was developed using the 4D package (4D S.A.) for data management, algorithm design and web interface. The HSF database was designed to include the introns and exons of all human genes. It was constructed from an Ensembl dataset (20) containing more than 22 000 genes and 46 000 transcripts of Homo sapiens (release 44, http://april2007.archive.ensembl.org) using Biomart (20). Genes were created from the crude dataset using both Ensembl transcript coordinates and sequences from the UCSC genome browser database (21). At present, HSF database only contains human genes, since matrices and tools were specifically designed for the human genome.
To study the potential effects of single nucleotide polymorphisms (SNPs) on splicing, HSF also harbors data extracted from the Ensembl Variation database (20). For this, a Perl script was developed, using Ensembl Perl API that allows HSF to directly query the Ensembl Variation database and retrieve SNPs located in human genes.
Splicing donor/acceptor sites
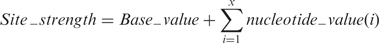
To predict potential 5′ss and 3′ss, we used matrices derived from Shapiro and Senapathy (22). A potential splice site is defined as an _n_-mer sequence. For each ‘n’ position, a weight is given to each nucleotide, based on its frequency and the relative importance of its position in the sequence motif (position weight matrices, PWM). The strength of a site is thus defined as the sum of each nucleotide's weight plus a constant (Equation 1) that is used for normalization. Only _n_-mer sequences with consensus values (CV) higher or equal to a given threshold are considered as potential 5′ or 3′ss.
Since the human 5′ consensus sequence is [C/A]AG/gt[a/g]agt, we defined the 5′ss as a 9-mer matrix. Similarly, the 3′ss was defined as a 14-mer matrix. Calculation of the strength of a potential splice site. For 5′ss x = 9 and for 3′ss x = 14.
HSF also includes an algorithm adapted from the MaxEnt script (23) that allows the analysis of a whole sequence. In addition, for this matrix, users can define thresholds for splice site prediction.
Branch point sequences
Since the human branch point (BP) consensus sequence is YNYCRAY (24), we defined the BP sequence as a 7 × 4 position weight matrix (Figure 1). The threshold for BP sequences was fixed at 67. The strength of a BP sequence was thus calculated as follows (Equation 2):

Since many intronic sequences match the BP consensus sequence, we included the AG-Exclusion Zone algorithm described by Gooding et al. (25) to predict BP candidates. For a given intronic sequence and its intron-exon boundary, HSF searches all AG dinucleotides that are included in a 3′ss candidate sequence (threshold of 67) and therefore define the exclusion zones. As it has been shown that the BP allows the recognition of the first downstream 3′ss, HSF annotates the functional BP as the strongest candidate without a 3′-exclusion zone before the natural 3′ss.
Figure 1.

Branch point matrix. The size of each nucleotide is proportional to its weight in the position weight matrix. Nucleotides above the base line have positive values while nucleotides below have negative values.
Additionally, to take into account the steric obstruction caused by the spliceosome, we excluded BP sequences located at less than 12 nt from the exon. Finally, as most BP sequences are located between −21 and −34 nt from the exon (26), only a window of 100 bp is processed. We arbitrarily excluded the probability of having a BP motif located very far away in order to save computation time.
Matrices for splicing enhancers and silencers
To maximize the detection of auxiliary motifs, HSF integrated: (i) matrices for SR proteins (SRp40, SC35, SF2/ASF, SF2/ASF IgM/BRCA1 and SRp55) from the ESE Finder tool (19,27); (ii) sequence motifs shown to be differentially present in exons and introns, such as the RESCUE-ESE hexamers (18), the putative 8-mer ESE and ESS identified by Zhang and Chasin (28), the ESR sequences identified by Goren and co-workers (29) and the exon-identity elements (EIE) and intron-identity elements (IIE) defined by Zhang and co-workers (30). For the silencer sequences identified by Sironi and colleagues (31) and the ESS decamers (32), for which no web-based tool were available, we developed new algorithms to use the crude data.
New matrices were also created to predict hnRNP A1, Tra2-β and 9G8 protein binding motifs. These matrices were designed using published data collected from SELEX experiments and consensus sequences. Sequences were aligned with ClustalW (33) to generate a consensus motif. Note that these motifs were too short to be processed with MEME (34). The consensus sequences were then used to design PWM matrices (Figure 2).
Figure 2.
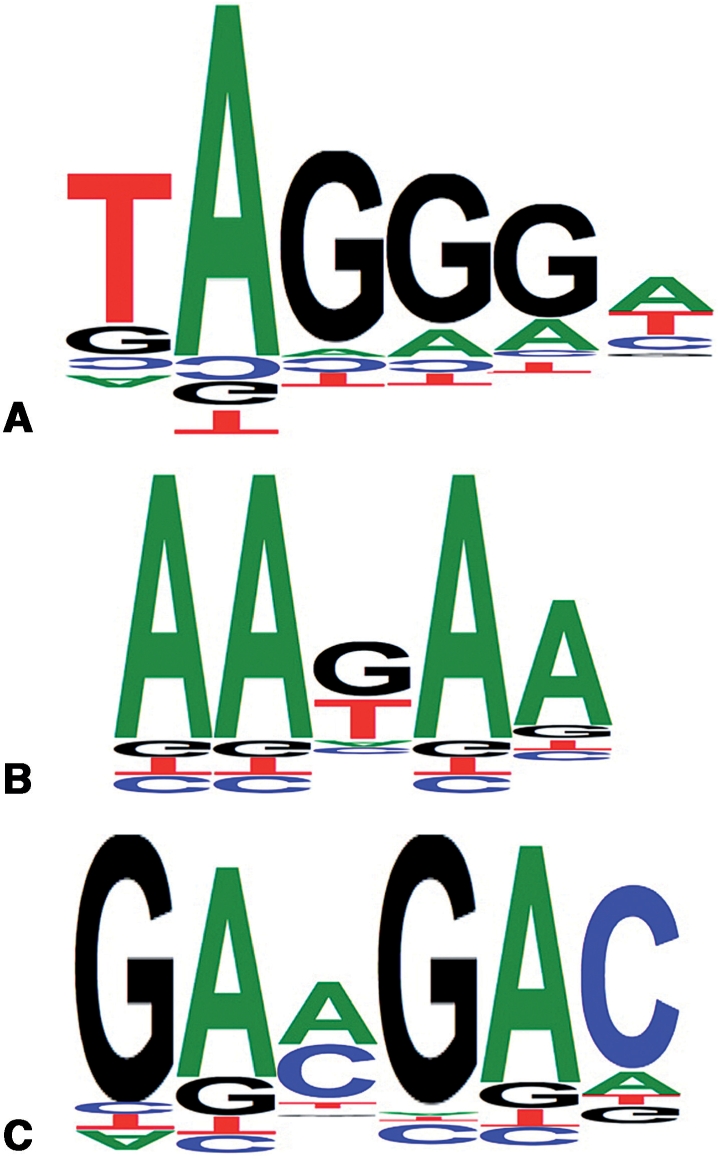
New position weight matrices of recognition motifs for proteins involved in splicing. (A) hnRNP A1; (B) Tra2-β and (C) 9G8.
Sequence datasets used to evaluate HSF efficiency
To evaluate the new algorithms dedicated to the prediction of 5′ss and 3′ss, we used the Ensembl database (20) that contain 245.286 human exons (release 44, http://april2007.archive.ensembl.org). For BP predictions, we used a set of 14 experimentally validated BPs (Table 3). These datasets were completed by 69 intronic mutations (35–56) as well as 15 exonic mutations known to alter 5′ and 3′ss (57,58) and for whom the impact on mRNA splicing has been characterized in vivo or in vitro. To evaluate the ability to correctly predict ESE and ESS, we used a set of 20 experimentally validated mutations that affect splicing by a direct effect on ESE and/or ESS (58–66). In addition we used a set of 36 mutations previously reported to alter splicing (positive controls) and 220 SNPs (negative controls). The negative controls were extracted from the dbSNP database (http://www.ncbi.nlm.nih.gov/projects/SNP/) and corresponded to SNPs with the highest minor allele frequency and, therefore, had a minimal risk of affecting splicing. Conversely, the positive controls were chosen because experimental results showed that these mutations targeted auxiliary splicing sequence motifs. Nevertheless, in most cases the data about the exact motif and/or the protein that recognizes this motif were not available. For each mutation, we evaluated only its effects in terms of disruption of ESE or creation of ESS signals (Supplementary Table 1).
Table 3.
Branch point sequences
| Gene | Intron | References | Ref BP | Ref Seq | HSF BP | HSF value |
|---|---|---|---|---|---|---|
| COL5A1 | 32 | (93) | −27 | ENST00000355306 | −27 | 87.81 |
| DYSF | 31 | (94) | −33 | ENST00000258104 | −33 | 93.13 |
| FBN2 | 30 | (95) | −24 | ENST00000262464 | −24 | 77.06 |
| GH1 | 3 | (96) | −21 | ENST00000323322 | −26 | 73.36 |
| ITGB4 | 31 | (97) | −17 | ENST00000200181 | −17 | 93.79 |
| LCAT | 4 | (98) | −20 | ENST00000264005 | −20 | 95.07 |
| LDLR | 9 | (99) | −25 | ENST00000252444 | −25 | 86.59 |
| NPC1 | 6 | (100) | −28 | ENST00000269228 | −28 | 77.41 |
| PMM2 | 2 | (101) | −25 | ENST00000268261 | −25 | 80.56 |
| PMM2 | 7 | (101) | −23 | ENST00000268261 | −23 | 72.27 |
| RB1 | 23 | (57) | −26 | ENST00000267163 | −26 | 75.89 |
| TH | 11 | (102) | −22 | ENST00000324155 | −22 | 84.96 |
| TSC2 | 38 | (103) | −18 | ENST00000219476 | −18 | 67.71 |
| XPC | 3 | (76) | −24 | ENST00000285021 | −24 | 82.78 |
RESULTS
Web interface and database
HSF web interface was designed to maximize the perception of efficiency and easy of use by end users. Only default parameters are displayed on the submission form while skilled users can easily access advanced parameters. Sequences stored in the database can be queried using either the gene symbol, the Ensembl gene ID, the Ensembl transcript ID, the RefSeq peptide ID or the consensus CDS. In addition, users can process their own sequences, either for simple sequence analysis or mutant comparison. In addition, HSF can be queried in different ways: full analysis of a sequence, comparison of a mutant and a wild-type sequence, or simultaneous analysis of several mutants related, or not, to the same transcript. In this case all mutations should be referred to sequences included in the HSF database. In order to easily study a group of mutations from different genes and transcripts, the mutation must be described by using the international nomenclature system for cDNA mutations (67) (http://www.genomic.unimelb.edu.au/mdi/mutnomen/). HSF will then check that each mutation is correctly described and automatically reconstruct the mutant allele from the wild-type sequence and the mutation name. Since only small rearrangements (i.e. substitutions, small exonic or intronic deletions and insertions, duplications and indels) provide useful information about splicing defects, large rearrangements can not be processed by HSF.
Moreover, differently from previous resources, the user can specifically analyze BP sequences or splice site motifs using HSF specific matrices and algorithms.
The main result page was divided in three areas: the reference sequence(s), various graphical displays and tables. Since mutations could have different effects related to the local context, a ‘quick mutation’ option allows the addition of a small rearrangement (missense, deletion, insertion, duplication, indel) to the sequence(s).
Splicing donor/acceptor sites
The new HSF algorithm to define consensus values (CV) of 5′ss or 3′ss was created to maximize the difference between wild-type (wt) active sites and mutant inactive sites. Thus, strong sites presented a CV higher than 80 and less strong sites a CV ranging between 70 and 80. Only a minor fraction of active sites showed a CV between 65 and 70 (Figure 3). The mean CV for 3′ss was 86.81 with a standard deviation of 6.33 while the mean CV for 5′ss was 87.53 with a standard deviation of 8.34. These values were calculated from more than 400 000 natural splice sites extracted from all alternative transcripts. If a mutation affects directly the CV, it is critical to consider not only the CV of the mutant splice site, but also the delta between the wt and mutant CV. To validate this algorithm, we used a set of 69 intronic mutations that affect either the canonical AG/GT splice site motifs or less conserved nucleotides (Table 1). All mutations affecting the nucleotides in canonical positions (−2, −1, +1 or +2) strongly influenced the CV value with an average reduction (ΔCV) of 31% and a standard deviation (SD) of 2.8%. Mutations affecting less conserved residues had a weaker effect with a ΔCV of 7% for the residue in position +4 and 14% for nucleotides in position +3 or +5. These results together with data from other disease-causing mutations (52,68,69) indicated that a ΔCV reduction of at least 10% for a mutation in any position or of 7% for a mutation in position +4 is likely to have a significant impact on splicing and should be further investigated.
Figure 3.

Distribution of CVs for (A) 3′ and (B) 5′ natural splice sites (5′ss and 3′ss). Data extracted from the Ensembl dataset (release 44, http://april2007.archive.ensembl.org) (20) using the HSF algorithm.
Table 1.
Intronic mutations in FBN1 (ENST00000316623), FBN2 (ENST00000262464), RB1 (ENST00000267163), TGFBR2 (ENST00000295754), MLH1 (ENST00000231790) and MSH2 (ENST00000233146) that lead to splicing defects
| Gene | Mutation | References | WT CV | Mutant CV | CV variation (%) |
|---|---|---|---|---|---|
| Mutations causing exon skipping | |||||
| FBN1 | c.247 + 1G>A | (37,46,49–51,53) | 82.26 | 55.42 | −32.62a |
| FBN1 | c.538 + 1G>A | (45) | 83.99 | 57.15 | −31.96a |
| FBN1 | c.1468 + 5G>A | (44) | 84.46 | 72.30 | −14.40a |
| FBN1 | c.3208 + 5G>T | (82) | 94.98 | 82.66 | −12.97a |
| FBN1 | c.3838 + 1G>A | (52) | 95.84 | 69.01 | −28.00a |
| FBN1 | c.3839 − 1G>T | (83) | 87.62 | 58.67 | −33.04a |
| FBN1 | c.3964 + 1G>A | (84,85) | 90.04 | 63.20 | −29.80a |
| FBN1 | c.3965 − 2A>T | (85) | 89.30 | 60.35 | −32.41a |
| FBN1 | c.4459 + 1G>A | (44) | 97.66 | 70.83 | −27.47a |
| FBN1 | c.4943 − 1G>C | (44) | 79.77 | 50.82 | −36.29a |
| FBN1 | c.5788 + 5G>A | (35,36,38,41,43,52,54,83) | 88.06 | 75.89 | −13.82a |
| FBN1 | c.6163 + 2del6 | (83) | 99.05 | 72.90 | −26.40a |
| FBN1 | c.6496 + 2insTG | (43) | 82.21 | 32.05 | −61.01a |
| FBN1 | c.6616 + 1G>C | (86) | 78.08 | 51.24 | −34.37a |
| FBN1 | c.6997 + 1G>A | (83) | 92.11 | 65.27 | −29.13a |
| FBN1 | c.7205 − 2A>G | (83) | 84.11 | 55.16 | −34.42a |
| FBN1 | c.7330 + 1G>A | (55) | 98.02 | 71.18 | −27.38a |
| FBN1 | c.7331 − 2A>G | (40) | 80.72 | 51.77 | −35.86a |
| FBN1 | c.8051 + 1G>A | (44) | 92.02 | 65.18 | −29.16a |
| FBN1 | c.8051 + 5G>A | (51) | 92.02 | 79.85 | −13.22a |
| FBN1 | c.8052 − 2A>G | (52) | 92.86 | 63.92 | −31.17a |
| FBN2 | c.3472 + 2T>G | (48) | 90.99 | 64.15 | −28.53a |
| FBN2 | c.4099 + 1G>C | (39) | 91.66 | 64.82 | −29.28a |
| FBN2 | c.4222 + 5G>A | (47) | 92.11 | 79.94 | −13.21a |
| FBN2 | c.4346 − 2A>T | (87) | 90.91 | 61.96 | −31.84a |
| RB1 | c.264 + 4delA | (57) | 91.34 | 84.93 | −7.01a |
| RB1 | c.380 + 3A>C | (57) | 95.10 | 78.82 | −17.12a |
| RB1 | c.607 + 1G>T | (57) | 99.05 | 72.21 | −27.09a |
| RB1 | c.939 + 4A>G | (57) | 83.75 | 75.41 | −9.96a |
| RB1 | c.1049 + 2delT | (57) | 76.95 | 57.00 | −25.90a |
| RB1 | c.1215 + 1G>A | (57) | 85.86 | 59.02 | −31.26a |
| RB1 | c.1389 + 1G>A | (57) | 82.69 | 55.86 | −32.45a |
| RB1 | c.1389 + 4A>G | (57) | 82.69 | 74.35 | −10.09a |
| RB1 | c.1389 + 5G>A | (57) | 82.69 | 70.53 | −14.71a |
| RB1 | c.1422 − 2A>T | (57) | 86.12 | 57.17 | −33.62a |
| RB1 | c.1422 − 1G>A | (57) | 86.12 | 57.17 | −33.62a |
| RB1 | c.1498 + 5G>A | (57) | 82.91 | 70.75 | −14.67a |
| RB1 | c.1960 + 1G>A | (57) | 94.02 | 67.19 | −28.54a |
| RB1 | c.1960 + 1delG | (57) | 94.02 | 49.62 | −47.22a |
| RB1 | c.2211 + 1G>T | (57) | 89.90 | 63.06 | −29.86a |
| RB1 | c.2212 − 2A>G | (57) | 89.09 | 60.15 | −32.48a |
| RB1 | c.2211 + 1G>C | (57) | 89.90 | 63.06 | −29.86a |
| RB1 | c.2520 + 1G>A | (57) | 92.22 | 65.39 | −29.10a |
| RB1 | c.2520 + 3del4 | (57) | 92.22 | 72.26 | −21.64a |
| RB1 | c.2663 + 1G>A | (57) | 88.37 | 61.54 | −30.36a |
| MLH1 | c.306 + 4A>G | (58) | 96.07 | 87.73 | −8.68a |
| MLH1 | c.454 − 2A>G | (59) | 93.59 | 64.64 | −28.80a |
| MLH1 | c.790 + 1G>A | (59) | 83.28 | 56.45 | −32.22a |
| MLH1 | c.790 + 5G>T | (58) | 83.28 | 70.97 | −14.79a |
| MLH1 | c.791 − 5T>G | (59) | 80.80 | 77.17 | −4.49 |
| MLH1 | c.884 + 4A>G | (58) | 85.75 | 77.41 | −9.73a |
| MSH2 | c.366 + 1G>T | (59) | 86.73 | 59.89 | −30.95a |
| MSH2 | c.793 − 2A>C | (59) | 83.98 | 55.04 | −34.46a |
| MSH2 | c.942 + 3A>T | (59) | 99.24 | 83.86 | −15.50a |
| MSH2 | c.1276 + 2T>A | (59) | 84.70 | 57.86 | −31.69a |
| MSH2 | c.1386 + 1G>A | (59) | 89.02 | 62.19 | −30.13a |
| MSH2 | c.2634 + 5G>T | (58) | 84.41 | 72.09 | −14.59a |
| Mutations resulting in the usage of cryptic splice sites | |||||
| FBN1 | c.2293 + 2T>C | (83) | 89.77 | 62.94 | −29.89 |
| 67.21 | 5′ CS (51 nt upstream)b | ||||
| FBN1 | c.3463 + 1G>A | (88) | 91.34 | 64.50 | −29.38 |
| 88.47 | 5′ CS (27 nt downstream)b | ||||
| FBN1 | c.4747 + 5G>T | (42) | 89.13 | 76.81 | −13.82 |
| 79.06 | 5′ CS (48 nt upstream)b | ||||
| FBN1 | c.5788 + 1G>A | (52) | 88.06 | 61.22 | −30.48 |
| 82.64 | 5′ CS (33 nt downstream)b | ||||
| RB1 | c.138 − 8T>G | (57) | 81.62 | 79.69 | −2.36 |
| 55.35 | 84.29 | 3′ CS (7 nt upstream)c | |||
| RB1 | c.501 − 1G>A | (57) | 97.50 | 68.55 | −29.69 |
| 54.82 | 83.77 | 3′ CS (1 nt downstream)c | |||
| RB1 | c.607 + 1delG | (57) | 99.05 | 22.54 | −77.24 |
| 42.51 | 88.47 | 5′ CS (1 nt upstream)c | |||
| RB1 | c.1815 − 2A>G | (57) | 75.42 | 46.47 | −38.39 |
| 81.84 | 3′ CS (19 nt downstream)b | ||||
| RB1 | c.2107 − 2A>G | (57) | 80.73 | 51.78 | −35.86 |
| 69.56 | 3′ CS (35 nt downstream)b | ||||
| TGFBR2 | c.95 − 2A>G | (56) | 91.77 | 62.82 | −31.55 |
| 68.28 | 3′ CS (18 nt downstream)b | ||||
| TGFBR2 | c.1397 − 2A>G | (89) | 92.32 | 63.38 | −31.35 |
| 84.32 | 3′ CS (30 nt upstream)b | ||||
| TGFBR2 | c.1397 − 1G>A | (90) | 92.32 | 63.38 | −31.35 |
| 84.32 | 3′ CS (30 nt upstream)b |
Since a mutation can result not only in the disruption of a 5′ss or a 3′ss, but also in the creation of a new splice site, HSF evaluates the ‘creation of cryptic splice sites’. As shown in Table 1 for intronic mutations, HSF correctly predicted the creation of cryptic splice sites in the RB1 mutants c.607 + 1delG, c.138-8T>G and c.501-1G>A. Mutations in canonical sequences, such as c.95-2A>G, c.1397-2A>G and c.1397-1G>A in TGFBR2, c.2293 + 2T>C, c.3463 + 1G>A, c.4747 + 5G>T and c.5788 + 1G>A in FBN1 and c.1815-2A>G, c.2107-2A>G and c.2211 + 1G>C in RB1, led to a more complex splicing defect in which disruption of the wt splice site was coupled to the usage of an alternative, pre-existing splice site. As mutations do not directly affect alternative splice sites, this phenomenon was not automatically investigated by HSF. Therefore, to identify the alternative splice sites, we chose in ‘_Select an analysis type_’ the option ‘_Number of nucleotides surrounding the exon_’ and entered the value ‘_100_’. In addition, we checked the advanced parameter ‘_Process sequence_’ and selected the ‘_Full sequence_’ option. To analyze only splice sites, we then selected in ‘_All or subset of matrices_’ the ‘_Splice site matrices_’ option. Using these parameters, all alternative sites were identified either as the closest and strongest alternative sites (five cases) or as the second-best sites (two cases). Overall, HSF correctly predicted the impact of mutations affecting 5′ss or 3′ss, even when complex mechanisms were involved.
In addition to splicing defects due to 5′ss or 3′ss disruption, it is well known that exonic mutations could result in the creation or activation of cryptic splice sites. As shown in Table 2, the nine mutations affecting the last base of an exon had a strong effect on the activity of the concerned 5′ss (ΔCV = 12% ± 0.7) that resulted in exon skipping or activation of a cryptic splice site. The two mutations affecting the penultimate nucleotide of an exon had a limited effect on the activity of the 5′ss (ΔCV = 5.4% ± 0.3). Indeed, these mutations were pathogenic only when a cryptic splice site was activated and therefore predictions were hazardous. Finally, exonic mutations that were distant both from the 5′ and 3′ss could activate a cryptic splice site and result in splicing defects as shown for mutations c.658C>G in RB1, c.1915C>T in MSH2 and c.5985T>G in DMD.
Table 2.
Exonic mutations in DMD (ENST00000357033), MLH1 (ENST 00000231790), MSH2 (ENST00000233146) and RB1 (ENST00000267163) involved in splicing
| Gene | Mutation | Position | References | WT CV | Mutant CV | CV variation (%) |
|---|---|---|---|---|---|---|
| DMD | c.5985T>G | Deep exonic | (91) | 46.65 | 75.59 | 3′ CS (63 nt downstream)a |
| MLH1 | c.677G>A | Last base | (58) | 84.46 | 73.89 | −12.52b |
| MLH1 | c.882C>T | Exonic | (58) | 84.46 | 73.89 | −12.52b |
| MLH1 | c.1037A>G | Penultimate base | (58) | 93.04 | 88.19 | −5.22 5′ CS (upstreamc) |
| MLH1 | c.1038G>T | Last base | (58) | 93.04 | 82.17 | −11.68 5′ CS (upstreamc) |
| MLH1 | c.1667G>T | Last base | (92) | 85.85 | 74.99 | −12.66 5′ CS (88 nt downstream)a |
| MLH1 | c.1731G>A | Last base | (58) | 93.27 | 82.69 | −11.34 |
| MLH1 | c.1989G>T | Last base | (58) | 93.22 | 82.35 | −11.66 |
| MSH2 | c.1660A>T | Penultimate base | (58) | 84.00 | 79.25 | −5.65 5′ CS (82 nt upstream)a |
| MSH2 | c.1759G>C | Last base | (58) | 85.66 | 74.65 | −12.86b |
| MSH2 | c.1915C>T | Deep exonic | (59) | 62.19 | 89.02 | 5′ CS (92 nt upstream)a |
| RB1 | c.658C>G | Deep exonic | (57) | 58.66 | 85.49 | 5′ CS (61 nt upstream)a |
| RB1 | c.939G>T | Last base | (57) | 83.75 | 72.88 | −12.98b |
| RB1 | c.1960G>C | Last base | (57) | 94.02 | 83.01 | −11.71b |
| RB1 | c.1960G>A | Last base | (57) | 94.02 | 83.44 | −11.25b |
Branch point sequences
We analyzed 14 BP sequences previously reported to be abolished by mutations. As shown in Table 3, 13 out of 14 BPs were correctly predicted by HSF with an average strength of 83.4 and a standard deviation of 8.6. The only discrepancy concerned the mutation localized in intron 3 of GH1 for which the BP was predicted to be at position −26 by HSF instead of position −21. Note that in both cases, the BP was located within the c.468-37_468-16del which is responsible for the cases of autosomal dominant, isolated GH deficiency (IGHDII) in one single family and therefore additional data are needed to identify the functional BP. Among the other BP sequences, 12 were reported as targets of point mutations leading to their inactivation. In six cases, the mutation involved the critical adenosine residue, leading to a remarkable ΔBP of −29.6%. For mutations involving residues surrounding the BP, the average ΔBP was −13.9% with a SD of 3%. Taking into account the weight matrix (Figure 1) and experimental data, the threshold for BP prediction was thus set at 67.
Auxiliary splicing sequences: enhancers and silencers
In order to simplify the interpretation of predictions obtained with the different algorithms using weight matrices, we used a normalized range scale from 0 to 100. As a consequence, previous matrices from ESE-Finder (19,27) were modified. Nevertheless the user can define the thresholds using either the original ESE-Finder range or the new 0–100 range. In addition, when processing a single sequence and when CVs are available, HSF calculates the deviation as a percentage of the threshold. A reduced list can be obtained for each matrix by choosing the ‘_Only variant_’ option in ‘_Advanced parameters_’. A color code is used for each quartile (from white to orange) to simplify the analysis. When comparing mutant sequences, HSF uses this color code to indicate the differences between the two sequences. When scalability is not possible, HSF only displays the presence of a motif.
To evaluate the sensitivity and usefulness of auxiliary splicing sequence predictions, we used a first set of genes for which 20 mutations have been reported to result in exon skipping following targeting of ESE or ESS (58–66). For each mutation, we selected the default option that allows HSF to predict modifications of ESE and/or ESS motifs using all available matrices (Table 4). For mutation c.362C>T in ACADM or c.4250T>A in DMD for which the target auxiliary sequences have been experimentally characterized (SF2/ASF and hnRNPA1 respectively), HSF correctly predicted the effect of the mutation. For other sequences, different scenarios were predicted: (i) disruption of one or more ESE without creation of an ESS, as observed for mutations c.882C>T (MLH1), c.362C>T (ACADM), c.8165C>G and c.5081G>T (BRCA2), c.557A>T and c.910C>T (NF1); (ii) creation of one or more ESS without disruption of an ESE, as shown for mutations c.544A>G and c.793C>T (MLH1), c.4250T>A (DMD) and c.6792C>G (NF1) and c) intermediate situation where both the disruption of one or more ESE and the creation of one or more ESS were predicted. This was observed for mutations c.5080G>T (BRCA1), c.794G>A and c.988_990del (MLH1), c.815C>T and c.274_276del (MSH2), c.2230C>T (LAMA2), c.943C>T, c.1007G>A and c.5719G>T (NF1). In order to evaluate the potential to differentiate ‘true’ ESE or ESS motifs from false positive signals, we selected a second set of 36 mutations (positive controls) and 220 SNPs (negative controls) (Supplementary Table 1). Predictions were classified in three categories: disruption of ESE motifs only (ESE), creation of ESS motifs only (ESS) or both (ESE + ESS). In addition, results were classified in two subsets: a first one (All), which included all predicted motifs, and a second one (Best), which was restricted to only one motif for each case by selecting the one recognized by the highest number of matrices.
Table 4.
Exonic mutations known to result in exon skipping through ESE inactivation or ESS activation
| Gene | Mutation | Ref. | Motif | Ref Seq | HSF prediction |
|---|---|---|---|---|---|
| ACADM | c.362C>T | (65) | −ESE (SF2/ASF) | ENST00000370841 | −9G8i (357_362) |
| −SF2/ASFe (358_364) | |||||
| +EIEh (359_364) | |||||
| −SRp40e (359_365) | |||||
| − EIEh (360_365) | |||||
| +IIEc × 4 (359_367) | |||||
| BRCA1 | c.5080G>T | (64) | ? | ENST00000357654 | −EIEh (5075_5080) |
| +SRp55e (5076_5081) | |||||
| −9G8i (5077_5082) | |||||
| −SF2/ASFe (5078_5085) | |||||
| −IIEc (5078_5083) | |||||
| +IIEc (5079_5084) | |||||
| −ESSa(5076_5083) | |||||
| +hnRNPA1d (5080_5085) | |||||
| BRCA2 | c.8165C>G | (62) | −ESE | ENST00000380152 | −SRp40e (8162_8168) |
| −ESEf (8163_8168) | |||||
| +ESEf × 2 (8164_8170) | |||||
| −SRp55e (8163_8169) | |||||
| −SF2/ASFe (8165_8171) | |||||
| −EIEh × 4 (8160_8168) | |||||
| BRCA2 | c.5081G>T | (64) | ? | ENST00000380152 | +SC35e (5075_5082) |
| +SRp40e (5080_5086) | |||||
| −ESEf,h × 2 (5080_5086) | |||||
| −9G8i (5081_5086) | |||||
| −ESSa (5078_5085) | |||||
| DMD | c.4250T>A | (61) | +ESS (hnRNPA1) | ENST00000357033 | +9G8i × 2 (4246_4251)(4248_4253) |
| −EIEh (4248_4253) | |||||
| +ESEf (4250_4255) | |||||
| −IIEc × 3 (4246_4253) | |||||
| +hnRNPA1d (4249_4254) | |||||
| MLH1 | c.544A>G | (59) | ? | ENST00000231790 | +ESSa (537_545) |
| 5′ss ΔCV = −6.30 | |||||
| MLH1 | c.793C>T | (58) | ? | ENST00000231790 | +ESSa (795_802) |
| MLH1 | c.794G>A | (58) | ? | ENST00000231790 | −SRp40e (793_799) |
| −SC35e (794_801) | |||||
| +ESSc (794_799) | |||||
| MLH1 | c.882C>T | (58) | ? | ENST00000231790 | +SC35e (876_883) |
| −SRp55e (877_882) | |||||
| MLH1 | c.988_990del | (58) | ? | ENST00000231790 | +SF2/ASFe (983_989) |
| −SRp55e (985_990) | |||||
| +9G8i (985_990) | |||||
| −ESSa (985_992) | |||||
| MSH2 | c.815C>T | (58) | ? | ENST00000233146 | −SRp55e (813_818) |
| +ESSa (813_820) | |||||
| +ESSc × 5 (801_819) | |||||
| MSH2 | c.274_276del | (58) | ? | ENST00000233146 | +SC35e (272_279) |
| +SRp40e × 2 (274_285) | |||||
| −IIEc × 2 (274_280) | |||||
| LAMA2 | c.2230C>T | (60) | ? | ENST00000354729 | −SF2/ASFe (2226_2232) |
| +ESSc (2228_2235) | |||||
| +IIEc × 2 (2229_2235) | |||||
| +ESSa (2230_2237) | |||||
| NF1 | c.557A>T | (66) | −ESE | ENST00000356175 | −SRp55e (552_557) |
| −ESEf (552_557) | |||||
| −EIEh × 4 (552_560) | |||||
| −9G8i (553_558) | |||||
| +ESSa × 2 (550_557) (555_562) | |||||
| NF1 | c.910C>T | (66) | −ESE | ENST00000356175 | −9G8i (905_910) |
| −EIEh (905_910) | |||||
| +ESEf (908_913) | |||||
| −ESEf (910_915) | |||||
| −ESSa (906_913) | |||||
| NF1 | c.943C>T | (66) | −ESE | ENST00000356175 | −SC35e (941_948) |
| −SF2/ASFe (943_949) | |||||
| −PESEg (942_949) | |||||
| −9G8i (938_943) | |||||
| +hnRNPA1d (943_948) | |||||
| +IIEc (942_947) | |||||
| NF1 | c.1007G>A | (66) | −ESE | ENST00000356175 | +PESEg (1007_1014) |
| −EIEh × 2 (1003_1011) | |||||
| +9G8i (1006_1011) | |||||
| +ESEf (1007_1014) | |||||
| −ESSa × 2 (1003_1011) | |||||
| −IIEc × 4 (1003_1011) | |||||
| +hnRNPA1d (1006_1011) | |||||
| NF1 | c.5719G>T | (66) | −ESE | ENST00000356175 | −ESEf × 5 (5715_5724) |
| −EIEh × 5 (5715_5724) | |||||
| −ESSa × 2 (5714_5725) | |||||
| +PESSg × 2 (5712_5720) | |||||
| +hnRNPA1d (5719_5724) | |||||
| NF1 | c.6792C>A | (66) | −ESE | ENST00000356175 | +ESEf × 5 (6792_6797) |
| −EIEh × 2 (6788_6793) (6790_6795) | |||||
| +Tra2−βi (6791_6795) | |||||
| −ESSa × 2 (6787_6794) (6792_6799) | |||||
| NF1 | c.6792C>G | (66) | −ESE | ENST00000356175 | +ESEf (6792_6797) |
| −EIEh × 2 (6788_6793) (6790_6795) | |||||
| s+Tra2−βi (6791_6795) | |||||
| −ESSa × 2 (6787_6794) (6792_6799) | |||||
| +hnRNPA1d (6790_6795) |
Comparison of the three categories (ESE, ESS, and ESE + ESS) revealed a significant difference between positive and negative controls both in the ‘All’ (_χ_2 = 10.05, P = 0.00656) and the ‘Best’ subset (_χ_2 = 11.75, P = 0.0028). We then evaluated the potential of each matrix to differentiate true from false positive signals. No statistical differences were found using the Sironi, PESS, IIE, hnRNPA1 and RESCUE-ESE matrices. A statistically significant difference was found for the ‘All’ subset (_χ_2 = 3.99, P = 0.045), but not for the ‘Best’ subset (_χ_2 = 2.47, P = 0.116) with the EIE matrix. Significant results in both subsets were obtained with ESE-Finder (‘All’ subset: _χ_2 = 5.17, P = 0.023; ‘Best’ subset: _χ_2 = 7.33, P = 0.0067), the 9G8 and Tra2ß matrices from HSF (‘All’ subset: _χ_2 = 9.92, P = 0.00164; ‘Best’ subset: _χ_2 = 9.86, P = 0.00169) and PESE (‘All’ subset: _χ_2 = 19.52, P = 9.95 × 10⁻⁶; ‘Best’ subset: _χ_2 = 13.52, P = 2.36 × 10⁻⁴). The positive (PPV) and negative (NPV) predictive values as well as the sensitivity (Sv) and the specificity (Sp) of these last three matrices were then evaluated. PPV ranged from 0.22 (9G8 and Tra2ß) to 0.56 (PESE), PNV from 0.76 (PESE) to 0.95 (9G8 and Tra2ß), Sv from 0.27 (PESE) to 0.40 (9G8 and Tra2ß) and Sp from 0.88 (9G8 and Tra2ß) to 0.91 (PESE). The ESE-Finder matrix showed intermediate values in all cases.
DISCUSSION
During evolution from simple to higher eukaryotes, splicing signals evolved from well-defined motifs to degenerated sequences with the addition of new auxiliary splicing sequences known as ESE and ESS. Although major SR proteins have been cloned and their target sites determined, much work remains to be done to understand how splice signals are recognized and splicing specificity achieved. As this complex world is progressively revealed, bioinformatics resources could play a major role in helping researchers and diagnostic laboratories to evaluate the consequence of mutations on splicing, especially because most genetic tests use DNA and not RNA samples. By giving an easy access to predictions of 5′ss, 3′ss, BP sequences as well as ESE and ESS, the HSF tool (http://www.umd.be/HSF/) fulfills this need and may assist clinicians, geneticists and researchers (70–75). By combining motifs identified with different experimental and computational approaches, it provides a common interface that can be used for sequence analysis. The inclusion of all exons and introns extracted from the Ensembl human genome database (20) allows an easy access to any sequence of human genes and thus direct comparison of virtually every mutation or SNP concerning splicing elements. Since SNPs are present at a very high frequency in the genome (1/300 bp) it could be useful to evaluate their impact in association with a mutation. We therefore included in HSF data from dbSNP using Ensembl Biomart. The user can select the ‘Search for SNPs related to the analyzed sequence’ option that automatically retrieves SNPs from the database. When SNPs are localized in exons, their effect on ESE and ESS motifs could help the user to better evaluate the consequence of a given mutation.
To evaluate the efficiency of the various algorithms included in HSF and its contribution to the prediction of the consequences of mutations associated with a splicing defect, we used a set of 69 intronic mutations that disrupt the 5′ss or the 3′ss and result in exon skipping and/or activation of a cryptic splice site (Table 1), and a group of 15 mutations that were previously reported to result in splicing defects by creating or activating cryptic splice sites (Table 2). HSF was able to correctly predict the disruption of the natural splice sites. Moreover, we could confirm that (i) mutations of the last nucleotide of an exon have a strong effect on the 5′ss (ΔCV = 12% ± 0.7) resulting frequently in exon skipping or partial exonic deletion or intronic retention due to activation of a cryptic splice site; (ii) mutations of the penultimate exonic nucleotide have limited consequences on the 5′ss (ΔCV = 5.4% ± 0.3), but they can activate a cryptic splice site, making predictions more difficult; (iii) exonic mutations distant from the 5′ and 3′ss can activate a cryptic splice site leading to partial exonic deletion. Overall these findings underline the efficiency of the HSF algorithm to predict the effect of mutations on 5′ and 3′ss. When using the HSF algorithm, the threshold for 5′ and 3′ss is 65 with a pathogenic ΔCV of −10% except for position +4 where it is −7%. However, in few cases when unusual splice sites are used, this algorithm could be less efficient.
BP sequences represent another essential splicing signal. When a mutation is localized in proximity of the 5′ of the 3′ss, its potential effect on a BP sequence should be examined especially when a nucleotide located at less than 85 bp from the 3′ss is targeted. In order to evaluate the HSF algorithm dedicated to the identification of BP sequences, we used 14 BP sequences inactivated by intronic mutations (Table 3). HSF correctly predicted 13 out of 14 BPs and these data allowed us to define the threshold for BP detection at 67 and the pathogenic ΔBP at −10%. Moreover, for intron 3 of XPC, HSF predicted a BP at position −24. However, according to Khan et al. (76), two BP sequences are present in this intron, one at positions −24 and another at –4. HSF could not predict the BP at position −4 simply because the HSF algorithm excludes positions −12 to −1 for BP identification because of steric obstruction caused by the spliceosome.
It has been demonstrated that two different splicing recognition mechanisms, correlated with intron length, can be used in a cell: exon definition for long and exon definition for short introns (77). Although the influence of intron length seems to be less important in humans than in other species, it should, nevertheless, be kept in mind since U12 and U2-type introns have different BP consensus sequences. In the present version of HSF (v2.4), we only focused on U2-type introns, which are by far the most abundant type in mammalian cells.
Concerning _cis_-acting elements, many works have been performed to define ESE and ESS matrices based on bioinformatics or experimental approaches (78). However, due to technical and/or conceptual bias, the various sequence sets only share partial homology. To solve this problem, HSF included all available matrices in one place. In addition, we developed new matrices to predict ESE motifs for the 9G8 and Tra2-β SR proteins and ESS motifs for the hnRNPA1 ribonucleoprotein. ESE and ESS motifs frequently overlap and therefore the identification of the specific motif/protein pair involved in a given splicing defect is difficult. This is even more complicated when considering the impact of SR and ribonucleoprotein concentration in different tissues or during development. We used a set of 20 exonic mutations known to influence splicing through ESE inactivation or ESS activation (Table 4) to evaluate the efficiency of HSF to correctly predict motifs disrupted by these mutations. We showed that when the motif/protein pairs had been previously experimentally characterized (hnRNPA1 or SF2/ASF), HSF was able to correctly predict the effects of the mutation on ESE and ESS. For most mutations, however, only the general mechanism was identified (i.e. the mutant sequence inhibits splicing in various in vitro reporter systems) and therefore the motif/protein couple is unknown. In these cases, HSF predicted the disruption of ESE motifs and/or the creation of ESS motifs (Table 4). In addition, to evaluate HSF efficiency to discriminate true from false positive signals, we used a second group of positive and negative controls (Supplementary Table 1). We showed that both sets could be discriminated on the basis of their overall pattern (ESE, ESS, ESE+ESS; _χ_2 = 11.75, P = 0.0028). Three matrices also gave statistically significant results: ESE-Finder (_χ_2 = 7.33, P = 0.0067), 9G8 and Tra2ß from HSF (_χ_2 = 9.86, P = 0.0017) and PESE (_χ_2 = 13.52, P = 2.36 × 10⁻⁴). Since these three matrices predict ESE motifs, these results could be associated with a bias towards the positive controls. Indeed, only few experimental validations of auxiliary sequences are available and they are frequently initiated by predictions of ESE motifs using ESE-Finder. PESE and the 9G8/Tra2ß HSF matrices gave stronger results than ESE Finder itself and therefore can be considered efficient matrices for the identification of ESE motifs. However, predictions with other matrices, especially the hnRNPA1 matrix, should also be considered as they could provide valuable information as shown for the c.4250T>A of DMD. We are still in the early days of ESE and ESS motif predictions and further data are needed to select the best matrices and to define the rules for data interpretation as most mutation sets used to validate prediction tools contain mainly mutations affecting splice sites (79). Major work is also needed to ultimately address the tissue or developmental specificity.
In conclusion, the HSF tool is dedicated to the prediction of splicing signals present in any human gene using all available matrices to identify ESE and ESS and new matrices to evaluate 5′ and 3′ss and BPs. This tool is regularly updated to include new data from bioinformatics and experimental studies in order to improve predictions. Many users already have tested HSF and have stressed its value both for basic science (identification of splicing signals) and applied research or diagnostics (prediction of the pathogenic consequences of a given mutation) (70–75). In addition, new genotype-based therapies, such as the exon-skipping approach in Duchenne Muscular Dystrophy, are currently evaluated in clinical trials (international multi-center phase I/II clinical studies with PRO051 in patients with Duchenne Muscular Dystrophy – Prosensa company; http://prosensa.eu/). HSF might represent an useful tool to identify key splicing sequences in different exons (75,80) and therefore to design antisense oligonucleotides to induce exon skipping. This approach is being actively evaluated throughout the world and especially by the TREAT-NMD European network (http://www.treat-nmd.eu/home.php).
Besides these gene-specific approaches, global projects, which either aim at developing a holistic view on Genotype-To-Phenotype data (GEN2PHEN European projects; http://www.gen2phen.org/) or at improving health outcomes by facilitating the analysis of human genetic variation and its impact on human health, such as the Human Variome Project (81), might benefit from using HSF. Indeed, HSF could help to predict the theoretical impact on splicing of any sequence variation affecting a human gene.
SUPPLEMENTARY DATA
Supplementary Data are available at NAR Online.
FUNDING
European Community Seventh Framework Program (FP7/2007-2013) under grant agreement number 200754—the GEN2PHEN project; The European Community Sixth Framework Program (FP6) under grant agreement number 036825; TREAT-NMD Network of Excellence. Funding for open access charge: Institut National de la Santé Et de la Recherche Médicale (INSERM).
Conflict of interest statement. None declared.
Supplementary Material
[Supplementary Data]
REFERENCES
- 1.Berget SM, Moore C, Sharp PA. Spliced segments at the 5′ terminus of adenovirus 2 late mRNA. Proc. Natl Acad. Sci. USA. 1977;74:3171–3175. doi: 10.1073/pnas.74.8.3171. [DOI] [PMC free article] [PubMed] [Google Scholar]
- 2.Nilsen TW. The spliceosome: the most complex macromolecular machine in the cell? Bioessays. 2003;25:1147–1149. doi: 10.1002/bies.10394. [DOI] [PubMed] [Google Scholar]
- 3.Zhou Z, Licklider LJ, Gygi SP, Reed R. Comprehensive proteomic analysis of the human spliceosome. Nature. 2002;419:182–185. doi: 10.1038/nature01031. [DOI] [PubMed] [Google Scholar]
- 4.Breitbart RE, Nguyen HT, Medford RM, Destree AT, Mahdavi V, Nadal-Ginard B. Intricate combinatorial patterns of exon splicing generate multiple regulated troponin T isoforms from a single gene. Cell. 1985;41:67–82. doi: 10.1016/0092-8674(85)90062-5. [DOI] [PubMed] [Google Scholar]
- 5.Maniatis T, Tasic B. Alternative pre-mRNA splicing and proteome expansion in metazoans. Nature. 2002;418:236–243. doi: 10.1038/418236a. [DOI] [PubMed] [Google Scholar]
- 6.Cartegni L, Chew SL, Krainer AR. Listening to silence and understanding nonsense: exonic mutations that affect splicing. Nat. Rev. Genet. 2002;3:285–298. doi: 10.1038/nrg775. [DOI] [PubMed] [Google Scholar]
- 7.Robberson BL, Cote GJ, Berget SM. Exon definition may facilitate splice site selection in RNAs with multiple exons. Mol. Cell Biol. 1990;10:84–94. doi: 10.1128/mcb.10.1.84. [DOI] [PMC free article] [PubMed] [Google Scholar]
- 8.Jacob M, Gallinaro H. The 5′ splice site: phylogenetic evolution and variable geometry of association with U1RNA. Nucleic Acids Res. 1989;17:2159–2180. doi: 10.1093/nar/17.6.2159. [DOI] [PMC free article] [PubMed] [Google Scholar]
- 9.Blencowe BJ. Exonic splicing enhancers: mechanism of action, diversity and role in human genetic diseases. Trends Biochem Sci. 2000;25:106–110. doi: 10.1016/s0968-0004(00)01549-8. [DOI] [PubMed] [Google Scholar]
- 10.Zhu J, Mayeda A, Krainer AR. Exon identity established through differential antagonism between exonic splicing silencer-bound hnRNP A1 and enhancer-bound SR proteins. Mol. Cell. 2001;8:1351–1361. doi: 10.1016/s1097-2765(01)00409-9. [DOI] [PubMed] [Google Scholar]
- 11.Zhang XH, Leslie CS, Chasin LA. Computational searches for splicing signals. Methods. 2005;37:292–305. doi: 10.1016/j.ymeth.2005.07.011. [DOI] [PubMed] [Google Scholar]
- 12.Bhasi A, Pandey RV, Utharasamy SP, Senapathy P. EuSplice: A unified resource for the analysis of splice signals and alternative splicing in eukaryotic genes. Bioinformatics. 2007;23:1815–1823. doi: 10.1093/bioinformatics/btm084. [DOI] [PubMed] [Google Scholar]
- 13.Churbanov A, Rogozin IB, Deogun JS, Ali H. Method of predicting splice sites based on signal interactions. Biol. Direct. 2006;1:10. doi: 10.1186/1745-6150-1-10. [DOI] [PMC free article] [PubMed] [Google Scholar]
- 14.Dunckley MG, Manoharan M, Villiet P, Eperon IC, Dickson G. Modification of splicing in the dystrophin gene in cultured Mdx muscle cells by antisense oligoribonucleotides. Hum. Mol. Genet. 1998;7:1083–1090. doi: 10.1093/hmg/7.7.1083. [DOI] [PubMed] [Google Scholar]
- 15.Wilton SD, Fletcher S. RNA splicing manipulation: strategies to modify gene expression for a variety of therapeutic outcomes. Curr. Gene. Ther. 2005;5:467–483. doi: 10.2174/156652305774329249. [DOI] [PubMed] [Google Scholar]
- 16.Beroud C, Hamroun D, Collod-Beroud G, Boileau C, Soussi T, Claustres M. UMD (Universal Mutation Database): 2005 update. Hum. Mutat. 2005;26:184–191. doi: 10.1002/humu.20210. [DOI] [PubMed] [Google Scholar]
- 17.Beroud C, Collod-Beroud G, Boileau C, Soussi T, Junien C. UMD (Universal mutation database): a generic software to build and analyze locus-specific databases. Hum. Mutat. 2000;15:86–94. doi: 10.1002/(SICI)1098-1004(200001)15:1<86::AID-HUMU16>3.0.CO;2-4. [DOI] [PubMed] [Google Scholar]
- 18.Fairbrother WG, Yeo GW, Yeh R, Goldstein P, Mawson M, Sharp PA, Burge CB. RESCUE-ESE identifies candidate exonic splicing enhancers in vertebrate exons. Nucleic Acids Res. 2004;32:W187–W190. doi: 10.1093/nar/gkh393. [DOI] [PMC free article] [PubMed] [Google Scholar]
- 19.Cartegni L, Wang J, Zhu Z, Zhang MQ, Krainer AR. ESEfinder: A web resource to identify exonic splicing enhancers. Nucleic Acids Res. 2003;31:3568–3571. doi: 10.1093/nar/gkg616. [DOI] [PMC free article] [PubMed] [Google Scholar]
- 20.Flicek P, Aken BL, Beal K, Ballester B, Caccamo M, Chen Y, Clarke L, Coates G, Cunningham F, Cutts T, et al. Ensembl 2008. Nucleic Acids Res. 2008;36:D707–D714. doi: 10.1093/nar/gkm988. [DOI] [PMC free article] [PubMed] [Google Scholar]
- 21.Karolchik D, Kuhn RM, Baertsch R, Barber GP, Clawson H, Diekhans M, Giardine B, Harte RA, Hinrichs AS, Hsu F, et al. The UCSC Genome Browser Database: 2008 update. Nucleic Acids Res. 2008;36:D773–D779. doi: 10.1093/nar/gkm966. [DOI] [PMC free article] [PubMed] [Google Scholar]
- 22.Shapiro MB, Senapathy P. RNA splice junctions of different classes of eukaryotes: sequence statistics and functional implications in gene expression. Nucleic Acids Res. 1987;15:7155–7174. doi: 10.1093/nar/15.17.7155. [DOI] [PMC free article] [PubMed] [Google Scholar]
- 23.Yeo G, Burge CB. Maximum entropy modeling of short sequence motifs with applications to RNA splicing signals. J. Comput. Biol. 2004;11:377–394. doi: 10.1089/1066527041410418. [DOI] [PubMed] [Google Scholar]
- 24.Green MR. Biochemical mechanisms of constitutive and regulated pre-mRNA splicing. Annu. Rev. Cell Biol. 1991;7:559–599. doi: 10.1146/annurev.cb.07.110191.003015. [DOI] [PubMed] [Google Scholar]
- 25.Gooding C, Clark F, Wollerton MC, Grellscheid SN, Groom H, Smith CW. A class of human exons with predicted distant branch points revealed by analysis of AG dinucleotide exclusion zones. Genome Biol. 2006;7:R1. doi: 10.1186/gb-2006-7-1-r1. [DOI] [PMC free article] [PubMed] [Google Scholar]
- 26.Kol G, Lev-Maor G, Ast G. Human-mouse comparative analysis reveals that branch-site plasticity contributes to splicing regulation. Hum. Mol. Genet. 2005;14:1559–1568. doi: 10.1093/hmg/ddi164. [DOI] [PubMed] [Google Scholar]
- 27.Smith PJ, Zhang C, Wang J, Chew SL, Zhang MQ, Krainer AR. An increased specificity score matrix for the prediction of SF2/ASF-specific exonic splicing enhancers. Hum. Mol. Genet. 2006;15:2490–2508. doi: 10.1093/hmg/ddl171. [DOI] [PubMed] [Google Scholar]
- 28.Zhang XH, Chasin LA. Computational definition of sequence motifs governing constitutive exon splicing. Genes Dev. 2004;18:1241–1250. doi: 10.1101/gad.1195304. [DOI] [PMC free article] [PubMed] [Google Scholar]
- 29.Goren A, Ram O, Amit M, Keren H, Lev-Maor G, Vig I, Pupko T, Ast G. Comparative analysis identifies exonic splicing regulatory sequences–The complex definition of enhancers and silencers. Mol. Cell. 2006;22:769–781. doi: 10.1016/j.molcel.2006.05.008. [DOI] [PubMed] [Google Scholar]
- 30.Zhang C, Li WH, Krainer AR, Zhang MQ. RNA landscape of evolution for optimal exon and intron discrimination. Proc. Natl Acad. Sci. USA. 2008;105:5797–5802. doi: 10.1073/pnas.0801692105. [DOI] [PMC free article] [PubMed] [Google Scholar]
- 31.Sironi M, Menozzi G, Riva L, Cagliani R, Comi GP, Bresolin N, Giorda R, Pozzoli U. Silencer elements as possible inhibitors of pseudoexon splicing. Nucleic Acids Res. 2004;32:1783–1791. doi: 10.1093/nar/gkh341. [DOI] [PMC free article] [PubMed] [Google Scholar]
- 32.Wang Z, Rolish ME, Yeo G, Tung V, Mawson M, Burge CB. Systematic identification and analysis of exonic splicing silencers. Cell. 2004;119:831–845. doi: 10.1016/j.cell.2004.11.010. [DOI] [PubMed] [Google Scholar]
- 33.Thompson JD, Higgins DG, Gibson TJ. CLUSTAL W: improving the sensitivity of progressive multiple sequence alignment through sequence weighting, position-specific gap penalties and weight matrix choice. Nucleic Acids Res. 1994;22:4673–4680. doi: 10.1093/nar/22.22.4673. [DOI] [PMC free article] [PubMed] [Google Scholar]
- 34.Bailey TL, Williams N, Misleh C, Li WW. MEME: discovering and analyzing DNA and protein sequence motifs. Nucleic Acids Res. 2006;34:W369–W373. doi: 10.1093/nar/gkl198. [DOI] [PMC free article] [PubMed] [Google Scholar]
- 35.Yuan B, Thomas JP, von Kodolitsch Y, Pyeritz RE. Comparison of heteroduplex analysis, direct sequencing, and enzyme mismatch cleavage for detecting mutations in a large gene, FBN1. Hum. Mutat. 1999;14:440–446. doi: 10.1002/(SICI)1098-1004(199911)14:5<440::AID-HUMU11>3.0.CO;2-P. [DOI] [PubMed] [Google Scholar]
- 36.Youil R, Toner TJ, Bull E, Bailey AL, Earl CD, Dietz HC, Montgomery RA. Enzymatic mutation detection (EMD) of novel mutations (R565X and R1523X) in the FBN1 gene of patients with Marfan syndrome using T4 endonuclease VII. Hum. Mutat. 2000;16:92–93. doi: 10.1002/1098-1004(200007)16:1<92::AID-HUMU24>3.0.CO;2-1. [DOI] [PubMed] [Google Scholar]
- 37.Schrijver I, Liu W, Odom R, Brenn T, Oefner P, Furthmayr H, Francke U. Premature termination mutations in FBN1: distinct effects on differential allelic expression and on protein and clinical phenotypes. Am. J. Hum. Genet. 2002;71:223–237. doi: 10.1086/341581. [DOI] [PMC free article] [PubMed] [Google Scholar]
- 38.Rommel K, Karck M, Haverich A, Schmidtke J, Arslan-Kirchner M. Mutation screening of the fibrillin-1 (FBN1) gene in 76 unrelated patients with Marfan syndrome or Marfanoid features leads to the identification of 11 novel and three previously reported mutations. Hum. Mutat. 2002;20:406–407. doi: 10.1002/humu.9075. [DOI] [PubMed] [Google Scholar]
- 39.Park ES, Putnam EA, Chitayat D, Child A, Milewicz DM. Clustering of FBN2 mutations in patients with congenital contractural arachnodactyly indicates an important role of the domains encoded by exons 24 through 34 during human development. Am. J. Med. Genet. 1998;78:350–355. [PubMed] [Google Scholar]
- 40.Palz M, Tiecke F, Booms P, Goldner B, Rosenberg T, Fuchs J, Skovby F, Schumacher H, Kaufmann UC, von Kodolitsch Y, et al. Clustering of mutations associated with mild Marfan-like phenotypes in the 3′ region of FBN1 suggests a potential genotype-phenotype correlation. Am. J. Med. Genet. 2000;91:212–221. doi: 10.1002/(sici)1096-8628(20000320)91:3<212::aid-ajmg12>3.0.co;2-3. [DOI] [PubMed] [Google Scholar]
- 41.Nijbroek G, Sood S, McIntosh I, Francomano CA, Bull E, Pereira L, Ramirez F, Pyeritz RE, Dietz HC. Fifteen novel FBN1 mutations causing Marfan syndrome detected by heteroduplex analysis of genomic amplicons. Am. J. Hum. Genet. 1995;57:8–21. [PMC free article] [PubMed] [Google Scholar]
- 42.McGrory J, Cole WG. Alternative splicing of exon 37 of FBN1 deletes part of an ‘eight-cysteine’ domain resulting in the Marfan syndrome. Clin. Genet. 1999;55:118–121. doi: 10.1034/j.1399-0004.1999.550208.x. [DOI] [PubMed] [Google Scholar]
- 43.Loeys B, Nuytinck L, Delvaux I, De Bie S, De Paepe A. Genotype and phenotype analysis of 171 patients referred for molecular study of the fibrillin-1 gene FBN1 because of suspected Marfan syndrome. Arch. Intern. Med. 2001;161:2447–2454. doi: 10.1001/archinte.161.20.2447. [DOI] [PubMed] [Google Scholar]
- 44.Liu WO, Oefner PJ, Qian C, Odom RS, Francke U. Denaturing HPLC-identified novel FBN1 mutations, polymorphisms, and sequence variants in Marfan syndrome and related connective tissue disorders. Genet. Test. 1997;1:237–242. doi: 10.1089/gte.1997.1.237. [DOI] [PubMed] [Google Scholar]
- 45.Hutchinson S, Wordsworth BP, Handford PA. Marfan syndrome caused by a mutation in FBN1 that gives rise to cryptic splicing and a 33 nucleotide insertion in the coding sequence. Hum. Genet. 2001;109:416–420. doi: 10.1007/s004390100573. [DOI] [PubMed] [Google Scholar]
- 46.Halliday D, Hutchinson S, Kettle S, Firth H, Wordsworth P, Handford PA. Molecular analysis of eight mutations in FBN1. Hum. Genet. 1999;105:587–597. doi: 10.1007/s004399900190. [DOI] [PubMed] [Google Scholar]
- 47.Gupta PA, Wallis DD, Chin TO, Northrup H, Tran-Fadulu VT, Towbin JA, Milewicz DM. FBN2 mutation associated with manifestations of Marfan syndrome and congenital contractural arachnodactyly. J. Med. Genet. 2004;41:e56. doi: 10.1136/jmg.2003.012880. [DOI] [PMC free article] [PubMed] [Google Scholar]
- 48.Gupta PA, Putnam EA, Carmical SG, Kaitila I, Steinmann B, Child A, Danesino C, Metcalfe K, Berry SA, Chen E, et al. Ten novel FBN2 mutations in congenital contractural arachnodactyly: delineation of the molecular pathogenesis and clinical phenotype. Hum. Mutat. 2002;19:39–48. doi: 10.1002/humu.10017. [DOI] [PubMed] [Google Scholar]
- 49.Guo D, Tan FK, Cantu A, Plon SE, Milewicz DM. FBN1 exon 2 splicing error in a patient with Marfan syndrome. Am. J. Med. Genet. 2001;101:130–134. doi: 10.1002/1096-8628(20010615)101:2<130::aid-ajmg1333>3.0.co;2-v. [DOI] [PubMed] [Google Scholar]
- 50.Dietz HC, McIntosh I, Sakai LY, Corson GM, Chalberg SC, Pyeritz RE, Francomano CA. Four novel FBN1 mutations: significance for mutant transcript level and EGF-like domain calcium binding in the pathogenesis of Marfan syndrome. Genomics. 1993;17:468–475. doi: 10.1006/geno.1993.1349. [DOI] [PubMed] [Google Scholar]
- 51.Comeglio P, Johnson P, Arno G, Brice G, Evans A, Aragon-Martin J, da Silva FP, Kiotsekoglou A, Child A. The importance of mutation detection in Marfan syndrome and Marfan-related disorders: report of 193 FBN1 mutations. Hum. Mutat. 2007;28:928. doi: 10.1002/humu.9505. [DOI] [PubMed] [Google Scholar]
- 52.Collod-Beroud G, Le Bourdelles S, Ades L, Ala-Kokko L, Booms P, Boxer M, Child A, Comeglio P, De Paepe A, Hyland JC, et al. Update of the UMD-FBN1 mutation database and creation of an FBN1 polymorphism database. Hum. Mutat. 2003;22:199–208. doi: 10.1002/humu.10249. [DOI] [PubMed] [Google Scholar]
- 53.Chikumi H, Yamamoto T, Ohta Y, Nanba E, Nagata K, Ninomiya H, Narasaki K, Katoh T, Hisatome I, Ono K, et al. Fibrillin gene (FBN1) mutations in Japanese patients with Marfan syndrome. J. Hum. Genet. 2000;45:115–118. doi: 10.1007/s100380050027. [DOI] [PubMed] [Google Scholar]
- 54.Biggin A, Holman K, Brett M, Bennetts B, Ades L. Detection of thirty novel FBN1 mutations in patients with Marfan syndrome or a related fibrillinopathy. Hum. Mutat. 2004;23:99. doi: 10.1002/humu.9207. [DOI] [PubMed] [Google Scholar]
- 55.Attanasio M, Lapini I, Evangelisti L, Lucarini L, Giusti B, Porciani M, Fattori R, Anichini C, Abbate R, Gensini G, et al. FBN1 mutation screening of patients with Marfan syndrome and related disorders: detection of 46 novel FBN1 mutations. Clin. Genet. 2008;74:39–46. doi: 10.1111/j.1399-0004.2008.01007.x. [DOI] [PubMed] [Google Scholar]
- 56.Loeys BL, Chen J, Neptune ER, Judge DP, Podowski M, Holm T, Meyers J, Leitch CC, Katsanis N, Sharifi N, et al. A syndrome of altered cardiovascular, craniofacial, neurocognitive and skeletal development caused by mutations in TGFBR1 or TGFBR2. Nat. Genet. 2005;37:275–281. doi: 10.1038/ng1511. [DOI] [PubMed] [Google Scholar]
- 57.Houdayer C, Dehainault C, Mattler C, Michaux D, Caux-Moncoutier V, Pages-Berhouet S, d'Enghien CD, Lauge A, Castera L, Gauthier-Villars M, et al. Evaluation of in silico splice tools for decision-making in molecular diagnosis. Hum. Mutat. 2008;29:975–982. doi: 10.1002/humu.20765. [DOI] [PubMed] [Google Scholar]
- 58.Tournier I, Vezain M, Martins A, Charbonnier F, Baert-Desurmont S, Olschwang S, Wang Q, Buisine MP, Soret J, Tazi J, et al. A large fraction of unclassified variants of the mismatch repair genes MLH1 and MSH2 is associated with splicing defects. Hum. Mutat. 2008;29:1412–1424. doi: 10.1002/humu.20796. [DOI] [PubMed] [Google Scholar]
- 59.Auclair J, Busine MP, Navarro C, Ruano E, Montmain G, Desseigne F, Saurin JC, Lasset C, Bonadona V, Giraud S, et al. Systematic mRNA analysis for the effect of MLH1 and MSH2 missense and silent mutations on aberrant splicing. Hum. Mutat. 2006;27:145–154. doi: 10.1002/humu.20280. [DOI] [PubMed] [Google Scholar]
- 60.Di Blasi C, He Y, Morandi L, Cornelio F, Guicheney P, Mora M. Mild muscular dystrophy due to a nonsense mutation in the LAMA2 gene resulting in exon skipping. Brain. 2001;124:698–704. doi: 10.1093/brain/124.4.698. [DOI] [PubMed] [Google Scholar]
- 61.Disset A, Bourgeois CF, Benmalek N, Claustres M, Stevenin J, Tuffery-Giraud S. An exon skipping-associated nonsense mutation in the dystrophin gene uncovers a complex interplay between multiple antagonistic splicing elements. Hum. Mol. Genet. 2006;15:999–1013. doi: 10.1093/hmg/ddl015. [DOI] [PubMed] [Google Scholar]
- 62.Fackenthal JD, Cartegni L, Krainer AR, Olopade OI. BRCA2 T2722R is a deleterious allele that causes exon skipping. Am. J. Hum. Genet. 2002;71:625–631. doi: 10.1086/342192. [DOI] [PMC free article] [PubMed] [Google Scholar]
- 63.Fairbrother WG, Yeh RF, Sharp PA, Burge CB. Predictive identification of exonic splicing enhancers in human genes. Science. 2002;297:1007–1013. doi: 10.1126/science.1073774. [DOI] [PubMed] [Google Scholar]
- 64.Mazoyer S, Puget N, Perrin-Vidoz L, Lynch HT, Serova-Sinilnikova OM, Lenoir GM. A BRCA1 nonsense mutation causes exon skipping. Am. J. Hum. Genet. 1998;62:713–715. doi: 10.1086/301768. [DOI] [PMC free article] [PubMed] [Google Scholar]
- 65.Nielsen KB, Sorensen S, Cartegni L, Corydon TJ, Doktor TK, Schroeder LD, Reinert LS, Elpeleg O, Krainer AR, Gregersen N, et al. Seemingly neutral polymorphic variants may confer immunity to splicing-inactivating mutations: a synonymous SNP in exon 5 of MCAD protects from deleterious mutations in a flanking exonic splicing enhancer. Am. J. Hum. Genet. 2007;80:416–432. doi: 10.1086/511992. [DOI] [PMC free article] [PubMed] [Google Scholar]
- 66.Zatkova A, Messiaen L, Vandenbroucke I, Wieser R, Fonatsch C, Krainer AR, Wimmer K. Disruption of exonic splicing enhancer elements is the principal cause of exon skipping associated with seven nonsense or missense alleles of NF1. Hum. Mutat. 2004;24:491–501. doi: 10.1002/humu.20103. [DOI] [PubMed] [Google Scholar]
- 67.den Dunnen JT, Antonarakis SE. Mutation nomenclature extensions and suggestions to describe complex mutations: a discussion. Hum. Mutat. 2000;15:7–12. doi: 10.1002/(SICI)1098-1004(200001)15:1<7::AID-HUMU4>3.0.CO;2-N. [DOI] [PubMed] [Google Scholar]
- 68.Frederic MY, Monino C, Marschall C, Hamroun D, Faivre L, Jondeau G, Klein HG, Neumann L, Gautier E, Binquet C, et al. The FBN2 gene: new mutations, locus-specific database (Universal Mutation Database FBN2), and genotype-phenotype correlations. Hum. Mutat. 2008;30:181–190. doi: 10.1002/humu.20794. [DOI] [PubMed] [Google Scholar]
- 69.Frederic MY, Hamroun D, Faivre L, Boileau C, Jondeau G, Claustres M, Beroud C, Collod-Beroud G. A new locus-specific database (LSDB) for mutations in the TGFBR2 gene: UMD-TGFBR2. Hum. Mutat. 2008;29:33–38. doi: 10.1002/humu.20602. [DOI] [PubMed] [Google Scholar]
- 70.Frank V, Ortiz Bruchle N, Mager S, Frints SG, Bohring A, du Bois G, Debatin I, Seidel H, Senderek J, Besbas N, et al. Aberrant splicing is a common mutational mechanism in MKS1, a key player in Meckel-Gruber syndrome. Hum. Mutat. 2007;28:638–639. doi: 10.1002/humu.9496. [DOI] [PubMed] [Google Scholar]
- 71.Anczukow O, Buisson M, Salles MJ, Triboulet S, Longy M, Lidereau R, Sinilnikova OM, Mazoyer S. Unclassified variants identified in BRCA1 exon 11: Consequences on splicing. Genes Chromosomes Cancer. 2008;47:418–426. doi: 10.1002/gcc.20546. [DOI] [PubMed] [Google Scholar]
- 72.Ng W, Loh AX, Teixeira AS, Pereira SP, Swallow DM. Genetic regulation of MUC1 alternative splicing in human tissues. Br. J. Cancer. 2008;99:978–985. doi: 10.1038/sj.bjc.6604617. [DOI] [PMC free article] [PubMed] [Google Scholar]
- 73.Baala L, Romano S, Khaddour R, Saunier S, Smith UM, Audollent S, Ozilou C, Faivre L, Laurent N, Foliguet B, et al. The Meckel-Gruber syndrome gene, MKS3, is mutated in Joubert syndrome. Am. J. Hum. Genet. 2007;80:186–194. doi: 10.1086/510499. [DOI] [PMC free article] [PubMed] [Google Scholar]
- 74.Habara Y, Doshita M, Hirozawa S, Yokono Y, Yagi M, Takeshima Y, Matsuo M. A strong exonic splicing enhancer in dystrophin exon 19 achieve proper splicing without an upstream polypyrimidine tract. J. Biochem. 2008;143:303–310. doi: 10.1093/jb/mvm227. [DOI] [PubMed] [Google Scholar]
- 75.Aartsma-Rus A, van Vliet L, Hirschi M, Janson AA, Heemskerk H, de Winter CL, de Kimpe S, van Deutekom JC, t Hoen PA, van Ommen GJ. Guidelines for Antisense Oligonucleotide Design and Insight Into Splice-modulating Mechanisms. Mol. Ther. 2008;17:548–553. doi: 10.1038/mt.2008.205. [DOI] [PMC free article] [PubMed] [Google Scholar]
- 76.Khan SG, Metin A, Gozukara E, Inui H, Shahlavi T, Muniz-Medina V, Baker CC, Ueda T, Aiken JR, Schneider TD, et al. Two essential splice lariat branchpoint sequences in one intron in a xeroderma pigmentosum DNA repair gene: mutations result in reduced XPC mRNA levels that correlate with cancer risk. Hum. Mol. Genet. 2004;13:343–352. doi: 10.1093/hmg/ddh026. [DOI] [PubMed] [Google Scholar]
- 77.Sharp PA, Burge CB. Classification of introns: U2-type or U12-type. Cell. 1997;91:875–879. doi: 10.1016/s0092-8674(00)80479-1. [DOI] [PubMed] [Google Scholar]
- 78.Chasin LA. Searching for splicing motifs. Adv. Exp. Med. Biol. 2007;623:85–106. doi: 10.1007/978-0-387-77374-2_6. [DOI] [PubMed] [Google Scholar]
- 79.Nalla VK, Rogan PK. Automated splicing mutation analysis by information theory. Hum. Mutat. 2005;25:334–342. doi: 10.1002/humu.20151. [DOI] [PubMed] [Google Scholar]
- 80.Beroud C, Tuffery-Giraud S, Matsuo M, Hamroun D, Humbertclaude V, Monnier N, Moizard MP, Voelckel MA, Calemard LM, Boisseau P, et al. Multiexon skipping leading to an artificial DMD protein lacking amino acids from exons 45 through 55 could rescue up to 63% of patients with Duchenne muscular dystrophy. Hum. Mutat. 2007;28:196–202. doi: 10.1002/humu.20428. [DOI] [PubMed] [Google Scholar]
- 81.What is the human variome project? Nat. Genet. 2007;39:423. doi: 10.1038/ng0407-423. [DOI] [PubMed] [Google Scholar]
- 82.Kainulainen K, Karttunen L, Puhakka L, Sakai L, Peltonen L. Mutations in the fibrillin gene responsible for dominant ectopia lentis and neonatal Marfan syndrome. Nat. Genet. 1994;6:64–69. doi: 10.1038/ng0194-64. [DOI] [PubMed] [Google Scholar]
- 83.Liu W, Qian C, Comeau K, Brenn T, Furthmayr H, Francke U. Mutant fibrillin-1 monomers lacking EGF-like domains disrupt microfibril assembly and cause severe marfan syndrome. Hum. Mol. Genet. 1996;5:1581–1587. doi: 10.1093/hmg/5.10.1581. [DOI] [PubMed] [Google Scholar]
- 84.Booms P, Cisler J, Mathews KR, Godfrey M, Tiecke F, Kaufmann UC, Vetter U, Hagemeier C, Robinson PN. Novel exon skipping mutation in the fibrillin-1 gene: two ‘hot spots’ for the neonatal Marfan syndrome. Clin. Genet. 1999;55:110–117. doi: 10.1034/j.1399-0004.1999.550207.x. [DOI] [PubMed] [Google Scholar]
- 85.Wang M, Price C, Han J, Cisler J, Imaizumi K, Van Thienen MN, DePaepe A, Godfrey M. Recurrent mis-splicing of fibrillin exon 32 in two patients with neonatal Marfan syndrome. Hum. Mol. Genet. 1995;4:607–613. doi: 10.1093/hmg/4.4.607. [DOI] [PubMed] [Google Scholar]
- 86.Godfrey M, Vandemark N, Wang M, Velinov M, Wargowski D, Tsipouras P, Han J, Becker J, Robertson W, Droste S, et al. Prenatal diagnosis and a donor splice site mutation in fibrillin in a family with Marfan syndrome. Am. J. Hum. Genet. 1993;53:472–480. [PMC free article] [PubMed] [Google Scholar]
- 87.Wang M, Clericuzio CL, Godfrey M. Familial occurrence of typical and severe lethal congenital contractural arachnodactyly caused by missplicing of exon 34 of fibrillin-2. Am. J. Hum. Genet. 1996;59:1027–1034. [PMC free article] [PubMed] [Google Scholar]
- 88.Karttunen L, Ukkonen T, Kainulainen K, Syvanen AC, Peltonen L. Two novel fibrillin-1 mutations resulting in premature termination codons but in different mutant transcript levels and clinical phenotypes. Hum. Mutat. 1998;(Suppl 1):S34–S37. doi: 10.1002/humu.1380110112. [DOI] [PubMed] [Google Scholar]
- 89.Kosaki K, Takahashi D, Udaka T, Kosaki R, Matsumoto M, Ibe S, Isobe T, Tanaka Y, Takahashi T. Molecular pathology of Shprintzen-Goldberg syndrome. Am. J. Med. Genet. A. 2006;140:104–108. doi: 10.1002/ajmg.a.31006. author reply 109–110. [DOI] [PubMed] [Google Scholar]
- 90.Loeys BL, Schwarze U, Holm T, Callewaert BL, Thomas GH, Pannu H, De Backer JF, Oswald GL, Symoens S, Manouvrier S, et al. Aneurysm syndromes caused by mutations in the TGF-beta receptor. N. Engl. J. Med. 2006;355:788–798. doi: 10.1056/NEJMoa055695. [DOI] [PubMed] [Google Scholar]
- 91.Tran VK, Takeshima Y, Zhang Z, Habara Y, Haginoya K, Nishiyama A, Yagi M, Matsuo M. A nonsense mutation-created intraexonic splice site is active in the lymphocytes, but not in the skeletal muscle of a DMD patient. Hum. Genet. 2007;120:737–742. doi: 10.1007/s00439-006-0241-y. [DOI] [PubMed] [Google Scholar]
- 92.Sharp A, Pichert G, Lucassen A, Eccles D. RNA analysis reveals splicing mutations and loss of expression defects in MLH1 and BRCA1. Hum. Mutat. 2004;24:272. doi: 10.1002/humu.9267. [DOI] [PubMed] [Google Scholar]
- 93.Burrows NP, Nicholls AC, Richards AJ, Luccarini C, Harrison JB, Yates JR, Pope FM. A point mutation in an intronic branch site results in aberrant splicing of COL5A1 and in Ehlers-Danlos syndrome type II in two British families. Am. J. Hum. Genet. 1998;63:390–398. doi: 10.1086/301948. [DOI] [PMC free article] [PubMed] [Google Scholar]
- 94.Sinnreich M, Therrien C, Karpati G. Lariat branch point mutation in the dysferlin gene with mild limb-girdle muscular dystrophy. Neurology. 2006;66:1114–1116. doi: 10.1212/01.wnl.0000204358.89303.81. [DOI] [PubMed] [Google Scholar]
- 95.Maslen C, Babcock D, Raghunath M, Steinmann B. A rare branch-point mutation is associated with missplicing of fibrillin-2 in a large family with congenital contractural arachnodactyly. Am. J. Hum. Genet. 1997;60:1389–1398. doi: 10.1086/515472. [DOI] [PMC free article] [PubMed] [Google Scholar]
- 96.Vivenza D, Guazzarotti L, Godi M, Frasca D, di Natale B, Momigliano-Richiardi P, Bona G, Giordano M. A novel deletion in the GH1 gene including the IVS3 branch site responsible for autosomal dominant isolated growth hormone deficiency. J. Clin. Endocrinol. Metab. 2006;91:980–986. doi: 10.1210/jc.2005-1703. [DOI] [PubMed] [Google Scholar]
- 97.Chavanas S, Gache Y, Vailly J, Kanitakis J, Pulkkinen L, Uitto J, Ortonne J, Meneguzzi G. Splicing modulation of integrin beta4 pre-mRNA carrying a branch point mutation underlies epidermolysis bullosa with pyloric atresia undergoing spontaneous amelioration with ageing. Hum. Mol. Genet. 1999;8:2097–2105. doi: 10.1093/hmg/8.11.2097. [DOI] [PubMed] [Google Scholar]
- 98.Kuivenhoven JA, Weibusch H, Pritchard PH, Funke H, Benne R, Assmann G, Kastelein JJ. An intronic mutation in a lariat branchpoint sequence is a direct cause of an inherited human disorder (fish-eye disease) J. Clin. Invest. 1996;98:358–364. doi: 10.1172/JCI118800. [DOI] [PMC free article] [PubMed] [Google Scholar]
- 99.Webb JC, Patel DD, Shoulders CC, Knight BL, Soutar AK. Genetic variation at a splicing branch point in intron 9 of the low density lipoprotein (LDL)-receptor gene: a rare mutation that disrupts mRNA splicing in a patient with familial hypercholesterolaemia and a common polymorphism. Hum. Mol. Genet. 1996;5:1325–1331. doi: 10.1093/hmg/5.9.1325. [DOI] [PubMed] [Google Scholar]
- 100.Di Leo E, Panico F, Tarugi P, Battisti C, Federico A, Calandra S. A point mutation in the lariat branch point of intron 6 of NPC1 as the cause of abnormal pre-mRNA splicing in Niemann-Pick type C disease. Hum. Mutat. 2004;24:440. doi: 10.1002/humu.9287. [DOI] [PubMed] [Google Scholar]
- 101.Vuillaumier-Barrot S, Le Bizec C, De Lonlay P, Madinier-Chappat N, Barnier A, Dupre T, Durand G, Seta N. PMM2 intronic branch-site mutations in CDG-Ia. Mol. Genet. Metab. 2006;87:337–340. doi: 10.1016/j.ymgme.2005.10.015. [DOI] [PubMed] [Google Scholar]
- 102.Janssen RJ, Wevers RA, Haussler M, Luyten JA, Steenbergen-Spanjers GC, Hoffmann GF, Nagatsu T, Van den Heuvel LP. A branch site mutation leading to aberrant splicing of the human tyrosine hydroxylase gene in a child with a severe extrapyramidal movement disorder. Ann Hum. Genet. 2000;64:375–382. doi: 10.1046/j.1469-1809.2000.6450375.x. [DOI] [PubMed] [Google Scholar]
- 103.Mayer K, Ballhausen W, Leistner W, Rott H. Three novel types of splicing aberrations in the tuberous sclerosis TSC2 gene caused by mutations apart from splice consensus sequences. Biochim. Biophys. Acta. 2000;1502:495–507. doi: 10.1016/s0925-4439(00)00072-7. [DOI] [PubMed] [Google Scholar]
Associated Data
This section collects any data citations, data availability statements, or supplementary materials included in this article.
Supplementary Materials
[Supplementary Data]