Timing-Dependent Regulation of Evoked Spiking in Nucleus Accumbens Neurons by Integration of Limbic and Prefrontal Cortical Inputs (original) (raw)
Abstract
Single nucleus accumbens (NAcc) neurons receive excitatory synaptic input from cortical and limbic structures, and the integration of converging goal- and motivation-related signals in these neurons influences reward-directed actions. While limbic/cortical synaptic input summation has been characterized at subthreshold intensities, the manner in which multiple inputs govern NAcc neuron spike discharge has not been measured and is poorly understood. Single NAcc neurons were recorded in urethane-anesthetized rats, and spiking was evoked by coincident stimulation of two major NAcc afferent regions: the basolateral amygdala (BLA) and medial prefrontal cortex (mPFC). BLA input increased NAcc spiking elicited by mPFC stimulation depending on the timing of the stimulation pulses, consistent with the summation of monosynaptically evoked excitatory activity. When mPFC input intensity was below threshold for evoked spiking, the addition of BLA input produced the largest facilitation of evoked spiking, and the latency of the evoked spikes reflected the latency of the individual inputs. When mPFC inputs were stimulated at higher intensities, BLA-mediated facilitation was weaker, and the spike latency reflected only the mPFC input. Thus NAcc neurons integrate both the magnitude and timing of afferent synaptic activity, suggesting that NAcc neuron output is strongly dependent on the comparative magnitude of synaptic activity in its afferent structures. These interactions may be crucial integrative mechanisms that allow motivational and cognitive information to produce appropriate reward-directed actions.
INTRODUCTION
Survival, reproduction, and homeostasis depend on the ability to seek out and acquire natural rewards. The nucleus accumbens (NAcc) supports reward-directed actions by integrating motivational and goal-related signals from limbic and cortical structures including the basolateral amygdala (BLA) and the medial prefrontal cortex (mPFC) (Grace 2000; Mogenson et al. 1980). In the pathology of addiction, activity in the BLA and mPFC inputs to the NAcc are thought to underlie the motivation to seek detrimental addictive substances and forgo necessary natural rewards (Di Ciano and Everitt 2004; Kalivas and Hu 2006; Kalivas and Volkow 2005; Kilts et al. 2001). Thus the integration of cortical and limbic inputs in the NAcc is critical to both normal and pathological-motivated behaviors.
While this cortical/limbic integration is thought to be among the most important features of the NAcc, how this integration gives rise to discharge of NAcc neurons is not well characterized. There is strong evidence that the majority of NAcc medium spiny neurons (the primary output neurons of the NAcc) receive excitatory synaptic input from multiple afferent structures (Finch 1996; French and Totterdell 2002, 2003; O'Donnell and Grace 1995). Thus motivational and goal-related signals interface at the single-cell level. Synaptic input summation has been characterized in several studies (Carter et al. 2007; Goto and O'Donnell 2002; Wolf et al. 2005) focusing primarily on below-spike threshold levels of excitatory input. However, these subthreshold responses may not be sufficient to explain action potential generation, which in medium spiny neurons is governed by complex active conductances and periodic synaptic inputs (O'Donnell and Grace 1995; Wickens and Wilson 1998; Wilson and Kawaguchi 1996). Although evoked spiking arising from integration of converging inputs has been observed (Finch 1996; Mulder et al. 1998; O'Donnell and Grace 1995), the specific features of this evoked activity (response probability, latency, timing dependence) are not known. These details are crucial, as excitatory NAcc neuron activity is strongly linked to behavior (Nicola et al. 2004b). Thus it is necessary to investigate directly how the interactions among limbic and cortical inputs regulate spike output.
In anesthetized rats, spiking driven by activation of NAcc afferent pathways was assessed. Two excitatory, monosynaptic inputs were studied: the mPFC and BLA. The BLA encodes the value of reward-associated cues (Ambroggi et al. 2008; Paton et al. 2006; Schoenbaum et al. 1998), and the mPFC is implicated in planning and executing goal-directed actions (Block et al. 2007; Floresco et al. 1999; Ostlund and Balleine 2005). Reward-directed behaviors are impaired when information flow from mPFC to NAcc or BLA to NAcc is disrupted (Di Ciano and Everitt 2004; Goto and Grace 2005; Ishikawa et al. 2008), suggesting that activation of the NAcc by these pathways is critical for reward-directed action. We have proposed previously that within the NAcc, affective signals from BLA constrain behavior by gating goal-related signals from the mPFC (Grace 2000). Therefore this study specifically focused on the ability of BLA to modulate the probability and timing of spikes evoked by activation of the mPFC in NAcc neurons receiving excitatory inputs from both regions.
METHODS
Extracellular recordings were obtained from 210 NAcc neurons in 132 rats. All neurons were identified as receiving excitatory input from the mPFC, and all but 19 neurons were also identified as receiving excitatory input from the BLA. The interaction of BLA and mPFC inputs was tested with several different protocols designed to measure specific features of evoked spike responses (see Tests of mPFC/BLA input interactions); single neurons were typically tested in more than one protocol. All experiments were performed in accordance with the National Institutes of Health Guide for the Care and Use of Laboratory Animals and were approved by the University of Pittsburgh Animal Care and Use Committee.
Subjects and surgery
Male Sprague-Dawley rats (n = 132, mean weight: 310 g, range: 270–430 g) were anesthetized with a single injection of urethane (1.4–1.5 mg/kg in distilled water), providing stable anesthesia for the duration of the experiment, which did not exceed 8 h. For experiments in which drugs were administered, the rats were implanted with a femoral vein catheter after the onset of anesthesia (loss of reflexive withdrawal in response to a foot pinch, 20–60 min after injection). Rats were then placed in a stereotaxic apparatus (David Kopf Instruments, Tujunga, CA). An incision was made in the scalp, the skull was cleaned, small holes were drilled overlying the electrode target regions, and the dura was resected. The electrode target coordinates were determined using the atlas of Paxinos and Watson (1998); coordinates are given in millimeters relative to the bregma suture landmark.
Bipolar stimulating electrodes (twisted pair with 1-mm tip separation) were lowered into the BLA (AP −3.6, ML 4.8, DV 9.0, negative pole) and mPFC (AP +3.0, ML 0.8, DV 5.5, negative pole), and a recording electrode was lowered to the dorsal border of the NAcc near the core/shell border (AP +1.2, ML 0.8–1.0, DV 6.0–8.0). The electrode leads were exposed for 0.8 mm from the tip, allowing for current spread to areas dorsal to the tip placement. The poles of the BLA electrode were placed in the same sagittal plane, and the poles of the mPFC electrode were placed in approximately the same coronal plane. Stimulation was controlled through the Master-8 stimulator and Isoflex stimulus isolation units (A.M.P.I., Jerusalem, Israel).
Extracellular recording electrodes were pulled from 2 mm OD, filamented borosilicate glass tubing (World Precision Instruments, Sarasota, FL). The tips were broken under microscopic control to achieve an impedance of 8–12 MΩ (measured in situ) and filled with 2 M NaCl with 2% Pontamine sky blue dye. Signals from neurons in the NAcc were amplified and band-pass filtered at 200–4,000 Hz (Fintronics WDR-420, Orange, CT). The amplified signals were passed to a speaker and oscilloscope for real-time monitoring and to a data-acquisition board (10-kHz sampling rate, Microstar Laboratories, Bellevue, WA) and PC for storage and analysis. Off-line analysis was performed using custom software (Neuroscope, Brian Lowry) and scripts for the R programming environment (R Development Core Team 2005).
Neuron identification and selection
The NAcc was the primary recording site in this study; however, recordings were also obtained from mPFC and BLA in pilot experiments (see following text). Neurons in the NAcc were recorded only if they received excitatory input from the mPFC and (for 191/210 neurons) from the BLA as well. A cell-searching procedure (McGinty and Grace 2008) was used to identify NAcc neurons receiving BLA and mPFC input: single, alternating stimulation pulses were delivered to the BLA and mPFC as the recording electrode was slowly advanced through the NAcc (DV 6.0–8.0). NAcc neurons were identified by the presence of biphasic action potentials (spikes) occurring shortly after the stimulus artifacts. Recordings were only obtained from single units, evidenced by a constant spike amplitude throughout the recording.
Neurons were selected for recording if the mean BLA- and mPFC-evoked spike latencies were <20 ms. This latency cut-off was determined by the conduction times of BLA-to-NAcc and mPFC-to-NAcc projecting neurons, which were measured in pilot experiments by antidromic stimulation of the NAcc and extracellular recordings from BLA and mPFC (see McGinty and Grace 2008 for detailed methods). Briefly, rats were prepared for surgery and electrodes were implanted using procedures similar to previous studies (McGinty and Grace 2008): a stimulating electrode was implanted in the NAcc near the core/shell border, and the recording electrode was placed in the mPFC or BLA. The NAcc was stimulated, and neurons projecting to the NAcc were identified by the presence of antidromically driven spikes. Spikes were considered to be antidromically driven if they responded consistently when tested with at least two of the following three measures: an evoked spike latency that varied by ≤2 ms in 20 trials; the ability to follow 400-Hz pairs of stimuli; and collision with spontaneously occurring action potentials (Fuller and Schlag 1976; McGinty and Grace 2008). The antidromic latency of these spikes was measured and used to construct a distribution of BLA-to-NAcc and mPFC-to-NAcc conduction times. Based on this distribution, the poststimulus window for orthodromic transmission to the NAcc from BLA and mPFC was determined to be <20 ms. Thus NAcc neurons exhibiting mean BLA- or mPFC-evoked spike latencies >20 ms were assumed to receive significant multisynaptic input and not were analyzed. Although the source of all evoked spikes could not be determined definitively, by selecting responses within this narrow range the likelihood of recording responses due to monosynaptic, orthodromic input from the BLA and mPFC was maximized.
In addition, neurons were only judged acceptable for recording if they exhibited at least a 50% evoked spike probability to ≤400-μA stimulation of the BLA and ≤500-μA stimulation of the mPFC, with each input tested separately at 0.3 Hz. Because ∼95% of striatal neurons are medium spiny neurons (Jiang and North 1991; Kemp and Powell 1971), this cell type is likely to comprise the great majority of the neurons recorded in this study. Neurons with steady spontaneous firing, or neurons exhibiting more than two action potentials in response to a single mPFC stimulation pulse, were presumed to be interneurons (Mallet et al. 2005; Wilson et al. 1990); these were rarely encountered and were not analyzed.
Tests of mPFC/BLA input interactions
The effects of excitatory BLA inputs on spiking responses evoked by the mPFC in single NAcc neurons were examined. On isolation of a neuron responding to both inputs, up to four distinct tests were performed to investigate the mPFC/BLA interactions in that neuron. Two of these tests were designed to measure the influence of the BLA on mPFC-evoked spike probability (points 1 and 2). The other two tests were designed to measure the BLA influence on spike latency (points 3 and 4).
The stimulation current intensities used for each neuron were based on evoked spiking probability. Subthreshold stimulation currents were defined as eliciting a 1–4% response probability (spikes/100 stimuli). This intensity of stimulation provided adequate activation of BLA inputs to the neuron (indicated by its modulation of mPFC-evoked spiking, see results) but by itself contributed a negligible number of evoked spikes. Although the membrane potential could not be observed, based on previous studies it is expected that subthreshold stimulation should consistently evoke depolarizing postsynaptic potentials (EPSPs) in the recorded neuron (Goto and O'Donnell 2002; O'Donnell and Grace 1995). In almost all experiments, the BLA was stimulated at subthreshold current intensities. For mPFC, stimulation current was varied according to the test protocol being performed (see following text). All stimulation pulses were 0.25 ms in duration.
BLA INPUT EFFECT ON MPFC-EVOKED SPIKE PROBABILITY.
The mPFC was stimulated at threshold current intensities, defined here as evoking spikes at a ∼50% response probability. BLA stimulation current was subthreshold as defined in the preceding text. The mPFC was stimulated alone for 20 trials at a rate of 0.3 Hz (baseline period); then a single BLA stimulation pulse was introduced in each trial. The interstimulus interval (ISI) of the mPFC/BLA pulse pair varied; in most experiments (n = 54 neurons from 37 rats), the BLA pulse preceded the mPFC pulse at ISIs of 1, 11, 21, and 31 ms, which covered an adequate response range based on initial experiments (not shown). The ISIs were rotated from one trial to the next, and trials with no BLA stimulation (“mPFC alone” trials) were added to the rotation to monitor baseline responsivity during the test. At least 10 trials at each ISI were tested, and spike probabilities (spikes/100 stimuli expressed as %) were calculated for each ISI.
To test the symmetry of these BLA/mPFC interactions, in a small number of experiments (n = 21 neurons from 14 rats), the current intensities were reversed at the stimulation sites –i.e., BLA at threshold (∼50% response), and mPFC at subthreshold. Finally, the specificity of the BLA stimulation effects was tested in 19 neurons (16 rats) identified as receiving only mPFC (but not BLA) excitatory input; for these tests, BLA stimulation current was fixed at 400 μA.
In a subset of neurons these tests were performed after intravenous injection of receptor antagonists or channel blockers: dopamine (DA) D1 antagonist SCH23390 (0.5 mk/kg, n = 14 neurons); dopamine D2 antagonists eticlopride or raclopride (0.2 or 0.1 mg/kg, respectively, n = 15 neurons); NMDA channel blocker MK801 (0.05 or 0.1 mg/kg, n = 11 neurons). These doses have been shown previously to have potent activity at the target receptors and to be effective in relevant behavioral tasks (Biondo et al. 2005; Caine and Koob 1994; Cervo et al. 2003; Floresco et al. 2001; Nicola and Deadwyler 2000).
BLA INPUT EFFECT ON THE MPFC CURRENT INPUT/SPIKE OUTPUT CURVE (19 NEURONS, 15 RATS).
At non-spike-evoking input intensities, the summation of BLA and mPFC inputs is dependent on the amplitude of the component EPSPs (Goto and O'Donnell 2002). Therefore we tested whether spike-evoking mPFC/BLA interactions were also amplitude-dependent. In addition to the criteria outlined in the preceding text (see Neuron identification and selection), neurons were recorded only if they exhibited a 100% spike probability to 700-μA mPFC stimulation. Similar to the first test (preceding text), the mPFC was stimulated alone or with the BLA at ISIs of 1, 11, and 31 ms, rotated from trial-to-trial (0.3-Hz trial rate). BLA current was kept at subthreshold intensities, whereas the mPFC current was varied from 0 to 100% spike probability intensities in increments of 10–20 μA. At least 10 trials were performed per ISI at a given current intensity.
For analysis, the trials were grouped by ISI, and the evoked spike probability at each current increment was plotted. Thus four current/response curves were produced for each neuron (mPFC alone and 1-, 11-, and 31-ms ISIs). The responses between 0 and 100% were fit with linear equations, which were used to perform two calculations of the BLA stimulation effects (linear fits were preferred over sigmoidal fits to accommodate partial curves). First, the slopes of the fitted lines were calculated to measure the effect of BLA stimulation of the mPFC current input/spike output relationship. Second, the fitted lines were used to calculate the increase in spike probability due to BLA input at low and high mPFC current intensities; this calculation provided a concrete, quantitative estimate of how BLA input efficacy varied over a physiologically relevant range of mPFC-evoked activity. For each neuron, the maximum current eliciting a 0% spike probability for the mPFC input alone was calculated (termed “low current”). Then the response probability at this low current for the 1-, 11-, and 31-ms ISI conditions was calculated, yielding values that represented the increase in evoked spiking due to BLA input. Similarly, for each of the three ISI curves, the minimum current eliciting a 100% spike probability was calculated (termed “high current”). The mPFC-alone spike probability was calculated at these high current intensities, and the difference between these values and 100% evoked response represented the increase in evoked spike probability due to BLA stimulation. Thus the estimated increase in spiking due to BLA input was calculated at a low and high current value for each ISI. The effects at low current were then compared with the effects at high current at each ISI.
Neurons were accepted for analysis if all four current/response curves spanned at least a 70% change in response ratio. Estimated spike probabilities <0% or >100% were rectified to 0 and 100%, respectively.
BLA INPUT EFFECT ON MPFC-EVOKED SPIKE LATENCY (41 NEURONS, 20 RATS).
To measure BLA input effects on mPFC-evoked spike latency, the mPFC was stimulated alone or with the BLA in pulse pairs. Unlike the tests used to measure changes in spike probability (preceding text), for these tests evoked spiking was maintained at ∼50% in all conditions by adjusting the mPFC current (BLA current was always subthreshold). Thus differences in spike latency were not confounded by differences in spike probability at different ISIs. In addition, the mPFC/BLA ISIs (1, 11, and 31 and mPFC alone) were tested in blocks of 50–200 trials to provide an accurate estimate of the spike latency and variance (rather than in rotated trials as in the preceding text). Finally, in a subset of neurons (n = 18/41), the latency of spikes evoked by BLA stimulation alone was also measured.
In addition to the mean change in spike latency for all neurons, the latency changes in individual neurons were also calculated. For each neuron, the “latency shift” was calculated by subtracting the mPFC stimulation alone-evoked latency from paired mPFC/BLA-evoked latency. An initial assumption was that spikes evoked by mPFC/BLA stimulation at 1-ms ISI would occur at latencies that were in between the individual mPFC input latency and BLA input latency. If this was the case, the magnitude and direction of the latency shift at 1-ms ISI would be explained by the discrepancy between the two component input latencies. Thus in the neurons where both mPFC alone and BLA alone spike latency data were available (n = 18), an “expected latency shift” was calculated, defined as half the difference between the BLA- and mPFC-evoked spike latencies. This was calculated for the 1-ms ISI only, and as such the BLA-evoked latency was adjusted by 1 ms to account for the timing difference between the two stimulation pulses; thus the equation for expected latency shift was

where _L_mPFC and _L_BLA are the mean single input spike latencies for mPFC and BLA, respectively. The expected latency shift was compared with the actual latency shift in these 18 neurons, quantifying the influence of the BLA input on the timing of mPFC/BLA-evoked responses.
EFFECT OF SUBTHRESHOLD BLA AND SUBTHRESHOLD MPFC STIMULATION (38 NEURONS, 28 RATS).
To further investigate synaptic integration and spike timing, spiking evoked by paired mPFC/BLA stimulation was examined using subthreshold current intensities for both inputs. The mPFC-evoked spike latency was measured over 20 trials at ∼50% response probability, and the same measurement was made for BLA-evoked spikes. Then the BLA and mPFC currents were both adjusted to subthreshold intensities (as defined in the preceding text) and stimulated concurrently at a 1-ms ISI for 20–100 trials (0.3 Hz). The probability and latency of the coincidentally evoked spikes were measured. For analysis, the mean response probability and latency were calculated. The individual input latencies and paired-pulse-evoked latency were used to calculate the “latency shift” and “expected latency shift” for the 1-ms ISI as described in the preceding text; these two values were compared to determine the influence of the component latencies on the paired-pulse-evoked spike timing.
Analysis
Statistical comparisons were performed using paired _t_-test (within neuron) or repeated-measure ANOVA with Tukey's honest significant difference post hoc testing (Norman and Streiner 2000). For nonnormally distributed data, paired Wilcoxon rank sum tests were performed with multiple significant P values corrected with Holm's stepwise Bonferroni method. Thus unless otherwise stated, all statistical comparisons are within-neuron, and all P values are corrected or are derived from group-level post hoc tests. Mean values are expressed as means ± SE, and all error bars on graphs show the SE.
For the experiments in which evoked spike latencies were recorded for BLA stimulation alone, mPFC stimulation alone, and paired-pulse BLA/mPFC stimulation (see Tests of mPFC/BLA input interactions), multiple linear regression analyses relating the paired-pulse spike latency to the individual input spike latencies were performed. Thus the model approximation was

where _L_MB is the mean latency of paired-pulse-evoked spikes. The effect of the component latencies on the paired-pulse latencies were determined using marginal _t_-test on the partial slopes (regression coefficients) for each input. In addition, reduced linear models were created

and

and the adjusted coefficient of determination (_R_2) from these models was compared with the complete model in the preceding text. The model that produced the greatest adjusted _R_2 was considered to provide the more complete and efficient fit of the data (Neter et al. 1990). Although there was a positive correlation between _L_mPFC and _L_BLA in the data used for the model in Table 1, the effect of this co-linearity was negligible (variance inflation factor ∼2.3 [Neter et al. 1990]), and analysis of a subset of the data exhibiting less co-linearity (variance inflation factor ∼1.2) produced the same results (not shown).
TABLE 1.
Multiple linear regression relating paired pulse-evoked latency to individual BLA and mPFC input latencies when mPFC current is tuned to evoke a 50% response probability
| Adjusted _R_2 | Regressor | Slope | T | P | |
|---|---|---|---|---|---|
| Full model | |||||
| _L_MB ∼ _L_mPFC + _L_BLA | 0.758 | _L_mPFC | 0.625 ± 0.141 | 4.44 | 0.0005* |
| _L_BLA | 0.106 ± 0.147 | 0.72 | 0.4835 | ||
| Reduced models | |||||
| _L_MB ∼ _L_mPFC | 0.766 | _L_mPFC | 0.700 ± 0.093 | 7.52 | 1 × 10−06 |
| _L_MB ∼ _L_BLA | 0.476 | _L_BLA | 0.589 ± 0.145 | 4.06 | 0.0009 |
Histology
At the end of the experiment, the stimulation electrode placements were marked by electrolytic lesion (100 μA for 10 s). The final position of the recording electrode was marked by iontophoretic ejection of Pontamine Sky Blue dye (−20 μA for 60 min). The rats were decapitated, and their brains were fixed in 8% paraformaldehyde with 1% potassium ferricyanide. After 48 h, the brains were transferred to a cryoprotectant solution of 25% sucrose. They were sliced on a freezing microtome and mounted onto slides for subsequent Nissl staining using standard histological procedures.
The location of the recording and stimulation electrodes was determined using the atlases of Paxinos and Watson (1998, 2005). Neuron locations were reconstructed from the location of the dye deposit and electrode positions noted in the experimental log. Neurons were recorded in both the shell and core subregions of the NAcc. Only neurons that were clearly contained within the core or shell were assigned to a subregion; if the actual or reconstructed location of a neuron was within 0.1 mm of the core/shell border, it was not assigned to either subregion. Of 210 neurons, 197 were plotted onto atlas sections (Fig. 1_C_); the remaining 13 were determined to be in the NAcc but could not be precisely plotted due to section damage or inadequate staining.
FIG. 1.

A: nucleus accumbens (NAcc) neurons excited by basolateral amygdala (BLA) and medial prefrontal cortex (mPFC) were identified by action potentials evoked following stimulation of these regions. The traces show 5 examples of action potentials (thin arrows) evoked by stimulation of mPFC (left) or BLA (right) in the same NAcc neuron. The large arrow heads indicate the stimulation artifacts, which in this and following figures have been cropped for clarity. Scale bar: 3 ms and 0.3 mV. B: schematic of stimulation/recording sites: stimulation electrodes were placed in BLA and mPFC, and extracellular signals were recorded from neurons in the NAcc. C: neurons were recorded from the medial shell (sh) and medial core (co) of the NAcc. The locations of 197/210 neurons recorded in this study are shown in 3 representative atlas sections (Paxinos and Watson 2005). Filled dots represent neurons receiving both BLA and mPFC inputs, and empty circles represent neurons receiving input only from mPFC. D: the locations of 33 representative stimulating electrode placements in the mPFC (top) and BLA (bottom). The electrode leads were exposed for ∼0.8 mm dorsal from the tip; thus for dorsal infralimbic cortex (IL) placements, current spread to prelimbic cortex (PL) was likely, and for basomedial amygdala subnucleus (BM) placements, current spread to basolateral amygdala subnucleus (BL) was likely. DP, dorsal peduncular cortex; LaV, lateral amygdala subnucleus. The numbers and tick marks indicate atlas coordinates in mm.
RESULTS
Properties of BLA- and mPFC-evoked spiking
Extracellular activity was recorded from NAcc neurons in urethane-anesthetized rats. Of 210 neurons recorded, 115 were confirmed to be in the medial shell, and 38 were confirmed to be in the medial core (Fig. 1_C_). The remaining cells were located too close to the core/shell border to confirm their location. Unless otherwise reported, there were no significant differences between core and shell neuronal responses, or there were too few core neurons to perform a statistical comparison; thus core and shell responses were grouped together.
NAcc neurons were selected that received excitatory input from both mPFC and BLA; this was indicated by orthodromically evoked spikes following stimulation of these structures (Fig. 1_A_). The neurons were judged to be suitable for recording if the mean evoked spike latency for both inputs was ≤20 ms; this cut-off corresponds to the maximum BLA-to-NAcc and mPFC-to-NAcc conduction times, which were measured antidromically in separate experiments (Fig. 2). The mean orthodromic activation latencies (recorded in NAcc neurons) were slightly, but significantly longer than the mean antidromic conduction times (recorded in BLA and mPFC neurons), consistent with the synaptic delay due to orthodromic transmission: for mPFC-to-NAcc, orthodromic was 2.7 ± 0.3 ms longer (P < 10-4); for BLA-to-NAcc, 2.2 ± 0.4 ms longer (P < 0.03) by two-sample _t_-test (Fig. 2).
FIG. 2.

Spikes evoked by stimulation of BLA and mPFC are consistent with orthodromic, monosynaptic transmission. The conduction times of neurons projecting from mPFC to NAcc (A, top) and BLA to NAcc (B, top) were determined by antidromic stimulation of NAcc and recordings from mPFC and BLA; mPFC-to-NAcc antidromic mean 11.0 ± 0.3 ms, n = 141 neurons [includes 66 neurons reported in McGinty and Grace (2008), shown in gray]; BLA-to-NAcc antidromic mean 12.1 ± 0.9 ms, n = 41. Orthodromically evoked spike latencies in the NAcc were measured in response to mPFC stimulation (A, bottom) and BLA stimulation (B, bottom). The orthodromic histograms show data only from neurons with mean BLA- and mPFC-evoked spike latencies <20 ms. The black arrowheads indicate the mean value for each histogram. The y axes are number of neurons.
In the NAcc neurons selected for recording, the mean latency of mPFC-evoked spikes was 13.7 ± 0.3 ms (n = 69) and of BLA-evoked spikes was 14.3 ± 0.4 ms (n = 69) (Fig. 2). For 46 neurons in which both were measured, BLA and mPFC input latencies differed on average by 0.8 ± 0.5 ms (P < 0.08) and exhibited a positive correlation (_r_ = 0.421, _P_ < 0.004). In the neurons in which latency variance was also measured (_n_ = 62/69 for BLA, _n_ = 62/69 for mPFC), variance was typically <5 ms (Fig. 3_A_); however, for 10/62 mPFC inputs and 18/62 BLA inputs, the variance was greater. These high variance responses appeared as a broad distribution of evoked action potential latencies (Fig. 3_B_) or in some neurons as a multimodal latency distribution (Fig. 3_C_). Variable or multi-modal evoked spiking may be indicative of polysynaptic input (Mulder et al. 1998). Therefore in some experiments, neurons with large latency variance (>5 ms) were excluded from analysis; however, results did not vary significantly when these neurons were excluded (see following text). In 39 neurons in which the variance of both mPFC and BLA inputs was measured, BLA-evoked variance was greater than mPFC-evoked variance (difference: 1.9 ± 1.2 ms, P < 0.04, paired Wilcoxon rank sum test, not shown), and there was no correlation between the input variances in individual neurons (r = 0.18, P < 0.28, not shown).
FIG. 3.

Evoked spikes exhibited variable latencies. The latency variance of evoked spikes was typically <5 ms (A). However, a minority of neurons exhibited highly variable spike latencies; these neurons fired over a wide range of latencies (B), and approximately half of these high variance neurons exhibited a multimodal latency distribution (C). These examples show mPFC-evoked spikes in 3 different neurons, each with 10 overlaid traces and poststimulus time histogram (PSTH) for 50–200 trials.
Mean mPFC-evoked spike latencies were faster in shell neurons than core neurons: for 33 shell neurons, 12.9 ± 0.4 ms; for 11 core neurons, 14.8 ± 0.7 ms (P < 0.031 by 2-sample _t_-test). BLA-evoked responses also exhibited faster latencies in shell neurons (shell: 13.4 ± 0.5 ms, n = 34; core: 16.0 ± 0.8 ms, n = 13, P < 0.018).
BLA input increases the mPFC-evoked spike probability
The convergence of excitatory BLA and mPFC responses onto single NAcc neurons suggests that simultaneous activation of these inputs will facilitate spike firing. Therefore in neurons receiving both mPFC and BLA inputs, the effect of BLA stimulation on mPFC-evoked spike probability was measured. The mPFC was stimulated at threshold current intensities (∼50% evoked spike probability), and the BLA was stimulated at subthreshold current (no evoked spiking) prior to the mPFC pulse at 1-, 11-, 21-, and 31-ms intervals (Fig. 4_A_). In a sample of 54 neurons, BLA input increased the mPFC-evoked spike probability at both 1- and 11-ms ISIs by 32.3 ± 3.6% (P < 10-4) and 16.7 ± 4.4% (P < 0.001), respectively. The increase at 1 ms was greater than at 11 ms [_P_ < 0.001; effect of ISI, _F_(5,265) = 20.7, _P_ < 10-4; Fig. 4_B_].
FIG. 4.
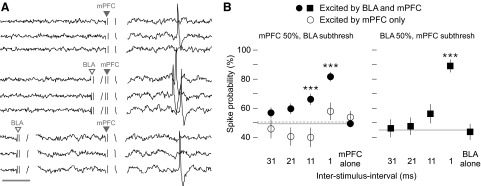
Subthreshold BLA stimulation increased mPFC-evoked spiking at short interspike intervals (ISIs). A: 9 traces from a single neuron; the top 3 show evoked responses (1 spike) to mPFC stimulation (▾); the middle show evoked responses (3 spikes) to mPFC stimulation with subthreshold BLA stimulation (▿) at a 3-ms ISI; the bottom 3 show mPFC with BLA at 18-ms ISI (1 evoked spike). Scale bar: 5 ms. B: in a sample of 54 neurons (left, •, —), BLA stimulation increased mPFC-evoked spiking at 1- and 11-ms ISIs (BLA prior to mPFC). There was no effect on mPFC stimulation alone, presented in interleaved trials. BLA stimulation had no effect in 19 neurons that received only mPFC input (left, ○, - - -). In 21 neurons, the reciprocal experiment was performed (right, ▪): subthreshold mPFC stimulation increased BLA-evoked spiking at 1-ms ISIs. ***, significant difference from both baseline and mPFC alone or BLA alone as appropriate by ANOVA and post hoc tests.
The symmetry of this mPFC/BLA interaction was tested in 21 additional neurons, where _sub_threshold mPFC pulses were paired with threshold (∼50%) stimulation of BLA (mPFC prior to BLA). The probability of BLA-evoked spiking was increased at 1-ms ISI by 45.3 ± 4.8% (P < 10-4) but not at 11 ms [12.4 ± 7.4%, _P_ < 0.30; effect of ISI, _F_(5,100) = 17.4, _P_ < 10-4; Fig. 4_B_]. Neurons that did not exhibit evoked spiking to the BLA input may nonetheless receive excitatory BLA synaptic activity (O'Donnell and Grace 1995) that can modify mPFC-evoked spiking. However, in 19 neurons identified as receiving mPFC input but not BLA input, BLA stimulation (400 μA) did not facilitate mPFC-evoked spiking at any ISI [effect of ISI _F_(5,90) = 2.5, _P_ < 0.04; Fig. 4_B_]. All significance values in the preceding text were derived from ANOVA and group-wise post hoc tests.
Neurons receiving both BLA and mPFC inputs infrequently exhibited inhibition of evoked spiking at longer ISIs. Among 54 neurons tested, 13 (24%) showed a >20% decrease in spike probability at 11-, 21-, or 31-ms ISIs (not shown). Such inhibitory responses appeared to be more prominent in neurons that received only BLA input (11 of 19, 58%), but this effect did not reach statistical significance in our sample (Fig. 4_B_).
To test whether dopamine- or NMDA-dependent mechanisms contributed to the BLA facilitation of mPFC-evoked spiking, these experiments were repeated in a separate population of neurons after systemic administration of dopamine D1 (SCH23390, 0.5 mg/kg, n = 14 neurons), D2 (eticlopride or raclopride, 0.2 or 0.1 mg/kg, respectively, n = 15), or NMDA channel blocking drugs (MK801, 0.05–0.1 mg/kg, n = 11). Drug administration had no effect on the facilitatory influence of BLA stimulation (Fig. 5).
FIG. 5.

_N_-methyl-d-aspartate (NMDA) channel or dopamine (DA) receptor blockade did not change the BLA-mediated facilitation of mPFC-evoked spiking. A: subthreshold BLA stimulation was paired with threshold mPFC stimulation at different ISIs (BLA prior to mPFC, as in Fig. 4_B_, left) after systemic administration of the NMDA channel blocker MK801 (n = 11, 7 rats), the D1 antagonist SCH23390 (n = 14, 12 rats) or the D2 antagonists eticlopride or raclopride (n = 15, 13 rats). See methods for dose information. *, **, and ***, significant difference from mPFC alone within drug treatments. B: the increase in evoked spiking compared with mPFC alone at 1-ms (left) and 11-ms ISIs (right). The no drug data are from Fig. 4_B_, left; NMDA, D1 and D2 data are from A. BLA-mediated increases in evoked spike probability showed no significant differences between no drug and any of the drug conditions. The P values for 2-sample _t_-test vs. no drug for the 1-ms ISI were: P > 0.11 (MK801), P > 0.62 (SCH23390), P > 0.16 (D2 antagonists); and for the 11-ms ISI were: P > 0.82 (MK801), P > 0.78 (SCH23390), P > 0.36 (D2 antagonists).
BLA facilitation of mPFC-evoked spiking is dependent on the mPFC-evoked spike probability
The summation of subthreshold BLA- and mPFC-evoked EPSPs has been shown to depend on the amplitude of the evoked potentials (Goto and O'Donnell 2002). Therefore the BLA facilitation of mPFC-evoked spiking was examined over a range of mPFC-evoked spike probabilities. In single NAcc neurons, the mPFC input current versus spiking response curve was measured for mPFC stimulation alone and for mPFC preceded by a subthreshold BLA pulse at 1-, 11-, and 31-ms ISIs (Fig. 6_A_); mPFC currents were varied in increments covering a >70% response range for every ISI. The current/response curves were fit with linear equations, and these fit lines were used to compare the responses at different current amplitudes and ISIs (Fig. 6_B_). The linear equations were well-fit to the data, with a mean r value of 0.88 ± 0.06, and P values of <0.01 for all fits.
FIG. 6.
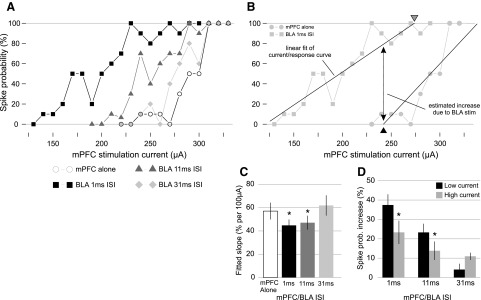
BLA-mediated facilitation of mPFC-evoked spiking was greatest for subthreshold mPFC input. A: the mPFC-evoked spike probability was measured at a range of current intensities; mPFC was stimulated alone or with subthreshold BLA pulses at 1-, 11-, and 31-ms ISIs. The resulting current/response curves are shown for a single neuron. B: the current/response curves for mPFC with BLA were compared with the curve for mPFC alone. The linear portions of the curves were used to calculate the slopes of the current/response relationship in each condition (solid fit lines). From these fit lines, the effect of BLA stimulation at a given ISI (double arrow) was estimated at 2 current intensities: a low current value (black triangle, bottom), and a high current value (gray triangle, top). See methods for details. C: the slope of the current/response curve was reduced by BLA stimulation at 1- and 11-ms ISIs (left, * indicates significant difference from mPFC alone). D: at these 2 ISIs, the estimated effect of BLA stimulation (spike probability increase due to BLA) was greater at low current than at high current (* indicates significant difference from low current within ISI). There was no change in slope or effect of BLA stimulation at 31 ms ISI.
In 19 neurons receiving BLA and mPFC inputs, the slope of the current/response curve for mPFC/BLA at 1-ms ISI was less than the slope for mPFC alone by 12 ± 5% (spike probability) per 100 μA; and the slope at the 11-ms ISI was less than the slope for mPFC alone by 10 ± 5% per 100 μA (P < 0.041 for both ISIs; Fig. 6_C_). The linear fit equations were used to quantify the difference in BLA input efficacy at two different mPFC current intensities: a low current (the 0% response for mPFC alone) and a high current (the 100% response for paired mPFC/BLA input; see methods, Fig. 6_B_). For mPFC/BLA stimulation ISI of 1 ms compared with mPFC alone, the spike probability increase at low current intensity was 14.1 ± 5.1% greater than at high current (P < 0.025); a similar difference was evident for mPFC/BLA at 11 ms compared with mPFC alone (low current 9.5 ± 4.2% greater than high current, P < 0.040). In contrast, there was no significant difference between the effects of low and high stimulation current for mPFC/BLA at 31 ms (−6.6 ± 3.8%, P < 0.08; Fig. 6_D_). These effects were similar in the subset of neurons for which the latency variance of both inputs was <5 ms (n = 13) except that the difference between low and high currents for mPFC/BLA at 11 ms was not statistically significant (not shown). All comparisons in the preceding text were performed with paired Wilcoxon rank sum tests, and multiple significant P values were corrected within groups.
BLA input shifts the latency of mPFC-evoked spikes
The latency and latency variance of spikes evoked by mPFC stimulation alone was compared with that of spikes evoked by BLA and mPFC paired pulses at different ISIs. The evoked spike probability was maintained at ∼50% in all conditions (by adjusting the mPFC current) such that changes in spike latency would not be confounded by changes in spike probability. Eighteen neurons were tested at 1-, 11-, and 31-ms ISIs; an additional 23 neurons were tested at 1-ms ISI only.
Paired-pulse mPFC/BLA stimulation at 1-ms ISI evoked spikes with slightly but consistently shorter latencies than did mPFC stimulation alone (−0.6 ± 0.2 ms, n = 41, P < 0.01; _t_-test). A similar latency decrease was observed at the 11-ms ISI [−1.2 ± 0.4 ms, _n_ = 18, _P_ < 0.002 by ANOVA; effect of ISI, _F_(3,51) = 9.2, _P_ < 10-4; Fig. 7_A_]. The latency decrease with mPFC/BLA at 11-ms ISI was accompanied by a nearly twofold increase in spike latency variance (3.0 ± 1.3 ms, n = 18, P < 0.018 by Wilcoxon rank sum test; Fig. 7_B_). There was no change in latency variance with mPFC/BLA at 1 or 31 ms. These results were the same for neurons with low-latency variance (<5 ms) in the mPFC input (n = 33 for 1-ms, n = 15 for 11- and 31-ms ISI; Fig. 7_B_).
FIG. 7.

BLA input altered the latency and variance of mPFC-evoked spikes. Forty-one neurons were tested at 1-ms ISI, 18 were tested at 1-, 11-, and 31-ms ISIs (BLA prior to mPFC). A: mPFC-evoked spike latency was slightly but significantly reduced by subthreshold BLA stimulation at 1 and 11 (** indicates significant difference from mPFC alone). Differences were assessed with paired _t_-test (mPFC alone vs. 1 ms) or ANOVA and post hoc tests (mPFC alone vs. 11 ms). B: the latency variance was unchanged by 1-ms BLA stimulation (n = 41) but was increased at 11 ms (n = 18). The data for all neurons are shown in the solid bar of the pair, and the data from only low latency variance neurons (<5 ms, n = 33 and n = 15) are shown in the hatched bar. * and *** indicate significant difference from mPFC alone for all neurons and low latency variance neurons, respectively, by paired Wilcoxon rank sum tests. The numbers within the bars indicate the number of neurons.
The latency changes due to BLA input were also examined at the single-neuron level. Although the average latency decreases at 1- and 11-ms ISIs were small, some single neurons exhibited large changes in spike latency due to BLA input (“latency shifts”) that were dependent on the spike latency evoked by mPFC input alone. Neurons with long-latency mPFC alone-evoked spiking exhibited shorter latencies during paired-pulse BLA/mPFC stimulation at 1 ms (Fig. 8_A1_), and a few neurons with short mPFC alone-evoked spike latencies exhibited longer latencies with concurrent BLA input (Fig. 8_A2_). Overall, there was a significant negative correlation between latency shift and mPFC alone-evoked spike latency (r = −0.426, n = 41, P < 0.006); this correlation was particularly strong among neurons with mPFC input latency variances <5 ms (r = −0.695, P < 10-4, n = 33; Fig. 8_B_). Weaker correlations were evident at 11-ms (r = −0.597, P < 0.02, not shown) and 31-ms ISIs (r = −0.532, P < 0.04, not shown).
FIG. 8.
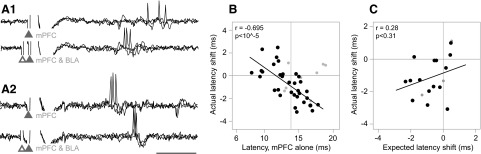
Changes in the spike latency occurring with BLA stimulation were correlated with the spike latency evoked by mPFC input alone. A1: long-latency responses were typically shortened by BLA input. The latency of mPFC evoked spiking for this neuron (top, 3 overlaid traces) was reduced when subthreshold BLA stimulation was applied at 1 ms (bottom, 3 overlaid traces). A2: in a few neurons, short spike latencies were lengthened by concurrent BLA input. In this neuron, the mPFC evoked spike latency (top, 3 traces) was increased during mPFC/BLA stimulation at 1-ms ISI (bottom, 3 traces). mPFC and BLA stimulation artifacts are at the ▴ and ▵, respectively. Scale bar: 5 ms. B: the change in spike latency during 1-ms mPFC/BLA stimulation (y axis) was negatively correlated with the latency of spikes evoked mPFC stimulation alone (x axis). •, neurons with low-latency variance (n = 33/41);  , neurons with high latency variance (n = 8/41). The fit line and statistics are for the low variance neurons only. The vertical axis line indicates the mean of the mPFC-evoked latency. C: the expected latency shift did not predict the actual change in latency. The discrepancy between the BLA and mPFC input latencies (“expected latency shift”, see methods) was compared with the change in latency during paired-pulse mPFC/BLA stimulation at 1-ms ISI. While 1-ms BLA stimulation changed the mPFC-evoked response latency (B), this change was not correlated with expected latency shift. •, low-latency variance neurons (n = 15/18); , high variance neurons (n = 3/18). Fit line and statistics refer to the low variance neurons.
To determine whether the BLA-mediated latency shifts could be explained by the latency of BLA inputs, in a subset of neurons (n = 18), the latency of BLA-evoked spiking was measured in addition to the mPFC-evoked and paired-pulse-evoked spike latencies. The latency shift due to mPFC/BLA at 1 ms was compared with the timing discrepancy between the BLA and mPFC inputs (“expected latency shift”, see methods). The observed latency shift due to paired-pulse stimulation at 1 ms was not correlated with the expected latency shift (r = 0.387, P < 0.11 for all neurons; r = 0.280 P < 0.31 for 15/18 low-latency variance neurons; Fig. 8_C_).
This result suggested that the BLA-evoked spike latency had little influence on the paired-pulse-evoked latency under these conditions. To directly test this, a multiple linear regression was performed that related the paired-pulse evoked latency at 1-ms ISI (dependent variable) to the individual BLA- and mPFC-evoked latencies for each neuron (independent variables; see methods). In 18 neurons, mPFC input latency, but not BLA input latency, contributed significantly to the regression (Table 1). Furthermore, exploratory step-wise modeling revealed that a model with mPFC input latency as the sole independent variable produced a better fit (greater adjusted _R_2) than the full model containing both input latencies (Table 1). Thus the BLA input latency contributed negligibly to the model fit.
Subthreshold paired stimulation evoked spikes at latencies that reflected both BLA and mPFC inputs
Suprathreshold spikes in NAcc neurons elicited by activation of two subthreshold excitatory inputs have been observed (Finch 1996) but not measured in detail. Therefore the probability and timing of spikes evoked by paired mPFC/BLA pulses at 1-ms ISI were measured using subthreshold current intensities for both inputs (Fig. 9_A_). As in the preceding text, subthreshold stimulation of either input alone evoked a near 0% spike probability. For the mPFC input, this current was on average 10% less than the current needed to elicit a 50% response probability during paired-pulse stimulation at 1-ms ISI (n = 14, not shown). The spike probability evoked by paired subthreshold stimulation was variable across neurons (range: 6.7–90%) and averaged 37.1 ± 3.8% (n = 38).
FIG. 9.
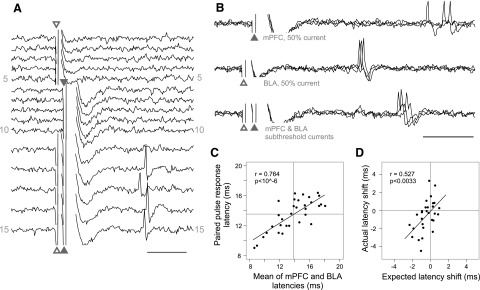
Subthreshold stimulation of BLA and mPFC evoked spikes at latencies that were dependent on the latencies of both inputs. A: traces from a single neuron where subthreshold, coincident stimulation of BLA and mPFC evoked spikes. Stimulation of the BLA (traces 1–5) or mPFC (6–10) did not evoke firing, but both inputs stimulated at 1-ms ISI (11–15) evoked spikes. B: when stimulated at threshold for each input, this neuron (not the same neuron as in A) exhibited mPFC-evoked spikes at mean latency of 16.2 ms (top, 3 traces), and BLA-evoked spikes at 12.5 ms (middle, 3 traces). When both inputs were stimulated at subthreshold currents at 1-ms ISIs, the resulting spikes were at an intermediate latency of 14.6 ms (bottom, 3 traces). Scale bars: 5 ms. C: the latency of coincidentally evoked spikes was correlated with the mean of the individual BLA and mPFC input latencies (fit line and statistics). The axis lines are the marginal means. D: the expected latency shift (based on the mPFC/BLA input latency difference) was correlated with the actual latency shift (fit lines, statistics, excluding 3 outlying points not shown). Thus when both BLA and mPFC inputs were at subthreshold intensities, the mPFC/BLA input latency difference predicted the change in latency due to coincident stimulation. This was not observed when mPFC current was tuned to evoke a 50% response probability (Fig. 8_C_).
For 32/38 neurons, the individual BLA input and mPFC input latencies were measured in addition to the paired-pulse spike latency. The mean of the BLA and mPFC input latencies was highly correlated with the latency of the paired-pulse-evoked spikes (r = 0.764, P < 10-4; Fig. 9_C_). In addition, the expected shift in latency was correlated with the actual shift in latency due to paired mPFC/BLA stimulation (_r_ = 0.569 _P_ < 0.001). Three neurons exhibited large expected and actual latency shifts (>5 ms); excluding their influence, r = 0.527 and P < 0.004 (Fig. 9_D_).
Thus the timing difference between mPFC and BLA inputs predicted the change in latency due to paired-pulse stimulation; this was substantially different from the relationship observed when mPFC current was tuned to a 50% response (see preceding text, Fig. 8_C_). This suggested that when BLA and mPFC inputs were both activated at subthreshold intensities, both inputs influenced the latency of paired-pulse-evoked spikes. To explicitly test this, the latency of the jointly evoked spikes was fitted to the latencies of the individual mPFC- and BLA-evoked inputs in a multiple linear regression model. Both input latencies contributed significantly to the model (Table 2). Furthermore, step-wise exploratory modeling showed that the best fit was achieved when both mPFC and BLA input latencies were used as regressors, suggesting that both inputs contributed to the model fit (Table 2). Thus both inputs predicted the paired-pulse response timing when they were stimulated at subthreshold currents.
TABLE 2.
Multiple linear regression relating paired pulse-evoked latency to the component input latencies when using subthreshold stimulation of both inputs
| Adjusted _R_2 | Regressor | Slope | T | P | |
|---|---|---|---|---|---|
| Full model | |||||
| _L_MB ∼ _L_mPFC + _L_BLA | 0.576 | _L_mPFC | 0.420 ± 0.102 | 4.12 | 0.0003* |
| _L_BLA | 0.232 ± 0.084 | 2.78 | 0.0095* | ||
| Reduced models | |||||
| _L_MB ∼ _L_mPFC | 0.481 | _L_mPFC | 0.548 ± 0.101 | 5.45 | 7 × 10⁻⁶ |
| _L_MB ∼ _L_BLA | 0.350 | _L_BLA | 0.389 ± 0.092 | 4.21 | 0.0002 |
DISCUSSION
The convergence of limbic and cortical afferents is a key feature of the NAcc that distinguishes it from other striatal regions. Synaptic input summation within single NAcc medium spiny neurons is thought to be a substrate for the integration of emotional, contextual and goal-directed drives (Grace 2000; O'Donnell and Grace 1995). While this integration has been characterized at subthreshold intensities (Carter et al. 2007; Goto and O'Donnell 2002), the present study shows in detail the effects of coincident cortical and limbic activation on NAcc neuron spike output. In neurons receiving converging excitation from BLA and mPFC, BLA input facilitated mPFC-evoked spiking, and this facilitation was greatest when the mPFC-evoked spike probability was near 0%. When BLA and mPFC were both stimulated at subthreshold intensities, the timing of spikes elicited by coincident stimulation reflected the timing of the two component inputs. Thus BLA input both augmented and shifted the latency of mPFC-evoked spikes. These interactions may form the basis for the integration of goal- and motivation-related signals at the single-cell level and thus may be crucial mechanisms that support reward-directed actions.
mPFC- and BLA-evoked spiking in NAcc neurons
Neurons were selected based on their evoked spiking responses to BLA and mPFC. By targeting these neurons specifically, our findings show interactions that otherwise might not be evident if a more heterogeneous sample of NAcc neurons was evaluated (Goto and O'Donnell 2002). Thus identifying and recording a sufficiently large number of BLA- and mPFC-excited neurons is a distinct advantage of the extracellular recording method used here. Because afferent stimulation is not usually observed to evoke action potentials in NAcc neurons (Brady and O'Donnell 2004; O'Donnell and Grace 1995), the cells recorded likely make up only a small subset of NAcc medium spiny neurons. This evoked spiking may be attributable to particularly dense innervation from the target regions or to the patterns of afferent fibers activated by electrical stimulation, as spiking activity is thought to reflect synaptic input rather than the intrinsic properties of the neurons (Wickens and Wilson 1998). Furthermore, the latency variances of BLA- and mPFC-evoked spikes showed no evidence of correlation in single neurons, suggesting that evoked spiking was dependent on the properties of the individual synaptic inputs rather than the intrinsic neuronal characteristics. Although a minority of neurons exhibited variable evoked spike latencies that may indicate polysynaptic excitatory input (Mulder et al. 1998), our findings were not substantially different when only low variance (i.e., putatively monosynaptic) responses were analyzed alone. Thus the functional impact of input integration may be similar for monosynaptic and nonmonosynaptic excitatory inputs. Most NAcc medium spiny neurons exhibit EPSPs evoked from several sites (O'Donnell and Grace 1995) [consistent with anatomical evidence (French and Totterdell 2003)], suggesting that converging excitatory inputs are common in these neurons. Thus although a comparatively narrowly defined selection of neurons was recorded, the results should be applicable to NAcc medium spiny neurons in general.
Bistable membrane states in NAcc neurons impact the integration of afferent inputs (Kerr and Plenz 2002; O'Donnell and Grace 1995; Wilson and Kawaguchi 1996); however, the extracellular recording approach used in the current study could not take such transitions into account. Responses were sampled over many regularly spaced trials, so that the data almost certainly include spikes elicited from both depolarized and hyperpolarized membrane potentials. Because mPFC/BLA input integration may depend on the membrane potential from which the responses are evoked (Goto and O'Donnell 2002), the effects reported here may reflect the average influence of postsynaptic active properties.
Mechanisms of integration
The BLA-mediated increase in mPFC-evoked spike probability was critically dependent on the timing of the two inputs. Facilitation was maximal at ISIs of 1 ms, of intermediate value at 11 ms, and nonexistent at ≥21 ms. This narrow window for integration corresponds closely to the latency distributions of spikes evoked orthodromically from the two structures. While NDMA channels contribute to excitatory synaptic currents (Carter et al. 2007) and DA has been shown to modulate excitatory inputs to NAcc neurons (Brady and O'Donnell 2004; Goto and Grace 2005), blockade of NMDA channels or DA receptors did not attenuate the BLA-mediated increase in spike firing. The lack of efficacy of DA receptor blockade in particular is notable (cf. Moyer et al. 2007; Nicola et al. 2004a) and could be explained by the focus of the current study on evoked spiking rather than subthreshold (Brady and O'Donnell 2004) or population-evoked potentials (Goto and Grace 2005). To reconcile these different accounts of DA actions in NAcc neurons, it may be necessary to measure evoked activity at multiple scales simultaneously and to test drug effects within single neurons (rather than between neurons as in the current study). In summary, these results suggest that non-NMDA, non-DA, fast synaptic excitatory activity provides the primary drive for evoked spiking due to low-frequency afferent electrical stimulation. In a minority of neurons, BLA-mediated decreases in mPFC-evoked spiking were evident, suggesting that locally evoked, feed-forward inhibitory events (Pennartz and Kitai 1991) were also present as BLA and mPFC inputs were integrated. BLA input effects on spike timing were not tested in the presence of NMDA or DA-blocking drugs; thus it is not known of these receptors participate in other aspects of limbic/cortical synaptic input integration.
Interestingly, the influence of the BLA on the current/response slope (Fig. 6_C_) was not as strongly timing dependent as its influence on spike probability (Fig. 4_B_), suggesting that other mechanisms may contribute to this effect. BLA input attenuated the slope of the mPFC current/spike output curve at 1- and 11-ms ISIs but not at 31 ms; however (unlike the change in spike probability), the changes in slopes at 1 and 11 ms were approximately equal (−12 and −10%/100 μA, respectively). Although more data are necessary to determine the precise duration, these findings suggest that the effect of BLA stimulation on the mPFC input/spike output relationship persists for ≥11 ms after the activation of the BLA. It is possible that the depolarizing influence of the BLA could open voltage-dependent, slowly inactivating conductances, and that the resultant long-lasting decrease in input resistance could attenuate the current/response relationship. NAcc neurons exhibit several voltage-sensitive conductances; however, without direct evidence, it is difficult to derive which specific conductances might contribute to this effect. Furthermore, other mechanisms could also account for or contribute to these observations, such as spike threshold changes related to EPSP kinetics (Wickens and Wilson 1998), EPSP interactions with bistable states (O'Donnell and Grace 1995; Wilson and Kawaguchi 1996), changes in NMDA current (Wolf et al. 2005), and passive properties of dendrites. Intracellular observations of BLA- and mPFC-evoked EPSPs would be necessary to determine the specific mechanisms underlying activity-dependent input summation as well as the role of bistable membrane fluctuations.
In addition to facilitating mPFC-evoked spiking, BLA input shifted the latency of mPFC-evoked spikes. This shift (including latency increases and decrease) was maximal at a 1-ms ISI, and at the 11-ms ISI was accompanied by an increased latency variance, possibly reflecting a prolonged poststimulus excitation due to asynchronous synaptic activity. When mPFC and BLA inputs were both stimulated at subthreshold intensities (1-ms ISI), the latency of the jointly evoked spikes was optimally described by the timing of the individual BLA and mPFC inputs in the recorded neuron. In contrast, when mPFC current was tuned to produce a 50% response during coincident stimulation (requiring greater mPFC current), the mPFC input latency alone was the best predictor of the coincidentally evoked spike latency. Under these conditions, the average evoked spike latency was virtually unchanged (0.6-ms decrease), while individual neurons exhibited a tendency for their latencies to shift toward the overall mean (Fig. 8_B_). Although the underlying mechanism is not known, this BLA-evoked rectification of spike timing may have functional significance—for example, by promoting synchronous firing in NAcc neurons excited by mPFC input. In summary, spikes elicited by summated excitatory activity reflected both the timing and intensity of the component inputs with stronger inputs determining the spike latency when input intensities were unequal.
In neurons where only mPFC stimulation could evoke spikes, BLA stimulation had no effect on mPFC-evoked spike probability. Although subthreshold evoked events were not measured, it is likely that in these neurons BLA stimulation evoked at least a nominal EPSP (Goto and O'Donnell 2002; O'Donnell and Grace 1995). Thus small BLA-evoked EPSPs may have minimal influence on evoked spiking.
Functional implications
Taken together, these data show that NAcc neurons are able to integrate limbic and cortical synaptic activity in two dimensions: input intensity and input timing. In both cases, integration was most evident when the BLA and mPFC inputs were at similar subthreshold intensities. These findings directly support the hypothesis that NAcc neurons function as coincidence detectors for affective- and goal-related information. Extrapolated to a population of NAcc neurons, these results suggest that weak, coincident activation of two afferent structures may generate activity in a larger ensemble of neurons than activation of either structure alone. Reflecting the timing of both afferent systems, neurons in an ensemble would exhibit firing within the same specific temporal window. Thus ensembles of NAcc neurons may be able to distinguish themselves within the dynamic milieu of NAcc activity by sharing a common timing signature that reflects their common inputs. Because single NAcc neurons receive many inputs that could influence firing, the control of spike timing may be a critical mechanism by which the different afferent structures control the output of NAcc neurons. Higher intensity mPFC stimulation elicited responses that reflected the mPFC timing alone, suggesting that evoked spike timing reflects the component inputs only when those inputs are of equivalent magnitude. Thus strong activation of one afferent structure may be sufficient to disrupt ongoing ensemble activity or create new ensembles based on changing affective, contextual, or cognitive demands.
In behaviors that rely on the mPFC-to-NAcc projection, performance may be optimal when goal-related information from mPFC is coordinated with motivational or contextual information from other inputs. For example, in separate studies, it was reported that NAcc neurons require both an intact BLA (Ambroggi et al. 2008) and an intact mPFC (Ishikawa et al. 2008) to exhibit the excitatory firing patterns that encode reward-associated auditory cues and predict subsequent behavioral responses (Nicola et al. 2004b). Similarly, in rats responding to reward-predictive odor cues, high-accuracy behavioral performance coincides with the emergence of both affective encoding in BLA and apparent motor encoding in orbitofrontal cortex (Schoenbaum et al. 1998). Both BLA and orbitofrontal cortex project to the NAcc, and task-related firing in NAcc neurons appears to reflect both of these inputs (Setlow et al. 2003). Finally, in Pavlovian-conditioned fear, which activates the BLA and the mPFC-to-NAcc projection (McGinty and Grace 2008; Rosenkranz and Grace 2002), adequate input to NAcc from both structures may be necessary to interrupt or re-direct ongoing behavior to permit the expression of defensive fear reactions. Thus integration of information by medium spiny neurons may be the typical mode of NAcc function that allows rapid, consistent responses to stimuli with learned motivational significance.
In contrast, nonoptimal or pathological behavior may result from imbalanced or uncoordinated NAcc afferent activity (Grace 2000). For example, a salient emotional stimulus could interrupt ongoing goal-directed behavior by intensely activating BLA-to-NAcc neurons and imposing a pattern of NAcc activity that reflects affective rather than cognitive demands. In the pathology of drug addiction, relapse may be triggered by just such a mechanism, as addicted individuals exhibit highly elevated amygdala activity in response to drug-associated cues (Kilts et al. 2001). Thus the balance or imbalance of afferent inputs to NAcc neurons may have consequences for normal and pathological cognitive function and reward-directed action.
GRANTS
This work was supported by National Institute of Mental Health Grant MH-57440 A. A. Grace and an Andrew Mellon Fellowship to V. B. McGinty.
Acknowledgments
We thank N. MacMurdo, C. Smolak, and E. Mahar for technical assistance and B. Lowry for development of the Neuroscope software. C. McCracken and D. Lodge provided useful discussions and comments on the manuscript.
Present address of V. B. McGinty: Dept. of Psychiatry, Albert Einstein College of Medicine at Yeshiva University, 1300 Morris Park Ave, Ullmann 103E, Bronx, NY 10461 (E-mail: vmcginty@aecom.yu.edu).
The costs of publication of this article were defrayed in part by the payment of page charges. The article must therefore be hereby marked “_advertisement_” in accordance with 18 U.S.C. Section 1734 solely to indicate this fact.
REFERENCES
- Ambroggi et al. 2008.Ambroggi F, Ishikawa A, Fields HL, Nicola SM. Basolateral amygdala neurons facilitate reward-seeking behavior by exciting nucleus accumbens neurons. Neuron 59: 648–661, 2008. [DOI] [PMC free article] [PubMed] [Google Scholar]
- Biondo et al. 2005.Biondo A-M, Clements R, Hayes D, Eshpeter B, Greenshaw A. NMDA or AMPA/kainate receptor blockade prevents acquisition of conditioned place preference induced by D2/3 dopamine receptor stimulation in rats. Psychopharmacology 179: 189–197, 2005. [DOI] [PubMed] [Google Scholar]
- Block et al. 2007.Block AE, Dhanji H, Thompson-Tardif SF, Floresco SB. Thalamic-prefrontal cortical-ventral striatal circuitry mediates dissociable components of strategy set shifting. Cereb Cortex 17: 1625–1636, 2007. [DOI] [PubMed] [Google Scholar]
- Brady and O'Donnell 2004.Brady AM, O'Donnell P. Dopaminergic modulation of prefrontal cortical input to nucleus accumbens neurons in vivo. J Neurosci 24: 1040–1049, 2004. [DOI] [PMC free article] [PubMed] [Google Scholar]
- Caine and Koob 1994.Caine SB, Koob GF. Effects of dopamine D-1 and D-2 antagonists on cocaine self-administration under different schedules of reinforcement in the rat. J Pharmacol Exp Ther 270: 209–218, 1994. [PubMed] [Google Scholar]
- Carter et al. 2007.Carter AG, Soler-Llavina GJ, Sabatini BL. Timing and location of synaptic inputs determine modes of subthreshold integration in striatal medium spiny neurons. J Neurosci 27: 8967–8977, 2007. [DOI] [PMC free article] [PubMed] [Google Scholar]
- Cervo et al. 2003.Cervo L, Carnovali F, Stark JA, Mennini T. Cocaine-seeking behavior in response to drug-associated stimuli in rats: involvement of D3 and D2 dopamine receptors. Neuropsychopharmacology 28: 1150–1159, 2003. [DOI] [PubMed] [Google Scholar]
- Di Ciano and Everitt 2004.Di Ciano P, Everitt BJ. Direct interactions between the basolateral amygdala and nucleus accumbens core underlie cocaine-seeking behavior by rats. J Neurosci 24: 7167–7173, 2004. [DOI] [PMC free article] [PubMed] [Google Scholar]
- Finch 1996.Finch DM Neurophysiology of converging synaptic inputs from the rat prefrontal cortex, amygdala, midline thalamus, and hippocampal formation onto single neurons of the caudate/putamen and nucleus accumbens. Hippocampus 6: 495–512, 1996. [DOI] [PubMed] [Google Scholar]
- Floresco et al. 2001.Floresco SB, Blaha CD, Yang CR, Phillips AG. Modulation of hippocampal and amygdalar-evoked activity of nucleus accumbens neurons by dopamine: cellular mechanisms of input selection. J Neurosci 21: 2851–2860, 2001. [DOI] [PMC free article] [PubMed] [Google Scholar]
- Floresco et al. 1999.Floresco SB, Braaksma DN, Phillips AG. Thalamic-cortical-striatal circuitry subserves working memory during delayed responding on a radial arm maze. J Neurosci 19: 11061–11071, 1999. [DOI] [PMC free article] [PubMed] [Google Scholar]
- French and Totterdell 2002.French SJ, Totterdell S. Hippocampal and prefrontal cortical inputs monosynaptically converge with individual projection neurons of the nucleus accumbens. J Comp Neurol 446: 151–165, 2002. [DOI] [PubMed] [Google Scholar]
- French and Totterdell 2003.French SJ, Totterdell S. Individual nucleus accumbens-projection neurons receive both basolateral amygdala and ventral subicular afferents in rats. Neuroscience 119: 19–31, 2003. [DOI] [PubMed] [Google Scholar]
- Fuller and Schlag 1976.Fuller JH, Schlag JD. Determination of antidromic excitation by the collision test: problems of interpretation. Brain Res 112: 283–298, 1976. [DOI] [PubMed] [Google Scholar]
- Goto and Grace 2005.Goto Y, Grace AA. Dopaminergic modulation of limbic and cortical drive of nucleus accumbens in goal-directed behavior. Nat Neurosci 8: 805–812, 2005. [DOI] [PubMed] [Google Scholar]
- Goto and O'Donnell 2002.Goto Y, O'Donnell P. Timing-dependent limbic-motor synaptic integration in the nucleus accumbens. Proc Natl Acad Sci USA 99: 13189–13193, 2002. [DOI] [PMC free article] [PubMed] [Google Scholar]
- Grace 2000.Grace AA Gating of information flow within the limbic system and the pathophysiology of schizophrenia. Brain Res Brain Res Rev 31: 330–341, 2000. [DOI] [PubMed] [Google Scholar]
- Ishikawa et al. 2008.Ishikawa A, Ambroggi F, Nicola SM, Fields HL. Dorsomedial prefrontal cortex contribution to behavioral and nucleus accumbens neuronal responses to incentive cues. J Neurosci 28: 5088–5098, 2008. [DOI] [PMC free article] [PubMed] [Google Scholar]
- Jiang and North 1991.Jiang ZG, North RA. Membrane properties and synaptic responses of rat striatal neurons in vitro. J Physiol 443: 533–553, 1991. [DOI] [PMC free article] [PubMed] [Google Scholar]
- Kalivas and Hu 2006.Kalivas PW, Hu XT. Exciting inhibition in psychostimulant addiction. Trends Neurosci 29: 610–616, 2006. [DOI] [PubMed] [Google Scholar]
- Kalivas and Volkow 2005.Kalivas PW, Volkow ND. The neural basis of addiction: a pathology of motivation and choice. Am J Psychiatry 162: 1403–1413, 2005. [DOI] [PubMed] [Google Scholar]
- Kemp and Powell 1971.Kemp JM, Powell TP. The structure of the caudate nucleus of the cat: light and electron microscopy. Philos Trans R Soc Lond B Biol Sci 262: 383–401, 1971. [DOI] [PubMed] [Google Scholar]
- Kerr and Plenz 2002.Kerr JN, Plenz D. Dendritic calcium encodes striatal neuron output during up-states. J Neurosci 22: 1499–1512, 2002. [DOI] [PMC free article] [PubMed] [Google Scholar]
- Kilts et al. 2001.Kilts CD, Schweitzer JB, Quinn CK, Gross RE, Faber TL, Muhammad F, Ely TD, Hoffman JM, Drexler KP. Neural activity related to drug craving in cocaine addiction. Arch Gen Psychiatry 58: 334–341, 2001. [DOI] [PubMed] [Google Scholar]
- Mallet et al. 2005.Mallet N, Le Moine C, Charpier S, Gonon F. Feedforward inhibition of projection neurons by fast-spiking GABA interneurons in the rat striatum in vivo. J Neurosci 25: 3857–3869, 2005. [DOI] [PMC free article] [PubMed] [Google Scholar]
- McGinty and Grace 2008.McGinty VB, Grace AA. Selective activation of medial prefrontal-to-accumbens projection neurons by amygdala stimulation and Pavlovian-conditioned stimuli. Cereb Cortex 18: 1961–1972, 2008. [DOI] [PMC free article] [PubMed] [Google Scholar]
- Mogenson et al. 1980.Mogenson GJ, Jones DL, Yim CY. From motivation to action: functional interface between the limbic system and the motor system. Prog Neurobiol 14: 69–97, 1980. [DOI] [PubMed] [Google Scholar]
- Moyer et al. 2007.Moyer JT, Wolf JA, Finkel LH. Effects of dopaminergic modulation on the integrative properties of the ventral striatal medium spiny neuron. J Neurophysiol 98: 3731–3748, 2007. [DOI] [PubMed] [Google Scholar]
- Mulder et al. 1998.Mulder AB, Hodenpijl MG, Lopes da Silva FH. Electrophysiology of the hippocampal and amygdaloid projections to the nucleus accumbens of the rat: convergence, segregation, and interaction of inputs. J Neurosci 18: 5095–5102, 1998. [DOI] [PMC free article] [PubMed] [Google Scholar]
- Neter et al. 1990.Neter J, Wasserman W, Kutner M. Applied Linear Statistical Models. Burr Ridge, IL: Irwin, 1990.
- Nicola and Deadwyler 2000.Nicola SM, Deadwyler SA. Firing rate of nucleus accumbens neurons is dopamine-dependent and reflects the timing of cocaine-seeking behavior in rats on a progressive ratio schedule of reinforcement. J Neurosci 20: 5526–5537, 2000. [DOI] [PMC free article] [PubMed] [Google Scholar]
- Nicola et al. 2004a.Nicola SM, Woodward Hopf F, Hjelmstad GO. Contrast enhancement: a physiological effect of striatal dopamine? Cell Tissue Res 318: 93–106, 2004a. [DOI] [PubMed] [Google Scholar]
- Nicola et al. 2004b.Nicola SM, Yun IA, Wakabayashi KT, Fields HL. Cue-evoked firing of nucleus accumbens neurons encodes motivational significance during a discriminative stimulus task. J Neurophysiol 91: 1840–1865, 2004b. [DOI] [PubMed] [Google Scholar]
- Norman and Streiner 2000.Norman DR, Streiner DL. Biostatistics: The Bare Essentials. Hamilton, Ontario, Canada: Decker, 2000.
- O'Donnell and Grace 1995.O'Donnell P, Grace AA. Synaptic interactions among excitatory afferents to nucleus accumbens neurons: hippocampal gating of prefrontal cortical input. J Neurosci 15: 3622–3639, 1995. [DOI] [PMC free article] [PubMed] [Google Scholar]
- Ostlund and Balleine 2005.Ostlund SB, Balleine BW. Lesions of medial prefrontal cortex disrupt the acquisition but not the expression of goal-directed learning. J Neurosci 25: 7763–7770, 2005. [DOI] [PMC free article] [PubMed] [Google Scholar]
- Paton et al. 2006.Paton JJ, Belova MA, Morrison SE, Salzman CD. The primate amygdala represents the positive and negative value of visual stimuli during learning. Nature 439: 865–870, 2006. [DOI] [PMC free article] [PubMed] [Google Scholar]
- Paxinos and Watson 1998.Paxinos G, Watson C. The Rat Brain in Stereotaxic Coordinates (4th ed,). San Diego, CA: Academic, 1998.
- Paxinos and Watson 2005.Paxinos G, Watson C. The Rat Brain in Stereotaxic Coordinates, (5th ed.). San Diego, CA: Elsevier Academic, 2005.
- Pennartz and Kitai 1991.Pennartz CM, Kitai ST. Hippocampal inputs to identified neurons in an in vitro slice preparation of the rat nucleus accumbens: evidence for feed-forward inhibition. J Neurosci 11: 2838–2847, 1991. [DOI] [PMC free article] [PubMed] [Google Scholar]
- R Development Core 2005.R Development Core Team. A Language and Environment for Statistical Computing. Vienna, Austria: R Foundation for Statistical Computing, 2005.
- Rosenkranz and Grace 2002.Rosenkranz JA, Grace AA. Dopamine-mediated modulation of odour-evoked amygdala potentials during pavlovian conditioning. Nature 417: 282–287, 2002. [DOI] [PubMed] [Google Scholar]
- Schoenbaum et al. 1998.Schoenbaum G, Chiba AA, Gallagher M. Orbitofrontal cortex and basolateral amygdala encode expected outcomes during learning. Nat Neurosci 1: 155–159, 1998. [DOI] [PubMed] [Google Scholar]
- Setlow et al. 2003.Setlow B, Schoenbaum G, Gallagher M. Neural encoding in ventral striatum during olfactory discrimination learning. Neuron 38: 625–636, 2003. [DOI] [PubMed] [Google Scholar]
- Wickens and Wilson 1998.Wickens JR, Wilson CJ. Regulation of action-potential firing in spiny neurons of the rat neostriatum in vivo. J Neurophysiol 79: 2358–2364, 1998. [DOI] [PubMed] [Google Scholar]
- Wilson et al. 1990.Wilson CJ, Chang HT, Kitai ST. Firing patterns and synaptic potentials of identified giant aspiny interneurons in the rat neostriatum. J Neurosci 10: 508–519, 1990. [DOI] [PMC free article] [PubMed] [Google Scholar]
- Wilson and Kawaguchi 1996.Wilson CJ, Kawaguchi Y. The origins of two-state spontaneous membrane potential fluctuations of neostriatal spiny neurons. J Neurosci 16: 2397–2410, 1996. [DOI] [PMC free article] [PubMed] [Google Scholar]
- Wolf et al. 2005.Wolf JA, Moyer JT, Lazarewicz MT, Contreras D, Benoit-Marand M, O'Donnell P, Finkel LH. NMDA/AMPA ratio impacts state transitions and entrainment to oscillations in a computational model of the nucleus accumbens medium spiny projection neuron. J Neurosci 25: 9080–9095, 2005. [DOI] [PMC free article] [PubMed] [Google Scholar]