Iron is Essential for Oligodendrocyte Genesis following Intraspinal Macrophage Activation (original) (raw)
. Author manuscript; available in PMC: 2010 Jul 1.
Abstract
Progenitor proliferation and differentiation are necessary for oligodendrocyte replacement. Previously, we showed that intraspinal activation of microglia and macrophages with the TLR4 agonist lipopolysaccharide (LPS) induced robust oligodendrocyte genesis. In this study we investigated whether this process involves iron since LPS can alter macrophage regulation of iron and its storage protein ferritin, and oligodendrocytes require iron for proper development and myelination. Further, activated macrophages can sequester and release iron and ferritin. We first examined whether iron or ferritin was present following LPS microinjection. Using Perl’s stain, we noted a slight increase in iron at 1d, and peak iron levels 3d post-injection coincident with maximal macrophage activation. Ferritin+ cells were prevalent by 3d and included macrophages and NG2 cells (putative oligodendrocyte progenitors). At 7d, ferritin was mainly expressed by new oligodendrocytes prevalent throughout the lesions. Because of the timing and distribution of iron and ferritin after LPS, we next used an iron chelator to test whether free iron was necessary for maximal LPS-induced oligodendrocyte genesis. Chelating iron by Deferasirox (Exjade®) after LPS microinjection significantly reduced the number of proliferating NG2 cells and new oligodendrocytes. Of the remaining oligodendrocytes, there was a 2-fold decrease in those expressing ferritin revealing that the number of oligodendrocytes with high iron stores was reduced. Collectively, these results establish that iron accumulates after intraspinal TLR4 activation and is required for maximal TLR4-induced oligodendrogenesis. Since TLR4 agonists are abundant in CNS injury/disease sites, these results suggest that iron may be essential for macrophage/oligodendrocyte communication and adult glial replacement.
Keywords: inflammation, polydendrocytes, precursor, spinal cord injury, myelin, Toll-like receptor (TLR), trauma
Introduction
Iron plays an important role in central nervous system (CNS) myelination and inflammation. During development, a spatial-temporal relationship exists involving iron accumulation by microglia and oligodendrocytes. Most iron is present within microglia during the first two weeks after birth; subsequently iron stores shift to oligodendrocytes, which become the major iron-containing cells in the adult CNS (Connor et al., 1995). Coincident with iron uptake by oligodendrocytes is the onset of myelination, which is impaired in iron deficient animals (Connor and Menzies, 1996; Beard et al., 2003; Ortiz et al., 2004). The high metabolic activity required to produce and maintain myelin, a process that relies on iron-dependent enzymes, likely contributes to the high iron content of oligodendrocytes (for review, see Connor and Menzies, 1996).
Iron homeostasis is often disrupted by CNS pathology, which can negatively impact oligodendrocytes. When iron levels becomes abnormally high, as occurs in multiple sclerosis, Parkinson’s disease, Alzheimer’s disease and CNS trauma (Levine, 1997; Smith et al., 1997; Mehindate et al., 2001; Liu et al., 2003; Rathore et al., 2008), oligodendrocytes are particularly vulnerable to death by oxidative damage (for review, see McTigue and Tripathi, 2008). When iron levels are too low, oligodendrogenesis and remyelination can be impaired. Thus, proper iron balance is essential for oligodendrocyte sparing and replacement following CNS injury.
Activated microglia and macrophages can greatly influence iron balance and therefore indirectly affect oligodendrocyte function. For instance, macrophages attempt to prevent the spread of pathogenic infection by sequestering extracellular iron and by removing iron from within other cells (for reviews, see Crichton et al., 2002; Weiss, 2002). Macrophages also engulf extravasated red blood cells thereby removing potentially toxic iron-containing heme (Finch and Huebers, 1982; Huebers and Finch, 1987; Moura et al., 1998). Through cytokine release, activated macrophages can alter levels of iron and the iron storage protein ferritin (Torti et al., 1988; Rogers, 1996; Pinero et al., 2000; Ludwiczek et al., 2003). In certain circumstances, activated macrophages also secrete ferritin, which can be actively taken up by oligodendrocytes and function to promote their survival (Hulet et al., 2000; Zhang et al., 2006). Thus, microglia and macrophages may promote oligodendrocyte survival by removing excess iron and by secreting ferritin, but the same process of iron removal may impair oligodendrocyte replacement and myelination.
Our previous work showed an interesting link between macrophage activation and oligodendrocyte replacement. Following intraspinal microinjection of the TLR4 agonist LPS, microglia/macrophage activation was accompanied by an initial loss of oligodendrocytes followed by robust proliferation and differentiation of new oligodendrocyte lineage cells (Schonberg et al., 2007). Work by others has shown that LPS injected into the intact brain causes iron and ferritin accumulation within macrophages (Zhang et al., 2005). Thus, we hypothesized that iron may play a role in the progenitor proliferation and differentiation occurring after intraspinal LPS injection. Therefore, the present study investigated whether iron or ferritin was present in macrophages, NG2+ progenitors and/or oligodendrocytes following intraspinal LPS injection. Then, to determine if iron is required for LPS-induced oligodendrocyte generation, we treated LPS injected animals with the highly lipophilic iron chelator Exjade, which can chelate extracellular and intracellular iron pools (Neufeld, 2006; Cappellini, 2007). Our results show that iron chelation significantly impaired TLR4-induced progenitor proliferation and new oligodendrocyte formation revealing that iron is a required reagent for maximum oligodendrocyte formation in LPS lesions. Current studies are underway to resolve the specific steps and/or processes regulated by iron in this model. Since TLR4 ligands are prevalent in sites of CNS pathology (Pasinetti et al., 1993; Aravalli et al., 2007; Goos et al., 2007), this work has significance for understanding macrophage-mediated repair mechanisms in multiple CNS injury sites.
Materials and Methods
Microinjections
Adult female Sprague-Dawley rats (230-250 g; n=4/group) were anesthetized with ketamine (80mg/kg, ip) and xylazine (10mg/kg, ip) and given prophylactic antibiotics (Gentocin, 5 mg/kg, sc). Using aseptic technique, a laminectomy was performed at the T8 vertebral level. After removing the dura covering the exposed cord, a glass micropipette (custom pulled and beveled to an external tip diameter of 30-40 μm) was inserted 0.7 mm lateral to midline and 1.1 mm ventral to the surface of the spinal cord. A pneumatic picopump (DKI, Tujunga, CA) was used to slowly inject 200 nl of LPS (1mg/ml, from Escherichia coli 055:B5, Sigma, St. Louis, MO) or vehicle (0.1M phosphate buffered saline (PBS)) into the lateral white matter. After injection, the micropipette remained in place for 5 min to prevent back flow; the micropipette was then slowly withdrawn and the injection site was marked with sterile charcoal (Sigma). Following injection, the musculature surrounding the laminectomy was sutured, the skin was closed with wound clips, and each rat was given 5 ml of saline prior to placement in a warmed recovery cage. Rats were randomly divided into groups that survived 1d, 3d, 7d or 14d after spinal injection (n=4/group).
Exjade Administration
A separate set of animals received an intraspinal microinjection of LPS as above and then was randomly divided into a vehicle control group or one of two different Exjade treatment groups. Control animals received an oral feeding of 0.5ml of vehicle (30% sucrose water) one hour after LPS injection and then once daily for 7d (n=4). One group of Exjade treated animals was given 0.5ml of Exjade (Novartis; 20mg/ml) orally one hour post-LPS injection and then once daily for 7d (n=4/group). The second group of Exjade animals was identical to the first but had an additional dose of 0.5μL of Exjade (20mg/ml) injected intraspinally into the vicinity of the LPS microinjection site immediately after LPS delivery (n=4/group).
For all 1h post-injection feedings, a 1cc syringe and feeding tube was used to perform oral gavage. For each subsequent feeding, a small volume of solution was gently placed into each animal’s mouth using a 1cc syringe. Once that was swallowed, the process was continued until the entire dose was delivered. All rats survived for 7d after LPS treatment.
BrdU Administration
To label proliferating cells, the thymidine analog 5-Bromo-2′-deoxy-uridine (BrdU, 20 mg/ml in sterile saline; Sigma) was injected intraperitoneally (50mg/kg) one hour following surgery and then once a day for 7d post-injection.
Tissue Processing
At the time of sacrifice, rats were deeply anesthetized with ketamine and xylazine (1.5× surgery dose above) and then perfused transcardially with PBS followed by 250 ml of 4% paraformaldehyde in PBS. Spinal cords were removed, post-fixed for 2 h at 4° C, and placed in 0.2M phosphate buffer (PB) overnight. Tissue was cryoprotected in 30% sucrose at 4°C for 48 hours. For tissue embedding, spinal cords were frozen on dry ice and cut into 4 mm blocks centered on the injection site. After submersion in OCT compound (Electron Microscopy Sciences, Hatfield, PA), blocks were frozen and cross-sections were cut at 10 μm on a cryostat and mounted onto slides. Tissue was stored at -20°C until used.
Iron Labeling
The Prussian Blue reaction (Perl’s) was used to visualize intraspinal iron. Briefly, slides were rinsed in 0.1M PBS followed by a 10 min incubation in 0.1% Triton-100/PBS solution. Next slides were immersed in a solution containing equal amounts of 4% potassium ferrocyanide and 4% hydrochloric acid for 30 min in the dark. After PBS rinses and 10 min incubation in 0.1% Triton-100/PBS, iron was visualized using 3,3-diaminobenzidine (DAB; Vector) for 30 min at room temperature in the dark. Sections were rinsed in distilled water, quickly dehydrated and coverslipped with Permount (Fisher Scientific, Pittsburgh, PA).
Immunohistochemistry
Sections were rinsed in 0.1M PBS and blocked for non-specific antigen binding using either 4% BSA/0.1% Triton-100/PBS (BP+) or 10% NHS/PBS for one hour. Next, sections were incubated in primary antibody overnight at 4°C. Sections were rinsed and treated with mouse or rabbit biotinylated antiserum (horse anti-mouse IgG 1:800 or goat anti-rabbit IgG 1:4000 in BP+, Vector, Burlingame, CA) for 1 h at room temperature. After rinsing, endogenous peroxidase activity was quenched using a 4:1 solution of methanol/30% hydrogen peroxide for 15 min in the dark. Sections were then treated with Elite avidin-biotin enzyme complex (ABC; Vector) for 1 h. Visualization of labeling was achieved using DAB or SG substrates (Vector). Sections were rinsed, dehydrated and coverslipped with Permount (Fisher Scientific). For BrdU immunohistochemistry, sections were treated with 2N HCL at 37° C for 25 min prior to primary antibody incubation. Sections labeled with CC1 and GFAP antibodies to identify oligodendrocytes and astrocytes, respectively, were counterstained with methyl green.
Immunofluorescence
Sections were rinsed in 0.1M PBS and blocked for non-specific antigen binding using BP+ for one hour. Next, sections were incubated in primary antibody overnight at 4° C. Sections were rinsed and treated with Alexa Fluor secondary antibody (1:1000; Molecular Probes, Carlsbad, CA) for 30 min. To label nuclei, Draq5 (1:3000; Biostatus) was added with secondary antibody. For double-and triple-label immunofluorescence, sections were blocked and treated with primary and secondary antibodies as above. After rinses, slides were coverslipped with Immu-Mount (Thermo Scientific, Pittsburgh, PA). See Table 1 for a summary of antibody information.
Table 1.
Antibody information for immunohistochemical labeling
| Antibody Specificity | 1° Concentration | Host Species | Vendor |
|---|---|---|---|
| Ferritin | 1:100 | Rabbit | Santa Cruz |
| Olig2 (oligodendrocytes) | 1:500 | Goat | R&D Systems |
| CC1 (mature oligodendrocytes) | 1:1000 | Mouse | Abcam |
| BrdU (proliferating & new cells) | 1:200 | Mouse | DSHB |
| Ox42 (CD11b expression on microglia & macrophages) | 1:2000 | Mouse | Serotec |
| NG2 (progenitor cells) | 1:1000 (DAB) 1:100 (fluorescence) | Mouse | US Biological |
| GFAP (astrocytes) | 1:2000 | Mouse | Sigma |
Quantitative Analysis
Confocal microscopy (Zeiss 510 META Laser Scanning confocal microscope) was used to visualize cells double-labeled with immunofluorescence in thin optical sections (≤ 1 μm) spanning the lesion sites. Cells were quantified using a grid of six standardized sampling boxes (230μm × 230μm) in a 2×3 orientation. The two central boxes were placed in the lesion center with the additional four boxes in the immediate dorsal and ventral lesion vicinity. A Zeiss Axioskop 2 Plus microscope (Thornwood, NY) with a Sony 970 three-chip color camera was used to analyze non-fluorescent sections containing the injection site. Cells immunoreactive for NG2/BrdU or CC1 were manually counted throughout the lesion. For all cell counts, data are expressed as cells per mm2. The criteria for double-labeled cells included each profile having a well defined border surrounding an identifiable nucleus. A cell was only considered double-labeled if both criteria were met in the same plane of focus.
To measure the lesion area, area occupied by iron and area of activated microglia/macrophages within the lesions, low power images of injection sites were digitized and manually outlined using image analysis software (MCID Elite, InterFocus Imaging Ltd., England). Lesion centers were defined as the area displaying the largest cross-sectional area of activated microglia and macrophages. The proportion of the lesion occupied by macrophages was calculated by dividing the area of OX42 immunoreactivity by the total lesion area. The lesion volume was stereologically calculated using the Cavalieri method (Howard and Reed, 1998) as described previously (Kigerl et al., 2006). No differences were detected in any outcome measures between the two Exjade groups; therefore, the data were combined into one group for comparisons with vehicle controls. Differences between groups over time were compared using a one-way ANOVA followed by Bonferroni post-hoc analysis. When two groups were compared, an unpaired t-test was used. Significance set at p < 0.05. All statistical analyses and graphs were performed using Prism 5.0 (GraphPad Software, San Diego, CA).
Results
Intraspinal iron levels increase following LPS microinjection
Microinjections were targeted to the lateral white matter of the intact adult rat spinal cord. Vehicle injection caused no microglial activation and only baseline levels of iron were visible (Fig. 1A, F). As in our previous work (Schonberg et al., 2007), LPS injected into the lateral funiculus induced pathology in white matter and adjacent gray matter. In LPS lesions, a significant increase in activated microglia and macrophages was present as early as 1d post-injection (Fig. 1_B_, K). At this time, iron levels were not different from controls (Fig. 1_G_, L). At 3d post-injection, a robust macrophage response and intense iron labeling were evident, especially in gray matter adjacent to the injection site (Fig. 1_C_, H). Based on morphology, most iron-containing cells were activated microglia/macrophages. Quantification revealed that iron levels at 3d were significantly greater than at 1d or in vehicle injection sites (Fig. 1_L_). Between 3-14d, the number of activated macrophages declined slightly (Fig. 1_D_, E, K). Iron levels were significantly lower at 7d compared to 3d (although still greater than controls), and then diminished to non-significant levels by 14d post-injection (Fig. 1_I_, J, L). Still, at 14 days, zones of activated microglia/macrophages predicted sites of increased iron accumulation.
Figure 1.

Iron levels were significantly elevated concomitant with maximal microglia and macrophage activation after TLR4 activation. A, Injection of vehicle (Veh) caused no detectable microglial activation (OX42+ cells) (A) and minimal iron accumulation (Perl’s stain) (F). B, As early as 1d after LPS, marginal microglial activation and iron accumulation were evident (G). C, At day 3 after LPS, robust microglia and macrophage activation was mirrored by intense iron labeling (H) in the injection site. Higher magnification suggests that most iron-containing cells at 3d post-injection were microglia and macrophages (H insert). D, At 7d, microglia/macrophages and iron were still elevated over controls (I, K, L). E, By 14d, OX42 labeling declined slightly while iron levels were reduced to non-significant levels (J, K, L). Scale bar = 100 μm (A-J); insert = 20 μm. Data represent mean ± SEM. *, p < 0.05; **, p < 0.01, and ***, p < 0.001.
To determine if iron accumulation was related to TLR4 signaling or if it was a nonspecific event following intraspinal macrophage activation, we examined iron levels in tissue from a previous study in which 200 nl of zymosan, a TLR2 ligand that causes robust microglia and macrophage activation, was microinjected into the lateral spinal white matter in a manner identical to LPS injections used in the present study (Schonberg et al., 2007). Despite the robust microglial and macrophage response, only moderate levels of iron were present in 3d and 7d zymosan injection sites (Fig. 2). This reveals that the extent of iron accumulation by activated microglia and macrophages is determined by specific ligand/receptor interactions and is not a ubiquitous event following macrophage activation.
Figure 2.
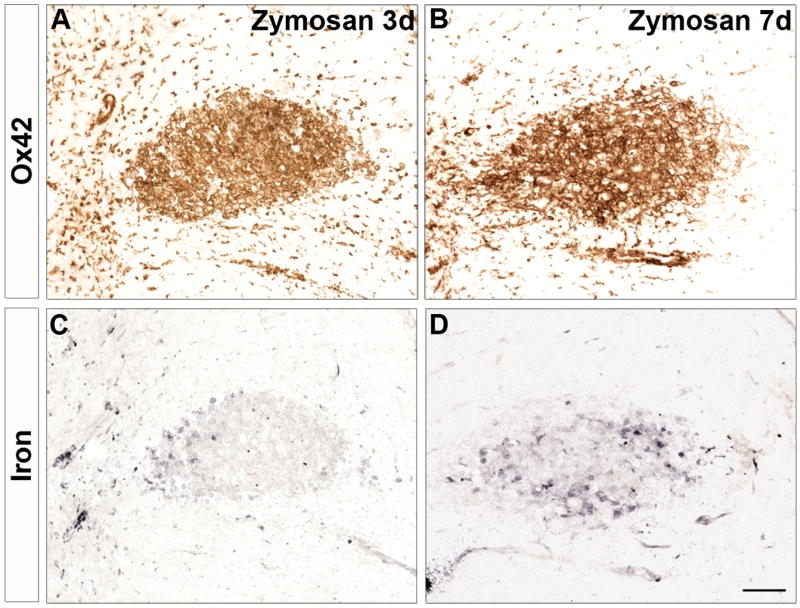
Iron did not accumulate following TLR2 activation of macrophages. Intraspinal injection of zymosan, a TLR2 agonist that potently activates macrophages (A, B), resulted in only moderate iron accumulation at 3d and 7d post-injection (C, D). Scale bar = 100 μm A-D.
Ferritin is expressed by macrophages, NG2 cells and oligodendrocytes in LPS injection sites
Attempts to phenotype iron-containing cells using immunohistochemical markers (e.g., OX42) and Perl’s stain were unsatisfactory. Therefore, since ferritin is the main cellular storage protein for iron and is increased in response to elevated iron loads (for review, see Torti and Torti, 2002), an anti-ferritin antibody was used as a surrogate marker for revealing the levels of cellular iron. In vehicle injection sites, ferritin immunoreactivity was rarely observed confirming the low baseline iron levels observed in uninjected and control spinal cords (see Fig. 1 and 3_A_). At 1d after LPS injection, ferritin expression was slightly increased and was limited to an occasional macrophage within the lesions (Fig. 3_B_). By 3d post-injection, ferritin had markedly increased throughout the lesions and was found predominantly in macrophages within the lesion core (Fig. 3_C_). This finding is in accordance with other studies showing both LPS and cytokine-mediated increases in ferritin expression by macrophages (Fahmy and Young, 1993; Weiss et al., 1997). Interestingly, at 7d post-injection, macrophages expressing ferritin were still present but were no longer the predominant ferritin-expressing cell type (Fig. 3_D_).
Figure 3.

Ferritin expression was increased in macrophages in lipopolysaccharide (LPS) lesions. Merged confocal images (≤1μm) from each injection site labeled for microglia and macrophages (OX42; green), ferritin (red) and cell nuclei (Draq5; blue). A, Vehicle (Veh) injection sites contained resting microglia; ferritin labeling was minimal. B, At 1d after LPS injection, microglia/macrophages were activated and occasionally double-labeled with ferritin (arrows). C, At 3d when microglial activation peaked, ferritin expression was increased and co-localized almost exclusively with OX42+ cells (arrows). D, 7d after LPS injection, ferritin expression was present in macrophages (arrows) and numerous OX42-negative cells (arrowheads). Scale bar = 50 μm (A-D).
Our previous work showed that NG2 cells accumulate in the LPS lesions. Therefore, we next examined whether NG2 cells in the lesions expressed ferritin. At 3d after LPS injection, numerous NG2 cells in the outer rim of the lesions were double-labeled for ferritin, in contrast to control tissue in which NG2 cells did not express detectable levels of ferritin (Fig. 4_A, B_). To the best of our knowledge, this is the first time ferritin expression has been demonstrated in NG2 cells within the CNS. Since NG2 may be expressed by macrophages in CNS lesions, we confirmed the oligodendrocyte lineage of the NG2 cells by double-labeling with Olig2 (Fig. 4_C_). Confocal microscopy revealed that NG2 cells within the lesions contained Olig2+ nuclei, which confirms that NG2 cells were oligodendrocyte progenitors.
Figure 4.

NG2+ oligodendrocyte progenitors in LPS injection sites expressed ferritin at 3d post-injection. A-B, confocal images (≤1μm) were used to identify NG2 cells (green) and ferritin (red) in vehicle (Veh) and LPS injection sites. A, After 3d, vehicle injection sites consisted of few NG2 cells that did not express ferritin (arrow). B, Merged red and green confocal channels reveal multiple NG2 cells in LPS lesions expressed ferritin at 3d (arrows). C, Co-localization of NG2 (green) and Olig2 (red) confirms that NG2 cells were of the oligodendrocyte lineage (arrows). Scale bar = 50 μm (A-C).
Similar to NG2 cells, mature oligodendrocytes expressing detectable ferritin were rarely observed in control tissue (Fig. 5_A_, H). By 1d after LPS, oligodendrocyte numbers were significantly reduced and, of the oligodendrocytes remaining, few expressed ferritin (Fig. 5_B_, C). Since iron and ferritin levels were low at this time, it is unlikely that iron had directly killed the oligodendrocytes. Similar to our previous study, oligodendrocyte numbers markedly rose by 7d after injection. At this time, ~55% of these cells expressed ferritin, which was significantly greater than in controls and earlier time points (Fig. 5_D_-H). Ferritin immunoreactivity was often located in the nucleus as shown previously (Quintana et al., 2006). Many of the ferritin+ oligodendrocytes in the lesions were co-labeled with BrdU confirming that new oligodendrocytes generated within the lesions contained elevated levels of ferritin/iron. The expression of ferritin in NG2+ oligodendrocyte precursors at 3d and then in new oligodendrocytes by 7d suggests that ferritin and/or iron may be involved in oligodendrogenesis occurring during this time.
Figure 5.

Ferritin expression in new oligodendrocytes increased 7d after LPS injection. Confocal images (≤1μm) from vehicle (Veh) and LPS injection sites labeled for oligodendrocytes (CC1; green), ferritin (red), cell nuclei (Draq5; A-C; blue) or proliferating cells (BrdU; D, F, G; blue). A-D, Merged images from Veh (A), LPS 1d (B), LPS 3d (C), and LPS 7d (D) revealed ferritin and CC1 co-localization was not prevalent until 7d after LPS. Many of the ferritin+ oligodendrocytes at 7d after LPS were BrdU+ (blue) revealing that they were generated after LPS injection. E-G, Higher power images from box in D illustrate several oligodendrocytes expressing ferritin and BrdU. Scale bar = 50 μm (A-D), 20 μm (E-G). H, At 1d and 3d following LPS injections, the percentage of oligodendrocytes expressing ferritin in the lesions was not different from controls. By 7d post-injection, there was nearly a 4-fold increase (55% vs. 12%) in the number of oligodendrocytes double-labeled for ferritin. Data represent mean ± SEM. ***, p < 0.001 versus vehicle.
Iron chelation decreased NG2 cell proliferation after LPS injection
Based on the above data, we hypothesized that iron contributes to the process of new oligodendrocyte formation following TLR4 signaling. To test this hypothesis, free iron was chelated by daily treatment with the iron chelator Deferasirox (Exjade®) for 7d after LPS injection. Notably, Exjade treatment did not change the area of macrophage activation (see Fig. 6_F_), tissue swelling or lesion volume (see Supplemental material). This suggests that free iron does not amplify the overall level of macrophage activation, which is in agreement with the above data showing that microglia and macrophage activation precede significant iron accumulation (i.e., 1d vs. 3d, respectively). To determine if iron chelation directly or indirectly altered NG2 cell proliferation after LPS injection, we compared the number of NG2/BrdU cells in LPS-injected animals receiving vehicle or Exjade. In lesions from vehicle-treated rats, the average number of NG2/BrdU cells was 60 cells/mm2 (Fig. 6_A_). In contrast, NG2/BrdU cell numbers were significantly lower in lesions from animals treated with Exjade (36 cells/mm2, p<0.05; Fig. 6_A_).
Figure 6.

Iron chelation after LPS treatment reduced the number of oligodendrocyte lineage cells at 7 days post-injection. A, Treating LPS-injected animals with the iron chelator Exjade significantly reduced the number of NG2/BrdU cells in LPS lesions by 40% compared to animals treated with vehicle (Veh). B, Exjade caused an even greater reduction in new oligodendrocytes, as 50% fewer CC1/BrdU cells were detected in LPS lesions. C, Exjade also reduced the overall number of oligodendrocytes in LPS lesions by ~40%. D-E, Confocal images show fewer oligodendrocytes (green) are present in Exjade-treated animals. F, Quantification of OX42 immunoreactivity in LPS lesions from animals receiving vehicle or Exjade. Data represent mean ± SEM. *, p < 0.05; and ***, p < 0.001 vs. LPS + vehicle. Scale bar = 50 μm (D, E).
LPS-induced oligodendrocyte differentiation and ferritin expression are reduced by iron chelation
Our previous work revealed a striking increase in new oligodendrocytes (CC1+/BrdU+) by 7d after intraspinal LPS injection (Schonberg et al., 2007). Since these new cells most likely arose from proliferating NG2 cells and Exjade reduced NG2 cell proliferation, we next questioned whether the number of new oligodendrocytes was also reduced by Exjade treatment. In sections from LPS+Exjade-treated animals, the number of CC1/BrdU cells at 7d was half that in controls receiving LPS+vehicle (p<0.05; Fig. 6_B_). Since lower oligodendrogenesis could reduce overall oligodendrocyte numbers, we also compared the total number of CC1+ oligodendrocytes from Exjade and vehicle groups. This revealed that the overall number of oligodendrocytes in injection sites was significantly reduced by iron chelation compared to controls (p<0.001; ~300 cells/mm2 vs. 485 cells/mm2, respectively) (Fig. 6_C_-E).
To get an estimate of oligodendrocyte sparing between the two groups, we examined the number of BrdU-negative oligodendrocytes at 7d since these would include oligodendrocytes surviving 1d after LPS treatment. Notably, the numbers were similar in the Exjade and control groups. Thus, the lower oligodendrocyte numbers in Exjade tissue likely reflect a reduction in oligodendrocyte genesis; this indicates that the major influence of iron chelation was on progenitor cell proliferation and subsequent differentiation into new (BrdU+) oligodendrocytes.
It is possible that iron (or ferritin) is only one factor contributing to oligodendrocyte generation after LPS. It is also feasible that Exjade did not chelate 100% of iron in the lesion sites, which may explain why NG2 cell and oligodendrocyte numbers were not reduced to naive levels (gray lines in Fig. 6_A-C_). Since the overall lesion size and area of OX42 immunoreactivity was unaffected by Exjade treatment (Fig. 6_F_; Supplemental material), the decrease in oligodendrocyte lineage cell numbers was not due smaller lesion sizes. Of note, the overall amount of iron detected in the lesions with Perl’s stain was similar between groups (data not shown), suggesting that iron still accumulated in the lesions but was likely bound by the iron chelator and therefore unavailable for use by local cell populations.
The rise in ferritin+/BrdU+ oligodendrocytes between 3d - 7d after LPS suggests that new oligodendrocytes maintain high iron stores during this time. Therefore, we next examined whether lower iron availability due to chelation was reflected in fewer oligodendrocytes expressing ferritin in the lesions. Quantification revealed a significant reduction in ferritin+ oligodendrocytes following iron chelation, which declined from ~60% to <40% (Fig. 7).
Figure 7.

Ferritin+ oligodendrocytes in LPS lesions are reduced by iron chelation. A-C, Single channel and merged confocal images showing ferritin+ oligodendrocytes (arrows) in LPS lesions sites from vehicle (Veh; A-C) and Exjade treated animals (D-F). Ferritin is shown in red (A,D), CC1+ oligodendrocytes are shown in green (B,E), and merged with Draq5 nuclear labeling are shown in C and F. Iron chelation with Exjade resulted in ~40% reduction in the percentage of oligodendrocytes that expressed ferritin (G). A ferritin-negative oligodendrocyte is indicated by an arrowhead in E, F. Data represent mean ± SEM., p = 0.05 vs. LPS + vehicle (Veh). Scale bar = 50 μm (A-F).
Discussion
Our previous data revealed that the TLR4 agonist LPS injected into adult rat spinal cords evokes moderate oligodendrocyte loss by 3d followed by dramatic progenitor proliferation, oligodendrogenesis and a rise in overall oligodendrocyte numbers by 7d after injection (Schonberg et al., 2007). Currently, we examined whether iron is involved in this process since iron is necessary for oligodendrocyte development and is upregulated in the brain by LPS (Zhang et al., 2005). Specifically, the current study determined if iron accumulated in LPS injection sites and, if so, whether it was necessary for LPS-induced oligodendrogenesis to proceed.
We first noted significant iron deposition in lesions 3d after LPS injection, mainly in cells with a macrophage morphology. This correlated with the accumulation of numerous ferritin+ macrophages at this time, indicating that these cells were actively accumulating iron. NG2 cells in the outer lesion margins also expressed ferritin at 3d suggesting that they too had accumulated iron. Most NG2 cells in the lesions also expressed Olig2 revealing that they were oligodendrocyte progenitor cells. By 7d post-injection, we detected a significant increase in oligodendrocytes in the lesions, over half of which expressed ferritin. Thus, the timeframe of 3d – 7d after LPS treatment is a period of marked oligodendrogenesis during which the iron-containing cell population shifted from predominantly macrophages to a mixture of oligodendrocytes and macrophages. This suggests that during the process of progenitor proliferation and differentiation into oligodendrocytes, the newly formed oligodendrocytes take up and store iron and/or ferritin. The iron/ferritin accumulated by these cells may originate from activated microglia and macrophages, as ferritin release by macrophages has been demonstrated in vitro (Zhang et al., 2005). These results are reminiscent of early post-natal CNS development, in which the iron-containing cells shift from microglia at birth to oligodendrocytes as these cells mature and myelinate axons (Connor et al., 1995).
The mere presence of iron or ferritin in new oligodendrocytes does not prove that iron was necessary for their formation. To examine that possibility, we used an iron chelator known to enter the CNS to bind free iron and then determined if oligodendrogenesis was affected. When the chelator was given for 7d after LPS injection, NG2 cell proliferation (the first step for replacing oligodendrocytes) was significantly lower. A reduction in new oligodendrocytes, overall oligodendrocyte numbers and ferritin+ oligodendrocytes in the injection sites accompanied the reduced progenitor proliferation. These results reveal that progenitor proliferation and possibly differentiation following TLR4 activation require available iron or ferritin and that the maximal oligogenic response achievable is impaired by iron chelation.
Direct and/or indirect effects of iron reduction could account for these results. For instance, iron chelation could have changed the level of demyelination present in the lesions thereby reducing oligogenic signals. However, our previous work examined myelination in LPS lesions and revealed that demyelinated axons were rare (Schonberg et al., 2007). Thus, impaired oligodendrocyte genesis following iron chelation is not likely due to reduced signals from bare axons. A more likely scenario is that iron chelation altered macrophage/oligodendrocyte progenitor communication. While macrophage accumulation and maintenance within the lesions was not different after iron chelation, it is possible that their functional potential (e.g., cytokine or growth factor secretion) was altered; this in turn could have reduced the oligogenic signals within the lesion. Or, more simply, reduced iron uptake by macrophages could mean less ferritin was secreted by these cells and available for differentiating progenitors. Thus, iron may influence the function of microglia/macrophages, act directly upon oligodendrocyte progenitors and newly formed oligodendrocytes or both. Studies focused on dissecting the specific pathways regulated by iron are currently ongoing.
Potential iron sources after intraspinal LPS
Microinjecting a small volume of LPS did not cause detectable bleeding into the tissue. Therefore, the elevated iron in the lesions was not due to macrophage endocytosis of erythrocytes. However, it is possible that macrophages obtained iron from the circulation. LPS activation causes macrophages to release tumor necrosis factor-α which in turn can stimulate transcytosis of the iron-containing protein lactoferrin across the blood-brain barrier (Fillebeen et al., 1999). An additional mechanism for obtaining circulating iron could have been increased astrocytic expression of ceruloplasmin, an enzyme that converts ferrous iron released from endothelial cells to the less toxic ferric form (for reviews see Rouault and Cooperman, 2006; Dringen et al., 2007). Astrocyte expression of ceruloplasmin is upregulated by interleukin-1β (Kuhlow et al., 2003), which is produced by microglia and macrophages subsequent to TLR4 activation (Felts et al., 2005; Schonberg et al., 2007). Interestingly, blocking ceruloplasmin expression exacerbates LPS-mediated demyelination (Glezer et al., 2007). Thus, cytokines released by TLR4-activated microglia and macrophages could stimulate an increase in local iron concentration. These mechanisms are consistent with our observation that iron levels do not rise significantly until 3d after macrophage activation by LPS.
It is also possible that early after LPS injection, macrophages actively procured intracellular iron from oligodendrocytes similar to what has been suggested to occur between macrophages and tumor cells (Hibbs et al., 1984). Indeed, oligodendrocytes have the highest concentration of iron in the normal CNS and would provide a rich source for activated macrophages (although baseline levels are below detection limits of the iron stain used herein). In addition, studies have shown that TLR4 stimulation triggers a reduction in iron exporters on macrophages which would translate to decreased iron release from these cells (Peyssonnaux et al., 2006). Because an important function of macrophages is to prevent iron uptake by invading pathogens (for review see Weiss, 2002), it is logical that LPS activation promotes CNS macrophages to take up and retain all available iron.
Based on ferritin expression, it appears that oligodendrocytes accumulate iron 4-7d after LPS injections. Given the distribution of iron and ferritin at 3d, the most likely iron source for oligodendrocytes and progenitors would be macrophages. As TLR4 signaling declines over the first 1-3d, microglia and macrophages may begin releasing intracellular iron, either through re-expression of iron transporters in their cell membranes and/or by direct release of iron-bound ferritin (Zhang et al., 2006). Oligodendrocytes can take up ferritin in a clathrin-dependent manner which in turn promotes their survival (Hulet et al., 2000; Zhang et al., 2006). Therefore, paracrine interactions between macrophages and oligodendrocytes (or their progenitors) may occur following TLR4 activation in which microglia/macrophages initially take up all available iron and subsequently release it to surrounding oligodendrocytes and progenitors. Interestingly, injecting zymosan, a TLR2 agonist, caused marked microglia/macrophage activation with minimal iron accumulation and no oligodendrogenesis. These contrasting effects emphasize the notion that macrophage responses are not generic but are specifically tuned to the molecules and ligands that bind to and activate them. Further, this demonstrates that certain signaling pathways induce macrophage iron accumulation and promote indices of CNS repair.
Iron is required for proper oligodendrocyte formation and myelination
Iron is important for oligodendrocyte metabolism including the synthesis of myelin proteins and lipids (Connor and Menzies, 1996). Since myelination is a metabolically demanding process, oligodendrocytes accumulate iron during neonatal myelination then maintain chronically high iron levels (Connor et al., 1995; Connor and Menzies, 1996). Their dependence on iron was also demonstrated in a model of demyelination and remyelination in the adult rodent brain. Adamo et al. (2006) showed that during cuprizone-induced demyelination, macrophages in the lesions expressed ferritin and contained iron. As remyelination proceeded, iron and ferritin expression shifted to new oligodendrocytes, which parallels the findings of our study, although our model produces very little demyelination (Schonberg et al., 2007). Interestingly, when we examined spinal cords demyelinated by lysolecithin, iron levels were only moderately elevated compared to LPS injected tissue, despite prevalent progenitor cell proliferation and oligodendrocyte generation (Schonberg and McTigue, personal observation). This suggests that the endogenous repair mechanisms initiated in the pathological CNS are context dependent meaning that destructive and reparative processes are not ubiquitously applied across different injury or disease paradigms. Thus, each pathological situation should be carefully investigated to determine the best treatment paradigm. Because high iron levels are toxic, some lesions will likely benefit by iron chelation, such as has been noted following CNS hemorrhage (Masuda et al., 2007), ischemia (Demougeot et al., 2004) and spinal cord injury (Schultke et al., 2003). However, as our data clearly show, some injury sites require a certain level of iron to maximize cell replacement.
TLR4 activation is relevant to CNS injury and disease
Microinjecting TLR agonists is a common technique for studying specific effects of microglia and macrophage activation (for examples, see Lehnardt et al., 2002; Popovich et al., 2002; Felts et al., 2005). We and others have previously shown a marked oligogenic response subsequent to TLR4 activation of microglia and macrophages (Filipovic and Zecevic, 2005; Glezer et al., 2006; Schonberg et al., 2007). Because TLR4 signaling and myelination are both linked to iron utilization, we chose this model to study the relevance of iron to oligodendrogenesis in the adult spinal cord. While we used LPS to activate TLR4, a variety of CNS molecules commonly found in injury sites function as naturally-occurring TLR4 ligands. For instance, the iron-rich molecule heme is a potent TLR4 agonist and is present in the CNS following bleeding or trauma (Figueiredo et al., 2007). Indeed, a major function of macrophages is to engulf aging or extravasated erythrocytes and recycling their hemoglobin-bound iron (Finch and Huebers, 1982; Huebers and Finch, 1987; Moura et al., 1998). Several other injury-associated molecules can activate TLR4, such as fibronectin, heat shock proteins, and hyaluronic acid (Pasinetti et al., 1993; Okamura et al., 2001; Taylor et al., 2004; Mao and Schwarzbauer, 2005; Chen et al., 2007; Goos et al., 2007). Thus, the link between TLR4 signaling, macrophage activation, iron and oligodendrocyte loss and replacement is likely a relevant feature of multiple CNS pathological states.
Summary
Iron is essential for normal cell functions. Too much iron, however, is dangerous and leads to free radical formation and cellular destruction. Consequently, iron levels are tightly regulated in the CNS and throughout the body. Our data reveal that TLR4-induced intraspinal macrophage activation leads to a significant increase in local iron concentration, which appears essential for oligodendrocyte precursor turnover and subsequent new oligodendrocyte formation. Elevated iron and ferritin have been detected in many pathological CNS sites, including multiple sclerosis, Alzheimer’s disease, Parkinson’s disease, Huntington’s disease as well as spinal cord injuries and intracerebral hemorrhage (Levine, 1997; Ge et al., 2007; Simmons et al., 2007; Wu et al., 2003; Liu et al., 2003; Berg et al., 2001; Rathore et al., 2008). Thus, understanding mechanisms regulating iron levels and those regulated by iron is essential so that destructive pathways can be minimized without compromising reparative processes that depend upon available iron.
Supplementary Material
01. Supplemental Figure.
Low power (2.5x) magnification of spinal cord cross-sections from LPS + vehicle (A) and LPS + Exjade (B) injection sites. Sections were labeled with OX42 antibody, a marker of microglia/macrophages. Inserts consist of adjacent sections displaying axons and myelin; labeled with anti-neurofilament antibody (NF; brown) and Eriochrome Cyanine (EC; blue) respectively, as described previously (Schonberg et al., 2007). Using Cavalieri’s method to calculate lesion volumes, no differences were observed between LPS + vehicle and LPS + Exjade groups based upon OX42 labeling (C). Data represent mean ± SEM. Scale bar = 500 μm (A, B).
Acknowledgments
The authors gratefully acknowledge Drs. Phillip Popovich and Kristina Kigerl for critical review of the manuscript and Ping Wei and A. Todd Lash for excellent technical assistance. The BrdU antibody developed by S.J. Kaufman was obtained from the Developmental Studies Hybridoma bank, developed under the auspices of the NICHD and maintained by the University of Iowa, Department of Biological Sciences, Iowa City, IA 552242. This work was funded by NINDS NS043494, NS and P30-NS045758.
Footnotes
Publisher's Disclaimer: This is a PDF file of an unedited manuscript that has been accepted for publication. As a service to our customers we are providing this early version of the manuscript. The manuscript will undergo copyediting, typesetting, and review of the resulting proof before it is published in its final citable form. Please note that during the production process errors may be discovered which could affect the content, and all legal disclaimers that apply to the journal pertain.
References
- Adamo AM, Paez PM, Escobar Cabrera OE, Wolfson M, Franco PG, Pasquini JM, Soto EF. Remyelination after cuprizone-induced demyelination in the rat is stimulated by apotransferrin. Exp Neurol. 2006;198:519–529. doi: 10.1016/j.expneurol.2005.12.027. [DOI] [PubMed] [Google Scholar]
- Aravalli RN, Peterson PK, Lokensgard JR. Toll-like receptors in defense and damage of the central nervous system. J Neuroimmune Pharmacol. 2007;2:297–312. doi: 10.1007/s11481-007-9071-5. [DOI] [PubMed] [Google Scholar]
- Beard JL, Wiesinger JA, Connor JR. Pre-and postweaning iron deficiency alters myelination in Sprague-Dawley rats. Dev Neurosci. 2003;25:308–315. doi: 10.1159/000073507. [DOI] [PubMed] [Google Scholar]
- Berg D, Gerlach M, Youdim MB, Double KL, Zecca L, Riederer P, Becker G. Brain iron pathways and their relevance to Parkinson’s disease. J Neurochem. 2001;79:225–236. doi: 10.1046/j.1471-4159.2001.00608.x. [DOI] [PubMed] [Google Scholar]
- Cappellini DM. Exjade® (deferasirox, ICL670) in the treatment of chronic iron overload associated with blood transfusion. Ther Clin Risk Manag. 2007;3:291–299. doi: 10.2147/tcrm.2007.3.2.291. [DOI] [PMC free article] [PubMed] [Google Scholar]
- Chen K, Huang J, Gong W, Iribarren P, Dunlop NM, Wang JM. Toll-like receptors in inflammation, infection and cancer. Int Immunopharmacol. 2007;7:1271–1285. doi: 10.1016/j.intimp.2007.05.016. [DOI] [PubMed] [Google Scholar]
- Connor JR, Menzies SL. Relationship of iron to oligodendrocytes and myelination. Glia. 1996;17:83–93. doi: 10.1002/(SICI)1098-1136(199606)17:2<83::AID-GLIA1>3.0.CO;2-7. [DOI] [PubMed] [Google Scholar]
- Connor JR, Pavlick G, Karli D, Menzies SL, Palmer C. A histochemical study of iron-positive cells in the developing rat brain. J Comp Neurol. 1995;355:111–123. doi: 10.1002/cne.903550112. [DOI] [PubMed] [Google Scholar]
- Crichton RR, Wilmet S, Legssyer R, Ward RJ. Molecular and cellular mechanisms of iron homeostasis and toxicity in mammalian cells. J Inorg Biochem. 2002;91:9–18. doi: 10.1016/s0162-0134(02)00461-0. [DOI] [PubMed] [Google Scholar]
- Demougeot C, Van HM, Bertrand N, Prigent-Tessier A, Mossiat C, Beley A, Marie C. Cytoprotective efficacy and mechanisms of the liposoluble iron chelator 2,2’-dipyridyl in the rat photothrombotic ischemic stroke model. J Pharmacol Exp Ther. 2004;311:1080–1087. doi: 10.1124/jpet.104.072744. [DOI] [PubMed] [Google Scholar]
- Dringen R, Bishop GM, Koeppe M, Dang TN, Robinson SR. The pivotal role of astrocytes in the metabolism of iron in the brain. Neurochem Res. 2007;32:1884–1890. doi: 10.1007/s11064-007-9375-0. [DOI] [PubMed] [Google Scholar]
- Fahmy M, Young SP. Modulation of iron metabolism in monocyte cell line U937 by inflammatory cytokines: changes in transferrin uptake, iron handling and ferritin mRNA. Biochem J. 1993;296(Pt 1):175–181. doi: 10.1042/bj2960175. [DOI] [PMC free article] [PubMed] [Google Scholar]
- Felts PA, Woolston AM, Fernando HB, Asquith S, Gregson NA, Mizzi OJ, Smith KJ. Inflammation and primary demyelination induced by the intraspinal injection of lipopolysaccharide. Brain. 2005;128:1649–1666. doi: 10.1093/brain/awh516. [DOI] [PMC free article] [PubMed] [Google Scholar]
- Figueiredo RT, Fernandez PL, Mourao-Sa DS, Porto BN, Dutra FF, Alves LS, Oliveira MF, Oliveira PL, Graca-Souza AV, Bozza MT. Characterization of heme as activator of Toll-like receptor 4. J Biol Chem. 2007;282:20221–20229. doi: 10.1074/jbc.M610737200. [DOI] [PubMed] [Google Scholar]
- Filipovic R, Zecevic N. Lipopolysaccharide affects Golli expression and promotes proliferation of oligodendrocyte progenitors. Glia. 2005;49:457–466. doi: 10.1002/glia.20125. [DOI] [PubMed] [Google Scholar]
- Fillebeen C, Dehouck B, Benaissa M, Dhennin-Duthille I, Cecchelli R, Pierce A. Tumor necrosis factor-alpha increases lactoferrin transcytosis through the blood-brain barrier. J Neurochem. 1999;73:2491–2500. doi: 10.1046/j.1471-4159.1999.0732491.x. [DOI] [PubMed] [Google Scholar]
- Finch CA, Huebers H. Perspectives in iron metabolism. N Engl J Med. 1982;306:1520–1528. doi: 10.1056/NEJM198206243062504. [DOI] [PubMed] [Google Scholar]
- Ge Y, Jensen JH, Lu H, Helpern JA, Miles L, Inglese M, Babb JS, Herbert J, Grossman RI. Quantitative assessment of iron accumulation in the deep gray matter of multiple sclerosis by magnetic field correlation imaging. AJNR Am J Neuroradiol. 2007;28:1639–1644. doi: 10.3174/ajnr.A0646. [DOI] [PMC free article] [PubMed] [Google Scholar]
- Glezer I, Chernomoretz A, David S, Plante MM, Rivest S. Genes involved in the balance between neuronal survival and death during inflammation. PLoS ONE. 2007;2:e310. doi: 10.1371/journal.pone.0000310. [DOI] [PMC free article] [PubMed] [Google Scholar]
- Glezer I, Lapointe A, Rivest S. Innate immunity triggers oligodendrocyte progenitor reactivity and confines damages to brain injuries. FASEB J. 2006;20:750–752. doi: 10.1096/fj.05-5234fje. [DOI] [PubMed] [Google Scholar]
- Goos M, Lange P, Hanisch UK, Prinz M, Scheffel J, Bergmann R, Ebert S, Nau R. Fibronectin is elevated in the cerebrospinal fluid of patients suffering from bacterial meningitis and enhances inflammation caused by bacterial products in primary mouse microglial cell cultures. J Neurochem. 2007;102:2049–2060. doi: 10.1111/j.1471-4159.2007.04683.x. [DOI] [PubMed] [Google Scholar]
- Hibbs JB, Jr, Taintor RR, Vavrin Z. Iron depletion: possible cause of tumor cell cytotoxicity induced by activated macrophages. Biochem Biophys Res Commun. 1984;123:716–723. doi: 10.1016/0006-291x(84)90288-2. [DOI] [PubMed] [Google Scholar]
- Howard CV, Reed MG. Unbiased Stereology: Three-Dimensional Measurement in Microscopy. New York: Springer-Verlag; 1998. [Google Scholar]
- Huebers HA, Finch CA. The physiology of transferrin and transferrin receptors. Physiol Rev. 1987;67:520–582. doi: 10.1152/physrev.1987.67.2.520. [DOI] [PubMed] [Google Scholar]
- Hulet SW, Heyliger SO, Powers S, Connor JR. Oligodendrocyte progenitor cells internalize ferritin via clathrin-dependent receptor mediated endocytosis. J Neurosci Res. 2000;61:52–60. doi: 10.1002/1097-4547(20000701)61:1<52::AID-JNR6>3.0.CO;2-T. [DOI] [PubMed] [Google Scholar]
- Kigerl KA, McGaughy VM, Popovich PG. Comparative analysis of lesion development and intraspinal inflammation in four strains of mice following spinal contusion injury. J Comp Neurol. 2006;494:578–594. doi: 10.1002/cne.20827. [DOI] [PMC free article] [PubMed] [Google Scholar]
- Kuhlow CJ, Krady JK, Basu A, Levison SW. Astrocytic ceruloplasmin expression, which is induced by IL-1beta and by traumatic brain injury, increases in the absence of the IL-1 type 1 receptor. Glia. 2003;44:76–84. doi: 10.1002/glia.10273. [DOI] [PubMed] [Google Scholar]
- Lehnardt S, Lachance C, Patrizi S, Lefebvre S, Follett PL, Jensen FE, Rosenberg PA, Volpe JJ, Vartanian T. The toll-like receptor TLR4 is necessary for lipopolysaccharide-induced oligodendrocyte injury in the CNS. J Neurosci. 2002;22:2478–2486. doi: 10.1523/JNEUROSCI.22-07-02478.2002. [DOI] [PMC free article] [PubMed] [Google Scholar]
- Levine SM. Iron deposits in multiple sclerosis and Alzheimer’s disease brains. Brain Res. 1997;760:298–303. doi: 10.1016/s0006-8993(97)00470-8. [DOI] [PubMed] [Google Scholar]
- Liu D, Liu J, Sun D, Alcock NW, Wen J. Spinal cord injury increases iron levels: catalytic production of hydroxyl radicals. Free Radic Biol Med. 2003;34:64–71. doi: 10.1016/s0891-5849(02)01184-x. [DOI] [PubMed] [Google Scholar]
- Ludwiczek S, Aigner E, Theurl I, Weiss G. Cytokine-mediated regulation of iron transport in human monocytic cells. Blood. 2003;101:4148–4154. doi: 10.1182/blood-2002-08-2459. [DOI] [PubMed] [Google Scholar]
- Mao Y, Schwarzbauer JE. Fibronectin fibrillogenesis, a cell-mediated matrix assembly process. Matrix Biol. 2005;24:389–399. doi: 10.1016/j.matbio.2005.06.008. [DOI] [PubMed] [Google Scholar]
- Masuda T, Hida H, Kanda Y, Aihara N, Ohta K, Yamada K, Nishino H. Oral administration of metal chelator ameliorates motor dysfunction after a small hemorrhage near the internal capsule in rat. J Neurosci Res. 2007;85:213–222. doi: 10.1002/jnr.21089. [DOI] [PubMed] [Google Scholar]
- McTigue DM, Tripathi RB. The Life, Death and Replacement of Oligodendrocytes in the Adult Central Nervous System. J Neurochem. 2008 doi: 10.1111/j.1471-4159.2008.05570.x. [DOI] [PubMed] [Google Scholar]
- Mehindate K, Sahlas DJ, Frankel D, Mawal Y, Liberman A, Corcos J, Dion S, Schipper HM. Proinflammatory cytokines promote glial heme oxygenase-1 expression and mitochondrial iron deposition: implications for multiple sclerosis. J Neurochem. 2001;77:1386–1395. doi: 10.1046/j.1471-4159.2001.00354.x. [DOI] [PubMed] [Google Scholar]
- Moura E, Noordermeer MA, Verhoeven N, Verheul AF, Marx JJ. Iron release from human monocytes after erythrophagocytosis in vitro: an investigation in normal subjects and hereditary hemochromatosis patients. Blood. 1998;92:2511–2519. [PubMed] [Google Scholar]
- Neufeld EJ. Oral chelators deferasirox and deferiprone for transfusional iron overload in thalassemia major: new data, new questions. Blood. 2006;107:3436–3441. doi: 10.1182/blood-2006-02-002394. [DOI] [PMC free article] [PubMed] [Google Scholar]
- Okamura Y, Watari M, Jerud ES, Young DW, Ishizaka ST, Rose J, Chow JC, Strauss JF. The extra domain A of fibronectin activates toll-like receptor 4. Journal of Biological Chemistry. 2001;276:10229–10233. doi: 10.1074/jbc.M100099200. [DOI] [PubMed] [Google Scholar]
- Ortiz E, Pasquini JM, Thompson K, Felt B, Butkus G, Beard J, Connor JR. Effect of manipulation of iron storage, transport, or availability on myelin composition and brain iron content in three different animal models. J Neurosci Res. 2004;77:681–689. doi: 10.1002/jnr.20207. [DOI] [PubMed] [Google Scholar]
- Pasinetti GM, Nichols NR, Tocco G, Morgan T, Laping N, Finch CE. Transforming growth factor beta 1 and fibronectin messenger RNA in rat brain: responses to injury and cell-type localization. Neuroscience. 1993;54:893–907. doi: 10.1016/0306-4522(93)90583-2. [DOI] [PubMed] [Google Scholar]
- Peyssonnaux C, Zinkernagel AS, Datta V, Lauth X, Johnson RS, Nizet V. TLR4-dependent hepcidin expression by myeloid cells in response to bacterial pathogens. Blood. 2006;107:3727–3732. doi: 10.1182/blood-2005-06-2259. [DOI] [PMC free article] [PubMed] [Google Scholar]
- Pinero DJ, Hu J, Cook BM, Scaduto RC, Jr, Connor JR. Interleukin-1beta increases binding of the iron regulatory protein and the synthesis of ferritin by increasing the labile iron pool. Biochim Biophys Acta. 2000;1497:279–288. doi: 10.1016/s0167-4889(00)00066-5. [DOI] [PubMed] [Google Scholar]
- Popovich PG, Guan Z, McGaughy V, Fisher L, Hickey WF, Basso DM. The neuropathological and behavioral consequences of intraspinal microglial/macrophage activation. J Neuropathol Exp Neurol. 2002;61:623–633. doi: 10.1093/jnen/61.7.623. [DOI] [PubMed] [Google Scholar]
- Quintana C, Bellefqih S, Laval JY, Guerquin-Kern JL, Wu TD, Avila J, Ferrer I, Arranz R, Patino C. Study of the localization of iron, ferritin, and hemosiderin in Alzheimer’s disease hippocampus by analytical microscopy at the subcellular level. J Struct Biol. 2006;153:42–54. doi: 10.1016/j.jsb.2005.11.001. [DOI] [PubMed] [Google Scholar]
- Rathore KI, Kerr BJ, Redensek A, Lopez-Vales R, Jeong SY, Ponka P, David S. Ceruloplasmin protects injured spinal cord from iron-mediated oxidative damage. J Neurosci. 28:12736–12747. doi: 10.1523/JNEUROSCI.3649-08.2008. [DOI] [PMC free article] [PubMed] [Google Scholar]
- Rogers JT. Ferritin translation by interleukin-1and interleukin-6: the role of sequences upstream of the start codons of the heavy and light subunit genes. Blood. 1996;87:2525–2537. [PubMed] [Google Scholar]
- Rouault TA, Cooperman S. Brain iron metabolism. Semin Pediatr Neurol. 2006;13:142–148. doi: 10.1016/j.spen.2006.08.002. [DOI] [PubMed] [Google Scholar]
- Schonberg DL, Popovich PG, McTigue DM. Oligodendrocyte generation is differentially influenced by toll-like receptor (TLR) 2 and TLR4-mediated intraspinal macrophage activation. J Neuropathol Exp Neurol. 2007;66:1124–1135. doi: 10.1097/nen.0b013e31815c2530. [DOI] [PubMed] [Google Scholar]
- Schultke E, Kendall E, Kamencic H, Ghong Z, Griebel RW, Juurlink BH. Quercetin promotes functional recovery following acute spinal cord injury. J Neurotrauma. 2003;20:583–591. doi: 10.1089/089771503767168500. [DOI] [PubMed] [Google Scholar]
- Simmons DA, Casale M, Alcon B, Pham N, Narayan N, Lynch G. Ferritin accumulation in dystrophic microglia is an early event in the development of Huntington’s disease. Glia. 2007;55:1074–1084. doi: 10.1002/glia.20526. [DOI] [PubMed] [Google Scholar]
- Smith MA, Harris PL, Sayre LM, Perry G. Iron accumulation in Alzheimer disease is a source of redox-generated free radicals. Proc Natl Acad Sci U S A. 1997;94:9866–9868. doi: 10.1073/pnas.94.18.9866. [DOI] [PMC free article] [PubMed] [Google Scholar]
- Taylor KR, Trowbridge JM, Rudisill JA, Termeer CC, Simon JC, Gallo RL. Hyaluronan fragments stimulate endothelial recognition of injury through TLR4. Journal of Biological Chemistry. 2004;279:17079–17084. doi: 10.1074/jbc.M310859200. [DOI] [PubMed] [Google Scholar]
- Torti FM, Torti SV. Regulation of ferritin genes and protein. Blood. 2002;99:3505–3516. doi: 10.1182/blood.v99.10.3505. [DOI] [PubMed] [Google Scholar]
- Torti SV, Kwak EL, Miller SC, Miller LL, Ringold GM, Myambo KB, Young AP, Torti FM. The molecular cloning and characterization of murine ferritin heavy chain, a tumor necrosis factor-inducible gene. J Biol Chem. 1988;263:12638–12644. [PubMed] [Google Scholar]
- Weiss G. Iron and immunity: a double-edged sword. Eur J Clin Invest. 2002;32(Suppl 1):70–78. doi: 10.1046/j.1365-2362.2002.0320s1070.x. [DOI] [PubMed] [Google Scholar]
- Weiss G, Bogdan C, Hentze MW. Pathways for the regulation of macrophage iron metabolism by the anti-inflammatory cytokines IL-4 and IL-13. J Immunol. 1997;158:420–425. [PubMed] [Google Scholar]
- Wu J, Hua Y, Keep RF, Nakamura T, Hoff JT, Xi G. Iron and iron-handling proteins in the brain after intracerebral hemorrhage. Stroke. 2003;34:2964–2969. doi: 10.1161/01.STR.0000103140.52838.45. [DOI] [PubMed] [Google Scholar]
- Zhang J, Stanton DM, Nguyen XV, Liu M, Zhang Z, Gash D, Bing G. Intrapallidal lipopolysaccharide injection increases iron and ferritin levels in glia of the rat substantia nigra and induces locomotor deficits. Neuroscience. 2005;135:829–838. doi: 10.1016/j.neuroscience.2005.06.049. [DOI] [PubMed] [Google Scholar]
- Zhang X, Surguladze N, Slagle-Webb B, Cozzi A, Connor JR. Cellular iron status influences the functional relationship between microglia and oligodendrocytes. Glia. 2006;54:795–804. doi: 10.1002/glia.20416. [DOI] [PubMed] [Google Scholar]
Associated Data
This section collects any data citations, data availability statements, or supplementary materials included in this article.
Supplementary Materials
01. Supplemental Figure.
Low power (2.5x) magnification of spinal cord cross-sections from LPS + vehicle (A) and LPS + Exjade (B) injection sites. Sections were labeled with OX42 antibody, a marker of microglia/macrophages. Inserts consist of adjacent sections displaying axons and myelin; labeled with anti-neurofilament antibody (NF; brown) and Eriochrome Cyanine (EC; blue) respectively, as described previously (Schonberg et al., 2007). Using Cavalieri’s method to calculate lesion volumes, no differences were observed between LPS + vehicle and LPS + Exjade groups based upon OX42 labeling (C). Data represent mean ± SEM. Scale bar = 500 μm (A, B).