Pscan: finding over-represented transcription factor binding site motifs in sequences from co-regulated or co-expressed genes (original) (raw)
Abstract
The first step in gene expression, transcription, is modulated by the interaction of transcription factors with their corresponding binding sites on the DNA sequence. Pscan is a software tool that scans a set of sequences (e.g. promoters) from co-regulated or co-expressed genes with motifs describing the binding specificity of known transcription factors and assesses which motifs are significantly over- or under-represented, providing thus hints on which transcription factors could be common regulators of the genes studied, together with the location of their candidate binding sites in the sequences. Pscan does not resort to comparisons with orthologous sequences and experimental results show that it compares favorably to other tools for the same task in terms of false positive predictions and computation time. The website is free and open to all users and there is no login requirement. Address: http://www.beaconlab.it/pscan.
INTRODUCTION
The first step in gene expression, transcription, is mediated and regulated by transcription factors (TFs), that bind DNA in a sequence specific manner on transcription factor binding sites (TFBSs), usually located near the transcription start site (TSS) of genes (i.e. in the promoter region), but also in distal elements like enhancers or silencers. Several studies aimed at the characterization of the DNA binding specificity of TFs have been performed, from earlier studies able to identify single binding sites to large scale genome-wide experiments like chromatin immunoprecipitation coupled with genome tiling microarrays or next-generation sequencing. Once a set of sites experimentally known to be recognized by a given TF has been collected, they can be used to build a motif, describing and generalizing the binding specificity of the TF. Since the sites have usually the same size, a common approach is to align them and to build a profile [or _position specific weight matrix_ (1)], representing the frequency with which each nucleotide appears at each position of the alignment. Several profiles are nowadays available in dedicated databases like TRANSFAC (2) or JASPAR (3) and can be employed to scan genomic sequences to find novel candidate sites for the TF (1).
A typical computational issue is deciding, given a profile, if and when a nucleotide sequence can be considered a valid instance of the TFBSs modeled by the profile itself. Redundancy yields information, and while reliable predictions on a single sequence are nearly impossible without further considerations, analyses on sets of sequences (e.g. promoters) coming from co-regulated or co-expressed sequences are more likely to produce meaningful results. The rationale is that most of the genes should be the target of the same TF(s) and their promoters should contain a number of binding sites for them significantly higher than some suitably computed expected number that would be obtained from a collection of unrelated genes or some random background model. This is the general strategy implemented in web-based tools like OTFBS (4) and ASAP (5).
Given a set of motif profiles, and a typical input consisting of a set of sequences (e.g. promoters) from genes co-regulated or co-expressed, a ‘likelihood’ score can be computed (1), expressing how well each oligo of the input sequences fits the descriptors and thus predict TFBSs locations. The main issue at this point is setting suitable likelihood thresholds for ‘yes or no’ decisions. Setting high-thresholds increases specificity at the price of low sensitivity, and vice versa, setting low-thresholds yields too many false positives (4–7). Other than setting matrix-specific thresholds, another possible way to circumvent this problem is presented in a very recent tool called PASTAA (8), in which rather than on a selected gene set (e.g. genes belonging to an expression cluster or functional category) the algorithm can work on large set of genes and even whole genomes (e.g. all genes available on a given microarray) where genes are ranked both according to how well their promoter fits a matrix and to a likelihood value expressing how well genes fit into a given category. If this latter piece of information is available, coherence between the two ranked datasets is computed as an indicator of association between a TF and the category.
In our approach, similarly to the CLOVER algorithm described in (7), instead of computing a count of predicted sites we rather compute for each input sequence a raw matching value, representing the likelihood for the TF to bind the promoter. The main difference of our method is that, instead of computing an overall average value on all the oligos of the input sequences as in CLOVER, we keep as matching value the one corresponding to the highest-scoring oligo in each sequence and compute the mean of the matching value on the input sequence set [see Supplementary Data and ref. (9) for further details]. Another issue is the definition of a ‘background random model’ suitable for assessing the significance of the results obtained. In CLOVER, this is performed by shuffling the columns of the motif or by building random sequence sets of the same size and length of the sequence set investigated, and a _P_-value is assigned to the results by computing, for each available profile, how many times the random dataset yields a matching score higher than the input sequence set. In our work, instead, we treat the input sequences as a sample taken from a ‘universe’. Since now we have at our disposal whole genome sequences and gene annotations, this is the set of all promoter sequences available for the species investigated. Thus, for each profile, the average matching score obtained from the input sequence set can be compared to the mean and the standard deviation of the score on the whole genome promoter set. The over- (or under-) representation for each profile is finally assessed with a _z_-test, that associates with each profile the probability of obtaining the same score on a random sequence set. In our experiments we evaluated the performance of other statistical methods, different from the _z_-test, for assessing the significance of the results. Rank-based tests gave less stable results and higher false positive rates (see further on), depending more strongly on input set size or matrix information content. Comparing the results of the input sets with randomly sampled sets of the same size gave overall similar results, but, since randomizations have to be performed thousands or millions of times to attain reliable _P_-values, this method increased significantly the computation time.
As shown by results we obtained on benchmark sequence sets [see Supplementary Data and ref. (9)], considering only the best match on each promoter can be a reasonable approximation, that guarantees a clear separation between significantly enriched promoter sets and the background, while this cannot be attained using average computed on whole sequences, especially in cases when good sites can be found only in a subset of the input. In CLOVER this drawback is overcome by ‘guessing’ the number of sequences of the input containing good sites (i.e. enumerating the possible subsets), with a significant increase in computational complexity and execution time.
Several other methods currently available [see among others oPOSSUM (10), PAP (11), TFM_EXPLORER (12) and CORE_TF (6)], regardless of the statistical methods employed, include in the analyses orthologous sequences for filtering and reducing false positive predictions. Although the implementation of this feature in our algorithm is straightforward, we nevertheless chose not to make it a necessary step in the analysis, but rather an additional option that can be selected. As a matter of fact, as pointed out by several studies we cannot expect a perfect one-to-one conservation in orthologous sequences for TFBSs; and while this strategy is successful in cases like muscle-specific gene expression (13), in others we have TFs for which only a limited number of TFBSs is conserved (e.g. between human and mouse), and also when two orthologous genes are targeted by the same TFs they do not show conserved TFBSs that can be singled out by inspecting genomic alignments (14).
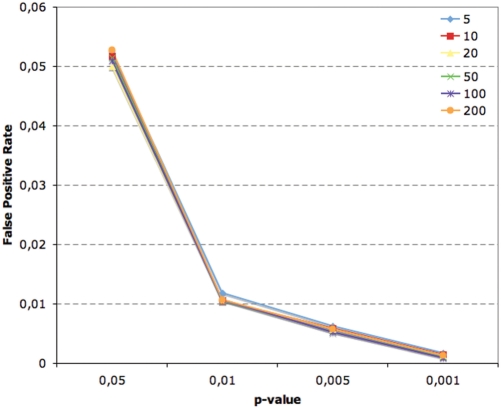
The usual drawback of methods like Pscan (with or without orthologous sequences) lies in the high number of predictions that can be considered as ‘false positive’, at least when compared with estimates one could derive by using directly the _P_-values associated with the results [see, e.g. ref. (10,12)]. We thoroughly assessed this point for Pscan, by building random promoter sets changing the size of the set (from 5 to 200 genes) and sequence length. Clearly, any significant motif reported with _P_-value lower than a given threshold in a random set should be regarded as a false positive. Once defined how many promoters we want in the set and their length, by building n sets of sequences in this way we should observe about np times that the profile has yielded _P_-value lower than a given threshold p. Figure 1 shows the average false positive rate (in this case the ratio between false positives and the overall number of tests performed) observed for vertebrate JASPAR profiles on sets of human promoters of length 500. For each motif and each set size we performed 1000 random runs. It can be clearly seen how in our case the observed false positive rate virtually matches the estimate for different _P_-value thresholds, regardless of the number of input sequences, with also no significant difference for different profiles (data not shown). Remarkably this observation is true also for small sequence sets, from 5 to 20 genes, sample sizes for which employing the _z_-test is not always advised by literature. Changing the length of the promoters did not produce significantly different results.
Figure 1.
Experimental false positive rate for JASPAR vertebrate matrices at different _P_-value thresholds on random collections of human promoters (from −450 to +50 with respect to the TSS) of different size (from 5 to 200 sequences).
As a comparison, a similar test performed in (12) for the TFM_Explorer algorithm—although on longer sequences filtered by phylogenetic footprinting—led authors to suggest using _P_-value thresholds between 10−8 and 10−6 to maintain a false positive rate of 0.1. For the oPOSSUM algorithm, in which two different measures of significance are used, a _P_-value of 0.01 has a false positive rate around 0.2–0.3 (changing according to input set size), that is reduced to about 0.1–0.15 when coupled with further filtering based on a _z_-score (10). Thus, the _P_-value associated with the results by Pscan provides a more intuitive way of interpreting the results and of assessing the actual significance of the enrichment of the motifs, keeping the false positive rate easily under control. It should be kept in mind, however, that typically collections of dozens or hundreds of profiles are employed in analyses of this kind. If we assume without loss of generality that for each motif profile an independent test is performed, then we need to keep the familywise error rate below a given threshold. In other words, if we try 100 profiles on a given sequence set by using a significant _P_-value threshold of 0.01, then we can expect one profile to have a _P_-value lower than 0.01 purely due to chance. The simplest solution to account for this problem is to use a Bonferroni corrected threshold of p/m to maintain the same significance threshold of p, where m is the number of profiles used. More involved methods can be anyway used, like the Holm–Bonferroni or Benjamini–Hockberg procedures.
THE USER INTERFACE
User input
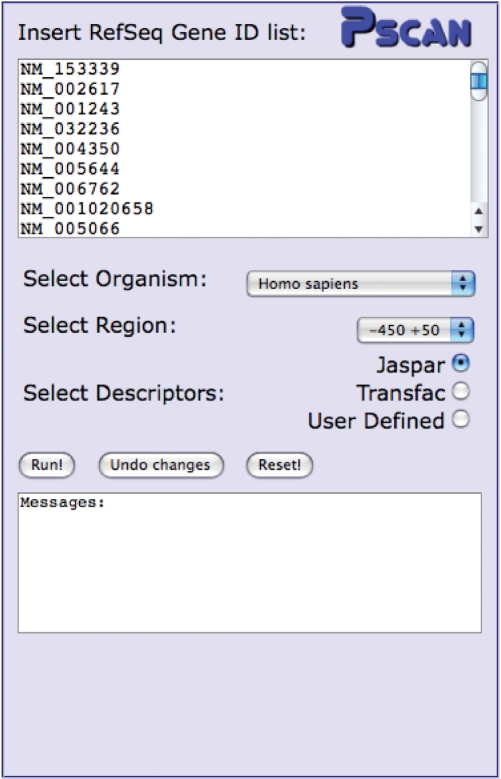
In the current implementation Pscan performs analyses with human, mouse, Drosophila, Arabidopsis and yeast sequences and motifs. The input interface is shown in Figure 2. Users have to input a set of gene identifiers together with the organism of provenience. For human, mouse and Drosophila the interface accepts RefSeq mRNA IDs (e.g. NM_000546), for Arabidopsis TAIR IDs (e.g. AT1G08810) and for yeast SGD IDs (e.g. YPL248C). Other ID types (Affy IDs, Entrez or ENSEMBL gene IDs and so on) can anyway be quickly converted in the format accepted by Pscan with tools like DAVID (15). The ‘human and mouse’ species option allows for the analysis of a sequence set derived from both organisms. This option can be selected, for example, if one wants to perform an analysis on a set of human and mouse orthologous genes (see Supplementary Data and the online help page). Then, users have to specify the promoter region their want to investigate, with respect to the TSSs of the genes, for example from −450 to +50 or −950 to +50 or −200 to +50. We advise users to select regions encompassing also a sequence downstream of the TSS, since functional TFBSs are often found also here.
Figure 2.
The part of the interface devoted to user input. Users have to input a list of gene IDs in the text box and choose source organism, promoter region with respect to the TSS of the genes, and profile set to be employed in the analysis.
Given gene IDs and the promoter region selected, the corresponding sequences are automatically retrieved by the server. Finally, users have two choices: employing for the analysis the profiles already available in a given database (the interface now includes the matrices available at JASPAR, the familial binding profile collection of JASPAR and the public release of TRANSFAC), or uploading a file containing their own matrices. In the latter case, an upload dialog box appears (see the online help for the format in which matrices have to be uploaded). For example, if users have at their disposal the matrices available in the subscription-only version of TRANSFAC, they can upload them and use for their analyses, since they will not be made public or shared with other users. Another possible application is to use Pscan to assess the significance of a motif output by a de novo motif discovery algorithm for which ‘false positive’ results are very often an issue [(16); see also Supplementary Data]. Clicking the ‘Run!’ button, starts the computation and possible error/warning messages are displayed in the text box directly below the button.
Output
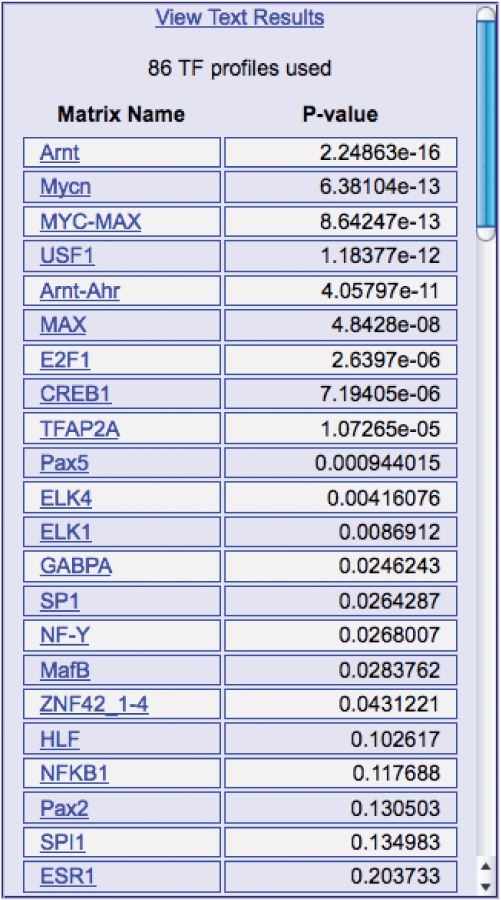
The result of the computation will appear in the middle column of the page, together with a small image (the ‘heatmap’) on the top right corner. The output shows the ranking of the profiles selected according to their _z_-test _P_-value (see Supplementary Data). An example is shown in Figure 3. At the top of the column there is also a link for downloading the results in text format as well as the number of matrices used to analyze the sequences, suitable for computing corrected _P_-value thresholds for assessing the significance of the results.
Figure 3.
An example of the main output of Pscan, given as input a set of promoters of known MYC target genes in human (17), showing motif profiles ranked according to their _z_-test _P_-value. Notice how also, other than motif profiles of MYC or MYC-like sites, other TFs show significant enrichment in the dataset, likely to co-operate with MYC in the regulation of a subset of the input genes (e.g. the cell-cycle regulators).
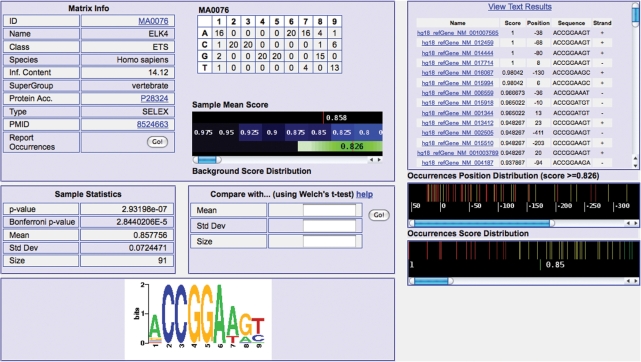
By clicking on a profile name, users can open a dedicated page showing further details (Figure 4), and in particular the matrix itself (with its ‘sequence logo’ at the bottom), its information content and links to its database entry as well as to the ID (PMID) of the PubMed entry describing its generation (in case of user-submitted matrices these two latter pieces of information are missing). A simple graphic representation shows the average matching value of the matrix on the sequences analyzed compared to the average matching value and standard deviation on the whole promoter set (same set of regions with respect to the TSS as selected) of the same organism. Under these fields the interface reports _P_-value, Bonferroni corrected _P_-value (the _z_-test _P_-value multiplied by the number of profiles employed in the analysis), with mean and standard deviation for the matching value of the matrix in the current input set. Next to this, an input mask allowing users to compare the results just obtained with the results that came for the same matrix on a different sequence set (see Supplementary Data and the online help pages).
Figure 4.
Example of the detailed information displayed by Pscan concerning JASPAR motif ELK4, with (left) matrix, logo (bottom left), cross-references, average score in the input set compared to the background mean and standard deviation (green area). Under these pieces of information, the interface shows the statistics for the matrix on the input set, together with an input form for the comparison of the results on different input sets. On the right, there is the list of best occurrences in each input promoter, with gene name, oligo score, position with respect to the TSS of the gene, oligo sequence and strand. Notice how the best occurrences (with score higher than the background average) are mostly located in the core promoter area (−100, +50).
Furthermore, by clicking on the ‘Report Occurrences’ button at the bottom of the ‘Matrix Info’ table users can retrieve, for each gene submitted, the best matching oligo in the respective promoter, as well as its score (from 0 to 1, see Supplementary Data) and its position relative to the annotated TSS. Occurrences are sorted according to their score, so to have an immediate idea of which genes are more likely to be actual targets of the TF corresponding to the profile. The ‘Text Results’ button allows for the download of this occurrence table in text format. On the bottom right hand of the page two diagrams appear, showing the distribution of the location of the best occurrences in the promoter (with score higher than the genome-wide mean, above) and the scores of the best occurrences (below). Predictions are also colored according to their matching score (red-high).
The ‘heatmap’ image shows intuitively in a microarray-like fashion the contribution of each input gene to the _z_-score of each matrix. Red spots (with proportional color intensity) correspond to positive contributions (e.g. scores higher than the genome-wide mean), vice versa green spots (black spots are around the average genome-wise score of the matrix itself).
To restore the interface to the initial settings, users can click the ‘Reset’ button located below the input text box.
CONCLUSIONS
Pscan is a software tool that scans promoter sequences from co-regulated or co-expressed genes, looking for over- or under-represented motifs describing the binding specificity of known TFs, thus providing quick hints on which factors could be responsible for the patterns of expression observed, or vice versa seem to be avoided (with _P_-values nearing 1). The user interface is simple and immediate, and results can be obtained in a few seconds or minutes (in case users submit their own motifs, the computation takes longer since background genome-wide scores have to be computed as well). More involved analyses are nevertheless possible, from intergenic regions or 3′UTR sequences, and so on, for which users are welcome to download the standalone version that permits to build customized background models as well as the input of FASTA sequences. The interface will be updated anytime new descriptors and matrices are made available, and also by including novel species and updated gene and promoter annotations.
SUPPLEMENTARY DATA
Supplementary Data are available at NAR Online.
FUNDING
Italian Ministry of Education and Scienfic Research (MIUR) within the FIRB project ‘Laboratorio Internazionale di Bioinformatica’ (LIBI). Funding for open access charge: Italian Ministry of Education and Scienfic Research (MIUR) within the FIRB project ‘Laboratorio Internazionale di Bioinformatica’ (LIBI).
Conflict of interest statement. None declared.
Supplementary Material
[Supplementary Data]
REFERENCES
- 1.Stormo GD. DNA binding sites: representation and discovery. Bioinformatics. 2000;16:16–23. doi: 10.1093/bioinformatics/16.1.16. [DOI] [PubMed] [Google Scholar]
- 2.Matys V, Kel-Margoulis OV, Fricke E, Liebich I, Land S, Barre-Dirrie A, Reuter I, Chekmenev D, Krull M, Hornischer K, et al. TRANSFAC and its module TRANSCompel: transcriptional gene regulation in eukaryotes. Nucleic Acids Res. 2006;34:D108–D110. doi: 10.1093/nar/gkj143. [DOI] [PMC free article] [PubMed] [Google Scholar]
- 3.Bryne JC, Valen E, Tang MH, Marstrand T, Winther O, da Piedade I, Krogh A, Lenhard B, Sandelin A. JASPAR, the open access database of transcription factor-binding profiles: new content and tools in the 2008 update. Nucleic Acids Res. 2008;36:D102–D106. doi: 10.1093/nar/gkm955. [DOI] [PMC free article] [PubMed] [Google Scholar]
- 4.Zheng J, Wu J, Sun Z. An approach to identify over-represented cis-elements in related sequences. Nucleic Acids Res. 2003;31:1995–2005. doi: 10.1093/nar/gkg287. [DOI] [PMC free article] [PubMed] [Google Scholar]
- 5.Marstrand TT, Frellsen J, Moltke I, Thiim M, Valen E, Retelska D, Krogh A. Asap: a framework for over-representation statistics for transcription factor binding sites. PLoS ONE. 2008;3:e1623. doi: 10.1371/journal.pone.0001623. [DOI] [PMC free article] [PubMed] [Google Scholar]
- 6.Hestand MS, van Galen M, Villerius MP, van Ommen GJ, den Dunnen JT, t Hoen PA. CORE_TF: a user-friendly interface to identify evolutionary conserved transcription factor binding sites in sets of co-regulated genes. BMC Bioinformatics. 2008;9:495. doi: 10.1186/1471-2105-9-495. [DOI] [PMC free article] [PubMed] [Google Scholar]
- 7.Frith MC, Fu Y, Yu L, Chen JF, Hansen U, Weng Z. Detection of functional DNA motifs via statistical over-representation. Nucleic Acids Res. 2004;32:1372–1381. doi: 10.1093/nar/gkh299. [DOI] [PMC free article] [PubMed] [Google Scholar]
- 8.Roider HG, Manke T, O'Keeffe S, Vingron M, Haas SA. PASTAA: identifying transcription factors associated with sets of co-regulated genes. Bioinformatics. 2009;25:435–442. doi: 10.1093/bioinformatics/btn627. [DOI] [PMC free article] [PubMed] [Google Scholar]
- 9.Pavesi G, Zambelli F. Prediction of over represented transcription factor binding sites in co-regulated genes using whole genome matching statistics. Lecture Notes Comput. Sci. 2007;4578:651–658. [Google Scholar]
- 10.Ho Sui SJ, Mortimer JR, Arenillas DJ, Brumm J, Walsh CJ, Kennedy BP, Wasserman WW. oPOSSUM: identification of over-represented transcription factor binding sites in co-expressed genes. Nucleic Acids Res. 2005;33:3154–3164. doi: 10.1093/nar/gki624. [DOI] [PMC free article] [PubMed] [Google Scholar]
- 11.Chang LW, Nagarajan R, Magee JA, Milbrandt J, Stormo GD. A systematic model to predict transcriptional regulatory mechanisms based on overrepresentation of transcription factor binding profiles. Genome Res. 2006;16:405–413. doi: 10.1101/gr.4303406. [DOI] [PMC free article] [PubMed] [Google Scholar]
- 12.Defrance M, Touzet H. Predicting transcription factor binding sites using local over-representation and comparative genomics. BMC Bioinformatics. 2006;7:396. doi: 10.1186/1471-2105-7-396. [DOI] [PMC free article] [PubMed] [Google Scholar]
- 13.Wasserman WW, Palumbo M, Thompson W, Fickett JW, Lawrence CE. Human–mouse genome comparisons to locate regulatory sites. Nat. Genet. 2000;26:225–228. doi: 10.1038/79965. [DOI] [PubMed] [Google Scholar]
- 14.Odom DT, Dowell RD, Jacobsen ES, Gordon W, Danford TW, MacIsaac KD, Rolfe PA, Conboy CM, Gifford DK, Fraenkel E. Tissue-specific transcriptional regulation has diverged significantly between human and mouse. Nat. Genet. 2007;39:730–732. doi: 10.1038/ng2047. [DOI] [PMC free article] [PubMed] [Google Scholar]
- 15.Dennis G, Jr., Sherman BT, Hosack DA, Yang J, Gao W, Lane HC, Lempicki RA. DAVID: database for annotation, visualization, and integrated discovery. Genome Biol. 2003;4:P3. [PubMed] [Google Scholar]
- 16.Tompa M, Li N, Bailey TL, Church GM, De Moor B, Eskin E, Favorov AV, Frith MC, Fu Y, Kent WJ, et al. Assessing computational tools for the discovery of transcription factor binding sites. Nat. Biotechnol. 2005;23:137–144. doi: 10.1038/nbt1053. [DOI] [PubMed] [Google Scholar]
- 17.Zeller KI, Zhao X, Lee CW, Chiu KP, Yao F, Yustein JT, Ooi HS, Orlov YL, Shahab A, Yong HC, et al. Global mapping of c-Myc binding sites and target gene networks in human B cells. Proc. Natl Acad. Sci. USA. 2006;103:17834–17839. doi: 10.1073/pnas.0604129103. [DOI] [PMC free article] [PubMed] [Google Scholar]
Associated Data
This section collects any data citations, data availability statements, or supplementary materials included in this article.
Supplementary Materials
[Supplementary Data]


