Efficient frequency-based de novo short-read clustering for error trimming in next-generation sequencing (original) (raw)
Abstract
Novel massively parallel sequencing technologies provide highly detailed structures of transcriptomes and genomes by yielding deep coverage of short reads, but their utility is limited by inadequate sequencing quality and short-read lengths. Sequencing-error trimming in short reads is therefore a vital process that could improve the rate of successful reference mapping and polymorphism detection. Toward this aim, we herein report a frequency-based, de novo short-read clustering method that organizes erroneous short sequences originating in a single abundant sequence into a tree structure; in this structure, each “child” sequence is considered to be stochastically derived from its more abundant “parent” sequence with one mutation through sequencing errors. The root node is the most frequently observed sequence that represents all erroneous reads in the entire tree, allowing the alignment of the reliable representative read to the genome without the risk of mapping erroneous reads to false-positive positions. This method complements base calling and the error correction of making direct alignments with the reference genome, and is able to improve the overall accuracy of short-read alignment by consulting the inherent relationships among the entire set of reads. The algorithm runs efficiently with a linear time complexity. In addition, an error rate evaluation model can be derived from bacterial artificial chromosome sequencing data obtained in the same run as a control. In two clustering experiments using small RNA and 5′-end mRNA reads data sets, we confirmed a remarkable increase (∼5%) in the percentage of short reads aligned to the reference sequence.
Next-generation high-throughput DNA sequencers, including the ABI SOLiD and Illumina systems, produce large numbers of short reads at very low cost (Barski et al. 2007; Durfee et al. 2008). These massively parallel sequencing technologies can generate more than 1 billion base pairs (bp) in a run that takes less than 1 wk, thereby accelerating capillary sequencing performance by two orders of magnitude (Holt and Jones 2008).
However, the utility of next-generation sequencers is diminished by two major limitations. First, the reads are short; most reads alluded to in previous reports were 25–36 bp, which could hinder unique mapping to a reference sequence (Hillier et al. 2008). The second limitation is the low quality of base differentiation. Massively parallel sequencing technologies, such as the Illumina sequencer, suffer from inherent noise factors, such as phasing, fading, and fluorophore cross-talk, and these factors increase in later sequencing cycles (Erlich et al. 2008). Approximately one-half of raw short reads generated in one run cannot be perfectly mapped to the reference sequence (Hillier et al. 2008). Excluding a small population of reads with real variations, such as single-nucleotide polymorphisms (SNPs), insertion/deletion (indel) mutations, or RNA editing, approximately one-half of reads are assumed to have one or more sequencing errors. Not only does low base quality cause fatal errors in polymorphism detection, but sequencing errors can occasionally cause short reads to be mapped to false positions. Therefore, sequencing-error trimming is a very important step in the correct alignment of short reads to a reference genome.
Previously described computational methodologies for correcting sequencing errors in short reads suffer from several major drawbacks (Marth et al. 1999; Altshuler et al. 2000; Brockman et al. 2008). First, a common feature of these methods is that the reads must map uniquely to the reference sequence, which may result in failure to detect short erroneous reads aligned to unique, but false, positions. A better method of detecting sequencing errors before alignment would reduce this effect. Second, another common procedure is to set an ad hoc minimum frequency threshold to remove erroneous sequences derived from highly expressed sequences; however, this approach both ignores sequences of low abundance and allows erroneous sequences with high frequency. The frequency threshold used in error correction for de novo fragment assembly (e.g., ALLPATHS) is effective when the reads provide approximately even coverage of the reference sequence, but the method is unsuitable for transcriptome expression analysis because the distribution of reads is extremely uneven and follows a power law (Pevzner et al. 2001; Ueda et al. 2004; Butler et al. 2008). Third, quality value (QV) selections, such as the neighborhood quality standard windows used for capillary sequencing, do not match the next-generation sequencing strategy, which outputs bases at the same position in millions of reads simultaneously in one independent sequencing cycle. Thus, another model for sequencing error correction tailored to the characteristics of next-generation sequencing must be developed.
In this report, we address these issues and provide an effective solution. Before alignment to the reference genome, erroneous “child” sequences are clustered into a group represented by a “parent” sequence; the child sequence is considered to originate stochastically from its more abundant parent sequence through sequencing errors produced in the same experiment. Indeed, mapping experiments show that broad parent–child relationships are inherent among reads generated in the same experiment. Subsequently, we integrate the parent–child read relationships into trees, such that the sequences at the root nodes are the most frequent sequences in individual trees and are treated as the representatives of all erroneous sequences in the trees. As illustrated in Figure 1, erroneous short reads that might be aligned to incorrect positions or with failed mapping are clustered so that these representative sequences are mapped to the genome to anchor the locations of the erroneous descendant sequences. This approach effectively resolves the problem of low-quality short-read sequencing by avoiding the mapping of erroneous reads to false-positive positions in the reference genome, and it avoids using an ad hoc frequency threshold while outputting trees with reliable representative sequences regardless of abundance. Although this approach may suffer from the problem that short sequences originating in different parts of the genome are erroneously clustered into the same group, this fault can be detected and eliminated by aligning the representative sequence to multiple locations in the genome.
Figure 1.

Illustration of the major benefit of de novo clustering. A real cDNA is shown as a brown bar, and short reads originating in it are merged into nonredundant reads with unique sequences presented by gray bars. (A) The contrast densities of the gray bars are proportional to their frequencies. The reference genome is shown as a long arrow flagged with the corresponding locus of the cDNA by a brown bar. (B) Alignments of best hits are highlighted by blue dashed lines. Red dots emphasize base positions at which the reads disagree with the original cDNA sequence. The direct alignment includes correct alignments, as well as some short reads with multiple best hits, as illustrated by the leftmost read. Some reads fail in alignment because the sequencing errors are too numerous, as shown by the aslant bar, and some are aligned to false-positive positions. (C) These short reads are organized into the tree by the proposed de novo clustering before alignment with the genome. The root indicates the representative sequence of the cluster; this is the darkest, most abundant read denoted with an asterisk. In the tree, parent–child relationships are depicted by dashed lines.
Additionally, we propose an error model adjusted for next-generation sequencing by refining the traditional random model of error rate evaluation used in POLYBAYES (Marth et al. 1999) to involve substitution patterns arising from the fluorophore cross-talk noise factor. Our two experiments on small RNAs and 5′-end serial analysis of gene expression (SAGE) using Illumina (formerly Solexa) sequencing technology prove that our de novo clustering method markedly reduces sequencing errors. Finally, because massive numbers of reads must be clustered in a reasonable amount of time, we have attempted to minimize the computational time of the clustering process. We propose a frequency-based method for the detection of parent–child relationships accelerated by hash-based sequence searches that run in time linear to the number of given reads.
Results
Clustering of small RNAs
Small RNA guides markedly expand the capacity for spatiotemporal control of gene expression in multicellular organisms (Chapman et al. 2007). MicroRNAs (miRNAs), which are about 22 nucleotides (nt) in length and inhibit translation of target genes, constitute the major class of small RNA. We performed an experiment in which we observed approximately 5 million reads of small RNAs from the HT-29 human colon adenocarcinoma cell line using the Illumina small-RNA protocol (see details in Methods).
Because mature miRNAs have paralogs with highly similar sequences (Bartel 2004), we estimate that many observed miRNAs are, in fact, derived from errors in sequencing of more abundant miRNAs with small Hamming distances. For example, we observed one annotated read (hsa-miR-10a) 9281 times, as well as much less abundant sequences that had one mismatch to hsa-miR-10a, which was the most abundant miRNA (Table 1; see Supplemental material for short-read annotation procedures). Our statistical method, which considers the frequencies of individual sequences (see Methods), treats most of these low-abundance sequences as the result of sequencing errors. Interestingly, these erroneous sequences included hsa-miR-10b, a paralog of hsa-miR-10a. Whether hsa-miR-10b is actually expressed is highly doubtful, because the sequence occurred only five times. Few of the remaining nonannotated sequences can be real sequences, considering the low incidence of SNP variation in the human genome (∼1/300).
Table 1.
Observed sequences with one mismatch to hsa-miR-10a

The basic metrics of our initial processing results for Illumina sequencing of small RNAs are shown in Table 2. About 4.3 million reads out of 5 million QV-filtered reads were linker trimmed at their 3′ ends. Their given Illumina QVs and expected error rates are shown in Figure 2. The sequencing quality decreased drastically after the 20th base, causing an intense upswing in the estimated error rate. Eland alignment results of linker-trimmed reads, including unique and nonunique mappings with at most two mismatches to references, are shown in Table 3 (see Supplemental material). Of the total number of linker-trimmed reads, 88% were aligned. As expected, sequences exactly matching the reference were more abundant than nonaligned sequences. For example, sequences with unique, perfect alignments dominated 47% of redundant reads (reads observed more than once), but constituted only 6% of nonredundant sequences, suggesting that reads with sequencing errors are more likely to be of relatively low abundance.
Table 2.
Illumina data processing metrics for small RNA reads of HT-29 cells

Figure 2.

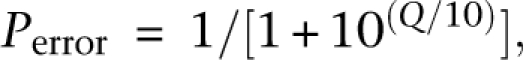
Distribution of base quality QVs given by Illumina of small RNA reads after trimming of 3′ linker sequences. (A) Average of given Illumina QVs at each base position. (B) Expected Illumina error rate P at each base. P is calculated from Q (the Illumina QV) at each position according to the formula: _P_error = 1/[1 + 10(Q/10)].
Table 3.
Eland alignment results of linker-trimmed small RNA reads of HT-29 cells

A total of 837,503 nonredundant small RNA sequences were clustered to 561,240 trees, of which 76,883 had more than one nonredundant sequence. The most abundant tree, represented by miRNA hsa-let-7f, occurred 385,285 times. The representative sequence itself, which was also the most abundant, occurred 309,820 times. This huge tree contained 3,175 sequences and had a depth of seven; an example of longest path is shown in Figure 3A. Only the root node for the representative sequence was annotated; the other sequences were not associated with any known annotation. The change in cumulative frequency before and after clustering is shown in Figure 3B. Collectively, the 400 most abundant sequences accounted for 50% of the total reads, whereas after clustering the top 87 clusters accounted for 50%. This indicates that highly expressed sequences generate large numbers of erroneous sequences that can be merged through de novo clustering.
Figure 3.

Frequency-based de novo clustering improves short-read alignment to unique positions. Sequences are assigned to their parents if they fail in the nonsequencing error test (P < 0.01). (A) An example of the longest path in the cluster with the largest number of reads in the small RNAs sample. (B) Pink and red points indicate the cumulative frequencies of small RNAs ranked according to their frequencies before and after clustering, respectively. Their ranks are shown in the _x_-axis. (C) Percentages of redundant (or nonredundant) reads (or clusters) of the small RNAs sample that are aligned to the reference genome allowing for at most two mismatches. (D) Percentages of redundant (or nonredundant) 5′-end SAGE reads (or clusters) under the same conditions described in C.
We then measured the effect of clustering by comparing the percentages of reads aligned to the reference genes and genome. We attempted to map only the representative sequence among all of the sequences in a cluster. If a unique location was identified as a perfect match, the remaining erroneous sequences in the cluster were subsequently added to the location and treated as perfect matches. As a result, the percentage of redundant reads perfectly matched to their reference rose from 49% to 66%, as illustrated in Figure 3C. The fraction of perfectly matched nonredundant sequences increased even more, from 8% to 25% corresponding to a relative raise of 200%. Many erroneous sequences were almost perfectly matched sequences, and the erroneous sequences were more correctly aligned to the reference by de novo clustering. However, the number of reads aligned with one or two mismatches decreased because many of these reads were merged into the “perfect match” clusters. Eventually, the percentage of nonaligned redundant reads decreased from 12% to 10%, and that of nonredundant reads decreased from 38% to 32%. Similar changes were observed among uniquely aligned reads (see Supplemental material). Additionally, 61 nonredundant reads with best hits associated with known mature miRNAs were localized to different positions before and after de novo clustering; these 61 reads were candidate false positives for expression before de novo clustering.
Clustering of 5′-end SAGE reads
Serial analysis of gene expression (SAGE) is an efficient method for identifying expression levels of coding and noncoding RNA transcripts. Because most transcripts are expressed at a very low level (Velculescu et al. 1999), massively parallel sequencing technologies can make a great contribution to the detection of low-abundance mRNAs. As an extension of the SAGE method, 5′-end SAGE can also identify transcription start sites by targeting the 5′ ends of transcripts (Hashimoto et al. 2004). We found extremely high, inherent sequence similarities among 5′-end SAGE reads. We compared all-against-all pairwise alignments of 5′-end SAGE reads with alignments between reads and their reference genome (Drosophila melanogaster [dmel]), which revealed that more extensive reads were aligned between the reads' own alignments. The percentage of nonaligned redundant reads decreased from 57% in the reference alignment to 21% in the all-against-all alignments (see Supplemental material). This result indicates the importance of broad parent–child relationships that are detected by our de novo clustering method.
A total of 3,513,538 nonredundant sequences were clustered into 2,766,228 trees. Of these trees, 112,386 contained multiple sequences; the remaining trees were singletons. Compared with the sample of small RNAs, the percentage of reads aligned to the genome was smaller for this sample due to different data preparation procedures (see Methods) and rates of sequencing error. Nevertheless, the de novo clustering method proved to be effective in increasing the aligned percentage. As shown in Figure 3D, the percentage of redundant reads with perfect matches rose from 12% to 17% with clustering. The percentage of nonredundant, perfect-match sequences more than doubled, from 4% to 9%. In total, the percentage of nonaligned redundant reads decreased from 57% to 53%, and the percentage of nonaligned, nonredundant sequences decreased from 77% to 72% (the relative decrease in nonredundant reads was 5%/23% = 22%; see Supplemental material). The cumulative frequency of the top 179,759 sequences or 11,721 clusters accounted for 50% of the total reads, revealing the remarkable effect of merging sequencing-error sequences with their parent sequences.
Discussion
Next-generation sequencing technologies revolutionize comprehensive genome studies by producing massive numbers of short nucleotide sequence reads. As an initial step toward addressing the vexing problem of low base quality, we have developed an efficient de novo short-read clustering method with linear time complexity for sequencing-error trimming. Our approach focuses on the broad parent–child relationships hidden in a set of short reads generated from identical experiments with the same starting points. We refined the error rate evaluation according to actual substitution patterns and QV adjustments. We achieved a remarkable increase (∼5%) in the percentage of reads aligned to the reference sequence and a particularly dramatic increase (a relative raise of ∼200%) in the percentage of reads perfectly matched to the reference sequence, which led to a reduction in false-positive alignments as well. Our frequency-based clustering method establishes a novel framework for correcting sequencing errors in short reads by consulting the inherent relationships among an entire set of reads. Because our clustering method does not use any reference genome data, it is expected to perform an essential function in de novo transcript identification and genome assembly with deep coverage.
The reader might wonder whether this approach would be advantageous in shotgun sequencing. Indeed, it will be, if a way of organizing overlapping short reads that may not be derived from the same start point can be developed. Multiple alignments would be useful in grouping overlapping short reads; however, combining frequency-based clustering with the multiple alignment of short tags becomes highly nontrivial. Because one short read can have multiple, more abundant, parents that may not necessarily overlap, the selection of a single parent for a short sequence is a difficult problem that we will leave for future investigation.
Methods
Our linear time complexity clustering algorithm consists of two main steps: statistical frequency-based detection of parent–child relationships and hash-based sequence searches. In preparing the input data, we adjusted QVs by sequencing and mapping control data obtained from BACs in the same run. We also considered the dependence of QV on base position due to noise factors that vary with the sequencing cycle. In addition, we calculated substitution patterns arising from the fluorophore cross-talk noise factor, with consideration of QV dependence.
Preparation of input data sets
An input data set should be a set of short reads generated in the same lane with information such as nucleotide sequence, frequency, and expectation of sequencing-error frequency, which is discussed below. Here we prepared two different kinds of data sets, small RNAs and 5′-end SAGE reads. For both of the data sets, we used a loose minimum QV threshold for the initial removal of apparently low quality reads from the Illumina results. A maximum of four bases in the first 20 bases of a read were allowed to have a QV less than 9.
The small RNA data set was generated from HT-29 human colon adenocarcinoma cells by Illumina sequencing using the small RNA protocol provided by Illumina. We performed an overlap alignment without gaps between raw reads and a 3′ linker (5′-TCGTATGCCGTCTTCTGCTTGT-3′). Because the QV of Illumina sequencing reads decreases toward the 3′ ends, we set a fairly low threshold to identify the 3′ linker. A read containing a 3′ linker should be aligned to the linker at its 3′ end with at least five bases and 80% similarity if the alignment is less than 11 bases long. The linker-trimmed reads of lengths ranging from 15 to 31 bases were retained for further clustering analysis. We then determined the frequency of each unique sequence. For each base of each unique sequence, we summed the expected error frequency estimated from the QV of each read as shown below. To convert from a given Illumina base quality score back to a probability value, we used to following:
where _P_error is the probability of a base being incorrect and Q is the QV of an Illumina base. As we know,

where _N_error is the number of observed errors and _N_correct is the number of observed correct bases (Ewing and Green 1998). Transforming the above equation gives

If we use the expected probability _P_error from the Illumina base QV score Q in the above formula, the left-hand side of the above formula, _N_error, gives the expected error frequency, which serves as a highly important indicator for the determination of whether similar nucleotide sequences arise from sequencing errors. Therefore, we did concrete evaluations of QV using our BAC sequencing data as a control, focusing on the overall accuracy of QV and its dependence on base position and specific substitution patterns.
Using the BAC sequence alignment results, we calculated the actual accuracy of the given Illumina QV without consideration of insertions and deletions (see Supplemental material). Overestimations of Illumina QV across all of the base positions were observed from BAC alignment when QV was >8. As shown in Supplemental Figure S1, for given QVs of 40 and 20, the actual QVs fell to <25 and <15, respectively. Additionally, the position-specific dependency of Illumina QVs illustrates a strict accuracy problem at the first base as well. For a given QV of 40 at the first base, the actual QV fell all the way to 11. However, for the other base positions, only a smooth change in base accuracy was observed. In previous work on substitution biases in sequencing (Li et al. 2004; Dohm et al. 2008), it was suggested that each nucleotide base has a specific error pattern that varies across the QV range. Indeed, we calculated the empirical error rates of sequencing error patterns from the BAC alignment and obtained results consistent with that of Dohm et al. (2008) (see Supplemental material). As shown in Supplemental Figure S2, the relative error rates of the three miscalled bases were dramatically different. For instance, adenines were most often miscalled as cytosine and rarely as guanine or thymine; the dominance of the adenine → cytosine error is the result of significant overlap of the adenine and cytosine fluorophore spectra. The relative error rates varied across QVs as well.
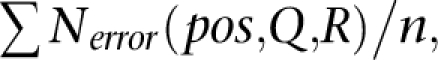
Obviously, these factors vary considerably when estimating error frequency. Thus, when the QV is Q, the expected number of errors of pattern R (e.g., A → C) at position, pos, is:

where _P_error (pos) is the adjusted error rate derived from Illumina QV at pos (Supplemental Table S1), and Rate(Q,R) implies the probability that substitution pattern R occurs at QV Q (Supplemental Table S3). Our model extends POLYBAYES (Marth et al. 1999), which uses a random error pattern, by considering both the dependence on base position and specific error patterns, thereby improving the accuracy of error rate prediction.
The 5′-end SAGE reads data set was generated using a high-resolution analysis of the 5′-end transcriptome (Hashimoto et al. 2004) of an embryo cDNA pool from the wild-type Canton-S strain of D. melanogaster (dmel). The cDNAs were cleaved by EcoP15I approximately 25–28 bases downstream of the transcription start site before sequencing. We trimmed all Illumina reads at 25 bases to remove the 3′-linker sequence. Then, we determined the frequency of each unique sequence and estimated the error frequency according to the methods used for small RNAs described above.
Frequency-based short-read clustering
We begin with defining several technical terms to introduce frequency-based short-read clustering. The Hamming distance between two sequences of equal length, S and _S_′, is denoted by Hamming(S,_S_′), which is the number of positions at which the corresponding nucleotides differ. If errors in sequencing a parent sequence give rise to another sequence S, a parent candidate for S should be a more abundant sequence with a small Hamming distance to S. The most abundantly expressed sequence S″ with one Hamming distance to S is the most probable parent candidate; namely,
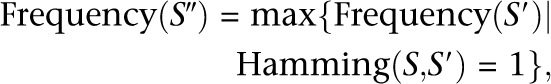
where Frequency(S′) denotes the frequency of sequence S′. The parent–child relationship is considered only for sequence pairs (S,S′) with one Hamming distance because sequences of more than one Hamming distance can usually be connected by a series of single-Hamming–distance pairs. We then perform a statistical test for the proportion of the parent–child relationship between the two sequences S and S″. When the frequency of the parent candidate S″ is n, the expected error rate at the base position pos where the base in S″ is replaced by the base in S (denoted as pattern R) with QV Q is
where the denominator is the sum of expected numbers of errors in n reads in S″. To measure the significance of the null hypothesis (H0) that the original sequence S arose from S″ by virtue of sequencing errors, we perform a one-proportion _Z_-test (see details in Supplemental material), and we use a one-tailed test for a 99% confidence limit. If the null hypothesis H0 is disproved, then S is proved to be an actually expressed sequence. Otherwise, the original sequence S is treated as an erroneous sequence and is therefore clustered as a child of S″. After iterative detections of parent–child relationships, the remaining sequences (which have not been clustered as children of any other sequence) are treated as representative expressed sequences in their clusters.
The construction of an efficient algorithm for frequency-based short-read clustering is not trivial. Our overall clustering flow with a total time complexity of O(N) has the following steps, where N represents the number of given short reads:
- Scan the observed redundant short reads, and compute the expected errors for three miscalled patterns of each base with a time complexity of O(N) (Fig. 4A).
- Sort the redundant short reads in lexicographical order using the radix-sort algorithm. Scan the sorted list to count the frequencies of the individual nonredundant sequences and the sum of expected errors at each base. Because the lengths of short reads are bounded by a constant ranging from 25 to 50 in current next-generation sequencing, the radix-sort runs in a linear time O(N) (Fig. 4B).
- Sort the nonredundant sequences according to their frequencies in descending order using the radix-sort algorithm. Because the frequencies are limited by the total number of short sequences, the worst-case time complexity of the radix-sort is linear O(N) (Fig. 4C).
- Scan the list of nonredundant sequences sorted by their frequencies, and build a hash table in which nonredundant sequences are keys and are associated with their frequencies in O(N)-time (Fig. 4D).
- Repeat the following three steps until the list of nonredundant sequences is empty, as illustrated in Figure 4E:
- Eliminate the bottom read of lowest abundance, S, from the list of nonredundant reads sorted by their frequencies in descending order.
- Select the most frequent read S″ such that:

- If S fails in the nonsequencing error test, set the parent of S to S″ (see Supplemental material).
Figure 4.

Procedure for frequency-based and hash-based short-read clustering. The list of short reads (blue) is a schematic view of millions of sequences. The columns (red) emphasize the sorting processes. A red base in E represents a position in disagreement with S.
The crux in the above steps is the efficient selection of S″. To this end, we generate the set {S′|Hamming(S,S′) = 1} and check whether each element in the set has the highest frequency by consulting the hash table generated in the previous step in constant time. Note that the size of the set is bounded by thrice the length of S, which is limited as a short read, and therefore can be treated as a constant. Therefore, the overall time complexity is linear in the total number of nonredundant reads.
Theorem: The above algorithm generates trees such that the frequency of any child node is lower than that of its parent node.
Proof: In Step 5, the selected child S and its parent candidate S″ meet the condition:

because S is of the lowest frequency in the list of remaining nonredundant sequences.
The worst-case time complexity is linear in the number of short reads and is therefore optimal theoretically. Indeed, the algorithm works efficiently in practice. In our test run, the elapsed time to process the example of small RNAs in Steps 4 and 5, the crucial part of the algorithm, was ∼3 min using one AMD Opteron processor (clock speed 3.0 GHz) with 128 GB of main memory.
An example of frequency-based cluster trees is shown in Figure 1C. A sequence node is indicated by a gray bar in which the contrast density is directly proportional to its frequency. Sequences with more than one Hamming distance to the representative sequence are clustered by their intermediary sequences. Obviously, in a frequency-based cluster, the representative sequence is the root node with the highest frequency, and it is considered to be a survivor of the de novo sequencing-error trimming process.
Acknowledgments
This work was supported in part by a Grant-in-Aid for Scientific Research on Priority Areas (C) from the Ministry of Education, Culture, Sports, Science and Technology of Japan, and by a grant for Bioinformatics Research and Development (BIRD) from the Japan Science and Technology Agency (JST).
Footnotes
References
- Altshuler D, Pollara VJ, Cowles CR, Van Etten WJ, Baldwin J, Linton L, Lander ES. An SNP map of the human genome generated by reduced representation shotgun sequencing. Nature. 2000;407:513–516. doi: 10.1038/35035083. [DOI] [PubMed] [Google Scholar]
- Barski A, Cuddapah S, Cui K, Roh TY, Schones DE, Wang Z, Wei G, Chepelev I, Zhao K. High-resolution profiling of histone methylations in the human genome. Cell. 2007;129:823–837. doi: 10.1016/j.cell.2007.05.009. [DOI] [PubMed] [Google Scholar]
- Bartel DP. MicroRNAs: Genomics, biogenesis, mechanism, and function. Cell. 2004;116:281–297. doi: 10.1016/s0092-8674(04)00045-5. [DOI] [PubMed] [Google Scholar]
- Brockman W, Alvarez P, Young S, Garber M, Giannoukos G, Lee WL, Russ C, Lander ES, Nusbaum C, Jaffe DB. Quality scores and SNP detection in sequencing-by-synthesis systems. Genome Res. 2008;18:763–770. doi: 10.1101/gr.070227.107. [DOI] [PMC free article] [PubMed] [Google Scholar]
- Butler J, MacCallum I, Kleber M, Shlyakhter IA, Belmonte MK, Lander ES, Nusbaum C, Jaffe DB. ALLPATHS: De novo assembly of whole-genome shotgun microreads. Genome Res. 2008;18:810–820. doi: 10.1101/gr.7337908. [DOI] [PMC free article] [PubMed] [Google Scholar]
- Chapman EJ, Carrington JC. Specialization and evolution of endogenous small RNA pathways. Nat Rev Genet. 2007;8:884–896. doi: 10.1038/nrg2179. [DOI] [PubMed] [Google Scholar]
- Dohm JC, Lottaz C, Borodina T, Himmelbauer H. Substantial biases in ultra-short read data sets from high-throughput DNA sequencing. Nucleic Acids Res. 2008;36:e105. doi: 10.1093/nar/gkn425. [DOI] [PMC free article] [PubMed] [Google Scholar]
- Durfee T, Nelson R, Baldwin S, Plunkett G, 3rd, Burland V, Mau B, Petrosino JF, Qin X, Muzny DM, Ayele M, et al. The complete genome sequence of Escherichia coli DH10B: Insights into the biology of a laboratory workhorse. J Bacteriol. 2008;190:2597–2606. doi: 10.1128/JB.01695-07. [DOI] [PMC free article] [PubMed] [Google Scholar]
- Erlich Y, Mitra PP, delaBastide M, McCombie WR, Hannon GJ. Alta-Cyclic: A self-optimizing base caller for next-generation sequencing. Nat Methods. 2008;5:679–682. doi: 10.1038/nmeth.1230. [DOI] [PMC free article] [PubMed] [Google Scholar]
- Ewing B, Green P. Base-calling of automated sequencer traces using phred. II. Error probabilities. Genome Res. 1998;8:186–194. [PubMed] [Google Scholar]
- Hashimoto S, Suzuki Y, Kasai Y, Morohoshi K, Yamada T, Sese J, Morishita S, Sugano S, Matsushima K. 5′-End SAGE for the analysis of transcriptional start sites. Nat Biotechnol. 2004;22:1146–1149. doi: 10.1038/nbt998. [DOI] [PubMed] [Google Scholar]
- Hillier LW, Marth GT, Quinlan AR, Dooling D, Fewell G, Barnett D, Fox P, Glasscock JI, Hickenbotham M, Huang W, et al. Whole-genome sequencing and variant discovery in C. elegans. Nat Methods. 2008;5:183–188. doi: 10.1038/nmeth.1179. [DOI] [PubMed] [Google Scholar]
- Holt RA, Jones SJ. The new paradigm of flow cell sequencing. Genome Res. 2008;18:839–846. doi: 10.1101/gr.073262.107. [DOI] [PubMed] [Google Scholar]
- Li M, Nordborg M, Li LM. Adjust quality scores from alignment and improve sequencing accuracy. Nucleic Acids Res. 2004;32:5183–5191. doi: 10.1093/nar/gkh850. [DOI] [PMC free article] [PubMed] [Google Scholar]
- Marth GT, Korf I, Yandell MD, Yeh RT, Gu Z, Zakeri H, Stitziel NO, Hillier L, Kwok PY, Gish WR. A general approach to single-nucleotide polymorphism discovery. Nat Genet. 1999;23:452–456. doi: 10.1038/70570. [DOI] [PubMed] [Google Scholar]
- Pevzner PA, Tang H, Waterman MS. An Eulerian path approach to DNA fragment assembly. Proc Natl Acad Sci. 2001;98:9748–9753. doi: 10.1073/pnas.171285098. [DOI] [PMC free article] [PubMed] [Google Scholar]
- Ueda HR, Hayashi S, Matsuyama S, Yomo T, Hashimoto S, Kay SA, Hogenesch JB, Iino M. Universality and flexibility in gene expression from bacteria to human. Proc Natl Acad Sci. 2004;101:3765–3769. doi: 10.1073/pnas.0306244101. [DOI] [PMC free article] [PubMed] [Google Scholar]
- Velculescu VE, Madden SL, Zhang L, Lash AE, Yu J, Rago C, Lal A, Wang CJ, Beaudry GA, Ciriello KM, et al. Analysis of human transcriptomes. Nat Genet. 1999;23:387–388. doi: 10.1038/70487. [DOI] [PubMed] [Google Scholar]