Defining a Chromatin Pattern That Characterizes DNA Hypermethylated Genes in Colon Cancer Cells (original) (raw)
. Author manuscript; available in PMC: 2009 Jul 7.
Abstract
Epigenetic gene regulation is a key determinant of heritable gene expression patterns and is critical for normal cellular function. Dysregulation of epigenetic transcriptional control is a fundamental feature of cancer, particularly manifesting as increased promoter DNA methylation with associated aberrant gene silencing which plays a significant role in tumor progression. We now globally map key chromatin parameters for genes with promoter CpG island DNA hypermethylation in colon cancer cells by combining micraoarray gene expression analyses with ChIP on chip technology. We first show that the silent state of such genes universally correlates with a broad, low level distribution of the PcG mediated histone modification, methylation of lysine 27 of histone 3 (H3K27me) and a very low level of the active mark, H3K4me2. This chromatin pattern, and particularly H3K4me2 levels, crisply separates DNA hypermethylated genes from those where histone deacetylation is responsible for transcriptional silencing. Moreover, the chromatin pattern can markedly enhance identification of truly silent and DNA hypermethylated genes. We additionally find that when DNA hypermethylated genes are de-methylated and re-expressed, they adopt a “bivalent” chromatin pattern which is associated with the poised gene expression state of a large group of ES cell genes, and is characterized by an increase in levels of both the H3K27me3 and H3K4me2 marks. Our data have great relevance for the increasing interest in re-expression of DNA hypermethylated genes for the treatment of cancer.
Keywords: DNA methylation, chromatin, histone modifications, cancer, epigenetic
Introduction
DNA sequence is the basic genetic building block of the genome. However, epigenetic gene regulation is critically important for normal cellular function, and dysregulation of epigenetic transcriptional control is often associated with disease. Aberrant promoter DNA hypermethylation is a critical event in the silencing of tumor suppressor genes in virtually all types of human cancer, and is a frequent alternative to genetic loss of tumor suppressor gene function (1). It is of great concern to know the chromatin effects of DNA demethylation since there is the promise of successful use of demethylating agents as cancer treatment (2). Using colorectal cancer HCT116 cells that have both DNMT1 and DNMT3b genetically knocked out (double knockout, DKO cells) (3), we are able to examine histone modification changes in a system with profoundly reduced DNA methyltransferase activity.
We have previously shown that several gene promoters retain many modifications that are typically associated with repression of transcription upon DNA demethylation-induced gene expression in DKO cells (4). These genes, now actively transcribed, exist in what we have termed a semi-heterochromatic state. This chromatin state shares similarities with what others have described as bivalent domains that contain both the active H3K4me2 mark, as well as the repressive H3K27me3 mark (5). To more globally understand the links between promoter CpG island DNA hypermethylation, repressive chromatin, abnormal gene silencing, and associated cancer biology, we have continued to study the localization of these two important histone modifications in wild type HCT116 colorectal cancer cells compared to DKO cells lacking DNA methylation. In this study, we have combined chromatin immunoprecipitation and DNA microarray analysis, or ChIP-chip, to map histone modifications, with a microarray expression approach we have used to randomly scan for CpG island DNA hypermethylated genes in the colon cancer genome (6), in order to globally determine the chromatin signature of DNA hypermethylated genes.
Materials and Methods
Cell Culture
HCT116 and DKO cells were maintained in McCoy's 5A modified medium supplemented with 10% fetal bovine serum (Gemini Bio-Products) and 1% penicillin/streptomycin (Invitrogen) and grown at 37°C in 5% CO2 atmosphere.
ChIP-chip
Chromatin immunoprecipitation was combined with DNA microarray analysis on HCT116 colorectal cancer cells and DKO cells in duplicate using antibodies specific for H3K27me3 (7), H3K4me2 (Upstate) or an IgG control (Upstate). Using 5 × 10ˆ7 cells per experiment, chromatin immunoprecipitation, DNA amplification, labeling, and array hybridization were performed as previously described (8). Independent batches of HCT116 and DKO cells were used to perform independent ChIP experiments and ChIPs for each antibody were hybridized to independent Agilent array sets. Whole genome expanded promoter 244K arrays from Agilent Technologies that span roughly 5Kb upstream to 2Kb downstream from gene transcription start sites were used.
Analyses
The data preprocessing for the tiling arrays was performed according to the manufacturers recommendations using the Agilent® ChIP Analytics 1.3 software, i.e. a median blanks subtraction followed by an inter-array median normalization and a dye-bias median normalization. The data was imported into R for downstream analysis. The expression arrays were preprocessed as previously described (6).
The expression data was analyzed as described in (6), but some modifications were made to determine the basal expression of genes. Expression values were calculated using an Agilent® whole human genome microarray with the DKO sample labeled with Cy5 and the original HCT116 sample with Cy3. Expression status was defined as the natural logarithm of the normalized single channel signal, i.e. the Cy5 channel for DKO cells and Cy3 channel for the HCT116 cells. The upper bound of the silent expression zone was chosen so that 90% of the 42 verified hypermethylated genes were contained within this zone. This cutoff was also chosen because it clearly separates the general expression trends of the true and false positive genes as shown in Supplementary Fig. 1. An intermediate expression zone was defined as encompassing all verified hypermethylated genes except one outlier. Above the upper boundary of the intermediate zone, the truly active genes can be found.
Composite graphs were created in order to reflect the general chromatin trends of a particular group of genes. In order to retain maximal data quality, only genes that had a minimal amount of probes within the promoter associated region around the transcription start site were allowed to contribute data points to the composite profile. A sliding window of 100 base pairs was normally used to compute the average H3K27me3 and H3K4me2 profiles for both HCT116 and DKO cells. The graphs for the false positives in Fig. 2c, which contains only 23 genes as input, required an extended window of 200 base pairs to smooth the profiles and give a better view of the general trends. A window of 250 base pairs was used to calculate the profiles for the 42 validated genes. In both cases the profiles were compared to the standard 100 base pair window profiles to ensure that only the visible noise was reduced and nothing about the trends or particularities was changed. The mean H3K27me3 enrichment in a region from -2250 to +2250 relative to the TSS was determined for all genes on the tiling array and was used to show the general H3K27me3 trends in Fig. 1f.
Figure 2.
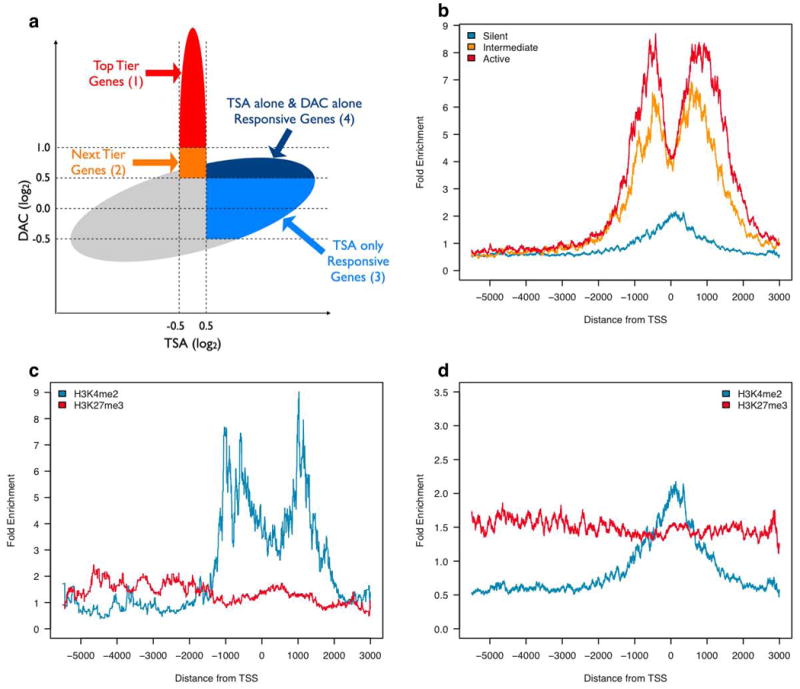
Chromatin and expression patterns can improve the identification of DNA hypermethylated genes. (a) Schematic showing expression behavior after treatment with either DAC or TSA. The increase for response of genes to TSA treatment alone is mapped on the X-axis, and the increase for DAC induced expression changes (similar to that for fold increases in DKO cells) is on the Y-axis. The lack of TSA response is mapped from -0.5 to +0.5 on the X-axis and key zones 1-4 used in the text to characterize genes are shown. Zones 1 and 2 are the key zones which we have previously defined to contain the best candidate genes with promoter CpG island DNA methylation (6). (b) Composite graph showing average enrichment of H3K4me2 at top and next tier genes separated by the levels of basal expression shown in Fig. 1a. (c) Composite graph showing average histone enrichment of 23 genes falsely identified as DNA hypermethylated and silent in HCT116 cells in our recently published study (6). (d) Composite graph showing average histone enrichment at 610 of the top and next tier gene candidates with the lowest basal expression (silent zone -Fig. 1a) in HCT116 cells.
Figure 1.
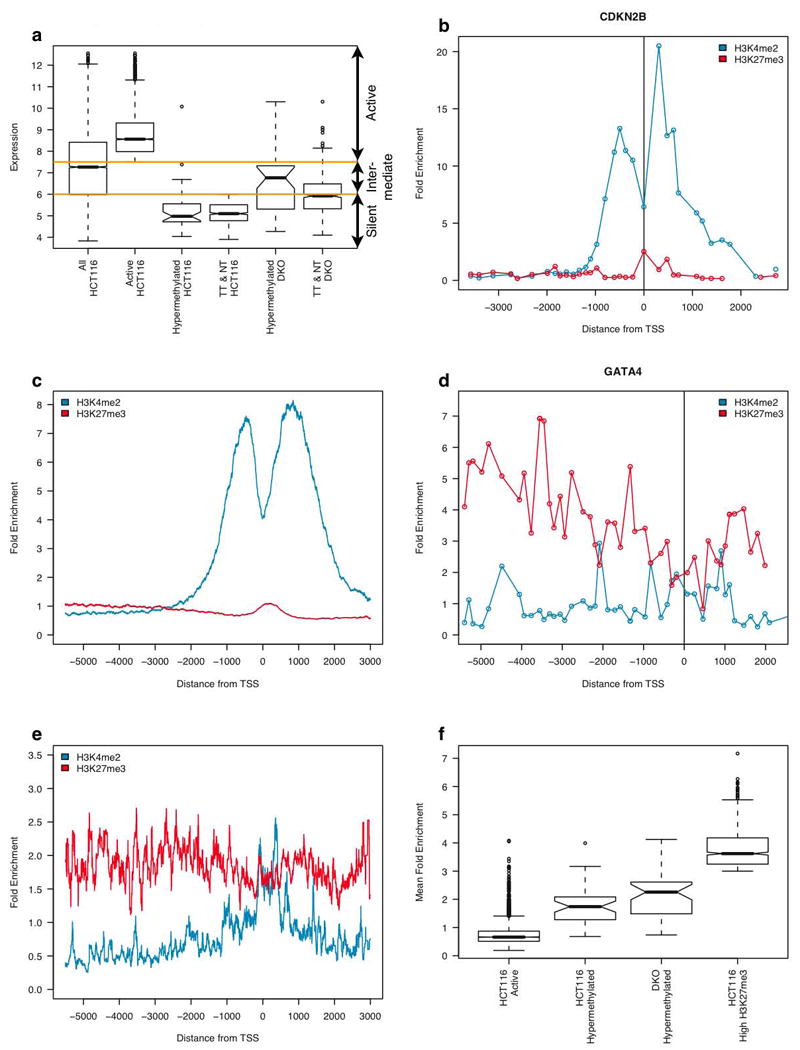
Chromatin signature of active and DNA hypermethylated genes in colorectal cancer cells. (a) Box plot showing ranges of expression for key gene groups in HCT116 and DKO cells. Y-axis shows log of normalized single channel signal from the Agilent 44K expression microarray. Average expression range is shown for: all genes in HCT116 cells, 4500 actively expressed genes with CpG islands in HCT 116 cells, 42 verified DNA hypermethylated genes in HCT 116 cells, all top tier and next tier candidate DNA hypermethylated genes (fig. 2a), the 42 verified DNA methylated genes in DKO cells, and the top and next tier genes in DKO cells. Orange lines represent limits separating active, intermediate and silent expression zones. TT is top tier and NT is next tier. (b) Plot showing normalized enrichment (bound/input) of histone marks (y-axis), as a function of distance (x-axis with 0 = annotated transcription start site) at the active CDKN2B gene promoter in HCT116 cells. (c) Composite graph showing average normalized enrichment of histone marks at over 4,500 active genes with CpG island containing promoters in HCT116 cells. (d) Plot showing normalized enrichment of histone marks at the hypermethylated and silent GATA4 gene promoter in HCT116 cells. (e) Composite graph showing average normalized enrichment of histone marks at 42 verified DNA hypermethylated and silent genes in HCT116 cells. (f) Box plot showing range of enrichment for H3K27me3 at active, DNA hypermethylated and silent, and genes with highest H3K27 enrichment.
Results and Discussion
We first markedly refined our Agilent 44K stratification of gene expression levels, as compared to our recent study, allowing us to define a very low range of basal expression for a group of 42 genes confirmed to be silenced by CpG island DNA hypermethylation (6) in HCT116 colorectal cancer cells (Fig. 1a; gene list-Supplementary Table 1). This “silent zone” (Fig. 1A) encompasses 90% or 41 of 42 verified hypermethylated genes. To place the chromatin state of these genes into global perspective, we began by using the ChIP-chip approach to examine over 4,500 active genes with CpG island-containing promoters (“active zone” in Fig. 1a, gene list will be included on-line). For both a single example of an active gene, CDKN2B (Fig. 1b), and for the average enrichment at all active CpG island gene promoters (Fig. 1c), we found, as in studies of others (9-13), that the active H3K4me2 mark is highly enriched in a 1 to 2 Kb region centered around the transcription start site. Also, as previously reported (13), we observed the sharp dip for this mark directly over the transcription start site (Fig. 1b and c) which marks the presence of a nucleosome free region at actively transcribed promoters (14-17). Concomitantly, we observe a virtual lack of the repressive H3K27me3 mark throughout a 7 to 8 kB region spanning the entire proximal promoter region (Fig. 1b, c).
In marked contrast to the above pattern for the active genes, we observe starkly reduced levels of H3K4me2 with only a minimal peak at the transcription start site of DNA hypermethylated and silent genes (individual example _GATA4_- Fig. 1d, and the average distribution for all the genes – Fig. 1e). Also in contrast to the active genes, the chromatin of the 42 verified DNA hypermethylated genes contained a low, but broad level of H3K27me3 enrichment over the entire promoter region (Fig. 1d and e). These results highlight previous studies linking the association of H3K27me3 enrichment with CpG island DNA hypermethylated genes in cancer (4). We found, however, that the H3K27me3 enrichment at DNA hypermethylated genes is actually intermediate when compared to other Polycomb marked genes. This is illustrated by comparison of these DNA hypermethylated genes to a group of 815 genes with very high H3K27me3 enrichment (Fig. 1f, gene list will be included on-line). The difference in H3K27me3 enrichment at hypermethylated genes is highly statistically significant when compared to levels at either active or high PcG genes (p-values < 2e-16 according to the Wilcoxin rank sum test). Interestingly, this high H3K27me3 enrichment selects for those genes lacking CpG islands (p-value < 2.2e-16 according to Fisher's Exact Test). Of the 815 genes selected for this highest H3K27me3 enrichment, 698 (85%) lack such islands in the promoter region.
Having defined the above gene expression and chromatin parameters, we sought to characterize essentially all of the candidate promoter CpG island DNA hypermethylated genes in the HCT116 colon cancer cells. As shown schematically in Fig. 2a, our previous discovery approach using microarray expression analysis, has discovered hypermethylated genes by defining a zone of increased expression following either genetic disruption of two DNA methyltransferases, DNMT1 and 3b (DKO cells), or treatment of the cells with the DNMT inhibitor, 5-aza-2′-deoxycytidine (DAC) (6). Further, we excluded those genes which increased expression following treatment of the HCT116 cells with Trichostatin A (TSA), an inhibitor of histone deactylases (HDACs) (6). Such refractoriness to TSA is a well defined feature of genes with densely DNA methylated promoter CpG islands (18, 19). Finally, only genes with low basal expression on the expression microarray, (previously using a cutoff that would include genes currently characterized in both intermediate and silent zones shown in Fig. 1a) were considered as possible candidates for silencing by DNA hypermethylation.
We now show, through our refined expression state classification in Figure 1a, that many of the genes which were previously defined as being silent (6), actually exhibit chromatin characteristics of active genes. We examined a group of over 1792 genes in HCT116 cells (gene list will be included on-line) whose expression behavior (increase with DAC, no increase with TSA, regardless of basal expression) placed them in the top tier and next tier candidate zone (zones 1 and 2 in Fig. 2a). Surprisingly, the chromatin of 515 genes in this tier with an intermediate expression level (Fig. 1a), have distinctly more H3K4me2 enrichment around the transcription start site when compared to a group of 610 genes within the silent zone (Fig. 2b). Thus, these genes with intermediate expression levels have an active chromatin pattern for this mark (Fig. 2b). To place these findings into perspective for the purpose of enriching the efficiency of our expression array paradigm to randomly identify CpG island DNA hypermethylated genes, we find the same intermediate expression (Supplementary Fig. 1) and enrichment of the H3K4me2 mark for 23 genes previously identified in our recent study (6) as false positives when we selected them as candidate genes for promoter DNA hypermethylation (Fig. 2c).
Strikingly, having now eliminated the above 515 genes with intermediate basal expression and enriched H3K4me2 from the candidate list, the chromatin pattern for the remaining 610 genes within the silent zone (gene list-Supplementary Table 2) shows an identical chromatin pattern to that of the 42 verified DNA hypermethylated genes. This includes broad distribution of H3K27me3 around the gene promoters, and a low H3K4me2 peak positioned directly over the transcription start site without the dip for the nucleosome free region (Fig. 2d). Thus, the level of H3K4me2, matched with a very stringent level for low basal transcription, can potentially eliminate false positives, eliminating some 28.75% of genes in the top tier (zone 1 in Fig. 2a) and 51.09% of the next tier (zone 2 in Fig. 2a) in the no TSA response zone that are not truly DNA methylated. We have previously identified that verification of genes as DNA methylated and silenced in the cell lines on which the microarray approach is utilized, is ∼ 80% in the top tier and 50% in the next tier (6). Thus, knowledge of the chromatin status of the genes in cancer cells can markedly increase the efficiency of our expression array approach for identification of genes with promoter CpG island DNA methylation and complete transcriptional silencing.
Our previous chromatin studies at a limited number of DNA hypermethylated genes suggested that even when these genes are induced to re-express by DNA demethylation, they do not return to a highly active state but rather to one of low, poised transcription with retention of the bivalent chromatin pattern (4). In stem/progenitor cells, this pattern is thought to hold a key group of genes in a poised, low transcription state, necessary to maintain pluripotency (5). We were now in a position to test whether this is truly a universal property of CpG island DNA hypermethylated genes in colon cancer cells. We examined this by comparing the HCT116 cells to their isogenic derivative DKO cells, in which all tested DNA hypermethylated genes are de-methylated and re-expressed (3, 20).
We first find that the expression of the 42 verified DNA hypermethylated genes is distinctly increased to an intermediate expression range in DKO cells (Fig. 1a). We then examined the chromatin profile of the genes in the DKO cells, shown for the sample individual SFRP1 gene promoter in Fig. 3a and b and for the composite profile of the validated hypermethylated genes in Fig. 3c. These promoters distinctly adopt a bivalent chromatin pattern upon DNA demethylation, characterized by an increase in H3K27me3 enrichment near the gene start sites (p-value of 0.009873 according to the Wilcoxon rank sum test – fig. 1f), with a simultaneous increase in H3K4me2 levels (p-value of 5.865e-07 according to the Wilcoxon rank sum test). We next examined the entire list of 610 best candidate DNA hypermethylated genes from the TSA negative zone (zones 1 and 2 in Fig. 2a), as defined by the stringent basal expression criteria above. These genes also assume an intermediate expression range in the DKO cells (Fig. 1a), and again, adopt a bivalent pattern chromatin pattern (Fig. 3d). It is particularly interesting that the H3K4me2 mark not only increases, but redistributes the peak positions to either side of the direct transcription start site.
Figure 3.
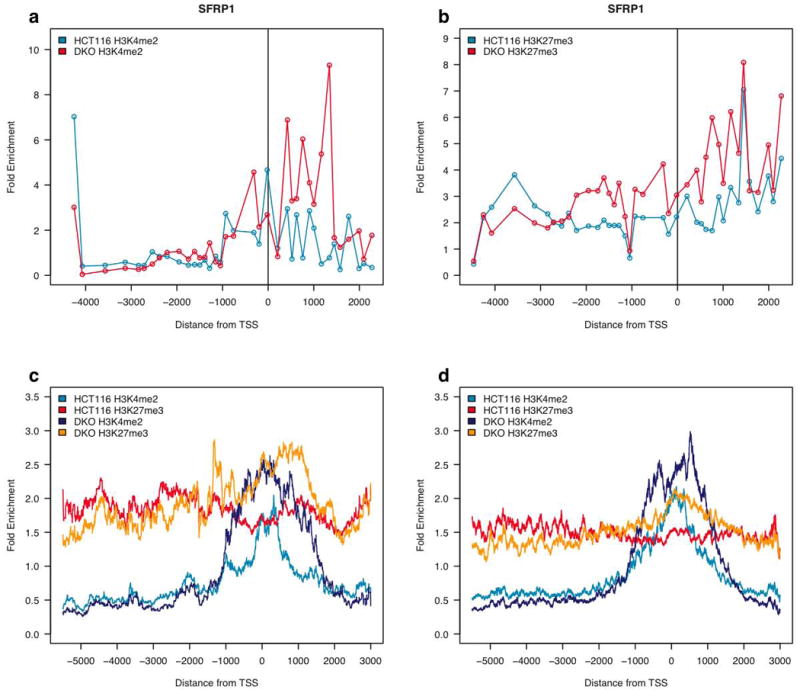
Hypermethylated genes adopt a bivalent chromatin pattern upon re-expression after DNA demethylation. (a) Plot showing normalized enrichment of H3K4me2 at the SFRP1 gene promoter when hypermethylated and silent in HCT116 cells and when re-expressed in DKO cells. (b) Plot showing normalized enrichment of H3K27me3 at the SFRP1 gene promoter when hypermethylated and silent in HCT116 cells and when re-expressed in DKO cells. (c) Composite graph showing average histone methylation enrichment at 42 genes verified as DNA hypermethylated and silent in HCT116 cells and re-expressed in DKO cells. (d) Composite graph showing average histone methylation enrichment at the 610 low expressing, top and next tier candidate genes, for DNA methylation associated silencing in HCT116 cells and re-expression in DKO cells.
Lastly, we address a question which is key to the biology of promoter CpG island DNA methylation and its associated chromatin, in addition to being clinically important for the potential anti-cancer therapeutic strategy of re-expressing aberrantly silenced genes (2). An important concept underlying ongoing trials of epigenetic therapy for cancer is that promoter DNA methylation is dominant over histone deactylation. Thus, if a low dose of a DNA demethylating agent is first administered to cancer cells, an HDAC inhibitor, which does not alone cause re-expression of aberrantly densely DNA methylated genes, is then able to exert synergistic effects with the DNA demethylation for re-expression of such genes (18, 19). To examine chromatin patterns which may help explain the above relationships between DNA methylation and the effects of HDAC inhibitors, we examined the chromatin of genes whose expression is augmented by treatment with TSA alone (zones 3 and 4 in Fig. 2a, gene list will be included on-line). We first found that the average basal expression of these genes is generally higher than for the DNA hypermethylated genes (Fig. 4a). Most importantly, the chromatin revealed a striking difference, showing that genes stimulated by TSA alone have much higher basal enrichment of H3K4me2, and the characteristic dip which occurs directly at the transcription start site for active genes (Fig. 4b and c). Whether examining genes that were stimulated only by TSA (zone 3 in Fig. 2a), or genes that increased expression after either DAC or TSA treatment alone (zone 4 in Fig. 2a), marked enrichment for the H3K4me2 active mark was found (Fig. 4b and c).
Figure 4.
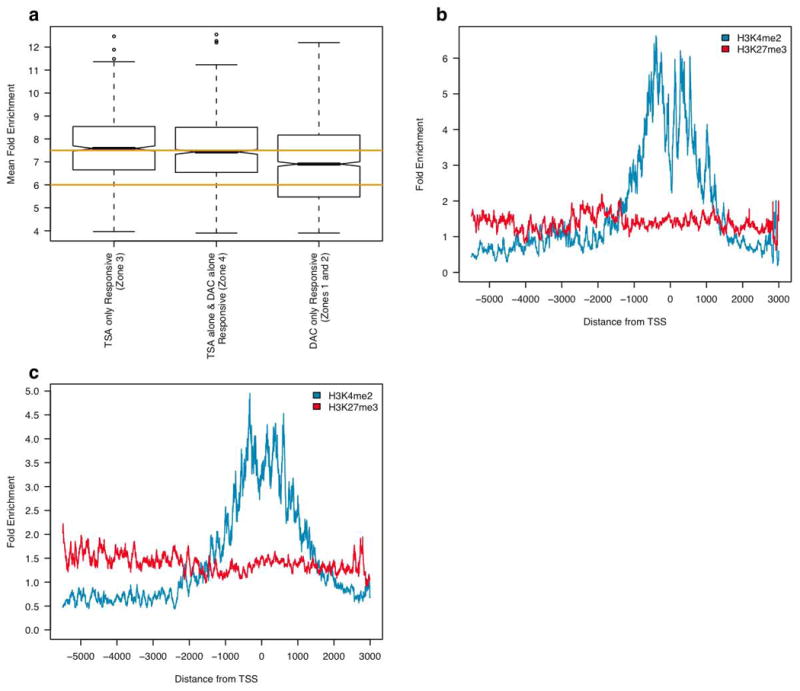
H3K4me2 enrichment distinguishes TSA responsive genes from those which respond only to DAC. (a) Box plot showing expression range for genes responsive to only DAC (zones 1 and 2 in Fig. 2a), only TSA (zone 3 in Fig. 2a), or to both DAC alone and TSA alone (zone 4 in Fig. 2a). Orange lines represent limits separating active, intermediate and silent expression zones. (b) Plot showing normalized enrichment of histone marks at 84 genes with low basal expression in HCT116 cells that respond only to TSA alone (zone 3 in Fig. 2a). (c) Plot showing normalized enrichment of histone marks at 141 genes with low basal expression in HCT116 cells that respond to either DAC alone or TSA alone (zone 4 in Fig. 2a).
Thus, these global studies now provide more insight into why DNA hypermethylated genes cannot be re-expressed by TSA alone, and why initial DNA demethylation is required before these genes are sensitized to TSA responsiveness. Our previous local ChIP studies of a delimited number of DNA hypermethylated genes in DAC treated cells, or in DKO cells (4), and now our current study of many such genes in the ChIP-chip analyses, all suggest that removal of DNA methylation results in increases in promoter region H3K4me2. Thus, there is a resultant transformation of a fully silenced transcription state to one of a low expression, poised transcription state. The enrichment of H3K4me2 at the transcription start site in this state now resembles that for genes that can be re-expressed by administration of the HDAC inhibitor alone.
In summary, our global genome studies of two important histone modification marks in colon cancer cells have taught us much about a key component of abnormal epigenetic gene regulation in cancer cells, gene promoter CpG island DNA methylation and associated tight transcriptional silencing. Our findings firmly suggest that DNA methylation is superimposed on a bivalent chromatin state which has been best associated with the CpG islands of an important subset of genes in ES and committed progenitor cells. These global findings further link the origins of aberrantly DNA hypermethylated genes in cancer cells to an underlying chromatin pattern similar to that of an important group of CpG island containing, low expression genes, in stem/precursor cells. We can now provide additional support for these findings by the fact that 48.69% (p-value < 2.2e-16 according to Fisher's Exact Test) of the 610 best candidate DNA hypermethylated genes, as we now define them in this study, are listed as PcG marked in published tiling studies of either ES cells, embryonic fibroblasts, MEFS, or neural progenitor cells (21-23). This accentuates the likelihood that this precursor cell state, which normally helps hold genes in a low transcription poised state, may predispose such genes to DNA methylation and conversion of this state to very tight, heritable, transcriptional silencing in adult cancers. As we have discussed, this chromatin pattern may reflect the early cell compartments from which cancers arise (24). Loss of function of many of the genes involved may help cancers retain properties of these early cells at the expense of normal differentiation. Finally, our chromatin findings help explain how CpG island DNA methylation must be relieved to allow for re-expression via HDAC inhibition. This finding may help refine the concepts underlying ongoing clinical trials for combined use of DNA demethylating and HDAC inhibitors in treating cancer.
Supplementary Material
Sup. Fig. 1
Table 1
Table 2
Acknowledgments
Grant Support: This work was supported by NIEHS grant ES11858 and NIH grant CA116160.
References
- 1.Jones PA, Baylin SB. The Epigenomics of Cancer. Cell. 2007;128:683–92. doi: 10.1016/j.cell.2007.01.029. [DOI] [PMC free article] [PubMed] [Google Scholar]
- 2.Egger G, Liang G, Aparicio A, Jones PA. Epigenetics in human disease and prospects for epigenetic therapy. Nature. 2004;429:457–63. doi: 10.1038/nature02625. [DOI] [PubMed] [Google Scholar]
- 3.Rhee I, Bachman KE, Park BH, et al. DNMT1 and DNMT3b cooperate to silence genes in human cancer cells. Nature. 2002;416:552–6. doi: 10.1038/416552a. [DOI] [PubMed] [Google Scholar]
- 4.McGarvey KM, Fahrner JA, Greene E, Martens J, Jenuwein T, Baylin SB. Silenced tumor suppressor genes reactivated by DNA demethylation do not return to a fully euchromatic chromatin state. Cancer Res. 2006;66:3541–9. doi: 10.1158/0008-5472.CAN-05-2481. [DOI] [PubMed] [Google Scholar]
- 5.Bernstein BE, Mikkelsen TS, Xie X, et al. A bivalent chromatin structure marks key developmental genes in embryonic stem cells. Cell. 2006;125:315–26. doi: 10.1016/j.cell.2006.02.041. [DOI] [PubMed] [Google Scholar]
- 6.Schuebel KE, Chen W, Cope L, et al. Comparing the DNA Hypermethylome with Gene Mutations in Human Colorectal Cancer. PLoS Genetics. 2007;3:e157. doi: 10.1371/journal.pgen.0030157. [DOI] [PMC free article] [PubMed] [Google Scholar]
- 7.Perez-Burgos L, Peters AH, Opravil S, Kauer M, Mechtler K, Jenuwein T. Generation and characterization of methyl-lysine histone antibodies. Methods Enzymol. 2004;376:234–54. doi: 10.1016/S0076-6879(03)76016-9. [DOI] [PubMed] [Google Scholar]
- 8.Boyer LA, Lee TI, Cole MF, et al. Core Transcriptional Regulatory Circuitry in Human Embryonic Stem Cells. Cell. 2005;122:947–56. doi: 10.1016/j.cell.2005.08.020. [DOI] [PMC free article] [PubMed] [Google Scholar]
- 9.Bernstein BE, Kamal M, Lindblad-Toh K, et al. Genomic maps and comparative analysis of histone modifications in human and mouse. Cell. 2005;120:169–81. doi: 10.1016/j.cell.2005.01.001. [DOI] [PubMed] [Google Scholar]
- 10.Kim TH, Barrera LO, Zheng M, et al. A high-resolution map of active promoters in the human genome. Nature. 2005;436:876–80. doi: 10.1038/nature03877. [DOI] [PMC free article] [PubMed] [Google Scholar]
- 11.Roh TY, Cuddapah S, Cui K, Zhao K. The genomic landscape of histone modifications in human T cells. Proceedings of the National Academy of Sciences. 2006;103:15782–7. doi: 10.1073/pnas.0607617103. [DOI] [PMC free article] [PubMed] [Google Scholar]
- 12.Identification and analysis of functional elements in 1% of the human genome by the ENCODE pilot project. Nature. 2007;447:799–816. doi: 10.1038/nature05874. [DOI] [PMC free article] [PubMed] [Google Scholar]
- 13.Barski A, Cuddapah S, Cui K, et al. High-Resolution Profiling of Histone Methylations in the Human Genome. Cell. 2007;129:823–37. doi: 10.1016/j.cell.2007.05.009. [DOI] [PubMed] [Google Scholar]
- 14.Bernstein B, Liu C, Humphrey E, Perlstein E, Schreiber S. Global nucleosome occupancy in yeast. Genome Biology. 2004;5:R62. doi: 10.1186/gb-2004-5-9-r62. [DOI] [PMC free article] [PubMed] [Google Scholar]
- 15.Lee CK, Shibata Y, Rao B, Strahl BD, Lieb JD. Evidence for nucleosome depletion at active regulatory regions genome-wide. Nat Genet. 2004;36:900–5. doi: 10.1038/ng1400. [DOI] [PubMed] [Google Scholar]
- 16.Yuan GC, Liu YJ, Dion MF, et al. Genome-Scale Identification of Nucleosome Positions in S cerevisiae. Science. 2005;309:626–30. doi: 10.1126/science.1112178. [DOI] [PubMed] [Google Scholar]
- 17.Mito Y, Henikoff JG, Henikoff S. Genome-scale profiling of histone H3.3 replacement patterns. Nat Genet. 2005;37:1090–7. doi: 10.1038/ng1637. [DOI] [PubMed] [Google Scholar]
- 18.Cameron EE, Bachman KE, Myohanen S, Herman JG, Baylin SB. Synergy of demethylation and histone deacetylase inhibition in the re-expression of genes silenced in cancer. Nat Genet. 1999;21:103–7. doi: 10.1038/5047. [DOI] [PubMed] [Google Scholar]
- 19.Suzuki H, Gabrielson E, Chen W, et al. A genomic screen for genes upregulated by demethylation and histone deacetylase inhibition in human colorectal cancer. Nat Genet. 2002;31:141–9. doi: 10.1038/ng892. [DOI] [PubMed] [Google Scholar]
- 20.Suzuki H, Watkins DN, Jair KW, et al. Epigenetic inactivation of SFRP genes allows constitutive WNT signaling in colorectal cancer. Nat Genet. 2004;36:417–22. doi: 10.1038/ng1330. [DOI] [PubMed] [Google Scholar]
- 21.Lee TI, Jenner RG, Boyer LA, et al. Control of developmental regulators by polycomb in human embryonic stem cells. Cell. 2006;125:301–13. doi: 10.1016/j.cell.2006.02.043. [DOI] [PMC free article] [PubMed] [Google Scholar]
- 22.Bracken AP, Dietrich N, Pasini D, Hansen KH, Helin K. Genome-wide mapping of Polycomb target genes unravels their roles in cell fate transitions. Genes Dev. 2006;20:1123–36. doi: 10.1101/gad.381706. [DOI] [PMC free article] [PubMed] [Google Scholar]
- 23.Mikkelsen TS, Ku M, Jaffe DB, et al. Genome-wide maps of chromatin state in pluripotent and lineage-committed cells. Nature. 2007;448:553–60. doi: 10.1038/nature06008. [DOI] [PMC free article] [PubMed] [Google Scholar]
- 24.Ohm JE, McGarvey KM, Yu X, et al. A stem cell-like chromatin pattern may predispose tumor suppressor genes to DNA hypermethylation and heritable silencing. Nat Genet. 2007;39:237–42. doi: 10.1038/ng1972. [DOI] [PMC free article] [PubMed] [Google Scholar]
Associated Data
This section collects any data citations, data availability statements, or supplementary materials included in this article.
Supplementary Materials
Sup. Fig. 1
Table 1
Table 2