siRNA Targeted to p53 Attenuates Ischemic and Cisplatin-Induced Acute Kidney Injury (original) (raw)
Abstract
Proximal tubule cells (PTCs), which are the primary site of kidney injury associated with ischemia or nephrotoxicity, are the site of oligonucleotide reabsorption within the kidney. We exploited this property to test the efficacy of siRNA targeted to p53, a pivotal protein in the apoptotic pathway, to prevent kidney injury. Naked synthetic siRNA to p53 injected intravenously 4 h after ischemic injury maximally protected both PTCs and kidney function. PTCs were the primary site for siRNA uptake within the kidney and body. Following glomerular filtration, endocytic uptake of Cy3-siRNA by PTCs was rapid and extensive, and significantly reduced ischemia-induced p53 upregulation. The duration of the siRNA effect in PTCs was 24 to 48 h, determined by levels of p53 mRNA and protein expression. Both Cy3 fluorescence and in situ hybridization of siRNA corroborated a short t½ for siRNA. The extent of renoprotection, decrease in cellular p53 and attenuation of p53-mediated apoptosis by siRNA were dose- and time-dependent. Analysis of renal histology and apoptosis revealed improved injury scores in both cortical and corticomedullary regions. siRNA to p53 was also effective in a model of cisplatin-induced kidney injury. Taken together, these data indicate that rapid delivery of siRNA to proximal tubule cells follows intravenous administration. Targeting siRNA to p53 leads to a dose-dependent attenuation of apoptotic signaling, suggesting potential therapeutic benefit for ischemic and nephrotoxic kidney injury.
Acute kidney injury (AKI) is a clinically devastating disease associated with unacceptably high mortality rates,1 progression to end-stage renal disease,2 and increasing incidence.1,3–6 Recent attention has focused on translating basic pathophysiologic understanding into clinical advances in an effort to develop selective approaches mediating effective targeted therapeutic interventions.
Activation and upregulation of a number of different intracellular signaling cascades occurs during and following cell injury from ischemia, trauma, toxins, or infections. These signaling cascades are involved with inflammation; apoptosis; and many other autocrine, paracrine, and endocrine events. Apoptosis has been increasingly recognized as a central player in the pathophysiology of AKI,7 and numerous studies have documented the quantitative importance of apoptotic renal cell death in ischemia, sepsis, and nephrotoxic injury.8–10 Apoptosis develops along with inflammation, and the two processes potentiate each other. Thus, many inflammatory cytokines and reactive oxygen species are known to trigger apoptosis. The apoptotic program is highly conserved among species11 and has been divided into two distinct pathways: the intrinsic or mitochondrial, and the extrinsic or death ligand-mediated pathways.12,13 Both extrinsic and intrinsic pathways play a role in various forms of renal injury, and the relative importance of each pathway varies with the specific injury model. The two pathways are not completely independent and can potentiate each other.14,15
The major epithelial cell type involved in animal models of AKI from ischemia, septic, and most nephrotoxic insults is the proximal tubule cell (PTC). PTCs reabsorb many filtered molecules, and intracellular processing can include metabolism, accumulating in lysosomes, release into the cytosol, and transcytoses. Early experiments with antisense oligonucleotides, containing either phosphorothioate or phosphodiester backbones, demonstrated their predominant excretion via glomeruli filtration, and kidney accumulation was ascribed to tubular epithelial cell reabsorption.16 Recent scintigraphic data indicated that, like antisense oligonucleotides, siRNA administered intravenously also accumulated in the kidney to greater than 40 times the level seen in any other organ. However, resolution at the cellular level was not undertaken in this study.17 Both antisense oligonucleotides and siRNA have been shown to suppress activity of the target genes expressed in proximal tubular cells.17,18 Suppression of renal caspase 3 and 819 and C5a20 have been shown to minimize ischemic injury. The potential therapeutic opportunities utilizing RNAi in vivo are just now being recognized. Since delivery to and uptake by target cells are prerequisites for efficacy, PTCs may offer unique and exciting opportunities for in vivo utilization of RNAi technology in the treatment and/or prevention of diseases.
We and others have documented the importance of p53 activation in ischemia-reperfusion injury to the kidney and other organs.8–10,21–23 The apoptotic program triggered by p53 depends both on its transcriptional activity and direct interactions with Bcl2 family members at the level of mitochondrial membranes.23–28 Therefore, we chose inhibition of p53 expression following ischemia-reperfusion injury as a means to test the efficacy of siRNA in vivo in reducing PTC injury and improving organ function.
Results
Proximal Tubule Reabsorption of siRNA
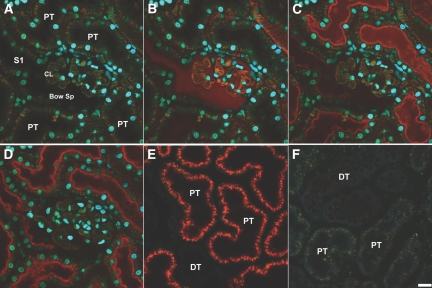
Initial studies evaluated kidney cell uptake of a Cy3-labeled siRNA following intravenous administrations. Figure 1 (A through F) shows representative 2-photon images collected at 0 and 3 min from the same MW (Munich Wistar) rat. Following intravenous (IV) injection, there was rapid glomerular filtration of the Cy3-siRNA siRNA with subsequent proximal tubule brush border binding and endocytosis by PTC. Within 3 min, extensive binding to the apical membrane had occurred and early endosomes on the outer aspects of the apical membrane could be visualized (Figure 1, B through D). The minimal Cy3-siRNA label in the vasculature at 3 min indicated rapid renal clearance. In Figure 1E, by sixty minutes postinjection, there was increased and now uniform labeling of the apical membrane of PTC, and intense cellular internalization was seen with terminal web and lysosomal localizations. Labeling of distal tubules, endothelial cells or circulating white blood cells was not seen. By 24 h (Figure 1F), there was nearly complete lack of the Cy3-siRNA in PTC. These extended time observations were made in the same rat used for the 0 to 60 min studies.
Figure 1.
(A) Rapid filtration and uptake of fluorescence Cy3-siRNA in the living rat kidney as visualized by 2-photon microscopy. A high resolution micrograph of the superficial renal cortex shows various landmarks after labeling with a 500 kD fluorescein dextran (green) and the nuclear dye Hoecshts 33342 (cyan). (B) The nuclei of various epithelial and vascular cell types can be discerned; proximal tubules (PT); note the S1 segment (S1) opening up into the Bowman's Space (Bow Sp) with adjacent Capillary Loops (CL). The 500 kD dextran shows the microvasculature seen between the PTs and outlines the CL within the glomerulus. The siRNA (seen in red) rapidly filters into the Bow Sp and down the S1 within seconds of infusion. (C) Within a minute after infusion, binding to the subapical region of PTs occurred. (D) Subapical endosomes can be seen in the lower left PT approximately 3 min postinjection. (E) The progression from binding to internalization is readily seen in PTs 60 min postinfusion. A distal tubule (DT) in the lower portion exhibits no uptake of the siRNA. (F) Degradation of the siRNA is apparent 24 h postinjection. There is a lack of residual fluorescence in PT or DTs. (Bar = 20 μm).
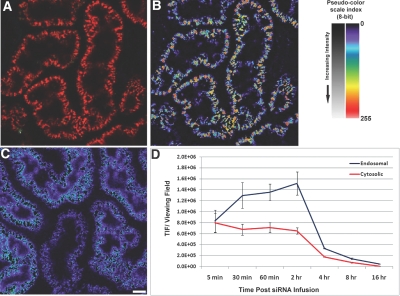
Figure 2 shows quantitative threshold analysis to determine total cellular and cytosolic Cy3-siRNA in PTC. Figure 2A shows an unmanipulated image, Figure 2B is the thresholded profiled image, and Figure 2C is the subtraction analysis image of low-intensity value areas. The blue and purple areas represent low-level “free” cytosolic labeling. Figure 2D shows the quantitative analysis revealing a rapid increase, a plateau, and a rapid decline in both total and free cytosolic siRNA, with cytosolic siRNA being at a level less than 200 times of total cellular siRNA. Rapid elimination of fluorescence signal from both total and cytosolic siRNA occurred.
Figure 2.
Quantitative endosomal and cytosolic fluorescence Cy3-siRNA in renal proximal tubules. (A) Total endosomal fluorescence Cy3-siRNA. Utilizing a series of operations within imaging processing software, the inherent differences in intensities between the high intensity endosomal (B) and low intensity cytosolic (C) accumulated Cy3-siRNA can be used to distinguish them for quantitation. (D) The graph shows the total fluorescence emanating from the two individual pools per microscopic viewing field. Images in (B) and (C) are shown using a pseudocolor scale palette, which facilitates discerning low-intensity gray scale levels; a reference image is provided in the upper right portion of the panel. (Bar = 20 μm).
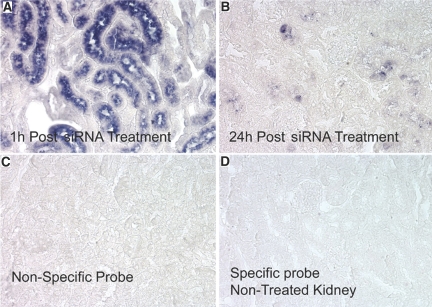
To confirm these fluorescence siRNA results, in situ hybridization studies were undertaken and siRNA was identified in the vast majority of PTCs one hour after intravenous administration (Figure 3A). However, at 24 h post-treatment, the hybridization signal was rarely detected (Figure 3B). The specificity of detection of injected siRNA by in situ hybridization was confirmed by the lack of reaction with a nonspecific probe (Figure 3C) in siRNA-treated or with the specific probe in siRNA-untreated rats (Figure 3D).
Figure 3.
In situ hybridization analysis of siRNA localization in cortical sections 1 h (A) and 24 h (B) post IV injection. Controls consisted of a nonspecific siRNA probe (C) and the specific probe used on kidney sections from rats not treated with siRNA (panel D).
Generation of p53 Targeting siRNA to Inhibit P53 Production
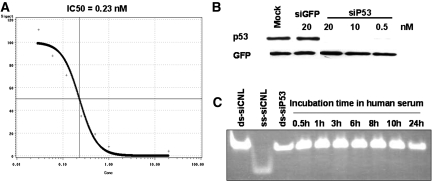
Synthetic siRNA targeting rat p53 mRNA (siP53), following transfection into cultured Rat1 cells expressing wild-type p53, elicited near complete p53 mRNA elimination at a concentration of ∼1nM with an IC50 of approximately 0.23nM (Figure 4A). p53 siRNA also inhibited P53 protein production even at 0.5 nm concentrations (Figure 4B). Incubation of siRNA in 100% rat (not shown) or human serum at 37 °C for 24 h did not result in any detectable degradation of the molecule (Figure 4C).
Figure 4.
siRNA to p53 inhibits p53 expression and is stable in human serum. (A**)** Different quantities of siP53 were transfected into Rat1 cells using Lipofectamine2000. p53 mRNA was quantified using qPCR and IC50 was calculated from a four-parameter sigmoidal curve where top was fixed as 100% based on p53 mRNA qPCR values derived from mock-transfected Rat1 cells and the cells transfected with control GFP siRNA. Horizontal axis shows siRNA concentration in nM; vertical axis shows residual p53 mRNA quantities as percentage of control (100%). (B**)** Western blot showing p53 protein levels in Rat 1 cells transfected with siRNA. siRNA targeting GFP was used as negative control. All cells were co-transfected with pCDNA3-GFP plasmid for transfection control. Note that, unlike siP53 that elicited complete and specific elimination of p53 protein when transfected at concentrations 0.5, 10 or 20 nM, siGFP was ineffective in producing either GFP or p53 KD at 20 nM. (C**)** Aliquots of 1 μg of siP53 were incubated in 20 μl of complete human serum at 37 °C for different time intervals and then analyzed on nondenaturing 20% PAAG. Similar quantities of siP53 as well as of double-stranded and single-stranded similarly modified CNL RNA oligonucleotides of the same length dissolved in PBS were used for size control.
P53 siRNA Minimizes Ischemic Injury
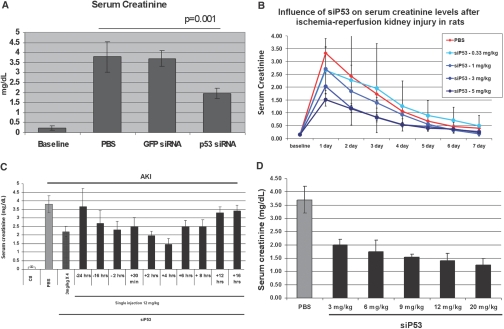
To determine the effect of the p53 siRNA on the preservation of kidney function, bilateral renal-clamp studies were undertaken (Figure 5). Initial studies utilizing four injections of p53 siRNA, with two injections before (−2 h, −30 min) and two postinjury (+4 and 8 h), had indicated a protection of kidney function and preservation of morphology (data not shown). With each injection, rats received either 1 mg/kg (cumulative dose −4 mg/kg) of p53 siRNA or GFP siRNA, or an equal volume of PBS. Baseline creatinine increased from 0.2 ± 0.1 mg/dl to 3.7 ± 0.8 with ischemia (Figure 5A). The GFP siRNA had no protective effect, whereas p53 siRNA reduced serum creatinine to 1.9 ± 0.2 (P < 0.01).
Figure 5.
Effect of p53 siRNA treatment on kidney function following ischemic injury. (A) Serum creatinine levels 24 h post-ischemia in rats treated with PBS or siRNAs targeting p53 or GFP (1 mg/kg) given IV at −2 h and −0.5 h pre-ischemia and 4 and 8 h post-ischemia. Serum creatinine levels in siP53-treated rats were statistically significant lower than in PBS or GFP siRNA-treated rats (p < = 0.01, ANOVA). (B) Serum creatinine levels quantified daily post-ischemia with increasing doses of P53 siRNA given IV at 2 and 0.5 h pre-ischemia and 4 and 8 h post-ischemia. Animals receiving ≥1 mg/kg per injection of siRNA had serum creatinine levels significantly lower than in PBS-treated animals at 24 h postinjury (P < 0.05, ANOVA). (C) Serum creatinine levels 24 h post-ischemic injury in rats injected with PBS or siP53. siRNA targeting p53 (12 mg/kg) was given as a single bolus IV injection at variable times pre- and postinjury compared with the previously used 3 mg/kgX4 protocol when the same 12 mg/kg total dose was split into four 3 mg/kg IV injections given at 2 and 0.5 h pre-ischemia and 4 and 8 h post-ischemia. Data points statistically different from PBS control (P < 0.01, ANOVA) are marked with asterisks. (D) Effect of increasing dose of p53 siRNA on kidney function when given 4 h postinjury. In all groups, a statistically significant decrease of serum creatinine levels was achieved (P < 0.01, ANOVA). In all studies, data represent the mean ± SD. n = 6 for all groups in all studies.
For dose-response analysis, rats were injected with doses of siP53, 0.33; 1, 3, or 5 mg/kg, given at the same four time points, resulting in cumulative doses of 1.32; 4, 12, and 20 mg/kg, respectively (Figure 5B). All siRNA doses tested produced a SCr reducing effect on day one with higher doses being effective over approximately five days compared with PBS-treated ischemic control rats. The 12 and 20 mg/kg cumulative doses provided the best protective effect.
Dose and Time Optimization for siRNA Effect
Twelve mg/kg siP53 dose was selected for dose optimization and time course studies (Figure 5C). P53 siRNA was effective when administered between 16 h before the clamping and 8 h after removal of the clamp, with injections given at 2 and 4 h postinjury being most efficacious. Single 12 mg/kg dose at 2 and 4 h postinjury was more effective than the same dose administered in four injections spread over time (P = 0.01, ANOVA). siRNA administration 12 h post-ischemic injury or 24 h before the clamp were ineffective when compared with PBS-treated ischemic controls.
Next, dose-response studies for a single injection administered at the optimal 4-h time point were undertaken (Figure 5D). All doses were effective in reducing serum creatinine (P < 0.01), and 12 mg/kg siP53 dose administered at 4 h after clamp release was selected for further studies based on its efficacy and cost considerations. Treatment with control siGFP (12 mg/kg 4 h postinjury) produced no protective effect on serum creatinine. Also, serum creatinine remained at baseline for 9 wk following P53 siRNA therapy in an AKI clamp-injury model (data not shown).
siRNA to p53 Minimized Histologic Injury and Apoptosis
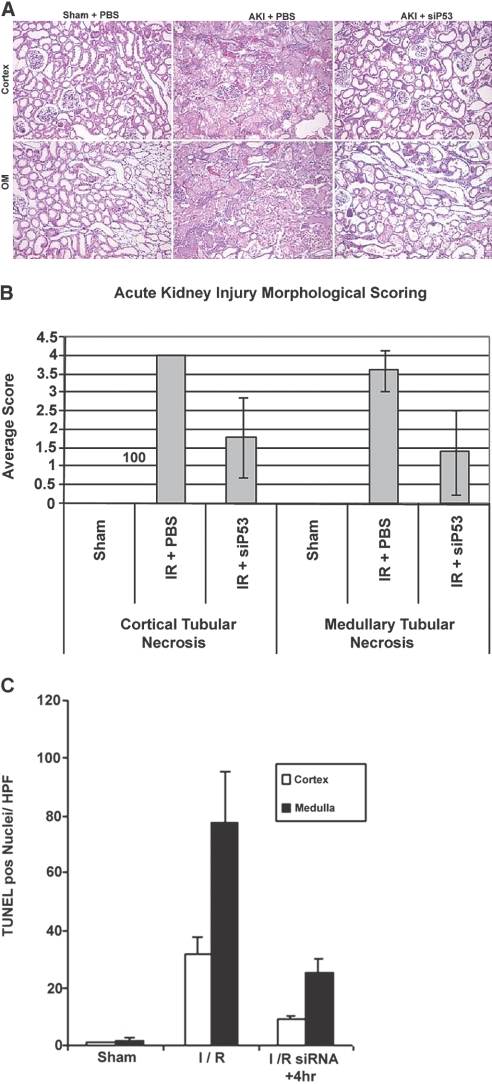
Semiquantitative histologic analysis was conducted on kidney specimens at 24 h postinjury to determine the effectiveness of siP53 on preservation of tissue integrity (Figure 6A). Although tubular damage was seen in all specimens, it was reduced in both cortical and outer medullary tissue (P < 0.05) with RNAi therapy (Figure 6, A and B). In the medullary region there was also increased microvascular congestion seen only in the PBS-treated ischemic kidneys.
Figure 6.
Effect of P53 siRNA (12 mg/kg) on histology and apoptosis at 24 h post-ischemic injury. (A) Representative images of H&E staining of cortical and outer medullary (OM) kidney sections from rats following sham renal ischemia surgery and bilateral renal 45 min clamp ischemia treated only with PBS or with p53 siRNA (siP53) at 4 h post clamp removal. (B) Incidence of tubular necrosis scores (for details, see Concise Methods) for both cortical and medullary kidney sections from rats subjected to 45 min renal-clamp injury. Difference in kidney necrosis incidence between siRNA and PBS-treated injured groups was statistically significant (P < 0.01 for both cortex and medulla, ANOVA). (C) Evaluation of siP53 influence on apoptosis in injured kidneys. Histogram shows the number of TUNEL positive cells per field of view in both cortical and outer medullary sections from kidneys obtained from rats subjected to 30-min renal clamp. Statistical significance was noted in both cortex and medulla (P < 0.01, ANOVA) compared with PBS treated ischemic rats (I/R). In all studies, data represent the mean ± SD for n = 6 for all studies.
We used a quantitative TUNEL assay to determine the effect of inhibiting p53 expression on epithelial cell apoptosis in a thirty-minute bilateral clamp model. Figure 6C shows siP53 administration resulted in a statistically significant reduction (P < 0.01) in TUNEL-positive nuclei in both cortical and medullary tissue. The increased amount of apoptosis in the outer medulla, compared with the cortex, is in agreement with previous studies.29
siP53 Reduced Ischemia-Induced Upregulation of P53
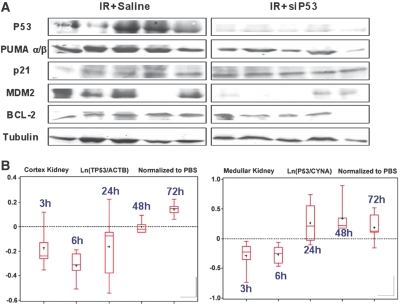
P53 protein levels in PTCs are very low under baseline physiologic conditions and increase significantly following ischemic injury beginning at 2 to 4 h peaking at 24 h postinjury.23 Therefore, kidney tissues were harvested at 24 h postinjury to evaluate the effect of the p53 siRNA on maximal p53 protein expression following ischemic injury. P53 protein was not detectable in noninjured kidneys by Western blotting (not shown). However, 24 h following injury, p53 protein was readily detectable in kidneys from ischemic animals but not from those receiving 12 mg/kg siP53 4 h after reperfusion initiation (Figure 7A). There was also a diminution in expression of p53-responsive pro-apoptotic gene PUMA as previously reported30 and another p53-dependent gene, MDM2.31 In contrast, siP53 treatment did not affect P21 protein expression induced by ischemia-reperfusion injury. Although p21 is considered a classical p53-dependent transcription target, its upregulation in ischemic kidney injury has previously been shown to be hypoxia- but not p53-dependent.32 Moreover, hypoxic induction of p21 was demonstrated to have a positive effect on the injury outcome.33 Similar independence on p53 inhibition by siRNA was detected for one additional p53-dependent, pro-apoptotic, protein NOXA (not shown) that, like p21, loses p53 dependence under hypoxic conditions.34 The observation of similar upregulation of the hypoxia-dependent proteins P21 and NOXA in nontreated ischemic and siP53-treated rats suggests an equivalent extent of injury-inducing stimuli was applied in treated and control groups. Among other proteins tested, the anti-apoptotic protein BCL2 and tubulin, used as loading control, did not show fluctuation in expression levels either in response to injury or in response to siP53.
Figure 7.
Intravenous P53 siRNA minimizes renal P53 protein increase after ischemia-reperfusion injury via reduction of p53 mRNA expression. (A) Western blot analysis of expression of P53 and P53-dependent and P53-independent proteins in kidney extracts obtained 24 h post-ischemic-reperfusion injury with or without siP53 treatment at 4 h postinjury. Each lane represents the results from an individual rat. Tubulin served as the application control. (B**)** Reduction of baseline p53 mRNA levels in renal cortex and medulla following intravenous administration of 12 mg/kg siP53 to nonoperated rats. P53 mRNA and reference genes levels were evaluated by qRT-PCR in each individual animal. Five groups of rats, each containing six animals, were injected with a single 12 mg/kg bolus IV dose of siP53 in 140 μl PBS. The animals were sacrificed at 3, 6, 24, 48, or 72 h after siRNA administration. Ten control rats received 140 μl PBS and were sacrificed at 3 or 6 h (six and four rats, respectively) after injection. Box-plot diagrams (SAS package) show distributions of natural logarithms of the ratios between p53 and reference genes mRNA expression levels [Ln(p53/ reference gene)]. The ratios for siP53-treated animals are normalized to corresponding ratios obtained for PBS-treated animals. Dashed represents baseline p53 mRNA expression levels. Only qRT-PCR results that passed quality control standards (i.e., slope of the calibration curve was in the interval [−4, −3], R2 >0.99, no extrapolation from the calibration curve and no primer dimmers).
To discriminate whether the observed inhibition of p53 protein expression in siP53-treated rats 24 h after injury was a consequence of reduced injury or a result of siRNA-mediated inhibition of expression, we analyzed p53 mRNA expression in kidneys following intravenous siRNA administration. As shown in Figure 7B, siRNA-mediated reduction of p53 mRNA levels was detected at 3 and 6 h after siRNA administration and returned to baseline levels between 24 and 48 h or between 6 and 24 h post IV injection in the cortex and medulla, respectively. The apparent partial reduction of p53 mRNA observed in the kidney may be explained by masking effects derived from p53 mRNA originating from multiple kidney cell types that were not targeted by siRNA due to its selective uptake by PTCs.
siP53 Minimizes Hypoperfusion-Induced and Cisplatin Nephrotoxicity
To determine if inhibiting P53 protein expression is effective in other models of PTC injury, where P53 has been implicated as an important apoptotic factor,35,36 we tested a hypoperfusion/ischemia model and a cisplatin model of kidney injury. The results, as shown in Figure 8, indicate that P53 siRNA minimized renal injury in both of these additional models. The partial aortic-clamp model was recently characterized as a model more in line with reduced kidney perfusion as might occur during cardiac bypass surgery.37 The cisplatin model was characterized with daily detection of serum creatinine levels postdrug injection (Figure 8B, top). This model is a progressive kidney injury model known to be secondary to apoptosis-mediated cell injury. There was a progressive increase in serum creatinine over the first five days following an intraperitoneal injection of cisplatin. In agreement with the limited duration of siP53-mediated gene knockdown in kidneys (see Figure 8B), renal protection evaluated 5 d following cisplatin administration was dependent upon multiple daily doses of the siRNA. Specifically, preservation of kidney function was only observed in animals that received doses of siRNA over the course of the first three days following cisplatin administration (groups 4 and 5), whereas animals that received a single dose siRNA around the time of cisplatin administration exhibited no protection (groups 2 and 3). siRNA against GFP was without effect in minimizing cisplatin-induced AKI (data not shown). Taken together, these data indicate that siRNA designed to inhibit expression of P53 is effective in minimizing AKI in chemotoxic and ischemic models where P53 is known to be an important regulator of apoptosis in PTC.
Figure 8.
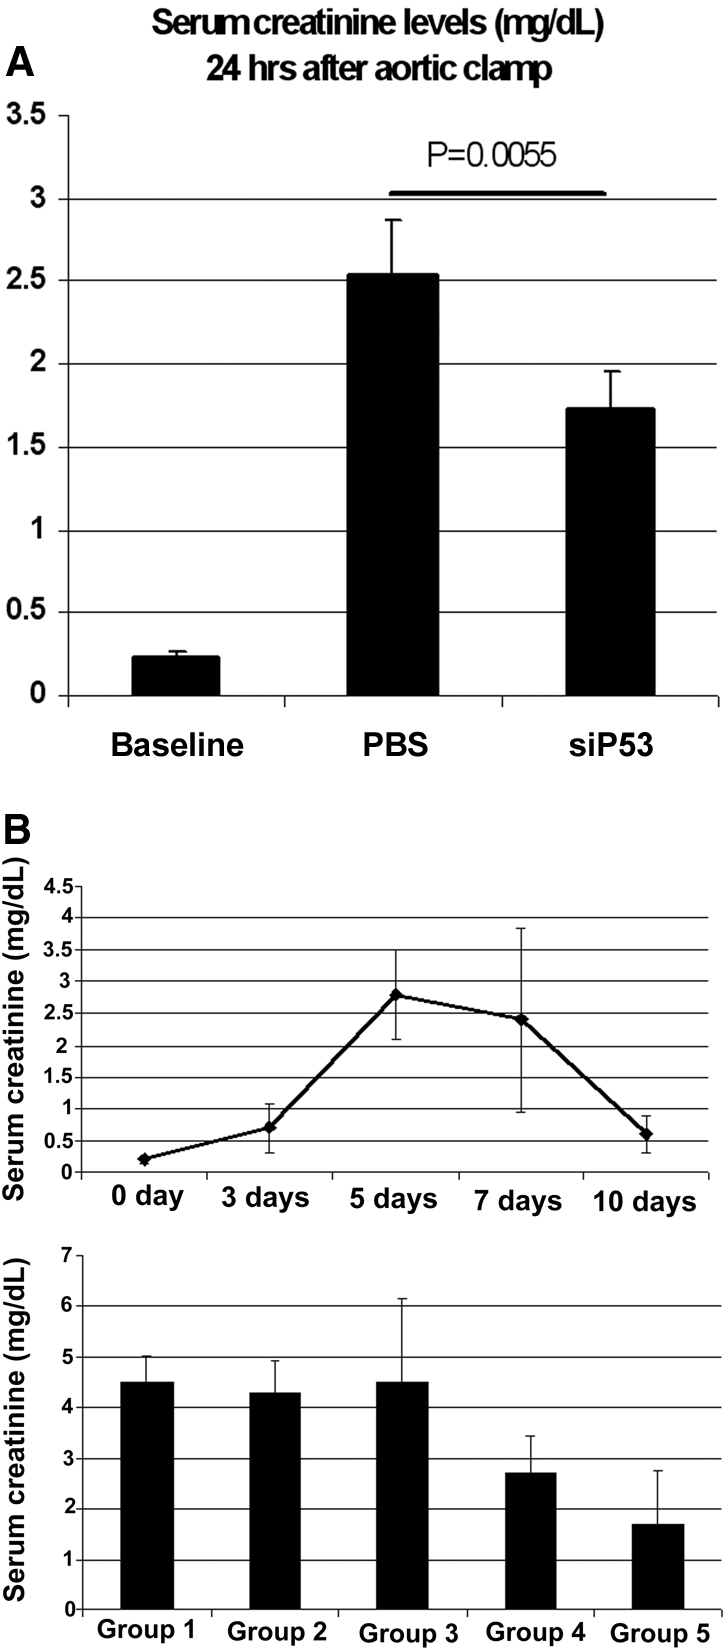
P53 inhibition minimizes functional AKI in hypoperfusion-induced and cisplatin nephrotoxicity models. (A) Serum creatinine levels in rats 24 h after partial aortic clamp. P53 siRNA was given IV 4 h after a 60 min 90% suprarenal aortic clamp. Serum creatinine levels were significantly lower in siP53-treated group compared with control (P = 0.0055; unpaired t test). Data represent the mean ± SD. (B) Daily serum creatinine levels following single intraperitoneal 7.5 mg/kg cisplatin injection. Lower panel. Efficacy of siP53 in cisplatin-induced kidney injury model. Serum creatinine levels were measured on day five after single intraperitoneal cisplatin (7.5 mg/kg) administration. Groups 1 to 5 received: (1) PBS IV injection 4 h after cisplatin administration, (2) single P53 siRNA (12mg/kg) IV injection 30 min before cisplatin administration, (3) single P53 siRNA (12 mg/kg) IV injection 4 h after cisplatin administration, (4) three P53 siRNA (12 mg/kg each) IV injections 30 min before and on days two and three after cisplatin administration, and (5) three P53 siRNA (12 mg/kg each) IV injections 4 h and on days two and three after cisplatin administration. Groups 4 and 5 showed significant reduction of serum creatinine levels compared with control (P < 0.001, ANOVA). Data represent the mean ± SD. n = 6 for all groups in all studies.
Discussion
The results from our studies support the therapeutic potential of the temporary inhibition of p53 expression to protect cells from acute injury, and demonstrate that synthetic siRNAs represent an effective means for eliciting such activity in the kidney following intravenous administration.
Effective therapeutic use of siRNA depends on the ability to specifically suppress expression of target proteins contributing to the progression of injury or disease. However, it is essential that RNAi be activated in the specific cell type at the optimal time. We show here that the kidney, and in particular the proximal tubule epithelium, is a uniquely favorable target for synthetic siRNA accumulation following intravenous administration. Furthermore, siRNA targeting p53 was effective at suppressing the expression of p53 in these cells following ischemia-reperfusion and in limiting the resulting kidney injury. Effective siRNA delivery and therapeutic efficacy were achieved without the need for either local delivery into renal vessels, systemic hydrodynamic administration as attempted before,38 or complicated formulation with delivery-enhancing agents.
The use of intravital 2-photon fluorescence imaging, with the confirmation by in situ siRNA detection using hybridization, provides insight into the spatial and temporal distribution of the siRNA. We show this technique affords the spatial resolution to precisely localize the siRNA to specific cell types (Figure 1), and the distribution of labeled siRNA in the kidney could be followed in the same animal over a time scale (Figure 1), giving information about the rate of metabolism of the siRNA. In a previous study,17 siRNA was found by scintigraphy to be concentrated in the kidney to levels 40-fold higher than other organs. However, this study lacked the spatial and temporal resolution for a more mechanistic understanding of this observation and used unmodified oligonucleotides with a phosphodiester backbone, which are rapidly degraded by plasma ribonucleases.39 Oligonucleotides used in this present study were modified by 2′-_O_-methylation, which effectively stabilized them against plasma endonucleases, while preserving their ability to trigger the RNAi silencing machinery. Oligonucleotides with this stabilizing modification have a relatively low affinity for albumin and other plasma proteins40, thus diminishing their distribution to the liver and facilitating renal clearance/uptake.
Several aspects of the data presented here enhance the potential clinical application of siRNA for kidney-related processes. First, the kidney and, in particular, the PTC are overwhelmingly the primary site of tissue distribution following intravenous injection. Second, the rapid clearance from the body minimizes exposure of other organs/cells. Third, the optimum administration time of approximately 4 h after the initiation of reperfusion injury could enable both prophylactic treatment and rapid treatment after a diagnosis of AKI has been made. Finally, the observed short duration of effect of siRNA in the kidney is favorable for molecular targets such as p53 where long-term inhibition of expression may pose a safety risk due to the cancer surveillance functions of this protein. Indeed, siRNA-mediated reduction of p53 mRNA lasted no longer than 72 h. Previous studies have demonstrated that short-term inhibition of p53 with subsequent restoration of its normal function is safe even from the standpoint of potentially increased carcinogenicity known to be associated only with complete and permanent p53 loss.41–43
Altogether, the above observations indicate that synthetic siRNAs represent a very favorable strategy to achieve short-term inhibition of p53 expression in PTC to protect against ischemic and nephrotoxic kidney injury.
These results offer further insight into the utilization of siRNA for modulating proximal tubular cell events with particular emphasis on the inhibition of upregulation and amplification of potentially harmful intracellular pathways.
Concise Methods
Animals
Male Sprague-Dawley (SD) or Munich Wistar (MW) 200–250g rats were used for all studies and cared for as described previously.44 All protocols were approved by the Indiana University IACUC committee.
siRNA Sequences, Modifications and in vitro Activity Evaluation
All siRNA molecules used in this study were stabilized by alternating 2′O-methylation as described previously45 and were synthesized at BioSpring (Frankfurt, Germany). siRNA used for in situ hybridization studies had sequence 5′- GUGCCAACCUGAUGCAGCU-3′ (sense strand). siRNAagainst GFP was as described previously.38 Active siRNA against p53 used in the in vivo studies had sequence 5′- GAAGAAAATTTCCGCAAAA-3′ (sense). Efficacy of siRNAs targeting p53 was tested in Rat1 cells expressing endogenous p53 gene. Transfection of siRNA was performed using Lipofectamine2000 (Invitrogen, CA) according to the manufacturer's instructions. p53 knockdown was determined either by immunoblotting with anti-p53 antibodies (Clone 240, Chemicon or OncogeneScience) or by quantitative real-time RT-PCR (see below).
Quantitative Real-Time PCR for Determining p53 mRNA Levels
RNA was extracted from cells or tissues using EZ-RNA extraction kit (Biologic Industries, Beth HaEmek, Israel). Following cDNA synthesis (Superscript reverse transcriptase, Invitrogen), p53mRNA levels were evaluated using the SYBR Green procedure on an Applied Biosystems 7300 PCR machine. p53 mRNA levels were extrapolated from the standard curve generated by the amplification of serially diluted DNA standards of known concentrations of p53 amplicon. The measured p53 mRNA levels were corrected for errors arising from differences in sample preparation and reverse transcription efficiencies using the expression levels of housekeeping reference genes as internal standards, β-actin and/or cyclophilin A mRNA. The following primers were used for RT-PCR amplification:
- rat p53 forward primer – 5′-ACAGCGTGGTGGTACCGTAT-3′
- rat p53 reverse primer – 5′- GGAGCTGTTGCACATGTACT- 3′
- rat β-actin forward primer – 5′-AGAGCTATGAGCTGCCTGAC-3′
- rat β–actin reverse primer – 5′-AATTGAATGTAGTTTCATGGATG-3′
- rat cyclophilin A forward primer 5′- CGACTGTGGACAGCTCTAAT-3′
- cyclophilin A reverse primer - 5′-CCTGAGCTACAGAAGGAATG-3′
PCR conditions were as follows: Step1 −50 °C 2 min; Step 2 to 95 °C 10 min; Step 3 (X40) −95 °C 15 s followed by 60 °C 1 min; Step 4 (dissociation) was according to default “Dissociation Function” settings programmed in the real-time PCR machine- ABI-7300.
Kidney injury models.
Bilateral renal pedicle clamp for 45 min at 37° or the partial aortic clamp procedures were performed as described previously to induce AKI.37,44 For the partial aortic-clamp model, the abdominal aorta just below the renal arteries was isolated through blunt dissection from the inferior vena cava, and an ultrasonic probe (2.0 mm diameter, Transit Time Perivascular Flowmeter TS420, Transonic Systems, Inc., Ithaca, NY) was placed and secured for precise determination of aortic flow. The aortic clamp itself comprised two 4 mm length polyethylene tubing (PE-100, 0.86 mm diameter, Clay Adams Co, Parsippany, NJ), one around the aorta and the second piece to exert variable tension via a 10 inch 3.0 silk suture. A 90% reduction of initial aortic blood flow rate was induced and measured on the ultrasonic probe reader for duration of 60 min. A 0.15 ml venous blood sample was drawn at study initiation for baseline creatinine measurement and at 24 h postsurgery for functional evaluation of severity of kidney injury. Serum creatinine concentrations were measured on a Creatinine Analyzer 2 from Beckman Inc. Unless otherwise noted, studies were terminated 24 h postsurgery, and the rats were euthanized by pentobarbital overdose followed by cervical dislocation.
To induce cisplatin injury, we utilized 7.5 mg/Kg given intraperitoneally to fasting rats. Cisplatin was freshly prepared in sterile saline at 1 mg/ml and injected; control animals were injected with a comparable volume of saline. Intravenous injections of normal saline, PBS, or siRNA in either of these vehicles were made in volumes of 0.3 ml or less over 1 to 3 min via either the femoral or jugular veins. In all studies, the untreated controls or ischemic rats received vehicle injections identical in amount and timing as the siRNA-treated rats.
Tissue Handling, Fixation, and Histopathology
Following euthanasia, kidneys were harvested and sliced into two longitudinal parts. One part was fixed in 4% paraformaldehyde and processed for paraffin embedding followed by histologic assessment. The second part of each kidney was immediately, upon excision, divided into medulla and cortex portions and snap-frozen in liquid nitrogen. It was further used for protein and RNA extraction for immunoblotting and qPCR analysis of gene expression, respectively.
5 μm sections were prepared from paraffin-embedded renal samples and mounted on microscopic slides. Sections were stained with hematoxylin-eosin. Slides were randomly numbered to afford “blind” (in regard to treatment groups) evaluation. Three pathomorphological features were assessed separately in the renal cortex and medulla: tubular necrosis, tubular dilation, and presence of tubular “casts” (necrotic debris within the tubular lumen). Grading of pathologic changes was performed according to the following scoring system:
- Grade 0 – no pathologic changes
- Grade 1 - feature involves 1 to 10% of the area
- Grade 2 - feature involves 10 to 25% of the area
- Grade 3 - feature involves 25 to 75% of the area
- Grade 4 - feature involves more than 75% of the area
TUNEL Labeling to Quantify Apoptosis
Apoptosis in cortical or outer medullary samples was quantified utilizing techniques previously published from our laboratory.23,29 Tissue pieces from the fixed kidneys were preserved in 20% sucrose before 10-um frozen sections were obtained. Sections were stained with TUNEL reagent (Promega, Madison, WI) and DAPI for in situ apoptosis detection. In brief, 10-um frozen sections were treated with 20 μg/ml proteinase K and then incubated in a nucleotide mixture containing fluorescein-12-dUTP and TdT (terminal deoxynucleotidyl transferase). Positive controls were pretreated with 1 U/ml DNAse, and negative controls were incubated without TdT. TUNEL-positive nuclei were expressed as a percent of total nuclei (DAPI-positive) per field. Six to eight fields per section and three sections per kidney were examined in each experiment.29 Images were collected on a Zeiss LSM 510 confocal microscope and analyzed with Zeiss LSM software and MetaMorph (Universal Imaging Corporation).23,29
Protein Extraction and Immunoblotting Analysis
Frozen kidney samples were pulverized to a powder over liquid nitrogen and used for preparation of protein extracts in RIPA buffer (10 mM Tris-HCL pH 7.4, 150 Mm NaCl, 1% Triton x-100, 1% sodium deoxycholate, 0.1% SDS) containing protease inhibitors cocktail (_Roche, Cat_# 1 836 145). Two hundred μg of total protein from kidney medulla or cortex samples were fractioned by electrophoresis through 10% polyacrylamide/SDS gels. The following commercially available primary antibodies were used for immunoblotting analysis of p53 and other protein expression: anti-p53 mouse monoclonal antibodies (mAb240, Oncogene Science); anti-PUMA goat polyclonal antibody DO-20 (Santa Cruz Biotechnology); anti-MDM2 rabbit polyclonal antibody SMP14 (Santa Cruz Biotechnology), anti-p21 (waf1) rabbit polyclonal antibody C-19 (Santa Cruz Biotechnology); anti-BCL2 rabbit polyclonal antibody (Santa Cruz Biotechnology); and anti-α-Tubulin mouse monoclonal antibodies TUB-1A2 (Sigma). Corresponding secondary antibodies were purchased from Santa Cruz Biotechnology.
siRNA in situ Hybridization
The method was based on the procedure described by Nelson et al., 200646 with some modifications. Paraffin-embedded kidney sections were deparaffinized and processed. The hybridization probe was single-stranded oligonucleotide in which every third position had locked nucleotide (LNA). Its primary sequence corresponded to the sense strand of intravenously injected tracer siRNA duplex. Scrambled similarly modified sequence was used as a negative control. The oligonucleotide probes were labeled with digoxigenin. The slides were hybridized overnight at 48 °C in hybridization buffer containing 50% Formamide, 10% Dextran sulfate, 4xSSC, 1x Denhardt's Solution, 0.25mg/ml Salmon sperm DNA, 0.25mg/ml tRNA, and 20nM of single-stranded LNA-modified specific or scrambled hybridization probe. Following washing in 5XSSC (30 min) and 50% formamide/2XSSC (30 min), the slides were hybridized to anti-Dig antibodies (anti-Digoxigenin-AP, Roche, cat.11093274910). The antibodies were developed using standard procedures provided by the manufacturer.
Multiphoton Microscopy and Image Analysis
All multiphoton imaging was conducted as previously optimized and described.47 To study triply labeled samples, the fluorescence emissions were split into three channels centered at 605, 525, and 455 nm collected in separate photomultiplier tube detectors and displayed as pure red, green, and blue, respectively. Stacks were collected by 1 μm optical steps into the tissue to a maximal depth of 100 μm. Images and data-volumes were processed using Image J software (National Institutes of Health, MD, http://rsb.info.nih.gov/ij/), Metamorph Image Processing Software (Universal Imaging-Molecular Devices, PA), and Adobe Photoshop (Adobe, CA), as previously reported.48
Endosomal and Cytosolic Quantitation of Cy3-siRNA
Using Metamorph image processing software v6.1 (Molecular Dynamics, Sunnyvale, CA) a 32 × 32 median filter with a subsample ratio of 1 was applied to the original image to generate a blurred image. This image was then subtracted from the original image to leave only the bright endosomal staining pattern. We used a default region size of 480 × 480 in the center of the image. Next, the center area is thresholded so that only the bright endosomes, and no surrounding background values are highlighted. The total integrated fluorescence values should be saved for quantitative analysis.
Cytosolic Analysis
Using Metamorph software, a background level was determined by selecting a small region devoid of tissue or fluorescence before siRNA infusion and the average intensity noted. Next a 32 × 32 medial filter (as in the endosomal analysis) was applied to the original image. The median filtered image was then subtracted from the original image (raw-media). Next the resultant image was thresholded to select gray scale values roughly between 35 to 255 in the “inclusive” mode, ensuring the cytosolic portion was not selected (adjust accordingly); next we selected the “exclusive” mode and clipped the data to create an 8-bit binary mask with values of either 0 or 255 (black or white, respectively). We then divided the binary mask by 255 to generate a mask with values of 1s and 0s. To the original image, we subtracted the average background value originally obtained. Next, we multiplied this image by the mask with the values of 1s and 0s; the resulting image should have a 16 pixel edge around the image that should not be quantified. Using a default region size of 480 × 480 in the center of the image avoids a 32 pixel edge around the image. Finally, we thresholded the center area of the image so that only the tissue and no surrounding background values were highlighted. The total integrated fluorescence values were saved for quantitative analysis. Both processes are best visualized when using a pseudocolor palette to aid in discrimination of low-intensity gray scale values.
Statistical Analysis
Analytical data and graphs depicting data from quantitative analysis of Cy3-siRNA studies were generated using Microsoft Excel (Microsoft, Redmond, WA). Values are reported as mean ± standard error.
Disclosures
Dr. Molitoris receives grant funding and is on a MAB for Quark Pharmaceuticals.
Acknowledgments
This work was made possible by a grant from Quark Pharmaceuticals and funding from the National Institutes of Health Grants P30-DK079312 and R01-DK069408, and an INGEN (Indiana Genomics Initiative) grant from the Lilly Foundation to Indiana University School of Medicine. We would like to thank the members of Quark's Cell Biology, Molecular Biology, and Histopathology groups for excellent technical assistance and Daniel Rothenstein for help with statistical analysis of the data.
Footnotes
Published online ahead of print. Publication date available at www.jasn.org.
References
- 1.Hoste EA, Clermont G, Kersten A, Venkataraman R, Angus DC, De Bacquer D, Kellum JA: RIFLE criteria for acute kidney injury are associated with hospital mortality in critically ill patients: A cohort analysis. Crit Care 10: R73, 2006 [DOI] [PMC free article] [PubMed] [Google Scholar]
- 2.Ishani A, Xue J, Himmelfarb J, Eggers P, Kimmel P, Molitoris B, Collins A: Development of end stage renal disease among elderly americans with acute kidney injury. JASN 2008, in press [Google Scholar]
- 3.Chertow GM, Soroko SH, Paganini EP, Cho KC, Himmelfarb J, Ikizler TA, Mehta RL: Mortality after acute renal failure: Models for prognostic stratification and risk adjustment. Kidney Int 70: 1120–1126, 2006 [DOI] [PubMed] [Google Scholar]
- 4.Hsu Cy, McCulloch CE, Fan D, Ordonez JD, Chertow GM, Go AS: Community-based incidence of acute renal failure. Kidney Int 72: 208–212, 2007 [DOI] [PMC free article] [PubMed] [Google Scholar]
- 5.Xue JL, Daniels F, Star RA, Kimmel PL, Eggers PW, Molitoris BA, Himmelfarb J, Collins AJ: Incidence and mortality of acute renal failure in Medicare beneficiaries, 1992 to 2001. J Am Soc Nephrol 17: 1135–1142, 2006 [DOI] [PubMed] [Google Scholar]
- 6.Xue JL, Eggers PW, Agodoa LY, Foley RN, Collins AJ: Longitudinal study of racial and ethnic differences in developing end-stage renal disease among aged Medicare beneficiaries. J Am Soc Nephrol 18: 1299–1306, 2007 [DOI] [PubMed] [Google Scholar]
- 7.Bonegio R, Lieberthal W: Role of apoptosis in the pathogenesis of acute renal failure. Curr Opin Nephrol Hypertens 11: 301–308, 2002 [DOI] [PubMed] [Google Scholar]
- 8.Cunningham PN, Dyanov HM, Park P, Wang J, Newell KA, Quigg RJ: Acute renal failure in endotoxemia is caused by TNF acting directly on TNF receptor-1 in kidney. J Immunol 168: 5817–5823, 2002 [DOI] [PubMed] [Google Scholar]
- 9.Daemen MA, van 't Veer C, Denecker G, Heemskerk VH, Wolfs TG, Clauss M, Vandenabeele P, Buurman WA: Inhibition of apoptosis induced by ischemia-reperfusion prevents inflammation. J Clin Invest 104: 541–549, 1999 [DOI] [PMC free article] [PubMed] [Google Scholar]
- 10.Kelly KJ, Plotkin Z, Dagher PC: Guanosine supplementation reduces apoptosis and protects renal function in the setting of ischemic injury. J Clin Invest 108: 1291–1298, 2001 [DOI] [PMC free article] [PubMed] [Google Scholar]
- 11.Hengartner MO: The biochemistry of apoptosis. Nature 407: 770–776, 2000 [DOI] [PubMed] [Google Scholar]
- 12.Ashkenazi A, Dixit VM: Death receptors: Signaling and modulation. Science 281: 1305–1308, 1998 [DOI] [PubMed] [Google Scholar]
- 13.Green DR, Kroemer G: The pathophysiology of mitochondrial cell death. Science 305: 626–629, 2004 [DOI] [PubMed] [Google Scholar]
- 14.Bennett M, Macdonald K, Chan SW, Luzio JP, Simari R, Weissberg P: Cell surface trafficking of Fas: A rapid mechanism of p53-mediated apoptosis. Science 282: 290–293, 1998 [DOI] [PubMed] [Google Scholar]
- 15.Wei Q, Yin XM, Wang MH, Dong Z: Bid deficiency ameliorates ischemic renal failure and delays animal death in C57BL/6 mice. Am J Physiol Renal Physiol 290: F35–F42, 2006 [DOI] [PubMed] [Google Scholar]
- 16.Masarjian L, de Peyster A, Levin AA, Monteith DK: Distribution and excretion of a phosphorothioate oligonucleotide in rats with experimentally induced renal injury. Oligonucleotides 14: 299–310, 2004 [DOI] [PubMed] [Google Scholar]
- 17.van de Water FM, Boerman OC, Wouterse AC, Peters JG, Russel FG, Masereeuw R: Intravenously administered short interfering RNA accumulates in the kidney and selectively suppresses gene function in renal proximal tubules. Drug Metab Dispos 34: 1393–1397, 2006 [DOI] [PubMed] [Google Scholar]
- 18.Cheng QL, Chen XM, Li F, Lin HL, Ye YZ, Fu B: Effects of ICAM-1 antisense oligonucleotide on the tubulointerstitium in mice with unilateral ureteral obstruction. Kidney Int 57: 183–190, 2000 [DOI] [PubMed] [Google Scholar]
- 19.Zhang X, Zheng X, Sun H, Feng B, Chen G, Vladau C, Li M, Chen D, Suzuki M, Min L, Liu W, Garcia B, Zhong R, Min WP: Prevention of renal ischemic injury by silencing the expression of renal caspase 3 and caspase 8. Transplantation 82: 1728–1732, 2006 [DOI] [PubMed] [Google Scholar]
- 20.Zheng X, Zhang X, Feng B, Sun H, Suzuki M, Ichim T, Kubo N, Wong A, Min LR, Budohn ME, Garcia B, Jevnikar AM, Min WP: Gene silencing of complement C5a receptor using siRNA for preventing ischemia/reperfusion injury. Am J Pathol 173: 973–980, 2008 [DOI] [PMC free article] [PubMed] [Google Scholar]
- 21.Dagher PC: Modeling ischemia in vitro: Selective depletion of adenine and guanine nucleotide pools. Am J Physiol Cell Physiol 279: C1270–C1277, 2000 [DOI] [PubMed] [Google Scholar]
- 22.Halterman MW, Federoff HJ: HIF-1alpha and p53 promote hypoxia-induced delayed neuronal death in models of CNS ischemia. Exp Neurol 159: 65–72, 1999 [DOI] [PubMed] [Google Scholar]
- 23.Kelly KJ, Plotkin Z, Vulgamott SL, Dagher PC: P53 mediates the apoptotic response to GTP depletion after renal ischemia-reperfusion: Protective role of a p53 inhibitor. J Am Soc Nephrol 14: 128–138, 2003 [DOI] [PubMed] [Google Scholar]
- 24.Chipuk JE, Bouchier-Hayes L, Kuwana T, Newmeyer DD, Green DR: PUMA couples the nuclear and cytoplasmic proapoptotic function of p53. Science 309: 1732–1735, 2005 [DOI] [PubMed] [Google Scholar]
- 25.Chipuk JE, Kuwana T, Bouchier-Hayes L, Droin NM, Newmeyer DD, Schuler M, Green DR: Direct activation of Bax by p53 mediates mitochondrial membrane permeabilization and apoptosis. Science 303: 1010–1014, 2004 [DOI] [PubMed] [Google Scholar]
- 26.Gudkov AV, Komarova EA: Prospective therapeutic applications of p53 inhibitors. Biochem Biophys Res Commun 331: 726–736, 2005 [DOI] [PubMed] [Google Scholar]
- 27.Michalak E, Villunger A, Erlacher M, Strasser A: Death squads enlisted by the tumour suppressor p53. Biochem Biophys Res Commun 331: 786–798, 2005 [DOI] [PubMed] [Google Scholar]
- 28.Mihara M, Erster S, Zaika A, Petrenko O, Chittenden T, Pancoska P, Moll UM: p53 has a direct apoptogenic role at the mitochondria. Mol Cell 11: 577–590, 2003 [DOI] [PubMed] [Google Scholar]
- 29.Kelly KJ, Sandoval RM, Dunn KW, Molitoris BA, Dagher PC: A novel method to determine specificity and sensitivity of the TUNEL reaction in the quantitation of apoptosis. Am J Physiol Cell Physiol 284: C1309–C1318, 2003 [DOI] [PubMed] [Google Scholar]
- 30.Jiang M, Wei Q, Wang J, Du Q, Yu J, Zhang L, Dong Z: Regulation of PUMA-alpha by p53 in cisplatin-induced renal cell apoptosis. Oncogene 25: 4056–4066, 2006 [DOI] [PubMed] [Google Scholar]
- 31.Juven T, Barak Y, Zauberman A, George DL, Oren M: Wild type p53 can mediate sequence-specific transactivation of an internal promoter within the mdm2 gene. Oncogene 8: 3411–3416, 1993 [PubMed] [Google Scholar]
- 32.Megyesi J, Udvarhelyi N, Safirstein RL, Price PM: The p53-independent activation of transcription of p21 WAF1/CIP1/SDI1 after acute renal failure. Am J Physiol 271: F1211–F1216, 1996 [DOI] [PubMed] [Google Scholar]
- 33.Megyesi J, Andrade L, Vieira JM, Jr., Safirstein RL, Price PM: Positive effect of the induction of p21WAF1/CIP1 on the course of ischemic acute renal failure. Kidney Int 60: 2164–2172, 2001 [DOI] [PubMed] [Google Scholar]
- 34.Kim JY, Ahn HJ, Ryu JH, Suk K, Park JH: BH3-only protein Noxa is a mediator of hypoxic cell death induced by hypoxia-inducible factor 1alpha. J Exp Med 199: 113–124, 2004 [DOI] [PMC free article] [PubMed] [Google Scholar]
- 35.Pabla N, Dong Z: Cisplatin nephrotoxicity: Mechanisms and renoprotective strategies. Kidney Int 73: 994–1007, 2008 [DOI] [PubMed] [Google Scholar]
- 36.Wei Q, Dong G, Yang T, Megyesi J, Price PM, Dong Z: Activation and involvement of p53 in cisplatin-induced nephrotoxicity. Am J Physiol Renal Physiol 293: F1282–F1291, 2007 [DOI] [PMC free article] [PubMed] [Google Scholar]
- 37.Sharfuddin AA, Sandoval RM, Berg DT, McDougal GE, Campos SB, Phillips CL, Grinnell BW, Molitoris BA: Soluble thrombomodulin ameliorates ischemic kidney injury in a rat hypoperfusion model. JASN 2008, in press [DOI] [PMC free article] [PubMed] [Google Scholar]
- 38.Hamar P, Song E, Kokeny G, Chen A, Ouyang N, Lieberman J: Small interfering RNA targeting Fas protects mice against renal ischemia-reperfusion injury. Proc Natl Acad Sci U S A 101: 14883–14888, 2004 [DOI] [PMC free article] [PubMed] [Google Scholar]
- 39.Geary RS, Leeds JM, Fitchett J, Burckin T, Truong L, Spainhour C, Creek M, Levin AA: Pharmacokinetics and metabolism in mice of a phosphorothioate oligonucleotide antisense inhibitor of C-raf-1 kinase expression. Drug Metab Dispos 25: 1272–1281, 1997 [PubMed] [Google Scholar]
- 40.Geary RS, Watanabe TA, Truong L, Freier S, Lesnik EA, Sioufi NB, Sasmor H, Manoharan M, Levin AA: Pharmacokinetic properties of 2′-O-(2-methoxyethyl)-modified oligonucleotide analogs in rats. J Pharmacol Exp Ther 296: 890–897, 2001 [PubMed] [Google Scholar]
- 41.Christophorou MA, Ringshausen I, Finch AJ, Swigart LB, Evan GI: The pathological response to DNA damage does not contribute to p53-mediated tumour suppression. Nature 443: 214–217, 2006 [DOI] [PubMed] [Google Scholar]
- 42.Efeyan A, Garcia-Cao I, Herranz D, Velasco-Miguel S, Serrano M: Tumour biology: Policing of oncogene activity by p53. Nature 443: 159, 2006 [DOI] [PubMed] [Google Scholar]
- 43.Komarov PG, Komarova EA, Kondratov RV, Christov-Tselkov K, Coon JS, Chernov MV, Gudkov AV: A chemical inhibitor of p53 that protects mice from the side effects of cancer therapy. Science 285: 1733–1737, 1999 [DOI] [PubMed] [Google Scholar]
- 44.Ashworth SL, Sandoval RM, Hosford M, Bamburg JR, Molitoris BA: Ischemic injury induces ADF relocalization to the apical domain of rat proximal tubule cells. Am J Physiol Renal Physiol 280: F886–F894, 2001 [DOI] [PubMed] [Google Scholar]
- 45.Czauderna F, Fechtner M, Dames S, Aygun H, Klippel A, Pronk GJ, Giese K, Kaufmann J: Structural variations and stabilising modifications of synthetic siRNAs in mammalian cells. Nucleic Acids Res 31: 2705–2716, 2003 [DOI] [PMC free article] [PubMed] [Google Scholar]
- 46.Nelson PT, Baldwin DA, Kloosterman WP, Kauppinen S, Plasterk RH, Mourelatos Z: RAKE and LNA-ISH reveal microRNA expression and localization in archival human brain. RNA 12: 187–191, 2006 [DOI] [PMC free article] [PubMed] [Google Scholar]
- 47.Dunn KW, Sandoval RM, Kelly KJ, Dagher PC, Tanner GA, Atkinson SJ, Bacallao RL, Molitoris BA: Functional studies of the kidney of living animals using multicolor two-photon microscopy. Am J Physiol Cell Physiol 283: C905–C916, 2002 [DOI] [PubMed] [Google Scholar]
- 48.Ashworth SL, Sandoval RM, Tanner GA, Molitoris BA: Two-photon microscopy: Visualization of kidney dynamics. Kidney Int 72: 416–421, 2007 [DOI] [PubMed] [Google Scholar]
