Carcinoma Associated Fibroblast Like Differentiation of Human Mesenchymal Stem Cells (original) (raw)
. Author manuscript; available in PMC: 2009 Aug 11.
Abstract
Carcinoma associated fibroblasts (CAFs) have recently been implicated in important aspects of epithelial solid tumor biology such as neoplastic progression, tumor growth, angiogenesis, and metastasis. However, neither the source of CAFs nor the differences between CAFs and fibroblasts from non-neoplastic tissue have been well defined. In this study we demonstrate that human bone marrow-derived mesenchymal stem cells (hMSCs) exposed to tumor-conditioned medium (TCM) over a prolonged period of time assume a CAF-like myofibroblastic phenotype. More importantly, these cells exhibit functional properties of CAFs including sustained expression of stromal derived factor 1 (SDF-1) and the ability to promote tumor cell growth both in vitro and in an in vivo co-implantation model and expression of myofibroblast markers including α-smooth muscle actin (α-SMA) and fibroblast surface protein (FSP). Human MSCs induced to differentiate to a myofibroblast-like phenotype using 5-azacytidine (5-aza) do not promote tumor cells growth as efficiently as hMSCs cultured in tumor-conditioned medium nor do they demonstrate increased SDF-1 expression. Furthermore, gene expression profiling revealed similarities between TCM exposed hMSCs and carcinoma associated fibroblasts. Taken together these data suggest that hMSCs are a source of carcinoma associated fibroblasts and can be used in the modeling of tumor-stroma interactions. To our knowledge this is the first report demonstrating that hMSCs become activated and resemble carcinoma associated myofibroblasts upon prolonged exposure to conditioned medium from MDAMB231 human breast cancer cells.
Keywords: Tumor microenvironment, SDF-1, myofibroblast, migration, differentiation
Introduction
Accumulating evidence suggests that tumor associated fibroblasts or carcinoma associated fibroblasts (CAFs) play an important role in the growth of epithelial solid tumors. It has long been known that a significant fraction of the stroma in some breast cancers consists of fibroblasts (1-3). More recent studies show that breast carcinoma associated fibroblasts promote tumor cell growth compared to fibroblasts obtained from non-neoplastic locations. In addition to tumor growth, the tumor stroma has also been implicated in other important processes such as neoplastic progression, angiogenesis, and metastasis. While the potential importance of CAFs is becoming clear, the differences between tumor fibroblasts and fibroblasts from non-neoplastic tissue are not well described. Orimo and colleagues defined several important characteristics of breast carcinoma associated fibroblasts including promotion of breast carcinoma cell growth, promotion of angiogenesis, and expression of myofibroblast traits (4). Expression of the chemokine stromal-derived factor 1 (SDF-1) has also been shown to be important in the interaction between tumor cells and stromal fibroblasts (4). Although the cell type of origin of myofibroblasts has not been conclusively established it has been shown that they are bone marrow derived (5-10). Data from animal models as well as human breast cancers suggest that at least a subset of tumor-associated myofibroblasts is derived from circulating bone marrow cells (5-9,11). Bone marrow origin of tumor associated fibroblasts gains further support from the observations in an EGFP transplant model showing two prominent populations of EGFP (+) cells were found in the tumor stroma (12). The first was determined to be fibroblasts within the tumor stromal capsule, a subset of which expressed type I collagen mRNA and α-SMA. The second population was a perivascular cell associated with the CD31 (+) tumor blood vessels. These findings suggested that some tumor associated fibroblasts are derived from hematopoietic precursor/stem cells from the bone marrow. An attractive candidate for the bone marrow precursor of tumor-associated fibroblast is the mesenchymal stem cell (MSC).
Two features of hMSCs suggest that they may be the precursors of the myofibroblasts found in the tumor stroma: a) MSCs develop characteristics of myofibroblasts such as expression of α- SMA under defined tissue culture conditions (13); b) MSCs isolated from the bone marrow and labeled ex-vivo localize to solid tumors after i.v. administration in animal models (8,14,15). During embryonic and fetal development, MSCs circulate in the bloodstream to seed emerging sites of hematopoiesis. They are present in large numbers in human blood for the first 12 weeks of gestation and circulating MSCs, albeit in low numbers, exist in the adult (16,17). A recent report suggests that circulating fibrocytes derived from bone marrow precursors are the cells of origin of myofibroblasts found at wound healing sites (10). Moreover, MSCs undergo myofibroblast differentiation including increased production of α-SMA in response to TGF-β, a growth factor commonly secreted by tumor cells to evade immune surveillance (18). These findings suggest that some tumor associated fibroblasts are derived from hematopoietic precursor/stem cells derived from the bone marrow. Hence hMSCs are an attractive candidate for the bone marrow precursor of carcinoma-associated fibroblast.
In this study we tested the effect of prolonged exposure (30days) to factors in conditioned medium produced by a human breast cancer cell line MDAMB231 on the phenotype of human bone marrow-derived mesenchymal stem cells. Our results demonstrate that hMSCs become activated upon prolonged exposure to conditioned medium (CM) from tumor cells. They exhibit myofibroblast differentiation characterized by higher expression of α-SMA, vimentin, FSP and sustained expression of SDF-1. Unlike 5-azacytidine treatment, hMSCs differentiated by exposure to CM show sustained expression of SDF-1 and can better support growth of MBAMB231 cells in vitro and in tumor xenografts in nude mice. We suggest that human bone marrow derived mesenchymal stromal (stem) cells (hMSCs) are induced by tumor-derived factors to differentiate into CAFs and become part of the tumor microenvironment.
Materials and Methods
Isolation and culture of human Mesenchymal Stem Cells
Unprocessed bone marrow (36×106 cells/ml) was purchased from Cambrex Bio Sciences Walkersville, Inc. A Ficoll gradient was used for isolation of hMSCs and to eliminate unwanted cell types from bone marrow. Cells were then plated in T75 cm2 and 6 well plate with Mesencult media containing hMSC stimulatory supplements and fetal bovine serum (FBS) for hMSCs or minimum essential media (α-MEM) containing 10% FBS and penicillin/streptomycin. The cultures were incubated at 37° C in a humidified atmosphere containing 5 % CO2. Cells were demipopulated after 24 hrs and the medium was changed every other day. Cells were subcultured every 4 to 5 days and aliquots from passage 2 to 5 were frozen in liquid nitrogen for future use. Cell surface markers expressed on these cells were determined by flow cytometry using FITC labeled Abs (BD Biosciences, San Jose, CA) and include Stro1, CD105, CD90, HLA-ABC and CD44 while they were negative for CD45, HLA-DR and CD11b (data not shown)
Multilineage differentiation
Expanded cultures of hMSCs were analyzed for myogenic, osteogenic and adipogenic differentiation in vitro to determine multipotency according to standard conditons as described before (19-23).
Tumor cell-lines
Cancer cell lines MDAMB231 (ATCC) PANC-1 and U87 were cultured in DMEM medium (GIBCO Life Sciences, Grand Island, NY) supplemented with 10% FBS and penicillin-streptomycin at 37°C in 5% CO2.
Exposure of hMSCs to tumor cell conditioned medium
MDAMB231, PANC-1 and U87 cells were grown in DMEM+10% heat inactivated FBS culture medium and conditioned medium (CM) from these tumor cells was harvested after 16 h centrifuged at 3000 rpm for 5 min and supernatant was passed through Millipore sterile 50 ml filtration system with 0.45 μm PVDF membrane. HMSCs were exposed to fresh tumor conditioned media (TCM) repeatedly and the TCM was changed every third day for the entire 30 day time period.
Migration assay
The migration assay was carried out as described previously (24). Briefly, Falcon tissue culture plates with 24 wells along with a companion Falcon cell culture inserts were used for the migration assay. CM from tumor cells (collected after overnight culture in fresh growth medium) or tumor cells (1×10⁴) were plated in the o bottom chamber and incubated overnight at 37° C, and 5% CO2. Next day, the insert was placed aseptically in the well with flanges resting in the notches on the top edge of each well. Naive hMSCs or activated hMSCs (2×10⁴) were plated on the top. The assay was terminated and hMSCs that had migrated through the membrane (8 μm pore size) were then stained (after removal of cells remaining on top with a wet Q-tip) using crystal violet prepared with methanol and formaldehyde.
Co-culture assay in vitro
Luciferase expressing MDAMB231 cells (MDA-luc) (50,000 cells/well) were plated in 1ml DMEM in 12 well plates. After 24 h hMSCs pre-exposed to tumor condition media for 1-30 days were added (25,000 cells/well). Controls used for this assay were MDA-luc cells alone (50,000 cells/well), MDA-Luc cells (50,000 cells/well) and after 24 hours MDAMB321 (untransfected) were added as adherent cell control (25,000 cells/well), hMSCs pre-exposed to DMEM media for 30 days (25,000 cells/well), and hMSCs differentiated to myogenic lineage by 5-aza (25,000 cells/well). After four days the cells were lysed in 80μl lysis buffer and luciferase measurements were carried out according to manufacturer's protocol and light units read in a luminometer.
QRT-PCR for SDF-1
SDF-1 and 18S (control) mRNA levels were examined by quantitative RT-PCR. Total RNA was isolated from the cell pellets using TRIzol reagent (Invitrogen, Carlsbad, California). QRT-PCR was conducted using the ABI Prism 7000 sequence detection system (Applied Biosystems, Foster City, CA). SDF-1 mRNA levels were determined for each hMSCs condition in four independent experiments and each quantitative RT-PCR was carried out in quadruplicate. Total RNA was isolated using RNeasy kit (Qiagen, USA). A pre-designed assay was used to carry out the reverse transcription (Applied Biosystems, CA). The reaction mixture was incubated at 50°C for 30 min for reverse transcription followed by a denaturation step at 94°C for 2 min. This was followed by 35 cycles of PCR amplification at 94°C for 15 sec, 55°C for 30sec and 72°C for 1 min. The final elongation step was carried out at 72°C for 7min. SDF-1 sense primer sequence: 5'-TTTGAGAGCCATGTCGCCA-3'. SDF-1 antisense primer sequence: 5'-TGTCTGTTGTTGCTTTTCAGCC-3'. Primers and probes for eukaryotic 18S rRNA, used as endogenous control, were commercially obtained (TaqMan pre-developed assay reagent). Levels of SDF-1 expression are reported as a ratio ΔCT of SDF-1 to 18S-RNA. The resultant CT value for naïve hMSCs was considered to be 100 percent and the relative changes in levels of SDF-1 mRNA are reported as percent changes from naïve hMSC levels.
Immunofluorescence analysis
The cells were plated on sterilized cover slips in 12 well plates. The cells were fixed in 4% paraformaldehyde (PFA) (at room temperature, 10 min), washed with PBS, blocked with 10% fetal bovine serum in a growth medium (alpha MEM) and then incubated with primary antibodies for 1 h at room temperature. Cells were immunostained for α-SMA (1:250, α-SMA; mouse monoclonal clone 1A4, A2547), FSP (1:250, FSP; mouse monoclonal clone 1B10, F4771) and Vimentin (1:200, clone VIM-13.2, V5255) (Sigma-Aldrich, St. Louis, MO). Secondary antibodies (1:400 in a blocking media) used were Alexa Fluor 488P (Ab')2, IgG (H+L) (Molecular Probes, Eugene, Oregon, USA) and anti-mouse IgM-FITC (Sigma-Aldrich, St Louis, MO). Following further washing the cells and were counterstained with the nuclear dye TOPRO-3 iodide (Invitrogen, Molecular probes) 1:1000 in phosphate buffered saline (Gibco, Grand Island, NY) at room temperature in the dark. Cells were embedded in Vecta Shield mounting medium with DAPI (Vector Laboratories, Burlingame, California) and examined with a fluorescence microscope. The naïve and differentiated hMSCs were quantitated for the expression of myofibroblast specific markers. Cells expressing high levels of markers with the nuclei stained with DAPI were counted in different exposures. Total cell number was obtained by counting the total number of DAPI stained nuclei under the microscope. Percentage of marker expressing cells to the total number of the cells was calculated.
Microarray analysis
Cells were harvested following exposure to CM and RNA was isolated using RNeasy mini kit (Qiagen, Valencia, CA). 5μg of total RNA was processed for micro array analysis following verification of quality at DNA micro array core facility of CINJ/RWJMS. Briefly, the RNA was reverse transcribed and hybridized to Affymetrix Gene Chip® Human Genome U133 Plus 2.0 array which is comprised of more than 54,000 probe sets and 1,300,000 distinct oligonucleotide features and analyzes the expression level of over 47,000 transcripts and variants, including 38,500 well-characterized human genes.
Three independent replicates for each of the experimental conditions were carried out and analyzed to control for intra sample variation. Data normalization was performed by applying the robust multi-array average (RMA) method implemented in the library affy of the Bioconductor system (www.bioconductor.org). Comparative analyses of expressed genes that were either down regulated or up regulated under various experimental conditions by greater than 1.5 fold [permutation p-value <0.05 and false discovery rate <0.25 for signal-to-noise ratio (SNR), all values expressed in log 2 was carried out using the GenePattern software available at the Broad Institute of Harvard and MIT (25 and www.broad.mit.edu/cancer/software/genepattern/). Pathway analysis was performed by applying the Gene Set Enrichment Analysis (GSEA) software (26 and www.broad.mit.edu/gsea/).
Xenograft studies in nude mice
A breast cancer cell line MDAMB231 was used as a model for the study. MDAMB231 cells were injected subcutaneously in of nude mice in five groups; 1) along with Matrigel (50μl per injection, BD Biosciences) to provide extracellular environment (10×106 cells/ mice); 2) along with TCM exposed hMSCs [MDAMB231: TCM exposed hMSCs (10×106: 2×10⁶at a ratio of 5:1); 3) along with 5-aza treated hMSCs [MDAMB231: 5-aza treated hMSCs (10×106: 2×10⁶at a ratio of 5:1)]; MDAMB 231 cells alone (10×106 cells/ mice) and 5) along with naïve hMSCs [MDAMB231: naive hMSCs (10×106: 2×10⁶at a ratio of 5:1)]. There were 5 animals in each of the group. All work with animals was carried out under the auspices of a protocol approved by the Institutional Animal Care and Use Committee at RWJMS. Day of inoculation of tumors in mice was considered as day 0.
Immunohistochemistry
Tumors were excised and immediately frozen in OCT (Sakura Finetek USA, Inc., Torrance, CA). Tissues were fixed for 24 h before processing through graded series of alcohols and embedded in paraffin wax. Thin sections (4microns) were cut and placed onto glass slides for staining. Antigen retrieval (removing aldehyde links formed during initial fixation of tissues) was performed for over 70 min at pH-8 using EDTA. Antibody staining using 100μl of antibody at a dilution of approx 1:1000 (anti-α-SMA) was applied to the slides and incubated at 37°C for 60 min. Primary antibodies were diluted with Dako-diluent (Dako, Carpinteria, CA). For fibroblast marker-staining 100μl of antibody at a dilution of 1:200 (anti-FSP) was applied to the slides and incubated at 37°C for 60 min. Tissue sections were rinsed in buffer. The diluted biotinylated secondary antibody was applied to the tissue sections and incubated for 12 min at 37°C. Hematoxylin was used as a tissue counterstain.
Statistical Analysis
For statistical analysis student's t-test with Benjamini false discovery rate (FDR) correction was used, p<0.05 was considered significant.
Results
Effect of TCM on hMSC migration
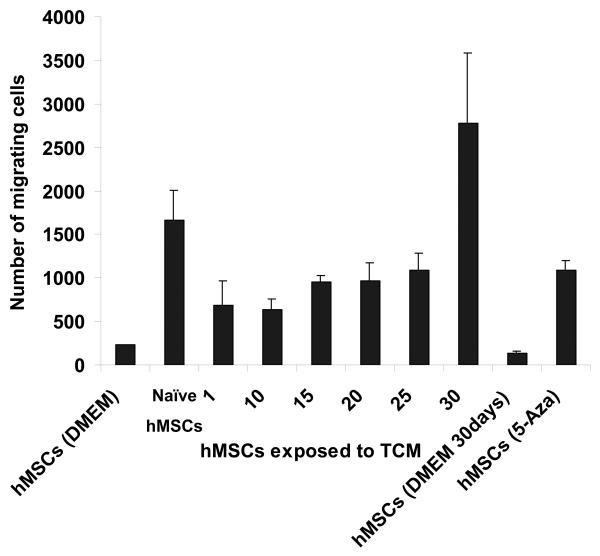
Human MSCs were either mock treated, or exposed to TCM from MDAMB231 human breast cancer cells for up to 30 days, and then assayed for their ability to migrate toward tumor cells in a transwell chamber migration assay. The 30day-exposed hMSCs were found to migrate toward tumor cells in greater numbers than cells exposed to control medium or hMSCs exposed to TCM for shorter periods up to 25 days (Fig. 1_A_). Thus, prolonged exposure to secreted factors from tumor cells may “prime” hMSCs to respond to the presence of tumor cells in this assay.
Figure 1.
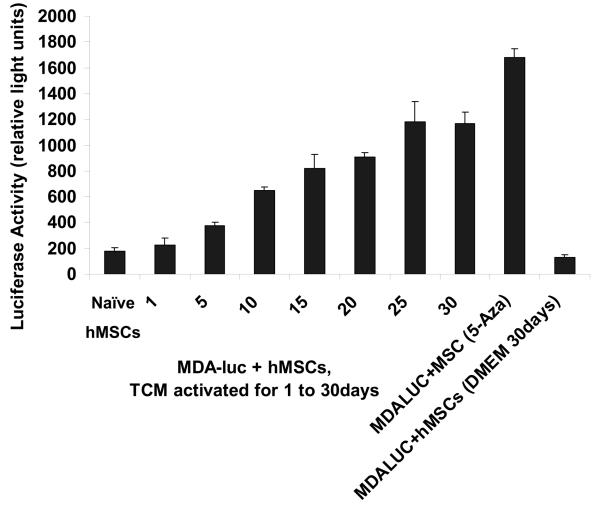
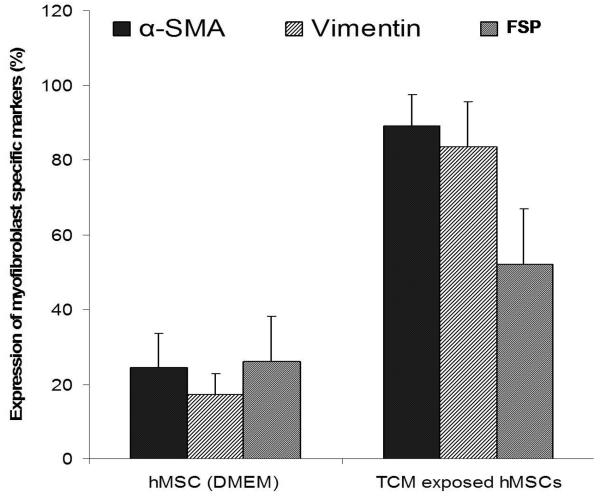
30d TCM exposed hMSCs migrate towards and support the growth of tumor cells and express markers for myofibroblast lineage. A, Figure shows increased number of 30d TCM exposed hMSCs migrating toward the MDAMB231 cells placed at the bottom of the transwell chamber as compared with naïve MSCs or the 5-aza treated cells. Interestingly, hMSCs exposed to TCM for periods up to 25 days did not show an increase in number of migrating cells as compared to the number of migrating naïve hMSCs. Migration of 30d TCM exposed cells were significantly increased as compared naïve hMSCs (p=0.003) as well as to all other cell types (p<0.005). B, Increase in luciferase activity reflects growth of MBA-luc cells in a mixed culture assay. Luciferase activity was measured to determine growth of MDA-luc cells in the coculture assay. 5-aza treated hMSCs promote growth of MDAMB231 human breast cancer cells in vitro as compared to naïve hMSCs. 1 and 5d TCM-exposed hMSCs do not increase growth of MDAMB231 cells. A significant increase is observed with d10-d20 TCM hMSCs and an additional increase is seen with d25 & d30 TCM exposed hMSCs. C, The quantitative expression of myofibroblast marker proteins α-SMA, FSP and vimentin in naïve hMSCs and 30d breast cancer TCM activated hMSCs were analyzed by immunofluorescence staining (see methods for details).
Effect on tumor cell growth in vitro
MDMBA231-luciferase cells (here after MDA-Luc) were grown alone or co-cultured with either naïve hMSCs, or hMSCs exposed to TCM for 5, 10, 15, 20 or 30 days, and tumor cell growth was assayed as described. The effect of admixed hMSCs on the growth of MDMBA231 cells was assayed. Naïve hMSCs, 5-aza treated hMSCs, or hMSCs exposed to TCM for up to 30 days were admixed with a fixed number of luciferase-expressing MDAMB231 cells. After 96 hours, luciferase activity was measured as a marker of cell growth of MDAMB231 cells in these mixed cultures (Fig. 1_B_). Increasing exposure to TCM led to increasing cell growth of MDAMB231 cells by this assay. Compared to naïve hMSCs, an increase in luciferase activity (growth of MDAMB231 cells) was significant for both 5-aza treated hMSCs (p=0.00001) and 30d TCM treated hMSCs (p=0.0001) while there was no significant change between naïve hMSCs and DMEM exposed hMSCs (p=0.119).
Activation of hMSCs by TCM from breast, glioma and pancreatic cancers ; expression of markers specific to myofibrobast lineage
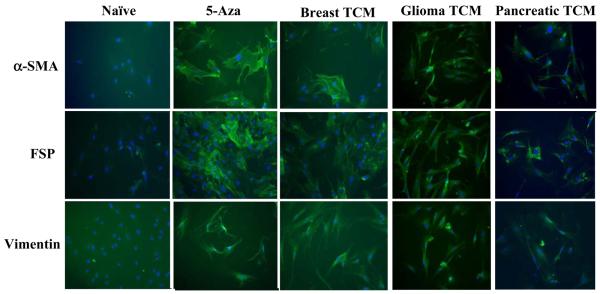
Myofibroblasts can be characterized by increased expression of α-SMA, vimentin and FSP among others. In addition to activation of hMSCs by TCM from MDAMB231 (representing breast cancer), we also examined the differentiation of hMSCs followed by prolonged exposure to TCM from two other types of cancers. The expression levels of α-SMA, vimentin and FSP in activated hMSCs exposed to 30d TCM from breast cancer (MDAMB231), glioma (U87) and pancreatic cancer cells (PANC-1) was determined by immunofluorescence. Naïve hMSCs expressed little α-SMA, vimentin and FSP while hMSCs exposed to TCM for 5, 10, 15, 20 and 30 days expressed increasing amounts of α-SMA, vimentin and FSP indicating that the TCM exposed hMSCs were differentiating into myofibroblasts (Fig 2). Number of hMSCs that expressed these markers was quantitated. The analysis revealed that on average 89% of TCM activated hMSCs expressed α-SMA, 83% expressed vimentin and 52% expressed FSP where as only 17-26% of the naïve hMSCs expressed these markers (Fig 1C). Treatment with 5-aza can differentiate MSCs into myogenic lineages, which also express α-SMA, FSP and vimentin. Indeed, the 5-aza treated hMSCs expressed higher levels of all three proteins than the naïve hMSCs (Fig.2). Hence we demonstrate that hMSCs exposed to TCM from three different types of cancers, breast cancer, pancreatic cancer and glioma, differentiate and expressed markers of myofibroblast lineage (Fig. 2).
Figure 2.
Increased expression of myofibroblast marker proteins α-SMA, FSP and vimentin was observed in hMSCs exposed to TCM from breast, glioma and pancreatic cancers, and in 5-aza treated hMSCs by immunofluorescence staining. All samples were counterstained with DAPI to visualize nuclei and appear blue in the photographs.
Global gene expression profiling reveals similarities between 5-aza treated hMSCs and the 30d TCM exposed hMSCs
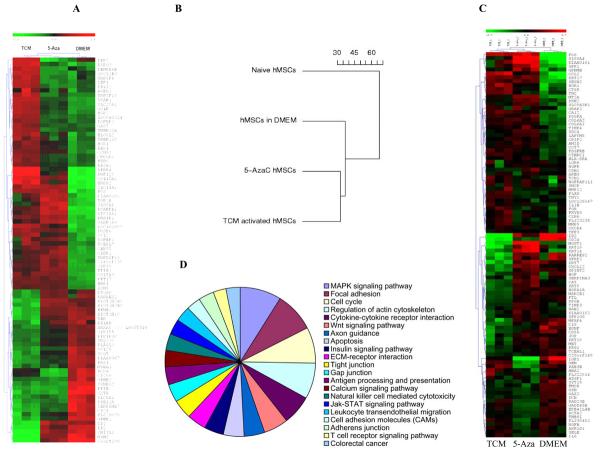
Comparison of global gene expression profiles revealed similarities between hMSCs induced to differentiate along the myogenic lineage by 5-azacytadine and the 30d TCM exposed hMSCs as compared to control hMSCs. Thus, 30d TCM exposed cells displayed similarity with cells of the myogenic lineage at the level of gene expression. The results of the global gene expression and the relationship between 5-aza treated hMSCs and 30d TCM treated hMSCs are shown as unsupervised hierarchical cluster analysis in Fig. 3_A_. A similar relationship is revealed when the global gene expression profile results are presented as a dendogram as shown in Fig. 3_B_ respectively. Fig. 3_C_ shows a KEGG pathway analysis pie chart for genes that are upregulated in the 30day TCM-exposed hMSCs. Genes found to be upregulated belong to the MAPK signaling, Focal Adhesion Kinase pathway, cell cycle regulation, regulation of actin cytoskeleton pathway and cytokine-cytokine receptor interaction pathway, and the Wnt signaling pathway among others. Top ten pathways enriched in genes induced by the TCM treated hMCSs for 30 days include ECM-receptor interaction, Antigen processing and presentation, Calcium signaling pathway, Adherens junction, JAK-STAT signaling pathway, Toll-like receptor signaling pathway, TGF-beta signaling pathway (Table-1).
Figure 3.
Comparative gene expression analysis of 30d TCM exposed hMSCs, 5-aza treated hMSCs and control DMEM exposed hMSCs. A, Global gene expression profile of control DMEM exposed hMSCs, 5-aza treated hMSCs and 30d TCM exposed hMSCs. The hierarchical clustering is obtained from cDNA microarray studies carried out on naïve, 5aza treated hMSCs and tumor conditioned medium treated hMSCs for 30 days. Overall gene expression profiles of 5-aza treated hMSCs and 30d TCM-exposed hMSCs are similar. Control DMEM exposed hMSCs have a different expression profile from both 5-aza treated as well as 30d TCM exposed hMSCs. The expression levels of individual transcripts are shown from green (low) to red (high). Clustering reveals an overall global gene expression profile similarity between 5-aza treated hMSCs and 30d TCM exposed hMSCs as compared to the control 30dDMEM exposed (green: lower expression and red: higher expression). There are several candidate genes that show increased expression in only the 30d TCM exposed hMSCs. B, Dendogram depicts relative differences or similarities between the 4 hMSCs samples analyzed in a hierarchical manner. The distance used for the clustering is 1–Pearson correlation between expression values (in log scale) from arrays. The 30d TCM-exposed hMSCs appear to be closer to the 5-aza treated cells in terms of global gene expression than the other control cell types. C, Pie chart of induced KEGG pathways in the MSC treated by TCM for 30 days going clockwise from MAPK signaling pathway. The areas of individual slices represent percentage of genes belonging to the particular pathway that are upregulated following activation by 30d TCM exposure (list of genes in Table-1). D, Gene expression array data from MSC exposed to TCM, 5AZA or control media were analyzed for expression of genes reported to be specifically expressed (i.e., up or down regulated) in carcinoma-associated fibroblasts. A heat-map showing relative expression of these genes amongst the 3 sample conditions is shown (red=higher relative gene expression; blue=lower relative gene expression). The heatmap presents 100 top markers of CAF out of which 53 markers are up regulated in TCM exposed MSCs and 47 markers are down regulated in TCM exposed MSCs (see text for the gene list).
Table 1.
Top ten pathways enriched in genes induced by the TCM treated hMCSs for 30 days. Each of these pathways contains >75% induced genes. Among other enriched pathways, containing between 40%-75% induced genes: ECM-receptor interaction, Antigen processing and presentation, Calcium signaling pathway, Adherens junction, JAK-STAT signaling pathway, Toll-like receptor signaling pathway, TGF-beta signaling pathway.
| Pathways | Genes induced in the MSC treated by TCM for 30 days | |||||||||
|---|---|---|---|---|---|---|---|---|---|---|
| MAPK signaling pathway | BRAF | DUSP6 | RAC1 | CACNG6 | TP53 | PPP3CB | STMN1 | DUSP14 | DUSP5 | JUND |
| p val = 0.0001 | JUN | NFKB1 | PAK2 | IKBKB | MKNK2 | CDC25B | NFKB2 | RRAS2 | CASP1 | PDGFRB |
| PAK1 | TGFB1 | NRAS | ATF4 | HSPA8 | MAP4K4 | FOS | FGFR1 | RASA1 | FAS | |
| MAP3K4 | HSPA9B | CASP7 | CRK | GADD45A | DAXX | MAPK1 | RPS6KA3 | |||
| Focal adhesion | BRAF | RAC1 | BIRC4 | PPP1CC | TNC | COL6A3 | JUN | CAPN2 | SPP1 | VASP |
| p val = 0.0148 | ITGA3 | PIK3R5 | PAK2 | COL6A1 | ITGB3 | BCL2 | COL5A3 | PPP1CA | TLN2 | CCND2 |
| RRAS2 | PDGFRB | PAK1 | PDGFC | ITGB7 | PXN | NRAS | COL6A2 | VEGF | DIAPH1 | |
| GRLF1 | FYN | CRK | PAK3 | ITGA7 | LAMB1 | ITGA2 | ITGAV | MAPK1 | IBSP | |
| Cell cycle | MCM6 | PTTG1 | TP53 | CDKN1A | CCNB1 | MAD2L2 | ANAPC1 | PCNA | MDM2 | ANAPC7 |
| p val = 0.0148 | CDC25B | CCND2 | CDK6 | TGFB1 | CCNH | BUB3 | PRKDC | CDK4 | YWHAQ | BUB1B |
| CDC23 | MCM2 | CDC2 | SMAD3 | CDC16 | GADD45A | CDC27 | RBL1 | ORC5L | YWHAZ | |
| SMAD4 | YWHAB | MCM3 | HDAC2 | |||||||
| Regulation of actin cytoskeleton | LIMK1 | BDKRB1 | BDKRB2 | BRAF | SSH1 | RAC1 | NCKAP1 | PPP1CC | ITGA3 | PIK3R5 |
| p val = 0.0001 | ARPC5 | PFN1 | PAK2 | ITGB3 | PPP1CA | IQGAP3 | RRAS2 | TIAM1 | CFL1 | PDGFRB |
| PAK1 | ABI2 | ITGB7 | PXN | NRAS | DIAPH1 | FGFR1 | BAIAP2 | GRLF1 | GSN | |
| CRK | PAK3 | CSK | WASL | ITGA7 | ITGA2 | ITGAV | ARPC2 | GNA13 | MAPK1 | |
| Cytokine-cytokine receptor interaction | ACVR1 | BMPR2 | CCL2 | IL18R1 | TNFSF9 | IL6ST | PRLR | ACVR2A | TNFRSF12A | IL1RAP |
| p val = 0.0148 | PDGFRB | CCL7 | LIF | TGFB1 | PDGFC | CLCF1 | TNFRSF10B | TNFRSF10A | CD40 | VEGF |
| FAS | CSF1 | TNFSF15 | TNFRSF10D | TNFSF4 | TNFSF18 | |||||
| Wnt signaling pathway | FZD9 | FZD8 | DAAM2 | RAC1 | WNT2 | TP53 | CSNK2A1 | CSNK2B | PPP3CB | CSNK1A1 |
| p val = 0.0391 | PSEN1 | NFAT5 | WNT5A | JUN | CCND2 | TBL1XR1 | CSNK1E | FZD3 | PLCB1 | DKK2 |
| SMAD3 | PPP2CA | RUVBL1 | WNT8B | CACYBP | SMAD4 | |||||
| Axon guidance | LIMK1 | CDK5 | LRRC4C | RAC1 | PLXNA2 | PLXNA1 | PPP3CB | NFAT5 | ABLIM1 | SEMA4F |
| p val = 0.10337 | PAK2 | RRAS2 | CFL1 | PAK1 | NRAS | GNAI3 | RASA1 | FYN | PAK3 | UNC5B |
| NRP1 | SEMA3A | MAPK1 | ||||||||
| Apoptosis | DFFA | IRAK3 | PDCD8 | BIRC4 | TP53 | RIPK1 | CYCS | PPP3CB | CAPN2 | PIK3R5 |
| p val = 0.0011 | NFKB1 | IKBKB | BCL2 | NFKB2 | IL1RAP | TNFRSF10B | TNFRSF10A | FAS | CASP7 | TNFRSF10D |
| PRKAR2A | ||||||||||
| Insulin signaling pathway | PRKAG2 | PRKAB1 | FRAP1 | EXOC7 | PPP1CC | CALM2 | PIK3R5 | IKBKB | SOCS6 | RPS6 |
| p val = 0.00116 | MKNK2 | PPP1CA | PCK2 | RRAS2 | NRAS | CALM1 | PKM2 | IRS4 | PYGB | IRS1 |
| CRK | EIF4EBP1 | MAPK1 | PRKAR2A | |||||||
| Gap junction | TUBB2C | ITPR2 | CSNK1A1 | ADCY3 | RRAS2 | PDGFRB | PDGFC | CSNK1E | TUBA6 | PLCB1 |
| p val = 0.0230 | GNAI3 | CDC2 | GNAS | CSNK1G1 | GUCY1B3 | MAPK1 | TUBB |
TCM-exposed hMSCs have upregulation of CAF-associated genes
To determine if the gene expression profile of TCM-exposed hMSCs resembled that of tumor-associated fibroblasts, we identified a set of genes that have been reported to be upregulated in carcinoma associated fibroblasts (9, 27-29). The differential expression of these reported carcinoma associated fibroblast genes was then examined in the gene-expression data from the TCM-exposed, 5-aza exposed and control treated hMSCs. As shown in the heat map (Fig. 3_D_), TCM-exposed hMSCs did have upregulation of a significant proportion of these CAF-associated genes. Top 25 (out of 53) up-regulated genes in TCM exposed hMSCs include CCL2, FOS, EGR1, KRT17, CTSK, TNC, CA12, RAB3B, SESN2, HBA2, GEM, PLAU, CTHRC1, FGR, THY1, PDGFRB, FLJ23235, TCN1, COL6A1, FXYD3, NGFRAP1L1, MMP9, PDGFA, COL6A2. Top 25 (out of the 47) down-regulated genes in TCM exposed hMSCs include ID2, CD24, MGST1, KRT19, RARRES2, KRT7, SFRP2, KRT14, MFAP4, SPINT2, CD55, C1S, KRT18, HSPA1A, BDNF, CAT, KRT8, HGF, MET, FTL, MAN2B1, JUP, PPGB, TCEAL1. These data support the notion that TCM exposure induces the differentiation of hMSCs into a state that resembles CAFs. Interestingly, a comparative study of the genes upregulated in the 30d TCM exposed hMSCs and the markers for various breast cancer molecular profiles identified previously (30) revealed that 25% of the TCM exposed hMSCs markers are upregulated in the basals, 15% are upregulated in luminals, and less than 5% are upregulated in the HER2+ subtype of human breast cancers (data not shown). The markers up-regulated in TCM activated hMSCs and down-regulated in the hMSCs treated with 5-aza and naïve hMSCs grown in DMEM include genes involved in several functional classes including transmembrane, signal transduction and splicing. Markers up regulated in 5-aza treated cell lines include several genes involved in DNA metabolism and cellular processes. Markers upregulated in naïve hMSCs grown in DMEM media include genes involved in glycoprotein and binding processes and in cellular metabolism (see supplementary data for information of the gene list).
Sustained expression of SDF-1 in 30d TCM treated hMSCs
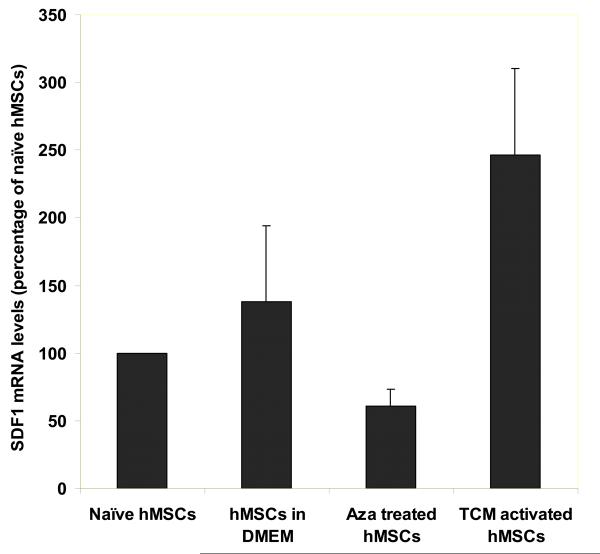
One critical feature of CAFs identified, is their ability to secrete SDF1, which may support tumor cell growth (4). We determined the effect of TCM exposure on SDF-1 expression in hMSCs. Real time quantitative PCR analysis revealed a sustained high level of SDF-1 gene expression in hMSCs treated for 30d in TCM as compared to naïve hMSCs (p=0.032). The increase in SDF-1 mRNA level was two fold as compared to the DMEM control (Fig. 4_A_). In contrast, the 5-aza treated hMSCs did not show increased expression of SDF-1 as compared to the naïve hMSCs (p=0.12). The mRNA levels of SDF-1 were normalized to18S RNA that was used as a control for the RT-PCR amplification.
Figure 4.
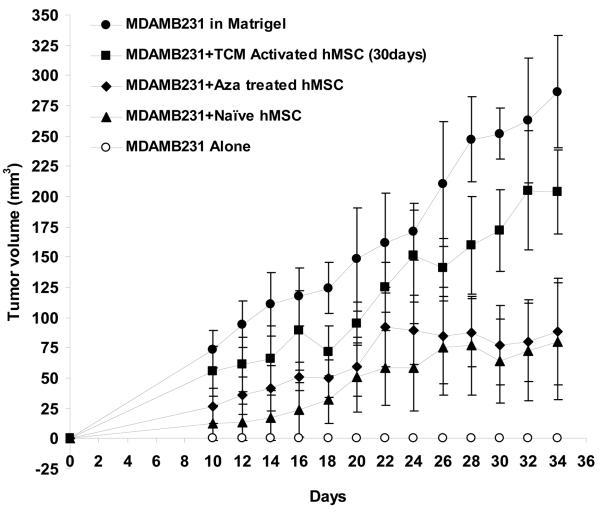
TCM activated hMSCs have increased expression of SDF-1 and promote breast tumor growth in nude mice. A, Expression of SDF-1, a marker of myofibroblasts, is increased in 30d TCM exposed hMSCs. Levels of SDF-1 mRNA were quantitated by quantitative RT-PCR and expressed as fold change over 18sRNA levels. For naïve MSCs the ratio of SDF-1 over 18sRNA is taken as 100 percent. Changes in levels of SDF-1 mRNA/18sRNA following exposure of naïve MSCs to the various conditions are reported as percent changes. B, 30d TCM exposed hMSCs when injected together with MDAMB231 cells result in robust tumor growth in nude mice. In vivo tumor growth was measured over 24 days in nude mice (n=5 for all groups). MDAMB231 cells along with or without TCM exposed hMSCs, naïve hMSCs, 5-aza treated hMSCs or matrigel were injected and palpable tumors were seen on day 10 (tumor cells injected on day 0). The human breast cancer cells MDAMB231 when injected alone did not form tumors in nude mice as shown. Matrigel as well as 30d TCM exposed hMSCs increase growth of MDAMB231 tumors in nude mice as compared to naïve hMSCs and 5-aza treated hMSCs. The naïve hMSCs and the 5-aza treated hMSCs did not show the same robust tumor formation as seen for matrigel and 30d TCM exposed hMSC group. Y-axis represents tumor volume ± S.D. and days following tumor cell injection are shown on the X-axis.
Activated hMSCs promote tumor growth in vivo
To determine if 30d TCM exposed hMSCs can support tumor growth in vivo, a set of xenograft experiments were performed using MDAMB231, human breast cancer cells. The MDAMB231 cells do not form tumors in nude mice when injected alone; however robust tumor growth can be induced when they are mixed with matrigel prior to injection (31). To determine the effect of hMSCs on tumor cell growth under these conditions, 10×106 MDAMB231 cells were injected into the backs of nude mice mixed with either matrigel, naïve hMSCs, 5-aza treated hMSCs or 30d TCM treated hMSCs (2×10⁶ hMSCs were injected along with 10×106 MDAMB231 cells). Both the presence of matrigel and 30d TCM treated hMSCs clearly supported tumor growth when compared to MDAMBA231 alone (Fig. 4**B**). The naïve hMSCs and the 5-aza treated hMSCs did not appear to support tumor growth as robustly as either matrigel or 30d TCM treated hMSCs. The naïve as well as the 30d TCM hMSCs did not form tumors when injected subcutaneously in nude mice.
Human MSC-derived cells expressing myofibroblast markers contribute to stroma of mixed xenograft tumors
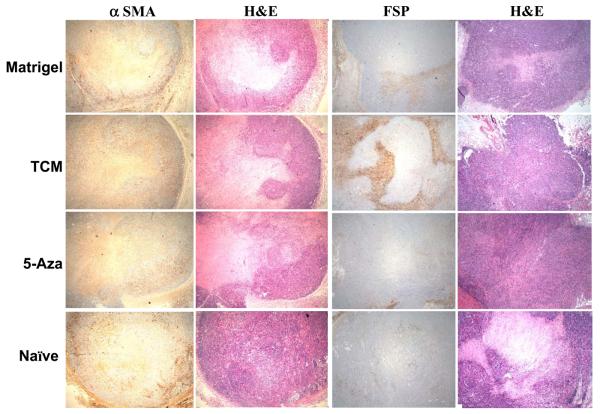
At the end of the observation period, tumors were excised from the animals, frozen in OCT and processed for immunohistochemical staining for α-SMA and FSP (Fig. 5). The strongest positivity for FSP was seen in tumors derived from 30d TCM treated hMSCs+MDAMB231 group. The co-injected hMSCs exposed to 30d TCM showed a similar pattern of distribution within the tumor section resembling earlier observations in endometrial cancers for CAFs (32). This suggests that the 30d TCM exposed hMSCs may become functionally incorporated into the tumor stroma and facilitate tumor growth to a greater extent than the other cell types when comingled with MDAMB231 human breast cancer cells.
Figure 5.
30d TCM exposed hMSCs become incorporated in the tumor stroma to a greater extent than the other co-injected cell types. Immunohistochemical staining for myofibroblast markers α-SMA, FSP and H&E stain in tumor stroma from naïve hMSC+MDAMB231 tumors (small tumor that did not grow in size); MDAMB231 plus matrigel tumors; MDAMB231 plus 5-aza treated hMSCs and tumors from MDAMB231 plus 30d TCM exposed hMSCs respectively.
Discussion
The surrounding tumor microenvironment appears to be an important determinant in the final outcome of the disease (32, 33). Our results demonstrate that myofibroblasts derived from hMSCs are associated with the tumor microenvironment and are a source of CAFs. Our conclusions are based upon the observations that long term exposure of mesenchymal stem cells to tumor conditioned medium from human breast cancer cells induces a phenotype that resembles the reported myofibroblast like features in carcinoma associated fibroblasts including increased expression of SMA, FSP and vimentin and sustained expression of SDF-1. Moreover, the 30d TCM exposed cells supported tumor growth in vitro as well as in vivo. Conversely, the naïve hMSCs expressed little α-SMA, FSP or vimentin and did not support robust tumor growth in vitro or in vivo. This is in agreement with a recent report demonstrating that naïve hMSCs can inhibit tumor growth in vivo in a model of Kaposi's sarcoma (34).
Additionally, gene expression profile of the 30d TCM exposed hMSCs resembles that of 5-aza treated hMSCs to a great extent, and is distinct from those of either the DMEM control hMSCs or the naïve hMSCs. Thus, 30d TCM exposed hMSCs appear to be similar to cells of myogenic lineage at many levels. There are now several examples in the literature of changes in gene expression by MSCs brought about by exposure to various stimuli.
Myofibroblastic properties have also been induced in bone marrow-derived MSCs in vitro (13). Increased expression of α-SMA and vimentin has been noted after 14 to 21 days following exposure to fibroblast growth factor 2 (FGF-2) as well as mechanical stress (35, 36). In addition to α-smooth muscle markers, tumor associated fibroblasts express high levels of SDF-1 which is important in promoting both tumor growth and angiogenesis (4). Although the phenotypic appearance of hMSCs differentiated to myofibroblasts using various inducers are similar, there maybe important functional differences as highlighted by our observation that 5-aza treated hMSCs do not support robust in vivo tumor growth as do the 30d TCM exposed hMSCs. Our studies also suggest that factors secreted by tumor cells present in TCM can recruit hMSCs and influence them to become part of the tumor microenvironment.
The time taken (30 days) by hMSCs to exhibit myofibroblast like properties presented in our study represents a combination of properties. The primary criteria was to see a clear effect on increased tumor cell growth in vitro, and this approximately coincided with the time taken in vitro for conventional differentiation assays such as induction of differentiation into myogenic, osteogenic, adipogenic and chondrogenic lineages for the naïve hMSCs. A single criterion such as increased expression of α- SMA can be observed earlier (37). The increased expression of α-SMA was observed following incubation of bone marrow derived mesenchymal stem cells to conditioned medium from human colorectal cancer cells as well as TGF-beta 1 (37). It is possible that inclusion of recombinant TGF-beta 1 in addition to the tumor conditioned medium may have contributed to an earlier phenotypic change in the hMSCs than exposure to TCM alone. We observed a gradual increase in α-SMA levels following exposure to TCM which is in consent with a the observation that stroma formation in hMSC transplanted tumor bearing mice showed that expression of α-SMA increased from 25.3% to 39.8% from day 14 to day 28, indicating that the change may be progressive both qualitatively as well as quantitatively in vivo (5). Combined with recent studies demonstrating that CAFs are derived from cells present in the bone marrow, that MSCs are present in the circulation, and that MSCs localize to solid tumors when administered systemically in animal models, these data provide compelling evidence that hMSCs are a source of CAFs. While these data demonstrate the ability of hMSCs to form CAFs they do not preclude the possibility that CAFs may arise from other sources including epithelial mesenchymal transition. It is possible that epithelial mesenchymal transition may have also contributed to the stromal layer. This possibility would have to be evenly distributed amongst the three experimental conditions i.e. matrigel control, 30 d TCM exposed MSCs and naïve MSCs and thus would have resulted in nearly equal staining in the three cases. Although this possibility exists for epithelial tumors, it is unlikely to contribute to the staining observed in the experimental groups presented here. It has been demonstrated that mutations and loss of heterozygosity in the stromal compartment do not always overlap with the mutations and loss of heterozygosity in the epithelial compartment in breast cancers (38). This suggests that different pathways of clonal expansion may have been involved in tumor and stroma development.
In vitro and co-implantation models combining tumor cells and hMSCs hold great promise for providing a system in which the interaction between tumor and stroma can be manipulated and studied. Additionally, these studies provide a cell culture method for generating one of the important cell types of the tumor stroma, the activated myofibroblasts. A better understanding of the interplay between different bone marrow derived cell types and the tumor cells within the tumor microenvironment will be important in developing strategies for improved tumor therapy that takes into account the influence of tumor microenvironment on tumor survival and growth.
Supplementary Material
Mishra Supplement
Acknowledgements
These studies were supported by a collaborative research grant from CINJ to DB and JG; a NJCCR grant # 05-2406-CCR-EO and a NJ Stem Cell Initiative grant from the NJCST HESC-06-04-00.
Footnotes
The microarray data has been submitted to the GEO database and is available under the accession number -GSE9764.
The authors have no conflicting financial interests to declare.
References
- 1.Bissell MJ, Radisky D. Putting tumours in context. Nat Rev Cancer. 2001;1:46–54. doi: 10.1038/35094059. [DOI] [PMC free article] [PubMed] [Google Scholar]
- 2.Blankenstein T. The role of tumor stroma in the interaction between tumor and immune system. Curr Opin Immunol. 2005;17:180–6. doi: 10.1016/j.coi.2005.01.008. [DOI] [PubMed] [Google Scholar]
- 3.Cardone A, Tolino A, Zarcone R, Borruto Caracciolo G, Tartaglia E. Prognostic value of desmoplastic reaction and lymphocytic infiltration in the management of breast cancer. Panminerva Med. 1997;39:174–7. [PubMed] [Google Scholar]
- 4.Orimo A, Gupta PB, Sgroi DC, et al. Stromal fibroblasts present in invasive human breast carcinomas promote tumor growth and angiogenesis through elevated SDF-1/CXCL12 secretion. Cell. 2005;121:335–48. doi: 10.1016/j.cell.2005.02.034. [DOI] [PubMed] [Google Scholar]
- 5.Ishii G, Sangai T, Oda T, et al. Bone-marrow-derived myofibroblasts contribute to the cancer-induced stromal reaction. Biochem Biophys Res Commun. 2003;309:232–40. doi: 10.1016/s0006-291x(03)01544-4. [DOI] [PubMed] [Google Scholar]
- 6.Direkze NC, Hodivala-Dilke K, Jeffery R, et al. Bone marrow contribution to tumor-associated myofibroblasts and fibroblasts. Cancer Res. 2004;64:8492–5. doi: 10.1158/0008-5472.CAN-04-1708. [DOI] [PubMed] [Google Scholar]
- 7.Direkze NC, Jeffery R, Hodivala-Dilke K, et al. Bone marrow-derived stromal cells express lineage-related messenger RNA species. Cancer Res. 2006;66:1265–9. doi: 10.1158/0008-5472.CAN-05-3202. [DOI] [PubMed] [Google Scholar]
- 8.Studeny M, Marini FC, Dembinski JL, et al. Mesenchymal stem cells: potential precursors for tumor stroma and targeted-delivery vehicles for anticancer agents. J Natl Cancer Inst. 2004;96:1593–603. doi: 10.1093/jnci/djh299. [DOI] [PubMed] [Google Scholar]
- 9.Allinen M, Beroukhim R, Cai L, et al. Molecular characterization of the tumor microenvironment in breast cancer. Cancer Cell. 2004;6:17–32. doi: 10.1016/j.ccr.2004.06.010. [DOI] [PubMed] [Google Scholar]
- 10.Mori L, Bellini A, Stacey MA, Schmidt M, Mattoli S. Fibrocytes contribute to the myofibroblast population in wounded skin and originate from the bone marrow. Exp Cell Res. 2005;304:81–90. doi: 10.1016/j.yexcr.2004.11.011. [DOI] [PubMed] [Google Scholar]
- 11.Chauhan H, Abraham A, Phillips JR, Pringle JH, Walker RA, Jones JL. There is more than one kind of myofibroblast: analysis of CD34 expression in benign, in situ, and invasive breast lesions. J Clin Pathol. 2003;56:271–6. doi: 10.1136/jcp.56.4.271. [DOI] [PMC free article] [PubMed] [Google Scholar]
- 12.LaRue AC, Masuya M, Ebihara Y, et al. Hematopoietic origins of fibroblasts: I. In vivo studies of fibroblasts associated with solid tumors. Exp Hematol. 2006;34:208–18. doi: 10.1016/j.exphem.2005.10.009. [DOI] [PubMed] [Google Scholar]
- 13.Hung SC, Kuo PY, Chang CF, Chen TH, Ho LL. Alpha-smooth muscle actin expression and structure integrity in chondrogenesis of human mesenchymal stem cells. Cell Tissue Res. 2006;324:457–66. doi: 10.1007/s00441-006-0156-x. [DOI] [PubMed] [Google Scholar]
- 14.Studeny M, Marini FC, Champlin RE, Zompetta C, Fidler IJ, Andreeff M. Bone marrow-derived mesenchymal stem cells as vehicles for interferon-beta delivery into tumors. Cancer Res. 2002;62:3603–8. [PubMed] [Google Scholar]
- 15.Hung SC, Deng WP, Yang WK, et al. Mesenchymal stem cell targeting of microscopic tumors and tumor stroma development monitored by noninvasive in vivo positron emission tomography imaging. Clin Cancer Res. 2005;11:7749–56. doi: 10.1158/1078-0432.CCR-05-0876. [DOI] [PubMed] [Google Scholar]
- 16.Campagnoli C, Roberts IA, Kumar S, Bennett PR, Bellantuono I, Fisk NM. Identification of mesenchymal stem/progenitor cells in human first-trimester fetal blood, liver, and bone marrow. Blood. 2001;98:2396–402. doi: 10.1182/blood.v98.8.2396. [DOI] [PubMed] [Google Scholar]
- 17.Kuznetsov SA, Mankani MH, Gronthos S, Satomura K, Bianco P, Robey PG. Circulating skeletal stem cells. J Cell Biol. 2001;153:1133–40. doi: 10.1083/jcb.153.5.1133. [DOI] [PMC free article] [PubMed] [Google Scholar]
- 18.Wang D, Park JS, Chu JS, et al. Proteomic profiling of bone marrow mesenchymal stem cells upon transforming growth factor beta1 stimulation. J Biol Chem. 2004;279:43725–34. doi: 10.1074/jbc.M407368200. [DOI] [PubMed] [Google Scholar]
- 19.Wakitani S, Saito T, Caplan AI. Myogenic cells derived from rat bone marrow mesenchymal stem cells exposed to 5-azacytidine. Muscle Nerve. 1995;18:1417–26. doi: 10.1002/mus.880181212. [DOI] [PubMed] [Google Scholar]
- 20.Neuhuber B, Gallo G, Howard L, Kostura L, Mackay A, Fischer I. Reevaluation of in vitro differentiation protocols for bone marrow stromal cells: disruption of actin cytoskeleton induces rapid morphological changes and mimics neuronal phenotype. J Neurosci Res. 2004;77:192–204. doi: 10.1002/jnr.20147. [DOI] [PubMed] [Google Scholar]
- 21.Friedman MS, Long MW, Hankenson KD. Osteogenic differentiation of human mesenchymal stem cells is regulated by bone morphogenetic protein-6. J Cell Biochem. 2006;98:538–54. doi: 10.1002/jcb.20719. [DOI] [PubMed] [Google Scholar]
- 22.Gregory CA, Prockop DJ, Spees JL. Non-hematopoietic bone marrow stem cells: molecular control of expansion and differentiation. Exp Cell Res. 2005;306:330–5. doi: 10.1016/j.yexcr.2005.03.018. [DOI] [PubMed] [Google Scholar]
- 23.Pittenger MF, Mackay AM, Beck SC, et al. Multilineage potential of adult human mesenchymal stem cells. Science. 1999;284:143–7. doi: 10.1126/science.284.5411.143. [DOI] [PubMed] [Google Scholar]
- 24.Menon LG, Picinich S, Koneru R, et al. Differential gene expression associated with migration of mesenchymal stem cells to conditioned medium from tumor cells or bone marrow cells. Stem Cells. 2007;25:520–8. doi: 10.1634/stemcells.2006-0257. [DOI] [PubMed] [Google Scholar]
- 25.Reich M, Liefeld T, Gould J, Lerner J, Tamayo P, Mesirov JP. GenePattern 2.0. Nat Genet. 2006;38:500–1. doi: 10.1038/ng0506-500. [DOI] [PubMed] [Google Scholar]
- 26.Subramanian A, Tamayo P, Mootha VK, et al. Gene set enrichment analysis: a knowledge-based approach for interpreting genome-wide expression profiles. Proc Natl Acad Sci U S A. 2005;102:15545–50. doi: 10.1073/pnas.0506580102. [DOI] [PMC free article] [PubMed] [Google Scholar]
- 27.Hu M, Yao J, Cai L, et al. Distinct epigenetic changes in the stromal cells of breast cancers. Nat Genet. 2005;37:899–905. doi: 10.1038/ng1596. [DOI] [PubMed] [Google Scholar]
- 28.Finak G, Sadekova S, Pepin F, et al. Gene expression signatures of morphologically normal breast tissue identify basal-like tumors. Breast Cancer Res. 2006;8:R58. doi: 10.1186/bcr1608. [DOI] [PMC free article] [PubMed] [Google Scholar]
- 29.Chang HY, Sneddon JB, Alizadeh AA, et al. Gene expression signature of fibroblast serum response predicts human cancer progression: similarities between tumors and wounds. PLoS Biol. 2004;2:E7. doi: 10.1371/journal.pbio.0020007. [DOI] [PMC free article] [PubMed] [Google Scholar]
- 30.Wang Y, Klijn JG, Zhang Y, et al. Gene-expression profiles to predict distant metastasis of lymph-node-negative primary breast cancer. Lancet. 2005;365:671–9. doi: 10.1016/S0140-6736(05)17947-1. [DOI] [PubMed] [Google Scholar]
- 31.Mehta RR, Graves JM, Hart GD, Shilkaitis A, Das Gupta TK. Growth and metastasis of human breast carcinomas with Matrigel in athymic mice. Breast Cancer Res Treat. 1993;25:65–71. doi: 10.1007/BF00662402. [DOI] [PubMed] [Google Scholar]
- 32.Orimo A, Tomioka Y, Shimizu Y, et al. Cancer-associated myofibroblasts possess various factors to promote endometrial tumor progression. Clin Cancer Res. 2001;7:3097–105. [PubMed] [Google Scholar]
- 33.Kaminski A, Hahne JC, Haddouti el M, Florin A, Wellmann A, Wernert N. Tumourstroma interactions between metastatic prostate cancer cells and fibroblasts. Int J Mol Med. 2006;18:941–50. [PubMed] [Google Scholar]
- 34.Khakoo AY, Pati S, Anderson SA, et al. Human mesenchymal stem cells exert potent antitumorigenic effects in a model of Kaposi's sarcoma. J Exp Med. 2006;203:1235–47. doi: 10.1084/jem.20051921. [DOI] [PMC free article] [PubMed] [Google Scholar]
- 35.Hankemeier S, Keus M, Zeichen J, et al. Modulation of proliferation and differentiation of human bone marrow stromal cells by fibroblast growth factor 2: potential implications for tissue engineering of tendons and ligaments. Tissue Eng. 2005;11:41–9. doi: 10.1089/ten.2005.11.41. [DOI] [PubMed] [Google Scholar]
- 36.Kobayashi N, Yasu T, Ueba H, et al. Mechanical stress promotes the expression of smooth muscle-like properties in marrow stromal cells. Exp Hematol. 2004;32:1238–45. doi: 10.1016/j.exphem.2004.08.011. [DOI] [PubMed] [Google Scholar]
- 37.Emura M, Ochiai A, Horino M, Arndt W, Kamino K, Hirohashi S. Development of myofibroblasts from human bone marrow mesenchymal stem cells cocultured with human colon carcinoma cells and TGF beta 1. In Vitro Cell Dev Biol Anim. 2000;36:77–80. doi: 10.1290/1071-2690(2000)036<0077:domfhb>2.0.co;2. [DOI] [PubMed] [Google Scholar]
- 38.Patocs A, Zhang L, Xu Y, Weber F, Caldes T, Mutter GL, Platzer P, Eng C. Breast-cancer stromal cells with TP53 mutations and nodal metastases. N Engl J Med. 2007;357:2543–51. doi: 10.1056/NEJMoa071825. [DOI] [PubMed] [Google Scholar]
Associated Data
This section collects any data citations, data availability statements, or supplementary materials included in this article.
Supplementary Materials
Mishra Supplement
