Adrenergic and Noradrenergic Innervation of the Midbrain Ventral Tegmental Area and Retrorubral Field: Prominent Inputs from Medullary Homeostatic Centers (original) (raw)
Abstract
Adrenergic agents modulate the activity of midbrain ventral tegmental area (VTA) neurons. However, the sources of noradrenergic and adrenergic inputs are not well characterized. Immunostaining for dopamine β-hydroxylase revealed fibers within dopamine (DA) neuron areas, with the highest density in the retrorubral field (A8 cell group), followed by the VTA (A10 cell group), and very few fibers within substantia nigra compacta. A less dense, but a similar pattern of fibers was also found for the epinephrine marker, phenylethanolamine _N_-methyl transferase. Injection of the retrograde tracer wheat germ agglutinin-apo (inactivated) horseradish peroxidase conjugated to colloidal gold, or cholera toxin subunit b, revealed that the noradrenergic innervation of the A10 and A8 regions arise primarily from A1, A2, A5, and locus ceruleus neurons. Selective lesions of the ventral noradrenergic bundle confirmed a prominent innervation from A1 and A2 areas. Retrogradely labeled epinephrine neurons were found mainly in the C1 area. The identification of medullary noradrenergic and adrenergic afferents to DA neuron areas indicates new pathways for visceral-related inputs to reward-related areas in the midbrain.
Introduction
Midbrain dopamine (DA) and non-DA neurons in the ventral tegmental area (VTA) are modulated by adrenergic agents. Blockade of α-1 adrenoceptors reduces burst firing in DA cells, as do low concentrations of α-2 adrenoceptor agonists (Grenhoff and Svensson, 1988, 1989, 1993). Norepinephrine (NE) activates DA neurons by decreasing potassium conductance, inhibiting metabotropic glutamate receptor (mGluR)-mediated IPSPs, or through a nonselective cationic conductance (Grenhoff et al., 1995; Paladini et al., 2001; Cathala et al., 2002). Inhibitory actions of NE on DA neurons include an activation of a calcium-dependent potassium conductance and an increase in GABA presynaptic release (Cathala et al., 2002; Paladini and Williams, 2004). NE inhibitory effects are mediated through the α-2 adrenoceptor as well as through the D2 DA autoreceptor (Arencibia-Albite et al., 2007; Guiard et al., 2008).
NE terminals make synaptic contacts onto midbrain DA neurons (Liprando et al., 2004). Most NE terminals are reported to be in nonsynaptic appositions (77%), with a few synaptic contacts onto DA dendrites (7%), indicating a possibly predominant extrasynaptic site of interaction. α-1 and α-2 adrenoceptors are present within midbrain dopaminergic areas, whereas β adrenoceptors have not been detected (Jones et al., 1985; Lee et al., 1998). Tracing studies have identified a projection from locus ceruleus (LC) to the VTA (Jones and Moore, 1977; Phillipson, 1979; Simon et al., 1979; Geisler and Zahm, 2005), however it remains unknown whether LC is the sole or even main source of NE to midbrain DA neurons.
Adrenergic and noradrenergic innervations are divided in two major divisions: those arising from the LC (A4 and A6 areas) and those arising from non-LC nuclei located in either ventral [NE-containing A1, A5 and A7 areas, and epinephrine (E)-containing C1 area] or dorsomedial (NE-containing A2 area, E-containing C2 and C3 areas) medulla. Non-LC-NE and E neurons are located in brainstem homeostatic centers and typically send projections to endocrine and visceral areas such as hypothalamus, extended amygdala and parabrachial nucleus (Byrum and Guyenet, 1987; Ter Horst et al., 1989; Woulfe et al., 1990). In contrast, LC has a broader projection field than non-LC neurons, and is the sole source of NE to the cerebral cortex. LC activity is related to arousal as well as with cognitive performance. Therefore, specification of differential topography for LC versus non-LC adrenergic inputs to distinct midbrain DA regions can provide us with a better understanding about how NE and E circuits interact with DA systems.
In the present study we characterized the sources of NE and E innervations to VTA and retrorubral field (RRF) DA neuron areas using retrograde tract tracing. Lesions of the ventral noradrenergic bundle (VNAB) were performed to corroborate the results found in the tracing experiments. Our results reveal that the RRF is a major recipient of NE inputs, and that the A1 and A2 neurons in the caudal medulla are the major sources of NE innervation to midbrain DA neuron areas. These pathways may provide a means for visceral influences on reward-related DA neurons.
Materials and Methods
Animals.
Male Sprague Dawley rats weighing 300–450 g at the time of surgery were used. Rats were housed two or three per cage under controlled conditions (22−23°C, 40% relative humidity; 12 h light/dark illumination cycle; lights on from 07:00 A.M. to 7:00 P.M.) and allowed free access to commercial chow and tap water. All animal procedures were approved by the Institutional Animal Care and Use Committee of the University of Pennsylvania.
Surgery.
Each animal was anesthetized with a mixture of ketamine (57 mg/kg) and xylazine (8.5 mg/kg), and placed in a stereotaxic frame. Fifteen minutes later, 0.5% halothane anesthesia was administered by spontaneous breathing through a mask on the snout. Halothane was increased to 1% 30 min later, where it was maintained throughout the rest of the surgery. Body temperature was maintained at 36−38°C, using a thermistor-controlled electric heating pad. All incision points were infiltrated with a long-lasting anesthetic (2% Lidocaine).
Differentiation of adrenergic fibers with midbrain DA regions.
Immunostaining for dopamine-β-hydroxylase (DBH) was used to identify NE and E fibers and terminals within midbrain DA regions. Because DBH cannot distinguish between NE and E fibers, we also stained for phenylethanolamine _N_-methyltransferase (PNMT), the enzyme that converts NE to E and is specifically located in E neurons. We stained for tyrosine hydroxylase (TH) to identify DA neurons.
DBH and TH double immunostaining.
Frozen sections (40 μm thick) were collected and incubated in PBS with 1% Triton X-100 (PBST, pH 7.4) for 2 h, and were then incubated at room temperature overnight with a primary monoclonal mouse anti-DBH antibody (1/1000, Millipore Bioscience Research Reagents). After three rinses in 0.3% PBST (10 min each), the sections were incubated for 2 h in biotinylated donkey anti-mouse-IgG (1/1000, Jackson ImmunoResearch Laboratories). They were then rinsed 3 times in 0.3% PBST, and then incubated for 90 min in avidin–biotin–peroxidase complex (ABC, 1/1000, Vector Laboratories). The sections were next rinsed once in 0.3% PBST and twice in PBS and then reacted with the peroxidase kit VectorSG SK-4700 (Vector Laboratories) to produce a blue stain. To immunostain DA neurons, DBH-labeled sections were incubated with a rabbit anti-TH antibody overnight (1/4000, Incstar). The sections were then rinsed 3 times in 0.3% PBST and incubated in biotinylated donkey anti-rabbit-IgG (1/1000, Jackson ImmunoResearch Laboratories) for 2 h. After three rinses in 0.3% PBST, the sections were incubated in ABC (1/1000), rinsed once in 0.3% PBST and twice in 0.05 m Tris buffer, and then reacted with 3,3′-diaminobenzidine tetrahydrochloride (0.02%, DAB; Sigma). This procedure yielded a brown reaction product that was easily distinguished from the blue DBH-positive fibers, allowing simultaneous labeling for both markers.
PNMT and TH double immunostaining.
Sections were incubated in 1% PBST (pH 7.4) for 2 h, followed by incubation at room temperature overnight with a polyclonal rabbit anti-PMNT antibody (1/1000) (a generous gift from Dr. K. Kitahama, previously characterized by Kitahama et al., 1985). The sections were rinsed in 3 changes of 0.3% PBST (10 min each) before being incubated for 2 h in secondary biotinylated donkey anti-mouse-IgG (1/1000, Jackson ImmunoResearch Laboratories). After three rinses with 0.3% PBST, the sections were incubated for 90 min in ABC (1/1000, Vector Laboratories). They were then rinsed once in 0.3% PBST and twice in PBS and then reacted with the peroxidase kit VectorSG SK-4700 (Vector Laboratories) to produce a blue stain. To immunostain DA neurons, PMNT-labeled sections were incubated with a rabbit anti-TH overnight (1/4000, Incstar). The sections were then rinsed 3 times in 0.3% PBST and incubated in biotinylated donkey anti-rabbit-IgG (1/1000, Jackson ImmunoResearch Laboratories) for 2 h. After three rinses in 0.3% PBST, the sections were incubated in ABC (1/1000), rinsed once in 0.3% PBST and twice in 0.05 m Tris buffer, and then reacted with 0.02% DAB. This procedure yielded a brown reaction product that was easily distinguished from the blue of PMNT-positive fibers, allowing simultaneous labeling for both markers.
Retrograde tracer injections.
In 8 animals, midbrain regions containing DA neurons including the VTA, interfascicular (IF), substantia nigra (SN), rostral linear (RL) and central linear (CLi) nuclei of the raphe, and the RRF received unilateral pressure microinjections of the retrograde tracer wheat germ agglutinin conjugated to inactivated horseradish peroxidase coupled to gold particles (WGA-Au; Sigma Chemical). In one animal, WGA-Au was injected in the red nucleus located dorsal to the VTA. WGA-Au (400 nl in 0.9% saline) was microinjected by pneumatic pressure over 5 min using a calibrated micropipette. Seven to 10 d after WGA-Au injection, animals were deeply anesthetized with sodium pentobarbital (65 mg/kg, i.p.) and perfused transcardially through the ascending aorta with 0.9% saline solution, followed by 4% paraformaldehyde in 0.1 m PB, pH 7.4. The brains were removed immediately, stored in the same fixative overnight at 4°C, and then transferred to 20% sucrose in 0.1 m PB containing 0.1% sodium azide at 4°C.
In 12 animals, midbrain regions containing DA neurons including the VTA, IF, SN, RL and CLi nuclei of the raphe, and the RRF received unilateral iontophoretic injections of cholera toxin B subunit (CTb; List Biological Laboratories). In three animals, CTb was iontophoresed in the red nucleus, mammillary bodies, or interpeduncular nucleus (IPN). CTb (0.5%) was dissolved in 0.1 m PB, pH 6.0), as previously described (Luppi et al., 1995). The tracer was delivered iontophoretically via glass micropipettes (tip diameter 10–25 μm) using positive current pulses (+2 μA, 7 s on/7 s off, 15–20 min; one injection per animal). Seven days or 6 weeks after CTb injections, each animal was deeply anesthetized with sodium pentobarbital (65 mg/kg, i.p.) and perfused transcardially through the ascending aorta with 0.9% saline followed by 4% paraformaldehyde in 0.1 m PB, pH 7.4. The brain was removed immediately, stored in the same fixative overnight at 4°C, and then transferred to 20% sucrose in 0.1 m PB containing 0.1% sodium azide for 1–2 d at 4°C.
Detection of the retrograde tracer in NE and E neurons.
WGA-Au was detected with silver histochemistry. Sections were incubated in the Intense BL silver enhancement solution (GE Healthcare Bio-Sciences) for 30 min at room temperature to visualize gold granules, as described previously (Drolet et al., 1992).
CTb was detected by immunohistochemistry. Briefly, sections were incubated in 2% normal donkey serum (Jackson ImmunoResearch) containing 0.3% PBST for 2 h and then incubated overnight at room temperature in goat anti-CTb primary antibody (1:20,000; List Biological). After washes, the sections were placed sequentially for 90 min at room temperature in biotinylated donkey anti-goat IgG (1:1000; Jackson ImmunoResearch) and ABC (1:1000; Elite ABC Kit, Vector). They were then rinsed once in 0.3% PBST and twice in PBS and then reacted with the peroxidase kit VectorSG SK-4700 (Vector Laboratories) to produce a blue stain.
To identify catecholamine neurons in tissue previously processed for WGA-Au or CTb, we stained sections with an anti-TH (A1, A2, A5 and LC areas) or ant-PNMT antibody (C1, C2, and C3 areas), as described above. CTb labeling (dark blue stain) filled the somata in some neurons, making identification of TH or PNMT colabeling difficult at low-power. In such cases, we examined cells at high-power and adjusted the focus and luminance of the section. TH or PMNT staining could be observed in dendrites or axons of cells despite dense CTb labeling in the somata, permitted unambiguous identification of dually labeled neurons.
Cell counting.
Cell counting was performed on sections 240 μm apart throughout the extent of each adrenergic nucleus. We counted every cell found in each section for which the whole cell body was present. DBH immunohistochemistry does not distinguish between NE and E elements. Therefore, to avoid confusing E and NE cells, we identified sections with corresponding plates from the atlas of TH, DBH, and PMNT systems in the rat medulla published by Kalia et al. (1985), as well as with our sections stained for PMNT, to demark boundaries between E and NE in the nucleus of the solitary tract (A2 and C2 areas), and in the ventrolateral medulla (A1 and C1 areas).
Ventral noradrenergic bundle 6-hydroxydopamine lesions.
Eleven animals were anesthetized and placed in a stereotaxic frame (Kopf instruments, Tujunga, CA). In six animals a calibrated glass micropipette filled with 6-hydroxydopamine (6-OHDA, 3 μg/μl in 0.1% ascorbic acid/0.9% saline) was directed toward the VNAB using the following coordinates from bregma, anteroposterior: −6.6 mm, mediolateral: ±2.0 mm, dorsoventral: −8.2 and −9.2 mm from skull, incisor bar +5.0 mm. 6-OHDA was pressure injected bilaterally, each injection lasted 4 min (0.25 μl/min). The micropipette was kept in place an additional 15 min at each site to allow the tissue to absorb the infusion and limit diffusion upward along the micropipette tract. Five animals were used as controls. They underwent surgery and vehicle (0.1% ascorbic acid in 0.9% saline) was pressure injected bilaterally at the same coordinates as 6-OHDA in the lesioned animals. Two to 3 weeks after injection, rats were killed and tissue was histologically processed.
Verification of VNAB lesions.
DBH immunostaining in the ventral bed nucleus of the stria terminalis (BNST) was used to analyze the success of VNAB lesions because of its high density of innervation from the ventral NE bundle (Aston-Jones et al., 1999; Delfs et al., 2000; Forray et al., 2000). We counted DBH varicosities in the cortex to determine whether VNAB lesions to affected NE projections from the LC.
Quantification of varicosities.
Quantification of DBH-immunostained varicosities was performed using a Leica DMRBE microscope and computer equipped with StereoInvestigator software version 6 (MicroBrightField). The VTA or RRF was delimited by TH immunostaining, and a grid of a predetermined size was placed over the entire region to produce between 28 and 34 counting fields. The dimensions of the counting field volume were 8 μm × 8 μm, and 5 μm in thickness. To avoid irregularities on the surface of the section our window began 2 μm from the surface. Varicosities were counted for three purposes: quantification of DBH varicosity densities across midbrain DA regions, determination of the effectiveness of VNAB lesions in eliminating innervation in the RRF and VTA, and verification that VNAB lesions were specific and did not alter NE innervation in targets of the dorsal NE bundle.
For the determination of DBH varicosities across midbrain DA regions, 6 brains were cut at 40 μm-thickness and every sixth section of the midbrain DA regions was immunostained as described in Materials and Methods. Varicosities were quantified in sections containing RRF, CLi, RL, IF, substantia nigra lateralis (SNl), and substantia nigra pars reticulata (SNr) and the mean value per area was calculated. The SN and VTA were subdivided into three rostrocaudal levels: rostral to IF, caudal to IF, and central (coincident with IF).
VTA counting was performed at a level corresponding to approximately −5.30 from bregma (Paxinos and Watson, 1998) to determine the effectiveness of the VNAB lesions. For the RRF, counting was performed at a level of −6.9 from bregma. To determine that the VNAB lesions did not compromise fibers in the dorsal NE bundle DBH, varicosities were also measured in the motor cortex.
DBH fiber content within the BNST.
The optical density threshold for DBH immunohistochemistry within the BNST was performed using Image-Pro 6 (Media Cybernetics, Inc). The threshold was set to selectively detect DBH axons within the ventrolateral BNST. The percentage of area covered by DBH axons as a fraction of the total area was established and used as an index of adrenergic innervation.
Analyses of afferent and efferent relative strength.
Afferent relative strength was used to qualitatively describe the proportion that each adrenergic input provided of the total NE or E input to each midbrain DA region. We calculated afferent relative strength as the percentage of double labeled cells in each adrenergic nucleus from the total number of double labeled cells for each injection case. This was followed by grouping cases by midbrain area injected (for example the RRF) and calculating the mean percentage of double labeled neurons for each adrenergic nucleus.
Efferent relative strength was used to qualitatively describe the relative proportion of the total adrenergic outputs for each adrenergic nucleus that projected to each individual midbrain DA region. We calculated the efferent relative strength by first determining the average number of double labeled cells in each NE or E nucleus for each midbrain DA region injected. Then, these averages across the different injection sites were summed to yield a total efferent output for each adrenergic nucleus. The efferent relative strength was calculated by dividing the average number of retrogradely labeled neurons in each adrenergic nucleus for a specific DA cell area injected by the total efferent output of that adrenergic nucleus.
Statistics.
Parametric statistics were performed after verifying compliance for normal distribution and equal variance. Unpaired t tests were used to compare between groups, and paired t tests or repeated measures ANOVAs were used to compare within group variables. Newman–Keuls post hoc test was used to establish difference in means after the ANOVA. A criterion of p < 0.05 was used for significance.
Results
RRF receives a dense adrenergic innervation
DBH-positive fibers were found through all midbrain dopamine neuron regions, including A8, A9 and A10 cell areas (Fig. 1). The highest density of DBH+ varicosities among these regions was observed in the A8 cell area in the RRF (repeated measures ANOVA F(11,44) = 19.97 p < 0.0001, Newman–Keuls p < 0.001) (Fig. 2). Within the A10 area, DBH+ varicosities were observed in high abundance in IF, RL and CLi, and VTA. Varicosities were observed also within the A9 area including substantia nigra pars compacta (SNc) and SNl. Because some DA neurons are located in SNr, we also quantified DBH+ varicosities in that region. The density of DBH+ varicosities of the SNr was similar to that of other regions of the SN, but less that all of the A10 subregion with the exception of the rostral part of the VTA (VTAr, Newman–Keuls <0.05). The central part of the VTA (VTAce) and CLi had more DBH+ varicosities than any A9 subregion (Newman–Keuls <0.05).
Figure 1.

DBH fiber innervation of midbrain dopamine areas. DBH immunostaining is dark blue, TH staining is brown. The tissue was counterstained with methyl green. Arrows indicate examples of DBH varicosities. Notice that the density of varicosities varied between areas. The RRF (A8 area) was densely covered by DBH varicosities. DBH varicosities were observed in substantia nigra (A9 area) as well as in different subregions of the A10 area.
Figure 2.

Density of DBH+ varicosities within midbrain DA regions. SNc and VTA were subdivided rostrocaudally. We used the IF nucleus as a landmark: caudal was defined as caudal to the IF, central was through the extent of the IF, and rostral was defined as rostral to the IF. RRF has the highest density of DBH+ varicosities. A similar density of varicosities was observed across all A9 subregions. The density of DBH+ varicosities in SNr was smaller than in any A10 subregion with the exception of VTAr. CLi and VTAce have a higher density of DBH+ varicosities compared with any of the A9 subregions. a, Different from all other midbrain regions; b, different from SNr; c, different from VTAce and CLi. VTAca, Caudal ventral tegmental area; SNcr, rostral substantia nigra compacta; SNcce, central substantia nigra compacta; SNcca, caudal substantia nigra compacta.
DBH+ varicosities were not distributed uniformly and were more dense in areas in close proximity to the VNAB that runs dorsal to the medial lemniscus. More varicosities were observed in midbrain areas near the VNAB, as is the case for the RRF, the medial part of the SNl, the lateral parts of the VTA, and some parts of the SNc.
We used PNMT immunostaining to differentiate E from NE fibers. The extent of PNMT fiber innervation was more restricted than that of DBH fibers. We found PNMT fiber and terminal staining within A8, A9 and A10 areas, and the densities of innervation followed a distribution similar to that for DBH staining (Fig. 3).
Figure 3.

PNMT fiber innervation of midbrain dopamine areas. PMNT immunostaining is dark blue, TH staining is brown. The tissue was counterstained with methyl green. Arrows indicate examples of PNMT varicosities within the VNAB subjects. Notice that the density of varicosities varied between areas. The RRF (A8 area) was densely covered by PMNT varicosities. Lesser amounts of PMNT varicosities were observed in substantia nigra (A9 area) and the A10 area.
Topography of adrenergic innervation to midbrain DA neurons
The general pattern observed was that A1, A5, LC, and C1 innervated DA cell areas located toward the midline within the RL and CLi. LC and A5 innervated the medial part of VTA, whereas lateral VTA and RRF received fibers from A1, A2, A5 and LC in addition to a strong innervation from C1 A2 area. A second characteristic was that LC and A5 innervated the midbrain bilaterally, whereas A1, A2, C1, C2, and C3 were mainly ipsilateral in their projections. We also observed a preferential innervation from NE nuclei over E nuclei, as can be appreciated in Figures 2 and 3. Also, the number of double-labeled neurons (retrograde tracer + DBH or retrograde tracer + PMNT) was higher after microinjections made within the RRF than within VTA, RL, CLi, or IF regions. This indicates that the RRF may receive a greater NE and E innervation than the other DA cell areas examined.
Figure 4 presents examples of retrogradely labeled neurons. Injection sites for WGA-Au and CTb are plotted on Figures 5 and 6.
Figure 4.

Retrograde labeling of NE neurons in the A1, A2 and LC cell groups, and of E neurons in the C1 and C3 areas, after an injection of WGA-Au into the RRF-A8 area. Cells doubly labeled for WGA-Au (black granules) and TH (brown) in NE neurons, and for WGA-Au and PNMT (brown) in E neurons, shown with arrowheads.
Figure 5.
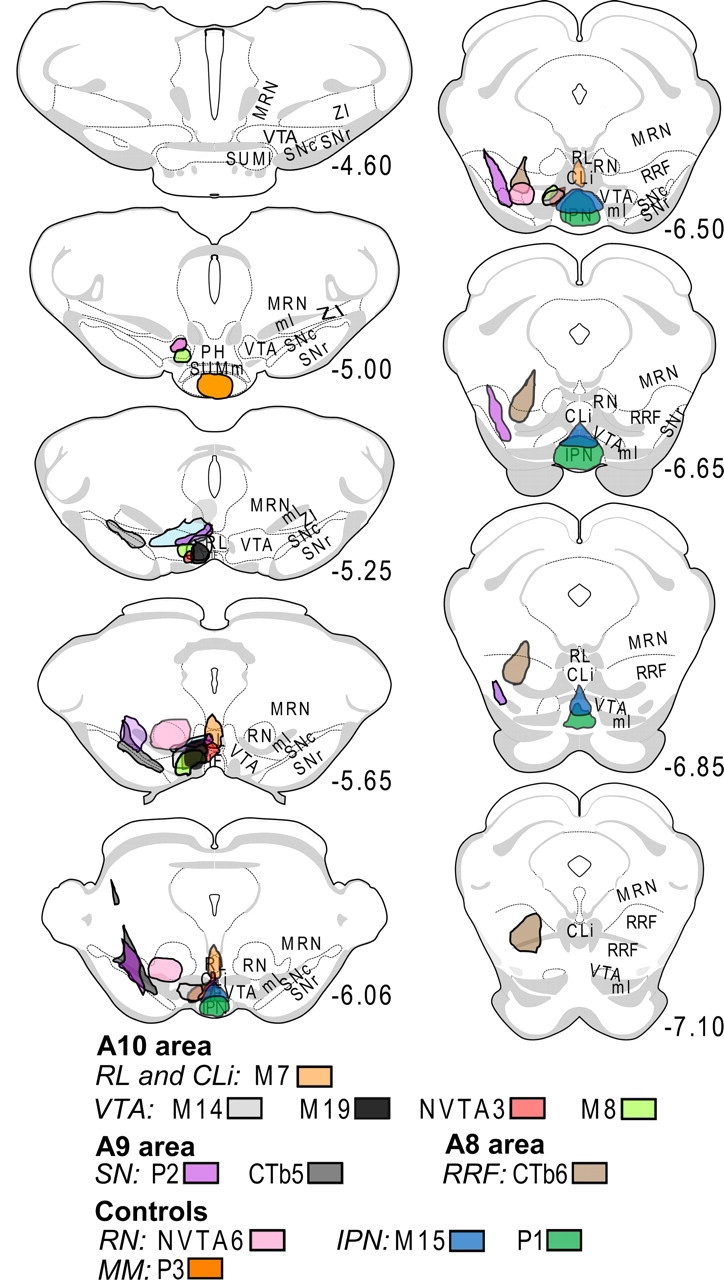
Placements of CTb injections in A8, A9 and A10 midbrain DA regions. Coordinates correspond to the distance from bregma. Coronal plates were obtained from Swanson's rat brain atlas (Swanson, 1992). Injections were performed in the left hemisphere. ml, Medial lemniscus; MRN, midbrain reticular nucleus; RN, red nucleus; MM mammilary nucleus; SUMm, medial supramammilary nucleus; SUMl, lateral supramammilary nucleus; PH, posterior hypothalamus; ZI, zona incerta.
Figure 6.
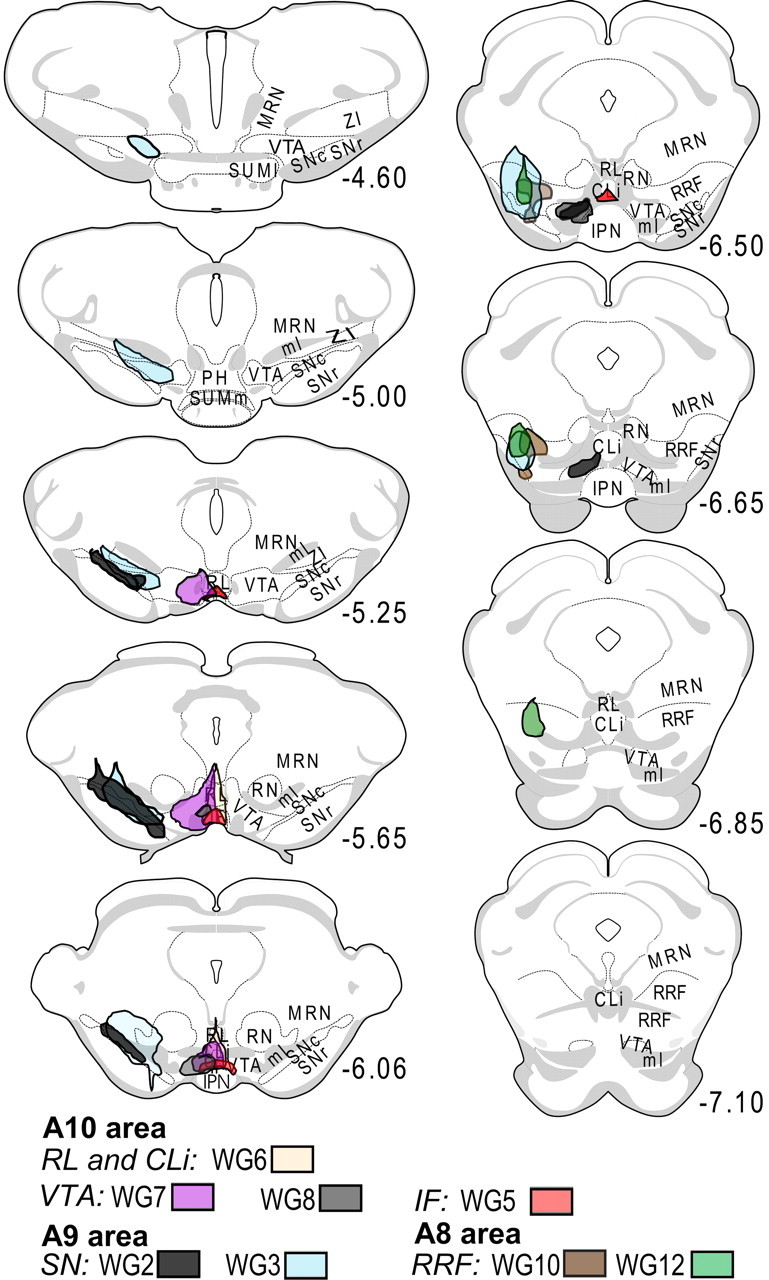
Placements of WGA-Au injections in A8, A9 and A10 midbrain DA regions. Coordinates correspond to the distance from bregma. Coronal plates were obtained from Swanson's rat brain atlas (Swanson, 1992). Injections were performed in the left hemisphere. ml, Medial lemniscus; MRN, midbrain reticular nucleus; RN, red nucleus; SUMm, medial supramammilary nucleus; SUMl, lateral supramammilary nucleus; PH, posterior hypothalamus; ZI, zona incerta.
Adrenergic afferents to A8/RRF DA cell area
Microinjection with CTb
The CTb injection in case CTb6 extended throughout the rostrocaudal extent of the A8 area (Fig. 5). Ipsilateral to the microinjection site retrograde labeling in the C1 area was the most robust, followed by an approximately equal labeling A1, A2, and LC. Double labeled cells in the A5 and C3 areas were also observed. Contralateral to the injection site double labeled cells were primarily found in LC and the A5 area (Table 1).
Table 1.
Numbers of NE and E retrogradely labeled neurons after injection of the RRF
| Adrenergic nuclei | Case number | ||
|---|---|---|---|
| CTb6 | WG10 | WG12 | |
| NE nuclei | |||
| A1 | 32|2 | 52|12 | 45| 6 |
| A2 | 33|2 | 44|6 | 64| 5 |
| A5 | 12|12 | 15|9 | 28|25 |
| LC | 30|12 | 12|8 | 26|25 |
| A7 | –|– | 1|0 | 2|3 |
| Total | 107|28 | 124|35 | 165|64 |
| E nuclei | |||
| C1 | 45|3 | 98|8 | 44|4 |
| C2 | 0|0 | 8|0 | 6|0 |
| C3 | 9|1 | 22|1 | 8|1 |
| Total | 54|4 | 128|9 | 58|5 |
Microinjections with WGA-Au
Similar to case CTb6, cases WG10 and WG12 (Fig. 7) confirmed afferents to RRF arriving from A1, A2, A5, LC and C1 (Fig. 6, Table 1). Case WG10 confirmed the robust ipsilateral innervation seen in case CTb6 from the C1 area; however in case WG12 the A2 area contained more double-labeled neurons than the C1 area. In all RRF cases, contralateral to the injection site the innervation arrived primarily from LC and the A5 area.
Figure 7.
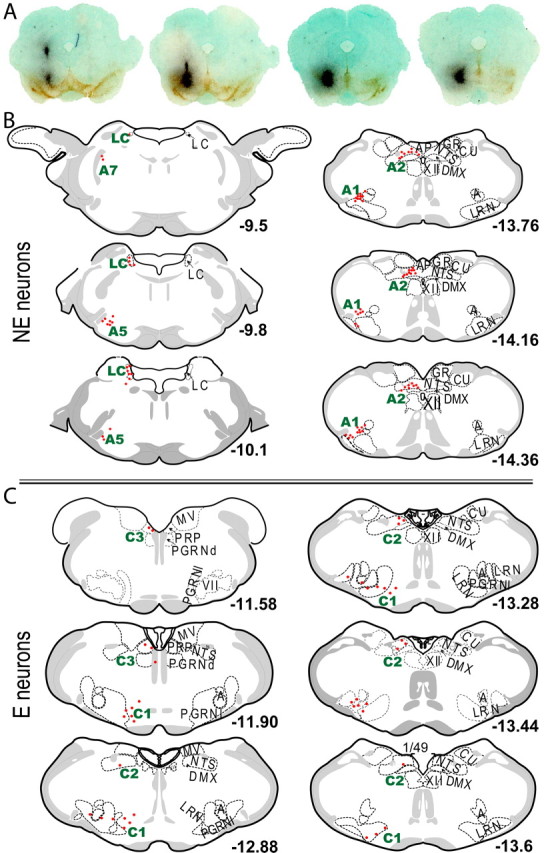
Adrenergic afferents to the RRF. A, Images of the retrograde tracer injection sites. The dark black represents the WGA-Au, and the brown immunostaining reveals TH. B, Plots of the anatomical locations of NE retrogradely labeled neurons within the LC, A5, A2 and A1 areas. C, Plots of the anatomical locations of E retrogradely labeled neurons within the C1, C2 and C3 areas. A, Nucleus ambiguus; AP, area postrema; CU, cuneate nucleus; DMX, dorsal motor nucleus vagus nerve; GR, gracile nucleus; LRN, lateral reticular nucleus; MV, medial vestibular nucleus; NTS, nucleus of the solitary tract; PGRNd, paragigantocellular reticular nucleus, dorsal part; PGRNl, paragigantocellular reticular nucleus, lateral part; PRP, nucleus prepositus; VII, facial nucleus, XII, hypoglossal nucleus.
Adrenergic afferents to the SN
In general, we observed that SN injection of WGA-Au retrogradely labeled an order of magnitude more neurons than did CTb. Projections to SN from LC, A2 and C1 areas were observed in all cases regardless of the tracer used (Table 2). In animals injected with CTb into SN (Fig. 5, cases P2 and CTb5), the numbers of double labeled neurons were greater in LC than in A1 or A2. E neurons were double-labeled in the C1 area in both cases.
Table 2.
Numbers of NE and E retrogradely labeled neurons after injection of the SN
| Adrenergic nuclei | Case number | |||
|---|---|---|---|---|
| P2 | CTb5 | WG2 | WG3 | |
| NE nuclei | ||||
| A1 | 1|0 | 5|3 | 77|8 | 56|2 |
| A2 | 4|1 | 5|0 | 79|9 | 56|11 |
| A5 | 3|2 | 0|0 | 18|7 | 29|24 |
| LC | 9|7 | 7|4 | 39|12 | 72|58 |
| A7 | 0|0 | 0|0 | 2|2 | 5|3 |
| Total | 17|10 | 17|7 | 211|38 | 218|88 |
| E nuclei | ||||
| C1 | 3|0 | 5|2 | 29|5 | 91|10 |
| C2 | 1|0 | 0|0 | 11|0 | 32|2 |
| C3 | 2|0 | 1|0 | 2|0 | 7|1 |
| Total | 6|0 | 6|2 | 42|5 | 130|13 |
An unexpected finding was the high number of double-labeled neurons after WGA-Au injections into SN, especially in view of the fact that DBH positive fibers were less numerous in SN that in the RRF or VTA (Fig. 2). In both of these cases, part of the injection site covered the lateral VTA; notably, the VNAB travels dorsal to the lateral VTA within the medial lemniscus. Therefore, it seems possible that WGA-Au in these cases was taken up by fibers passing within the lateral VTA and perhaps the VNAB as well as by NE fibers terminating in the SN.
Case WG3 produced the same pattern of retrograde labeling as the CTb cases, with more double-labeled neurons in LC than in the other NE cell groups examined. In this case we also observed a robust innervation from the C1 area that resembled that seen after injections into RRF; in fact, the injection in case WG3 spread somewhat into the RRF (Fig. 6). Ipsilateral to the injection site, the A1 area and LC had the largest numbers of double-labeled cells, followed by the A1 and A2 areas. This case also revealed prominent double labeling in A5 and C2 areas, and more minor afferents from the C3 and A7 areas. Contralateral to the injection site afferents arrived primarily from the LC and A5 areas, with a minor component from the A2 and C1 areas (Table 2).
The injection in case WG2 was more restricted to the SN than in case WG3, with slight spread into the lateral part of the VTA toward its anterior portion (Fig. 6). Ipsilateral to the injection, the major innervation arrived from the A1 and A2 areas, followed by projections from the LC and C1 areas. Double labeled neurons were also found in C2 and A5 to a lesser degree. Contralateral to the injection site LC, A1, A2, and A5 areas were the main NE afferent sources. The C1 contralateral to the injection also contained double labeled neurons. The extent of contralateral double labeled neurons was higher for LC and the A5 area than for other NE nuclei examined.
Adrenergic afferents to medial VTA
Microinjections with CTb
Three cases had injections of CTb focused in the medial part of VTA. In case M8, the injection covered the medial VTA throughout its rostrocaudal axis, and both the parabrachial and the paranigral components in the dorsoventral axis were included (Fig. 5). This case revealed a preferential NE innervation from LC and the A5 area. A few double labeled cells were also found in the A1 and A2 areas, and only one cell was found in the C1 area and A7 area (Table 3). Case M19 had a similar but somewhat smaller injection site that covered both parabrachial and paranigral areas, and covered mainly the caudal VTA at the level of the IPN (Fig. 5). Case M19 confirmed the LC and A5 as major sources of NE innervation to the medial VTA area. No double-labeled neurons were found in any other NE or E nuclei examined (Table 3).
Table 3.
Numbers of NE and E retrogradely labeled neurons after injection of the medial part of the VTA
| Adrenergic nuclei | Case number | ||||
|---|---|---|---|---|---|
| mVTAM8 | mVTAM14 | mVTAM19 | mVTANVTA3 | mVTA + IF +CLiWG8 | |
| NE nuclei | |||||
| A1 | 4|0 | 2|0 | 0|0 | 1|0 | 26|13 |
| A2 | 2|0 | 0|1 | 0|0 | 4|1 | 13|4 |
| A5 | 12|15 | 5|7 | 2|0 | 3|2 | 18|19 |
| LC | 26|14 | 6|8 | 8|9 | 9|7 | 10|2 |
| A7 | 0|1 | 0|0 | 0|0 | 0|0 | 1|1 |
| Total | 44|30 | 13|16 | 10|9 | 17|10 | 68|39 |
| E nuclei | |||||
| C1 | 1|0 | 1|0 | 3|0 | 17|3 | |
| C2 | 0|0 | 0|0 | 1|0 | 3|1 | |
| C3 | 0|0 | 0|0 | 2|0 | 4|3 | |
| Total | 1|0 | 1|0 | 6|0 | 24|7 |
In case M14, the injection site was focused in the parabrachial subregion and extended into the anterior VTA (Fig. 5). Retrogradely labeled NE cells were mainly in LC and the A5 area, with few neurons in the A1 and A2 areas.
Microinjection with WGA-Au
Only case WG8 had a WGA-Au injection located within the medial VTA (Fig. 8). The center of the injection was toward the posterior part of the VTA as revealed by the presence of the interpeduncular nucleus. Similar to CTb cases, WG8 revealed retrogradely labeled neurons in the LC and A5 area. However, retrogradely labeled neurons were also found in the A1, A2 and C1 areas.
Figure 8.
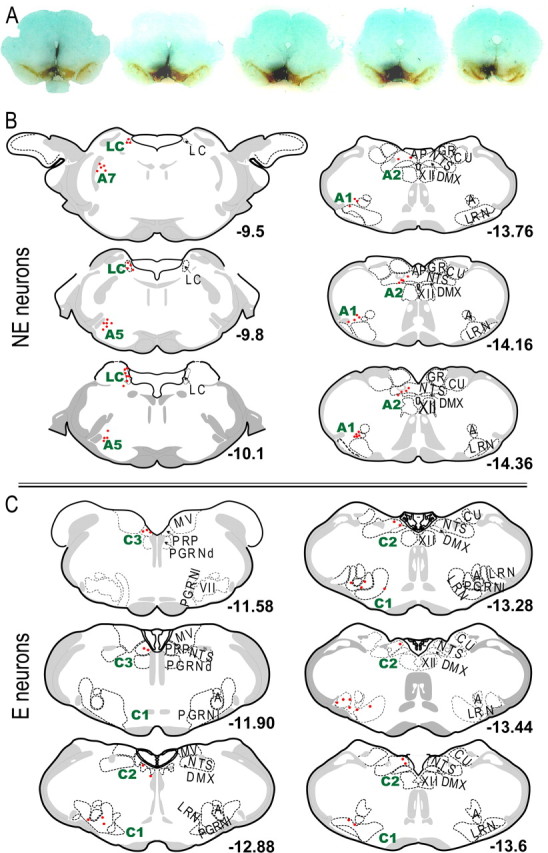
Adrenergic afferents to the VTA area. A, Images of retrograde tracer injection sites. The dark black represents WGA-Au, and the brown shows immunostaining for TH. B, Plots of the anatomical locations of NE retrogradely labeled neurons within the LC, A5, A2 and A1 areas. C , Plots of the anatomical locations of E retrogradely labeled neurons within the C1, C2 and C3 areas. A, Nucleus ambiguus; AP, area postrema; CU, cuneate nucleus; DMX, dorsal motor nucleus vagus nerve; GR, gracile nucleus; LRN, lateral reticular nucleus; MV, medial vestibular nucleus; NTS, nucleus of the solitary tract; PGRNd, paragigantocellular reticular nucleus, dorsal part; PGRNl, paragigantocellular reticular nucleus, lateral part; PRP, nucleus prepositus; VII, facial nucleus; XII, hypoglossal nucleus.
Adrenergic afferents to the IF nucleus
Case WG5 was confined to the IF nucleus (Table 4). The major afferents appeared in LC and A5, followed by inputs from the A1 and C1 areas. A smaller number of double labeled neurons was also seen the A2 area. The IF is located at the midline, and a similar number of double-labeled afferents was observed in both hemispheres (Table 3).
Table 4.
Numbers of NE and E retrogradely labeled neurons after injection of the IF, RL and CLi
| Adrenergic nuclei | Case number | |||
|---|---|---|---|---|
| IFWG5 | RL + CLiWG6 | RL + CLi + MVTAWG7 | RL + CLiM7 | |
| NE nuclei | ||||
| A1 | 11|16 | 14|10 | 23|18 | 17|10 |
| A2 | 6|4 | 9|12 | 25|25 | 13|11 |
| A5 | 21|16 | 10|18 | 13|9 | |
| LC | 28|32 | 12|11 | 2|4 | |
| A7 | 0|0 | 1|0 | 2|1 | |
| Total | 66|68 | 46|51 | 65|57 | |
| E nuclei | ||||
| C1 | 12|12 | 3|2 | 5|4 | 6|2 |
| C2 | 0|4 | 3|1 | 4|2 | 0|0 |
| C3 | 2|2 | 2|2 | 3|1 | 3|3 |
| Total | 14|18 | 8|5 | 12|7 | 9|5 |
Adrenergic afferents to the RL and CLi nuclei
Case WG6 was confined to the RL and CLi (Fig. 6, Table 4). The largest numbers of double labeled neurons in this case were found in the A1, A2, A5 areas and the LC. A minor E input was observed with equal proportions from C1, C2 and C3 nuclei. Case WG7 contained afferents from the same NE nuclei, but the number of double-labeled neurons from A1 and A2 were higher than from A5, and a weaker innervation was found from LC. A small number of E neurons were also retrogradely labeled in case WG7; the number of these in the C1 area was higher than in the C2 or C3 areas.
Control cases
Interpeduncular nucleus
CTb microinjection into the IPN retrogradely labeled neurons in LC and the A7 area (Fig. 5, Table 5). The LC labeling is consistent with previous reports using fast blue (Hamill and Jacobowitz, 1984) and HRP (Marchand et al., 1980).
Table 5.
Numbers of NE and E retrogradely labeled neurons after injection of the interpeduncular nucleus or the red nucleus
| Adrenergic nuclei | Case number | |||
|---|---|---|---|---|
| MMP3 | IPNM15 | IPNP1 | RN + mRRFNVTA6 | |
| NE nuclei | ||||
| A1 | 0|0 | 0|0 | 0|0 | 19|1 |
| A2 | 0|0 | 0|0 | 0|0 | 4|0 |
| A5 | 2|3 | 0|0 | 0|0 | 1|1 |
| LC | 11|7 | 3|11 | 10|12 | 11|21 |
| A7 | 0|0 | 1|0 | 4|2 | 4|0 |
| E nuclei | ||||
| C1 | 0|0 | 0|0 | 0|0 | 11|0 |
| C2 | 0|0 | 0|0 | 0|0 | 0|0 |
| C3 | 0|0 | 0|0 | 0|0 | 9|1 |
Red nucleus
An injection of CTb that included the red nucleus revealed retrograde labeling in the contralateral nucleus interpositus in the lateral cerebellum (Bernays et al., 1988). In case NVTA6, two thirds of the injection was within the red nucleus, although the most posterior part of the injection also included the medial RRF (Fig. 5). Retrogradely labeled NE neurons in the medulla were observed primarily in the A1 area, with a minor representation also in the A2 area. At the level of the pons, retrogradely labeled neurons were present in LC bilaterally, with a preference for the contralateral side. Only 2 retrogradely labeled neurons were found in the A5 area. E retrogradely labeled neurons were found ipsilateral to the injection site in the C1 and C3 areas (Table 5).
Mammillary nucleus
Injection of CTb into the mammillary nuclei retrogradely labeled neurons in LC and the A5 area (case P3; Fig. 5, Table 5). No other adrenergic afferents were observed.
Relative strength of adrenergic innervation to midbrain DA neurons from different sources
Cases with injections of retrograde tracers in similar regions yielded similar patterns and relative numbers of double labeled neurons (see Tables 1 through 5). Therefore, cases with similar injection sites were combined for analysis to identify patterns of innervation. To examine the relative strength of adrenergic afferents to different midbrain DA areas, we compared the percentages of adrenergic neurons that were retrogradely labeled in each adrenergic nucleus from injections made in the RRF, RL and CLi, IF or mVTA, as described in Materials and Methods. Because the number of injection cases in each region was not sufficient for a thorough statistical analysis, the results of these analyses are only qualitative. However, the patterns of innervation observed were confirmed by quantitative analyses of lesions of NE pathways, which are described later.
Figure 9 center shows the topographical arrangement of the adrenergic afferents to midbrain DA neurons. Each pie chart reflects the relative proportion of that DA area's NE or E innervation that originates in each specific NE or E source nucleus. The afferent relative strength to the RRF was highest for innervation from C1 neurons, followed by the A1 and A2 areas, and then LC and the A5 area. RL and CLi received a similar strong innervation from A1, A2 and A5, followed by a less robust innervation from LC. It is important to notice that in IF and mVTA the proportion of NE afferents from the LC and A5 increased compared with other nuclei.
Figure 9.
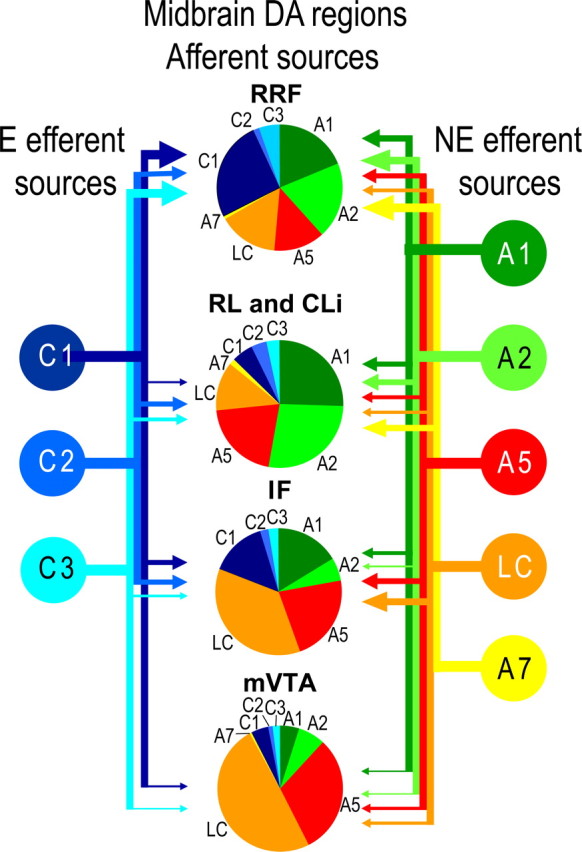
Summary of the adrenergic innervation to midbrain DA regions. Pie pieces in the center represent the relative strengths of different sources of NE and E innervation (relative afferent strength) to RRF, RL and CLi, IF, and mVTA. The relative strengths of efferents from adrenergic nuclei are represented by arrows on the sides of the figure. The sizes of the arrow heads are proportional to the numbers of adrenergic neurons retrogradely labeled from injections in specific midbrain DA regions. Notice that the RRF received a robust proportion of the adrenergic efferents from each of the adrenergic nuclei, whereas the mVTA received the smallest proportions of adrenergic efferents. These analyses for this summary are qualitative because the numbers of injection cases in each area were not sufficient for statistical tests. However, results were quantitatively confirmed by lesion experiments (Figs. 10–12).
We also examined the relative strength of NE or E efferents from each adrenergic nucleus to RRF, RL and CLi, IF or mVTA, as described in Materials and Methods. The arrowheads at the side of Figure 9 provide estimates of the proportion of each adrenergic efferent nucleus that projects to a specific midbrain DA area. The main pattern observed was that a high proportion of NE or E efferents terminated in the RRF, as can be observed by the sizes of the arrowheads. Conversely, efferents to mVTA were the weakest, when compared with other midbrain DA regions. The IF received the densest innervation by LC neurons in this analysis.
Ventral-bundle lesions confirmed A1, A2 and C1 as major adrenergic afferents to midbrain DA regions
We decided to confirm our tract-tracing with lesions of the VNAB and quantification of the resulting reduction in DBH varicosities in DA cell areas. Electron microscopy studies have shown that DBH-positive varicosities are axonal areas with a high density of vesicles that form symmetric and asymmetric synaptic junctions, but also may lack morphologically identifiable synaptic junctions and provide extrasynaptic release (Aoki et al., 1998). Therefore, quantification of NE varicosities in was taken as an index of NE innervation and release sites.
Lesions of VNAB fibers were performed by microinjecting 6-OHDA posterior to the LC and dorsal to the A5 area (Fig. 10). The placement of these injections was chosen to avoid leakage of the 6-OHDA upward into the dorsal noradrenergic fiber bundle, or into the A7 and A8 areas that are situated nearby the VNAB rostral to LC. We also selected this injection site to affect adrenergic efferents coming from the A1, A2 and C1 areas (Sawchenko and Swanson, 1982; Card et al., 2006). Confirmation of the specificity of the lesions was assessed by measuring DBH fiber innervation in the BNST (a major target of A1 and A2 NE fibers) and by quantifying DBH varicosities within motor cortex (an area that receives NE from LC but not from A1 and A2 NE neurons) (Fig. 11) (Ungerstedt, 1971; Loughlin et al., 1982; Aston-Jones et al., 1999; Forray et al., 2000). There was an 81% decrease (range across subjects = 68% to 97%, t(9) = 13.14 p < 0.0001) in the area occupied by DBH fibers within the BNST in lesioned compared with sham surgery subjects. In contrast, LC fibers were not affected by the VNAB 6-OHDA injections because no differences in cortical varicosities were found between lesion and sham subjects (t(9) = 0.52, p = 0.62).
Figure 10.
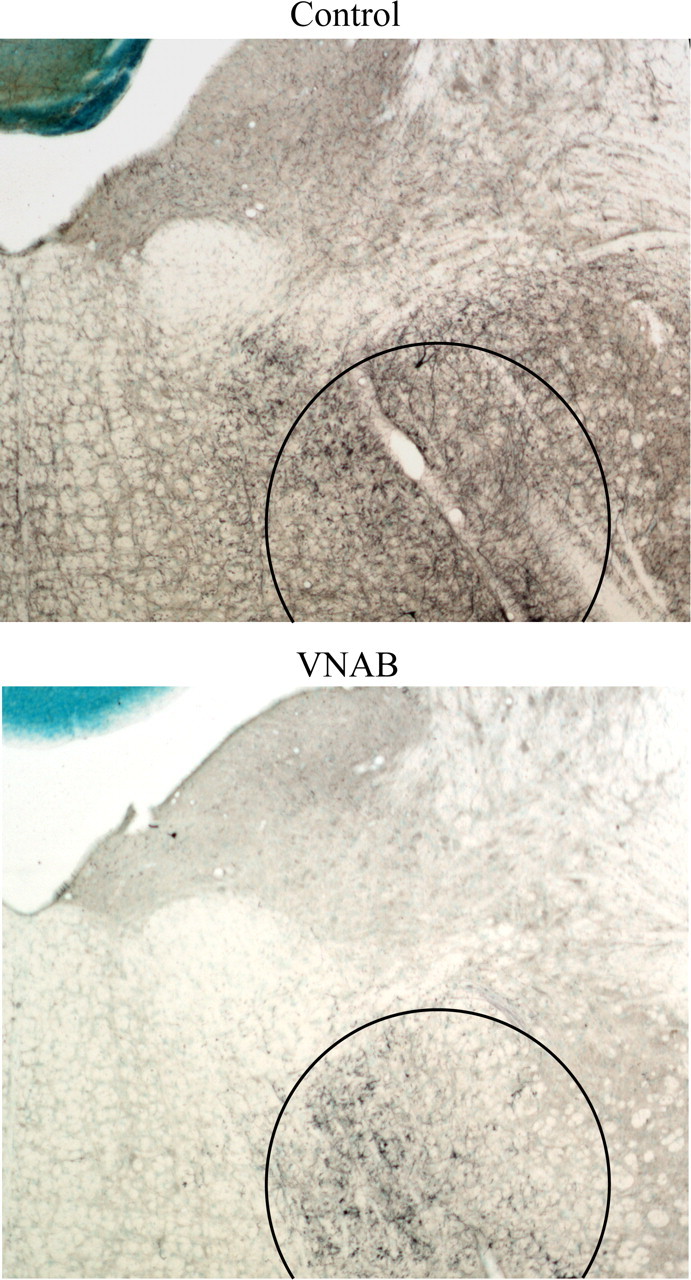
VNAB lesion site. VNAB lesions were performed posterior to the LC to avoid lesioning LC fibers crossing through the ventral bundle or lesioning the A7 or A8 areas in close proximity to the VNAB. Sections were stained for DBH immunodetection (dark blue) and counterstained with methyl green. Top, A nonlesioned animal; notice the abundance of DBH fibers across the section and the VNAB (circled region). Bottom, A lesioned animal; notice the lack of DBH staining in the brainstem and the accumulation of DBH stain at the site of lesioned fibers (circled region).
Figure 11.
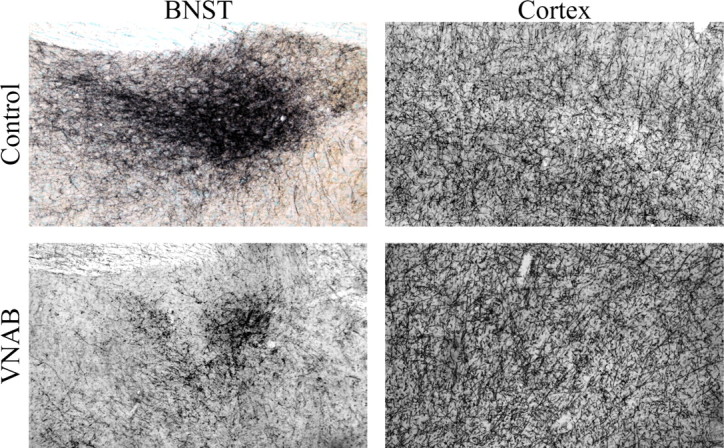
Selectivity of VNAB lesions. Sections were stained for DBH immunoreactivity (dark blue) and counterstained with methyl green. Left panels show sections through BNST from a nonlesioned subject (top), and a lesioned subject (bottom). Right panels show sections from motor cortex of a nonlesioned subject (top), and a lesioned subject (bottom). The BNST exhibited a robust denervation in VNAB lesioned subjects, whereas no change in the density of DBH varicosities was observed in the cortex of lesioned compared with sham subjects.
Quantification of DBH varicosities in sham subjects confirmed the results of the retrograde tracing experiments, showing a higher adrenergic innervation in RRF than in VTA. Quantification revealed that RRF had 33% more varicosities per μm3 than VTA (Fig. 12, a). VNAB lesions produced a profound decrease in DBH varicosities in both RRF and VTA (70%, t(9) = 10.18, p < 0.0001, and 78%, t(9) = 7.29, p < 0.001, respectively) (Fig. 12, c,d). In lesioned subjects, RRF had 52% more varicosities per μm3 than the VTA (t(5) = 3.49, p = 0.0175), indicating that innervation arriving through the dorsal bundle (the major axonal pathway from LC) as well as the periventricular bundle (with axons from A1 and C1) project preferentially to RRF (Fig. 12, b).
Figure 12.
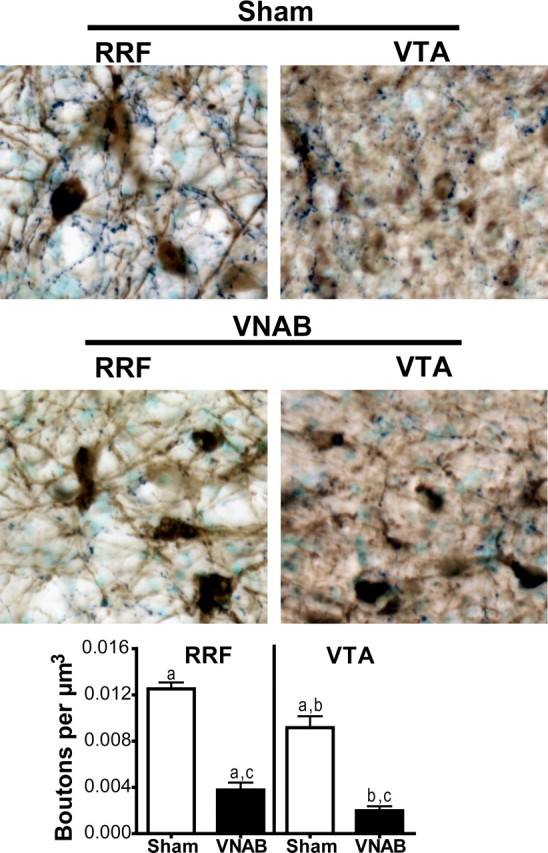
VNAB lesions robustly decreased DBH varicosities within the RRF and the VTA. DBH immunostaining in dark blue, TH staining in brown. The tissue was counterstained with methyl green. Notice a higher content of DBH varicosities in the RRF versus the VTA of sham subjects. This difference in DBH varicosity density was still present after VNAB lesions. In the VNAB-lesioned subjects the density of DBH varicosities is greatly reduced in both RRF and VTA.
Discussion
Our study characterizes the sources of adrenergic innervation to midbrain dopamine areas. The RRF receives the densest adrenergic innervation among the midbrain DA cell areas. Both NE and E neurons project to the RRF and the VTA. The major NE afferents originated from A1, A2, A5 areas and LC, whereas E afferents arrived from the C1 area. Localization of major adrenergic afferents within homeostatic centers in the lower brainstem indicates pathways whereby midbrain DA neurons may receive information about the visceral and physiological status of the animal. Inputs from the LC may also provide information about the arousal state of the animal as well as the about ongoing behavioral performance.
Adrenergic afferents to midbrain DA neuron areas
The RRF received the densest adrenergic innervation
We found a higher content of DBH varicosities within the RRF, and the largest number of retrogradely labeled adrenergic neurons when tracers were placed in the RRF. The sources of adrenergic innervation to RRF were the A1, A2, C1 and A5 areas and the LC. The strong innervation from medullary adrenergic nuclei was confirmed by a 70% reduction of DBH varicosities in RRF after lesion of the VNAB. The remaining adrenergic innervation after the VNAB lesion confirmed the innervation from LC. Our retrograde tracing analysis was consistent with these lesion results, showing that LC contained between 7 and 22% of total adrenergic retrogradely labeled neurons after tracer injection within RRF. The remaining difference may indicate that a few fibers from the VNAB were not affected by the lesion, or may reflect adrenergic fibers from A1 and C1 areas coursing through the periventricular adrenergic bundle that may innervate the RRF (Byrum and Guyenet, 1987; Herbert and Saper, 1992).
The RRF may be functionally distinct from VTA and SN. DA neurons send stronger projections to entorhinal cortex and hippocampus than do DA neurons in SN or VTA; thus, RRF DA cells may serve a modulatory role in declarative and spatial memory, functions associated with entorhinal and hippocampal cortices (Swanson, 1982; Deutch et al., 1988; Gasbarri et al., 1996). Cellular evidence for a role of DA in such memory processes comes from studies in the hippocampus in which late-phase LTP is destabilized by blocking D1 receptors (Huang and Kandel, 1995). Similarly, D1 antagonists can also destabilize the formation of hippocampal place cell spatial maps (Kentros et al., 2004). In humans, binding of hippocampal D2 receptors correlates with performance on verbal and nonverbal visual recall memory tasks, as well as in a working memory task (Takahashi et al., 2007).
The VTA is topographically innervated
LC and A5 areas were the primary sources of adrenergic afferents to the medial aspects of VTA. This was the only location within VTA where NE and E efferents from the medulla were weak. It is also important to note that this region of VTA received a density of DBH varicosities similar to those of IF, RL, or CLi, but it yielded fewer retrogradely labeled neurons after tracer injections, suggesting more branching of terminals from these neurons in target areas. Because of the preferential innervation from the LC compared with other adrenergic nuclei, it is possible that neurons in this region may be most influenced by information arriving from LC-NE neurons.
Toward the midline the RL and CLi were innervated by adrenergic neurons in the A1, A2, C1 and A5 areas and the LC, whereas IF was innervated by the same areas with the exception of A2. The LC innervation may emanate from fibers coursing ventral to the VTA that also innervate the IPN (Marchand et al., 1980; Hamill and Jacobowitz, 1984). Innervation from LC and A5 cells also extend rostrally to VTA, as revealed by retrogradely labeled neurons after the control injection in the mammillary nucleus. It remains unknown whether DA neurons located in the supramammillary nucleus receive their innervation from the LC and A5, or whether A1 and C1 also send fibers to these neurons, because we did not include cases with retrograde tracer injections that targeted the supramammillary nucleus.
We confirmed previous tract-tracing studies describing an NE input from the LC to the VTA (Jones and Moore, 1977; Phillipson, 1979; Simon et al., 1979; Geisler and Zahm, 2005). Afferents from LC were bilaterally located in VTA, similar to what was found by Geisler and Zahm (2005) using fluorogold, but somewhat different from Simon et al. (1979) who described the LC projection as mainly contralateral. It is possible that differences in the uptake of the tracers selected for these different studies [horseradish peroxidase by Simon et al. (1979), fluorogold by Geisler and Zahm (2005), and WGA-Au and CTb in our study] may account for these differences in the laterality of innervation.
Functional implications for adrenergic innervation of midbrain DA neuron areas
Homeostatic centers project to midbrain DA neuron areas
Robust adrenergic projections to midbrain DA neuron areas arrive from the A1, A2, A5, and C1 areas. All of these afferents receive visceral information and participate in homeostatic regulation. For example, A1 neurons are involved in hemodynamic regulation by controlling the release of vasopressin (Blessing and Willoughby, 1985), whereas C1 neurons are barosensitive and are also involved in sodium and water balance (Guyenet, 2006). A5 neurons regulate the respiratory rhythm generator of the rostral ventrolateral medulla (Hilaire et al., 2004), and A2 neurons are involved in the regulation of food intake (Rinaman, 2003). LC receives strong innervation from the ventrolateral medulla and dorsal medial medulla, which may forward visceral information to the LC (Aston-Jones et al., 1986, 1991; Guyenet, 1991). Thus, it seems possible that the information carried by adrenergic fibers to midbrain DA neuron areas is related to the physiological well being of the organism. This may explain DA neural responses to alterations in cardiovascular physiology such as an acute rise in arterial pressure and stimulation of the aortic depressor nerve (Kirouac and Ciriello, 1997). Such visceral inputs may also be involved in the response of DA neurons to primary rewarding stimuli such as food.
Stress is a common activator of adrenergic neurons
Adrenergic neurons in the A1, A2, C1 and C2 areas and LC may also be important in the regulation of DA neurons during stress. Physiological stressors such as cardiovascular, osmotic and immune challenges, as well as psychological stressors including restraint and intermittent footshock, activate these adrenergic cells (Abercrombie and Jacobs, 1987; Morilak et al., 1987; Sawchenko et al., 2000). In the awake rat, restraint stress increases the impulse rate and burst-firing of DA neurons (Anstrom and Woodward, 2005). Similarly, exposure to chronic cold stress increases burst-firing of DA neurons but also causes a 64% decrease in the number of spontaneously active DA cells (Moore et al., 2001). Bursting activity of DA neurons appears to be modulated by α-1 and α-2 adrenoceptors (Grenhoff and Svensson, 1988, 1989, 1993; Gobbi et al., 2001; Paladini et al., 2001), which may indicate a role of the adrenergic innervation to midbrain DA neurons during stress.
Interactions between LC-NE and midbrain DA neurons are important for cognitive performance
An exciting goal of future research is to understand the interaction of LC-NE neurons and midbrain DA neurons in cognitive processes. LC neurons have been shown recently to have phasic and tonic modes of impulse activity, associated with distinct cognitive processes in behaving animals (Clayton et al., 2004; Aston-Jones and Cohen, 2005). The adaptive gain theory of the LC-NE system predicts that the function of the LC in reinforcement learning is to provide an annealing mechanism, in which exploration is favored during learning in new (or changing) environments (associated with the tonic LC mode), and exploitation (focused attention) is promoted when known, reliable sources of reward are discovered (associated with the phasic mode) (Aston-Jones and Cohen, 2005).
The DA system has also been strongly implicated in reinforcement learning. A prominent theory proposes that DA provides a teaching signal in reinforcement learning processes that promotes future predictions about when rewards are likely to occur (Montague et al., 1996, 2004). These ideas lead to a hypothesis for interactions between DA and LC-NE systems during learning and motivated behavior (Aston-Jones and Cohen, 2005). In this view, during the search for a new reward LC tonic firing favors exploration. When a source of new reward is discovered, DA-dependent reinforcement learning strengthens the behavior that produced the reward so that additional reward is more likely to be obtained via that behavior. This, in turn, favors the phasic mode of LC activity which promotes further exploitation of the new source of reward. Conversely, when the current reward is no longer valuable or available, the LC is driven into the tonic mode, promoting exploration and thereby fostering learning a new behavior that produces more remuneration. Although these ideas are speculative at present (as described by Aston-Jones and Cohen 2005), previous results by Grenhoff et al. (1993) showing activation of DA neurons after stimulation of LC and the anatomical data presented here indicates that a direct influence of the LC-NE on DA neurons may be one way that such interactions may be produced, and provides the basis for future experiments to further test such ideas (Jones and Moore, 1977; Phillipson, 1979; Simon et al., 1979; Liprando et al., 2004; Geisler and Zahm, 2005).
Footnotes
This work was supported by United States Public Health Service Grants R37 DA-06214 and F32 DA016877. We thank Dr. Roy Wise for comments on this manuscript, and Drs. Steve Arnold and Marisela Morales for use of imaging facilities.
References
- Abercrombie ED, Jacobs BL. Single-unit response of noradrenergic neurons in the locus coeruleus of freely moving cats. I. Acutely presented stressful and nonstressful stimuli. J Neurosci. 1987;7:2837–2843. doi: 10.1523/JNEUROSCI.07-09-02837.1987. [DOI] [PMC free article] [PubMed] [Google Scholar]
- Anstrom KK, Woodward DJ. Restraint increases dopaminergic burst firing in awake rats. Neuropsychopharmacology. 2005;30:1832–1840. doi: 10.1038/sj.npp.1300730. [DOI] [PubMed] [Google Scholar]
- Aoki C, Venkatesan C, Go CG, Forman R, Kurose H. Cellular and subcellular sites for noradrenergic action in the monkey dorsolateral prefrontal cortex as revealed by the immunocytochemical localization of noradrenergic receptors and axons. Cereb Cortex. 1998;8:269–277. doi: 10.1093/cercor/8.3.269. [DOI] [PubMed] [Google Scholar]
- Arencibia-Albite F, Paladini C, Williams JT, Jiménez-Rivera CA. Noradrenergic modulation of the hyperpolarization-activated cation current (Ih) in dopamine neurons of the ventral tegmental area. Neuroscience. 2007;149:303–314. doi: 10.1016/j.neuroscience.2007.08.009. [DOI] [PMC free article] [PubMed] [Google Scholar]
- Aston-Jones G, Cohen JD. An integrative theory of locus coeruleus-norepinephrine function: adaptive gain and optimal performance. Annu Rev Neurosci. 2005;28:403–450. doi: 10.1146/annurev.neuro.28.061604.135709. [DOI] [PubMed] [Google Scholar]
- Aston-Jones G, Ennis M, Pieribone VA, Nickell WT, Shipley MT. The brain nucleus locus coeruleus: restricted afferent control of a broad efferent network. Science. 1986;234:734–737. doi: 10.1126/science.3775363. [DOI] [PubMed] [Google Scholar]
- Aston-Jones G, Shipley MT, Chouvet G, Ennis M, van Bockstaele E, Pieribone V, Shiekhattar R, Akaoka H, Drolet G, Astier B, et al. Afferent regulation of locus coeruleus neurons: anatomy, physiology and pharmacology. Prog Brain Res. 1991;88:47–75. doi: 10.1016/s0079-6123(08)63799-1. [DOI] [PubMed] [Google Scholar]
- Aston-Jones G, Delfs JM, Druhan J, Zhu Y. The bed nucleus of the stria terminalis. A target site for noradrenergic actions in opiate withdrawal. Ann N Y Acad Sci. 1999;877:486–498. doi: 10.1111/j.1749-6632.1999.tb09284.x. [DOI] [PubMed] [Google Scholar]
- Bernays RL, Heeb L, Cuenod M, Streit P. Afferents to the rat red nucleus studied by means of D-[3H]aspartate, [3H]choline and non-selective tracers. Neuroscience. 1988;26:601–619. doi: 10.1016/0306-4522(88)90168-6. [DOI] [PubMed] [Google Scholar]
- Blessing WW, Willoughby JO. Inhibiting the rabbit caudal ventrolateral medulla prevents baroreceptor-initiated secretion of vasopressin. J Physiol. 1985;367:253–265. doi: 10.1113/jphysiol.1985.sp015823. [DOI] [PMC free article] [PubMed] [Google Scholar]
- Byrum CE, Guyenet PG. Afferent and efferent connections of the A5 noradrenergic cell group in the rat. J Comp Neurol. 1987;261:529–542. doi: 10.1002/cne.902610406. [DOI] [PubMed] [Google Scholar]
- Card JP, Sved JC, Craig B, Raizada M, Vazquez J, Sved AF. Efferent projections of rat rostroventrolateral medulla C1 catecholamine neurons: implications for the central control of cardiovascular regulation. J Comp Neurol. 2006;499:840–859. doi: 10.1002/cne.21140. [DOI] [PubMed] [Google Scholar]
- Cathala L, Guyon A, Eugene D, Paupardin-Tritsch D. Alpha2-adrenoceptor activation increases a cationic conductance and spontaneous GABAergic synaptic activity in dopaminergic neurones of the rat substantia nigra. Neuroscience. 2002;115:1059–1065. doi: 10.1016/s0306-4522(02)00542-0. [DOI] [PubMed] [Google Scholar]
- Clayton EC, Rajkowski J, Cohen JD, Aston-Jones G. Phasic activation of monkey locus ceruleus neurons by simple decisions in a forced-choice task. J Neurosci. 2004;24:9914–9920. doi: 10.1523/JNEUROSCI.2446-04.2004. [DOI] [PMC free article] [PubMed] [Google Scholar]
- Delfs JM, Zhu Y, Druhan JP, Aston-Jones G. Noradrenaline in the ventral forebrain is critical for opiate withdrawal-induced aversion. Nature. 2000;403:430–434. doi: 10.1038/35000212. [DOI] [PubMed] [Google Scholar]
- Deutch AY, Goldstein M, Baldino F, Jr, Roth RH. Telencephalic projections of the A8 dopamine cell group. Ann N Y Acad Sci. 1988;537:27–50. doi: 10.1111/j.1749-6632.1988.tb42095.x. [DOI] [PubMed] [Google Scholar]
- Drolet G, Van Bockstaele EJ, Aston-Jones G. Robust enkephalin innervation of the locus coeruleus from the rostral medulla. J Neurosci. 1992;12:3162–3174. doi: 10.1523/JNEUROSCI.12-08-03162.1992. [DOI] [PMC free article] [PubMed] [Google Scholar]
- Forray MI, Gysling K, Andrés ME, Bustos G, Araneda S. Medullary noradrenergic neurons projecting to the bed nucleus of the stria terminalis express mRNA for the NMDA-NR1 receptor. Brain Res Bull. 2000;52:163–169. doi: 10.1016/s0361-9230(00)00229-x. [DOI] [PubMed] [Google Scholar]
- Gasbarri A, Packard MG, Sulli A, Pacitti C, Innocenzi R, Perciavalle V. The projections of the retrorubral field A8 to the hippocampal formation in the rat. Exp Brain Res. 1996;112:244–252. doi: 10.1007/BF00227643. [DOI] [PubMed] [Google Scholar]
- Geisler S, Zahm DS. Afferents of the ventral tegmental area in the rat-anatomical substratum for integrative functions. J Comp Neurol. 2005;490:270–294. doi: 10.1002/cne.20668. [DOI] [PubMed] [Google Scholar]
- Gobbi G, Muntoni AL, Gessa GL, Diana M. Clonidine fails to modify dopaminergic neuronal activity during morphine withdrawal. Psychopharmacology (Berl) 2001;158:1–6. doi: 10.1007/s002130100832. [DOI] [PubMed] [Google Scholar]
- Grenhoff J, Svensson TH. Clonidine regularizes substantia nigra dopamine cell firing. Life Sci. 1988;42:2003–2009. doi: 10.1016/0024-3205(88)90500-0. [DOI] [PubMed] [Google Scholar]
- Grenhoff J, Svensson TH. Clonidine modulates dopamine cell firing in rat ventral tegmental area. Eur J Pharmacol. 1989;165:11–18. doi: 10.1016/0014-2999(89)90765-6. [DOI] [PubMed] [Google Scholar]
- Grenhoff J, Svensson TH. Prazosin modulates the firing pattern of dopamine neurons in rat ventral tegmental area. Eur J Pharmacol. 1993;233:79–84. doi: 10.1016/0014-2999(93)90351-h. [DOI] [PubMed] [Google Scholar]
- Grenhoff J, North RA, Johnson SW. Alpha 1-adrenergic effects on dopamine neurons recorded intracellularly in the rat midbrain slice. Eur J Neurosci. 1995;7:1707–1713. doi: 10.1111/j.1460-9568.1995.tb00692.x. [DOI] [PubMed] [Google Scholar]
- Guiard BP, El Mansari M, Blier P. Cross-talk between dopaminergic and noradrenergic systems in the rat ventral tegmental area, locus ceruleus, and dorsal hippocampus. Mol Pharmacol. 2008;74:1463–1475. doi: 10.1124/mol.108.048033. [DOI] [PubMed] [Google Scholar]
- Guyenet PG. Central noradrenergic neurons: the autonomic connection. Prog Brain Res. 1991;88:365–380. doi: 10.1016/s0079-6123(08)63823-6. [DOI] [PubMed] [Google Scholar]
- Guyenet PG. The sympathetic control of blood pressure. Nat Rev Neurosci. 2006;7:335–346. doi: 10.1038/nrn1902. [DOI] [PubMed] [Google Scholar]
- Hamill GS, Jacobowitz DM. A study of afferent projections to the rat interpeduncular nucleus. Brain Res Bull. 1984;13:527–539. doi: 10.1016/0361-9230(84)90035-2. [DOI] [PubMed] [Google Scholar]
- Herbert H, Saper CB. Organization of medullary adrenergic and noradrenergic projections to the periaqueductal gray matter in the rat. J Comp Neurol. 1992;315:34–52. doi: 10.1002/cne.903150104. [DOI] [PubMed] [Google Scholar]
- Hilaire G, Viemari JC, Coulon P, Simonneau M, Bévengut M. Modulation of the respiratory rhythm generator by the pontine noradrenergic A5 and A6 groups in rodents. Respir Physiol Neurobiol. 2004;143:187–197. doi: 10.1016/j.resp.2004.04.016. [DOI] [PubMed] [Google Scholar]
- Huang YY, Kandel ER. D1/D5 receptor agonists induce a protein synthesis-dependent late potentiation in the CA1 region of the hippocampus. Proc Natl Acad Sci U S A. 1995;92:2446–2450. doi: 10.1073/pnas.92.7.2446. [DOI] [PMC free article] [PubMed] [Google Scholar]
- Jones BE, Moore RY. Ascending projections of the locus coeruleus in the rat. II. Autoradiographic study. Brain Res. 1977;127:25–53. [PubMed] [Google Scholar]
- Jones LS, Gauger LL, Davis JN. Anatomy of brain alpha 1-adrenergic receptors: in vitro autoradiography with [125I]-heat. J Comp Neurol. 1985;231:190–208. doi: 10.1002/cne.902310207. [DOI] [PubMed] [Google Scholar]
- Kalia M, Fuxe K, Goldstein M. Rat medulla oblongata. II. Dopaminergic, noradrenergic (A1 and A2) and adrenergic neurons, nerve fibers, and presumptive terminal processes. J Comp Neurol. 1985;233:308–332. doi: 10.1002/cne.902330303. [DOI] [PubMed] [Google Scholar]
- Kentros CG, Agnihotri NT, Streater S, Hawkins RD, Kandel ER. Increased attention to spatial context increases both place field stability and spatial memory. Neuron. 2004;42:283–295. doi: 10.1016/s0896-6273(04)00192-8. [DOI] [PubMed] [Google Scholar]
- Kirouac GJ, Ciriello J. Cardiovascular afferent inputs to ventral tegmental area. Am J Physiol. 1997;272:R1998–R2003. doi: 10.1152/ajpregu.1997.272.6.R1998. [DOI] [PubMed] [Google Scholar]
- Kitahama K, Pearson J, Denoroy L, Kopp N, Ulrich J, Maeda T, Jouvet M. Adrenergic neurons in human brain demonstrated by immunohistochemistry with antibodies to phenylethanolamine-N-methyltransferase (PNMT): discovery of a new group in the nucleus tractus solitarius. Neurosci Lett. 1985;53:303–308. doi: 10.1016/0304-3940(85)90555-5. [DOI] [PubMed] [Google Scholar]
- Lee A, Wissekerke AE, Rosin DL, Lynch KR. Localization of alpha2C-adrenergic receptor immunoreactivity in catecholaminergic neurons in the rat central nervous system. Neuroscience. 1998;84:1085–1096. doi: 10.1016/s0306-4522(97)00578-2. [DOI] [PubMed] [Google Scholar]
- Liprando LA, Miner LH, Blakely RD, Lewis DA, Sesack SR. Ultrastructural interactions between terminals expressing the norepinephrine transporter and dopamine neurons in the rat and monkey ventral tegmental area. Synapse. 2004;52:233–244. doi: 10.1002/syn.20023. [DOI] [PubMed] [Google Scholar]
- Loughlin SE, Foote SL, Fallon JH. Locus coeruleus projections to cortex: topography, morphology and collateralization. Brain Res Bull. 1982;9:287–294. doi: 10.1016/0361-9230(82)90142-3. [DOI] [PubMed] [Google Scholar]
- Luppi PH, Aston-Jones G, Akaoka H, Chouvet G, Jouvet M. Afferent projections to the rat locus coeruleus demonstrated by retrograde and anterograde tracing with cholera-toxin B subunit and Phaseolus vulgaris leucoagglutinin. Neuroscience. 1995;65:119–160. doi: 10.1016/0306-4522(94)00481-j. [DOI] [PubMed] [Google Scholar]
- Marchand ER, Riley JN, Moore RY. Interpeduncular nucleus afferents in the rat. Brain Res. 1980;193:339–352. doi: 10.1016/0006-8993(80)90169-9. [DOI] [PubMed] [Google Scholar]
- Montague PR, Dayan P, Sejnowski TJ. A framework for mesencephalic dopamine systems based on predictive Hebbian learning. J Neurosci. 1996;16:1936–1947. doi: 10.1523/JNEUROSCI.16-05-01936.1996. [DOI] [PMC free article] [PubMed] [Google Scholar]
- Montague PR, McClure SM, Baldwin PR, Phillips PE, Budygin EA, Stuber GD, Kilpatrick MR, Wightman RM. Dynamic gain control of dopamine delivery in freely moving animals. J Neurosci. 2004;24:1754–1759. doi: 10.1523/JNEUROSCI.4279-03.2004. [DOI] [PMC free article] [PubMed] [Google Scholar]
- Moore H, Rose HJ, Grace AA. Chronic cold stress reduces the spontaneous activity of ventral tegmental dopamine neurons. Neuropsychopharmacology. 2001;24:410–419. doi: 10.1016/S0893-133X(00)00188-3. [DOI] [PubMed] [Google Scholar]
- Morilak DA, Fornal CA, Jacobs BL. Effects of physiological manipulations on locus coeruleus neuronal activity in freely moving cats. II. Cardiovascular challenge. Brain Res. 1987;422:24–31. doi: 10.1016/0006-8993(87)90536-1. [DOI] [PubMed] [Google Scholar]
- Paladini CA, Williams JT. Noradrenergic inhibition of midbrain dopamine neurons. J Neurosci. 2004;24:4568–4575. doi: 10.1523/JNEUROSCI.5735-03.2004. [DOI] [PMC free article] [PubMed] [Google Scholar]
- Paladini CA, Fiorillo CD, Morikawa H, Williams JT. Amphetamine selectively blocks inhibitory glutamate transmission in dopamine neurons. Nat Neurosci. 2001;4:275–281. doi: 10.1038/85124. [DOI] [PubMed] [Google Scholar]
- Paxinos G, Watson C. The rat brain in stereotaxic coordinates. San Diego: Academic; 1998. [DOI] [PubMed] [Google Scholar]
- Phillipson OT. Afferent projections to the ventral tegmental area of Tsai and interfascicular nucleus: a horseradish peroxidase study in the rat. J Comp Neurol. 1979;187:117–143. doi: 10.1002/cne.901870108. [DOI] [PubMed] [Google Scholar]
- Rinaman L. Hindbrain noradrenergic lesions attenuate anorexia and alter central cFos expression in rats after gastric viscerosensory stimulation. J Neurosci. 2003;23:10084–10092. doi: 10.1523/JNEUROSCI.23-31-10084.2003. [DOI] [PMC free article] [PubMed] [Google Scholar]
- Sawchenko PE, Swanson LW. The organization of noradrenergic pathways from the brainstem to the paraventricular and supraoptic nuclei in the rat. Brain Res. 1982;257:275–325. doi: 10.1016/0165-0173(82)90010-8. [DOI] [PubMed] [Google Scholar]
- Sawchenko PE, Li HY, Ericsson A. Circuits and mechanisms governing hypothalamic responses to stress: a tale of two paradigms. Prog Brain Res. 2000;122:61–78. doi: 10.1016/s0079-6123(08)62131-7. [DOI] [PubMed] [Google Scholar]
- Simon H, Le Moal M, Stinus L, Calas A. Anatomical relationships between the ventral mesencephalic tegmentum–a 10 region and the locus coeruleus as demonstrated by anterograde and retrograde tracing techniques. J Neural Transm. 1979;44:77–86. doi: 10.1007/BF01252703. [DOI] [PubMed] [Google Scholar]
- Swanson LW. The projections of the ventral tegmental area and adjacent regions: a combined fluorescent retrograde tracer and immunofluorescence study in the rat. Brain Res Bull. 1982;9:321–353. doi: 10.1016/0361-9230(82)90145-9. [DOI] [PubMed] [Google Scholar]
- Swanson LW. Brain maps: structure of the rat brain. Amsterdam: Elsevier; 1992. [Google Scholar]
- Takahashi H, Kato M, Hayashi M, Okubo Y, Takano A, Ito H, Suhara T. Memory and frontal lobe functions; possible relations with dopamine D2 receptors in the hippocampus. Neuroimage. 2007;34:1643–1649. doi: 10.1016/j.neuroimage.2006.11.008. [DOI] [PubMed] [Google Scholar]
- Ter Horst GJ, de Boer P, Luiten PG, van Willigen JD. Ascending projections from the solitary tract nucleus to the hypothalamus. A Phaseolus vulgaris lectin tracing study in the rat. Neuroscience. 1989;31:785–797. doi: 10.1016/0306-4522(89)90441-7. [DOI] [PubMed] [Google Scholar]
- Ungerstedt U. Stereotaxic mapping of the monoamine pathways in the rat brain. Acta Physiol Scand Suppl. 1971;367:1–48. doi: 10.1111/j.1365-201x.1971.tb10998.x. [DOI] [PubMed] [Google Scholar]
- Woulfe JM, Flumerfelt BA, Hrycyshyn AW. Efferent connections of the A1 noradrenergic cell group: a DBH immunohistochemical and PHA-L anterograde tracing study. Exp Neurol. 1990;109:308–322. doi: 10.1016/s0014-4886(05)80022-6. [DOI] [PubMed] [Google Scholar]