Desmethylclomipramine induces the accumulation of autophagy markers by blocking autophagic flux (original) (raw)
Summary
Alterations in the autophagic pathway are associated with the onset and progression of various diseases. However, despite the therapeutic potential for pharmacological modulators of autophagic flux, few such compounds have been characterised. Here we show that clomipramine, an FDA-approved drug long used for the treatment of psychiatric disorders, and its active metabolite desmethylclomipramine (DCMI) interfere with autophagic flux. Treating cells with DCMI caused a significant and specific increase in autophagosomal markers and a concomitant blockage of the degradation of autophagic cargo. This observation might be relevant in therapy in which malignant cells exploit autophagy to survive stress conditions, rendering them more susceptible to the action of cytotoxic agents. In accordance, DCMI-mediated obstruction of autophagic flux increased the cytotoxic effect of chemotherapeutic agents. Collectively, our studies describe a new function of DCMI that can be exploited for the treatment of pathological conditions in which manipulation of autophagic flux is thought to be beneficial.
Keywords: LC3, Cell death, Anti-depressant, Doxorubicin, Chemotherapy, Atg5, p62 (SQSTM1)
Introduction
Macroautophagy (henceforth referred to as autophagy) is a major cellular catabolic pathway that consists of a set of complex and highly regulated processes that lead to the engulfment of cytoplasmic portions in double-membrane sequestering vesicles called autophagosomes. The autophagosomal cargo is subsequently delivered to the lysosomal compartment where it is broken down into its essential constituents and recycled back again to the cytoplasm (Kim and Klionsky, 2000; Mizushima and Klionsky, 2007). Activation or repression of autophagy is accompanied by a change in the number of autophagosomes and multivesiculated lysosomes present in the cells. However, a variation in the number of these structures does not always reflect an alteration in the execution of the autophagic pathway. Changes in the autophagic flux, defined as the equilibrium between autophagosome formation and clearance by lysosomes, can also occur from impairment of the ability to eliminate autophagic structures from the cytosol through the lysosomal compartment (Klionsky et al., 2008).
The main role of autophagy is to provide an alternative energy source during nutrient starvation and certain other adverse conditions in order to ensure cell viability. In addition to enhanced autophagy during starvation, basal levels of autophagy are also important for intracellular quality control of superfluous and damaged proteins and organelles (Komatsu et al., 2007a). Besides these fundamental roles, autophagy is thought to be involved in the degradation of intracellular bacteria, antigen presentation, tumour suppression, cell death and differentiation (Colombo, 2005;Lunemann and Munz, 2008;Maiuri et al., 2008;Orvedahl and Levine, 2008;Scarlatti et al., 2008). Therefore, it is not surprising that alterations in autophagy have been associated with different human pathological conditions (Kundu and Thompson, 2008;Levine and Kroemer, 2008;Mizushima et al., 2008). However, despite the great deal of interest in the regulation of autophagy for therapeutic purposes, there are only few modulators of the autophagic pathway that show promising pharmacological value (Rubinsztein et al., 2007;Sarkar et al., 2007;Zhang et al., 2007).
Clomipramine (CMI) has been used for over 40 years in the treatment of patients with psychiatric disorders (Gillman, 2007). It has a long-standing record with good subject tolerance, making it very attractive to explore further applications for this drug in the treatment of several medical conditions (Klingenstein et al., 2006; Pilkington et al., 2008). During the course of preliminary experiments in an attempt to identify new regulatory activities of CMI, we observed that treatment with CMI and to an even greater extent with its active metabolite desmethylclomipramine (DCMI) induced the appearance of autophagy-associated structures in the cytoplasm. Interestingly, this effect occurred at concentrations of CMI and DCMI that were significantly lower than those previously reported to have cytotoxic effects (Daley et al., 2005), thus revealing a new potential therapeutic role for this group of drugs. These observations prompted us to explore whether DCMI could alter autophagic flux and, if so, whether this could be exploited for novel therapeutic usage. In particular, we focused on augmenting the sensitivity of transformed cells that exploit autophagy to survive the cytotoxic effects of chemotherapeutic agents.
Results
DCMI causes an increase in autophagosomal markers in a time- and dose-dependent manner
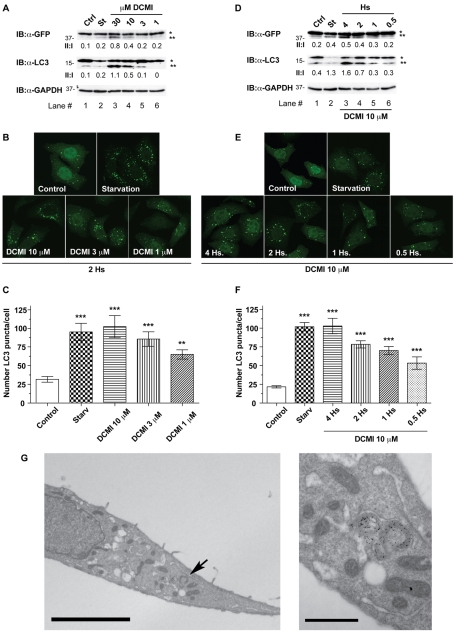
In order to investigate whether or not cells treated with DCMI exhibit alterations in the autophagic pathway, we first analysed DCMI-induced changes in the levels and distribution of the autophagosomal marker microtubule-associated protein 1 light chain 3 (LC3) in a HeLa cell line stably expressing LC3 fused to EGFP (HeLa GFP-LC3). LC3 (and also EGFP-LC3) is processed post-translationally into LC3-I, which is cytosolic and which is then converted to LC3-II, which associates with autophagosomal membranes. Because LC3-II specifically associates with autophagosomes, the number of LC3-positive vesicles and the amount of LC3-II is a widely accepted approximation of the extent of autophagosomal formation, and represents a specific and sensitive method to make inferences about autophagic activity (Klionsky et al., 2008;Klionsky et al., 2007;Mizushima, 2004). As shown inFig. 1, upon treatment with DCMI we observed a significant increase in the amount of overexpressed and endogenous LC3-II in a dose-dependent (Fig. 1A, upper and middle panel, respectively) and time-dependent (Fig. 1D, upper and middle panel, respectively) manner. This increase in the levels of LC3-II was also accompanied by an increase in the appearance of punctate LC3 staining in a dose-dependent (Fig. 1B,C) and time-dependent (Fig. 1E,F) manner. As a positive control for induction of autophagy, incubation of cells in nutrient-starvation medium (Fig. 1A-E, St) produced similar effects. To confirm these observations at endogenous levels, we performed similar experiments in HeLa parental cells and comparable results were obtained (supplementary material Fig. S1). The observed increase in autophagosomal markers was also confirmed in HeLa GFP-LC3 cells by immunoelectron microscopy using an anti-GFP primary antibody and a secondary antibody coupled to 10-nm gold particles. This analysis showed a significant increase in double-membrane structures that were labelled with gold particles for EGFP-LC3 when HeLa GFP-LC3 cells were treated with DCMI (Fig. 1G). Importantly, the changes in autophagosomal markers induced by DCMI were achieved with concentrations at which minimal cytotoxic effects were apparent (see section `DCMI sensitises cells to cytotoxic agents in an autophagy-dependent manner'). In addition, we also assessed whether other compounds having high structural and therapeutic similarities with DCMI could produce similar effects on the autophagic flux. To this end, HeLa GFP-LC3 cells were treated with clomipramine (CMI), imipramine (IMI), nortriptyline (NOR) and doxepin (DOX), and equivalent findings were obtained (supplementary material Fig. S2).
Fig. 1.
DCMI increases GFP–LC3-II accumulation and the appearance of punctate GFP-LC3 staining in a time- and dose-dependent manner. (A-F) In all cases, as positive control for induction of autophagy, cells were incubated for 2 hours with EBSS nutrient-starvation medium (St). In the western blot panels, asterisk (*) indicates endogenous or overexpressed LC3-I and double asterisks (**) indicate endogenous or overexpressed LC3-II. Equal loading was verified by anti-GAPDH immunoblotting. (A,B) HeLa cells transfected with GFP-LC3 were treated with increasing amounts of DCMI for a period of 2 hours and then analysed by either western blotting (A) for overexpressed GFP-LC3 (upper panel) and endogenous LC3 (middle panel) or direct GFP fluorescence (B). (A) The GFP–LC3-II to GFP–LC3-I ratio and LC3-II to LC3-I ratio (II:I) are shown below the upper and middle panel, respectively. (C) Statistical analysis of the numbers of fluorescent punctate structures per cell in each treatment in B. The values reported are means ± s.d.; ***P<0.0001 vs control;**P<0.001. (D-F) HeLa cells transfected with_GFP-LC3_ were treated with 10 μM DCMI for the indicated time periods and then analysed as in A-C, respectively. (G) HeLa cells transfected with GFP-LC3 were starved, treated with DCMI 10 μM for 2 hours and then analysed using immunogold electron microscopy with an antibody against GFP. Scale bar: 5 μm. Right picture is an inset at higher magnification of the area of the left picture indicated by an arrow. Scale bar: 1 μm.
DCMI interferes with the autophagic flux blocking the degradation of autophagic cargo
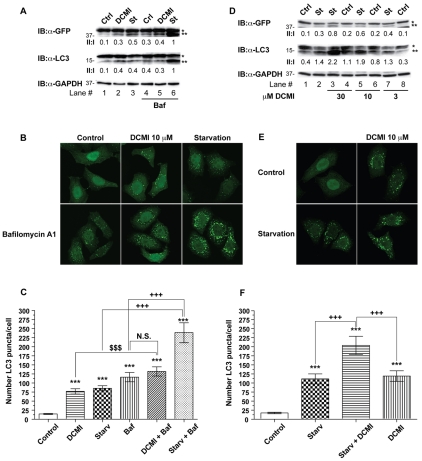
The observed DCMI-dependent increase in the levels of autophagosomal markers could in principle reflect two different effects on the autophagy pathway: either increased autophagosome formation due to increases in autophagic activity, or reduced turnover of autophagosomes due to impairment in the degradation pathway (Klionsky et al., 2008; Klionsky et al., 2007; Mizushima, 2004). Therefore, to establish in which physiological or pathological context DCMI might have a beneficial therapeutic value, it was necessary to thoroughly and unequivocally determine at which level DCMI affected autophagic flux. To this end we examined the effect of DCMI on LC3-II levels in the presence and absence of the proton ATPase inhibitor bafilomycin A1 (known to inhibit lysosomal degradation but not autophagosome formation). If DCMI increased the levels of autophagy, and consequently augmented the number of autophagosomes targeted for degradation, treatment with DCMI together with bafilomycin A1 should result in a considerable increase of autophagosomal markers. However, when compared with cells treated with bafilomycin A1 alone, treatment with DCMI in combination with bafilomycin A1 caused only a slight increase in the endogenous and overexpressed LC3-II levels (Fig. 2A, lanes 4 and 5, upper and middle panel) and in the appearance of punctate LC3 staining (Fig. 2B,C). By contrast, upon induction of autophagy in response to nutrient-starvation conditions, addition of either bafilomycin A1 or DCMI resulted in a significant and conspicuous increase in the endogenous and overexpressed LC3-II levels (Fig. 2A, lanes 3 and 6, upper and middle panel; Fig. 2D lanes 2, 3, 5 and 7, upper and middle panel), and an increased appearance of punctate LC3 staining (Fig. 2B,C and Fig. 2E,F, respectively). As a control for specificity, equivalent experiments were performed substituting bafilomycin A1 with chloroquine, another compound known to interfere with lysosomal function, and similar results were obtained (supplementary material Fig. S3). In order to corroborate our results at the endogenous level, parental HeLa cells were treated with DCMI and bafilomycin A1, under normal and nutrient-starvation conditions, and comparable results were obtained (supplementary material Fig. S4).
Fig. 2.
DCMI interferes with the autophagic flux. (A) HeLa cells transfected with_GFP-LC3_ and left untreated (lanes 1-3) or treated with 20 nM bafilomycin A1 (lanes 4-6) were incubated in MEM complete medium in the absence (Ctrl) or presence of 10 μM DCMI (DCMI) or in EBSS nutrient-starvation medium (St) for 2 hours and then analysed by western blotting for overexpressed GFP-LC3 (upper panel) and endogenous LC3 (middle panel). The GFP–LC3-II to GFP–LC3-I ratio and LC3-II to LC3-I ratio (II:I) are shown below the upper and middle panel, respectively. (B) Analysis of direct GFP fluorescence of samples shown in A. (C) Statistical analysis of the numbers of fluorescent punctate structures per cell in each treatment in B. The values reported are means ± s.d.;***P<0.0001 vs control; $, P<0.0001 vs DCMI plus bafilomycin; +++, P<0.0001 vs starvation and bafilomycin. (D) HeLa cells transfected with GFP-LC3 were incubated in MEM complete medium (Ctrl) or in EBSS nutrient-starvation medium (St) for 2 hours in the presence or absence of increasing amounts of DCMI as indicated and then analysed as in A. (E) Analysis of direct GFP fluorescence of samples of shown in D. (F) Statistical analysis of the numbers of fluorescent punctate structures per cell in each treatment in E. The values reported are means ± s.d.; ***P<0.0001 vs control; +++,P<0.0001 vs starvation plus DCMI. In the western blot panels, asterisk (*) indicates endogenous or overexpressed LC3-I and double asterisks (**) indicate endogenous or overexpressed LC3-II. Equal loading was verified by anti-GAPDH immunoblotting.
We next investigated whether DCMI also induced the accumulation of LC3-II and the appearance of punctate LC3 staining upon pharmacological induction of autophagy with rapamycin, one of best-characterised drugs that enhances autophagy by inhibiting mTOR (mammalian target of rapamycin) (Ravikumar et al., 2004). As depicted in Fig. 3, addition of DCMI in combination with rapamycin resulted in a significant increase in the levels of the autophagosomal markers studied (Fig. 3A, lanes 2 and 3;Fig. 2B,C), indicating that the effect of DCMI on the autophagic flux was independent of the stimulus used to induce autophagy.
Fig. 3.
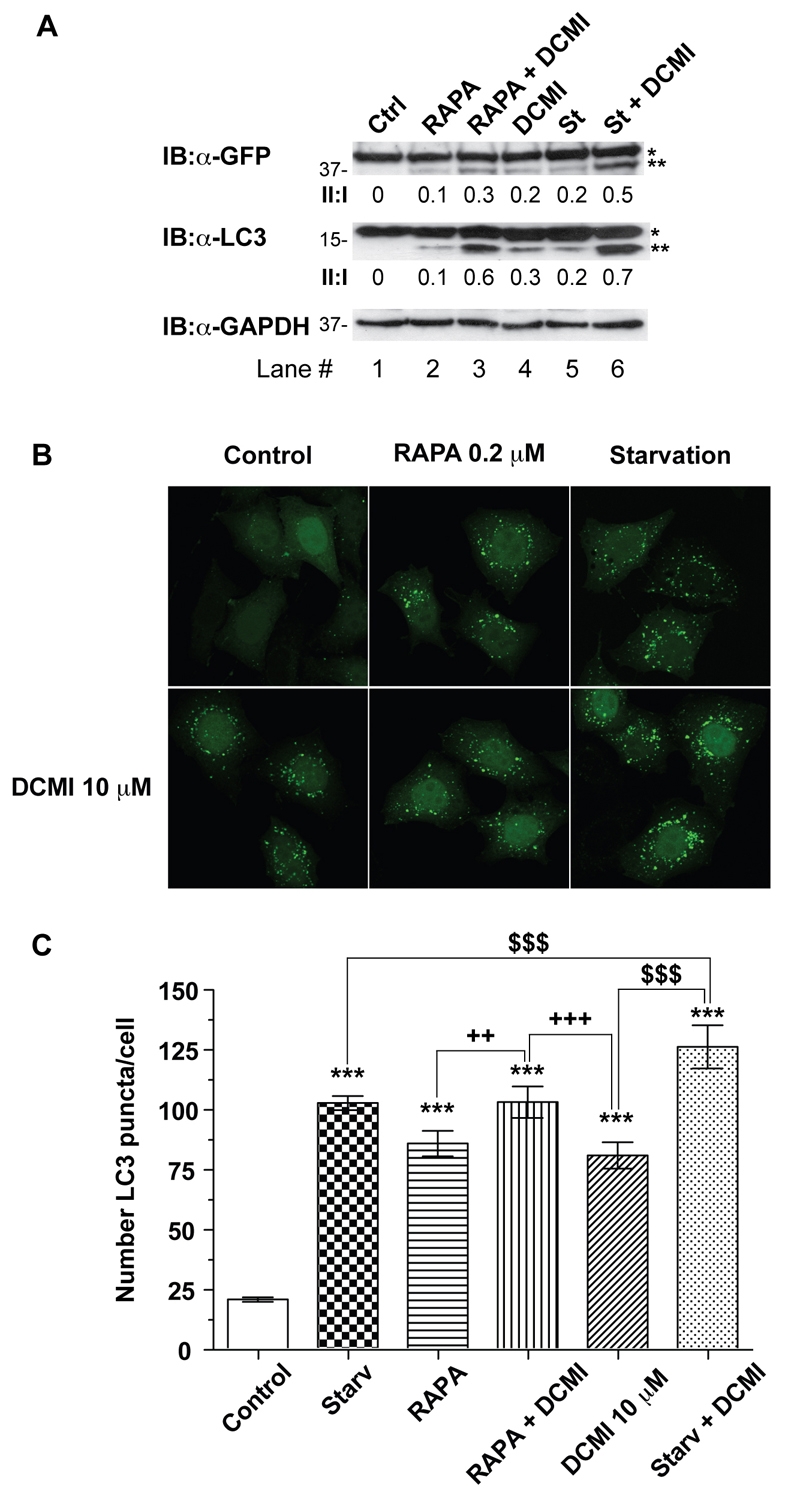
DCMI interferes with pharmacologically induced autophagic flux. (A) HeLa cells transfected with GFP-LC3 were incubated in MEM complete medium (Ctrl), in EBSS starvation medium (St) or in MEM complete medium with 0.2 μM rapamycin for 4 hours in the presence (lanes 1-3) or absence (lanes 4-6) of 10 μM DCMI as indicated and then analysed by either western blotting for overexpressed GFP-LC3 (upper panel) or endogenous LC3 (middle panel). The GFP–LC3-II to GFP-LC3-I ratio and LC3-II to LC3-I ratio (II:I) are shown below the upper and middle panel, respectively. Asterisk (*) indicates endogenous or overexpressed LC3-I and double asterisks (**) indicate endogenous or overexpressed LC3-II. Equal loading was verified by anti-GAPDH immunoblotting. (B) Analysis of direct GFP fluorescence of samples show in A. (C) Represent statistical analysis of the numbers of fluorescent punctate structures per cell in each treatment in B. The values reported are means ± s.d.; ***P<0.0001 vs control; $, P<0.0001 vs starvation plus DCMI; +++,P<0.0001, ++, P<0.001 vs rapamycin plus DCMI.
To further confirm whether DCMI inhibited autophagic degradation, we analysed starvation-induced proteolysis of long-lived proteins that represent a standard and specific end-point assay for the pathway (Pattingre et al., 2004). Compared with control cells, there was a significant reduction (P<0.0001) in the level of starvation-induced degradation in DCMI-treated cells that was comparable to bafilomycin A1-treated cells (Fig. 4A). In addition, we also observed a DCMI-dependent increase in the steady-state levels of p62 (also known as SQSTM1) (Fig. 4B, upper panel), a protein that associates with LC3 and ubiquitin and is degraded through the autophagic pathway (Ichimura et al., 2008; Komatsu et al., 2007b; Pattingre et al., 2004).
Fig. 4.
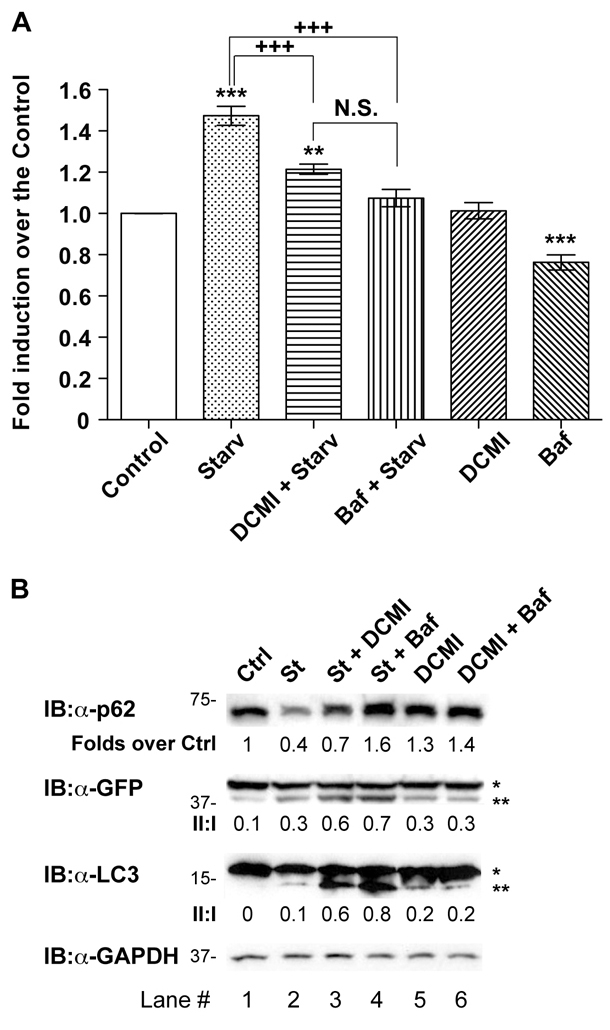
DCMI blocks autophagic-cargo degradation. (A) The rate of degradation of14C-labelled valine long-lived proteins was measured in HeLa cells transfected with GFP-LC3 incubated either in MEM complete medium (Control) or EBBS starvation medium (Starv) as described under Materials and Methods. Experiments were performed in the presence or absence of 10 μM DCMI or 20 nM bafilomycin A1. The values reported are means ± s.d. of three independent experiments in triplicate;***P<0.0001, ** P<0.001 vs control; +++P<0.0001 vs starvation; N.S., not significant. (B) HeLa cells transfected with GFP-LC3 were treated as indicated: (Ctrl) control, (St) EBBS starvation medium, (Baf) 20 nM bafilomycin A1, (DCMI) 10 μM DCMI, or the combination indicated and then subjected to western blotting analysis of endogenous p62 (upper panel), overexpressed GFP-LC3 (second panel) and endogenous LC3 (third panel). The ratio of treatment vs control of p62 is shown below the upper panel. The GFP–LC3-II and GFP–LC3-I ratio and LC3-II to LC3-I ratio (II:I) are shown below second and third panel, respectively. Asterisk (*) indicates endogenous or overexpressed LC3-I and double asterisks (**) indicate endogenous or overexpressed LC3-II. Equal loading was verified by anti-GAPDH immunoblotting.
Taken together, these results suggested that both bafilomycin A1 and DCMI stimulated the accumulation of autophagosomal markers by inhibiting the autophagic flux as opposed to an activation of the autophagic pathway, resulting in a significant accumulation of autophagic cargo components.
DCMI-dependent increase of autophagosomal markers requires intact autophagic machinery
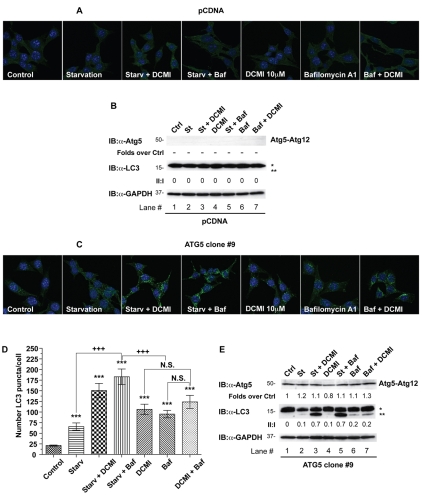
Although LC3 is a widespread marker for autophagosomes, recently it has been shown that under certain conditions it can easily be incorporated into protein aggregates when autophagy is impaired (Ciechomska and Tolkovsky, 2007; Kochl et al., 2006; Szeto et al., 2006). Therefore, in order to confirm that DCMI-dependent changes in LC3-II and punctate LC3 staining were autophagy-dependent, we next set out to investigate the effect of DCMI on autophagosomal markers in an autophagy-deficient cellular model. To this end we used immortalised mouse embryonic fibroblasts (MEFs) obtained from _Atg5_-deficient mice (_Atg5_–/–) (Bampton et al., 2005). The Atg5 protein plays a key role in the autophagic cascade, and its presence and proper conjugation with the ubiquitin-like molecule Atg12 are specifically required for the formation of autophagosomes.Atg5_–/– MEFs were transfected with either a plasmid vector expressing Atg5 cDNA or with empty vector and single clones were selected. In empty-vector-reconstituted_Atg5–/– MEFs (pCDNA MEFs), treatment with DCMI or bafilomycin A1, under control or nutrient-deprivation conditions, failed to induce the appearance of LC3 puncta (Fig. 5A) or accumulation of LC3-II (Fig. 5B, middle panel, lanes 3-6). As a control, to confirm impairment of the autophagic cascade in the pCDNA MEFs, formation of Atg5-Atg12 conjugation was examined. To this end the samples were analysed by western blotting using an anti-Atg5 antibody and the appearance of an immunoreactive band at around 50 kDa (representing the combined molecular weight of Atg5 and Atg12) was evaluated. As expected, we did not detect any anti-Atg5 signal in the pCDNA MEFs treated with the different stimuli indicated (Fig. 5D, upper panel, lanes 1-7). On the contrary, when we reintroduced Atg5 in the Atg5–/– MEFs (ATG5 MEFs) we observed a DCMI-dependent and bafilomycin-A1-dependent accumulation of autophagosomal markers both in control and nutrient-starvation conditions; this accumulation was comparable with our previous experimental results (Fig. 5C,D;Fig. 5E, middle panel, lanes 3-6). In all cases, we observed the presence of the Atg5-Atg12 conjugated form, indicating a normal progress of the autophagic process (Fig. 5E, upper panel, lanes 1-7). We repeated similar experiments using a mixed cell population obtained from reconstituted _Atg5_–/– MEFs with the same vectors used for the selection of the stable clones (supplementary material Fig. S5) and verified that the results observed were not specific for the particular stable clones used. As an additional control we also transfected wild-type MEFs with the empty vector (pCDNA), obtaining equivalent results (supplementary material Fig. S6).
Fig. 5.
DCMI-dependent increase of LC3-II and punctate LC3 staining requires intact autophagic machinery. (A,C) _Atg5_–/– MEFs were stably transfected with either an empty vector (pCDNA; A) or reconstituted with a plasmid expressing ATG5 (ATG5 clone #9; C). Cells from individual clones for each transfection were incubated either in DMEM complete medium (Control) or EBBS starvation medium (Starv) in the presence or absence of 10 μM DCMI or 20 nM bafilomycin A1 (Baf) or different combinations as indicated. Indirect immunofluorescence for endogenous LC3 was assessed as described in Materials and Methods. (D) Statistical analysis of the numbers of fluorescent punctate structures per cell in each treatment in B. The values reported are means ± s.d.; ***P<0.0001 vs control; +++, P<0.0001 vs starvation plus DCMI; N.S., not significant. (B,E) Western blot analysis for Atg5 (upper panel) and endogenous LC3 (middle panel) of samples described in A and B, respectively. The ratio of treatment vs control of Atg5 immunoreactive band is shown below the upper panel. The LC3-II to LC3-I ratio (II:I) is shown below the middle panel. Asterisk (*) indicates endogenous or overexpressed LC3-I and double asterisks (**) indicate endogenous or overexpressed LC3-II. Equal loading was verified by anti-GAPDH immunoblotting.
To further confirm that the DCMI-induced changes in autophagosomal markers were dependent on autophagic activity, we compared the levels of GFP–LC3-II and appearance of punctuate GFP-LC3 staining in HeLa cells transfected with either wild-type LC3 (GFP-LC3 WT) or a mutant form of LC3 (GFP-LC3G120A) with a single amino acid substitution (Gly120Ala) in its C-terminus. This particular LC3 mutant cannot undergo proteolytic processing and consequently its conjugation to phosphatidylethanolamine and targeting to the autophagosomal membrane is impaired (Szeto et al., 2006). As shown in Fig. 6, treatment with DCMI in normal or nutrient-starvation medium only induced the appearance of GFP-LC3 puncta in cells transfected with GFP-LC3 WT (Fig. 6A,B), but not in cells transfected with GFP-LC3G120A (Fig. 6C). In agreement, we only detected an increase in the levels of the GFP–LC3-II band in cells transfected with GFP-LC3 WT, but not GFP-LC3G120A under the same experimental conditions (Fig. 6D, upper panel, compare lanes 1-4 and 5-8). Finally, we also measured the levels of endogenous LC3-II in the different conditions tested to assess whether overexpression of GFP-LC3G120A affected autophagy-dependent processing of LC3. As observed inFig. 6D, the changes in the levels of endogenous LC3-II were comparable in cells transfected with either GFP-LC3 WT or GFP-LC3G120A (Fig. 6D, middle panel), confirming the existence of normal autophagy-dependent LC3 processing in both cases.
Fig. 6.
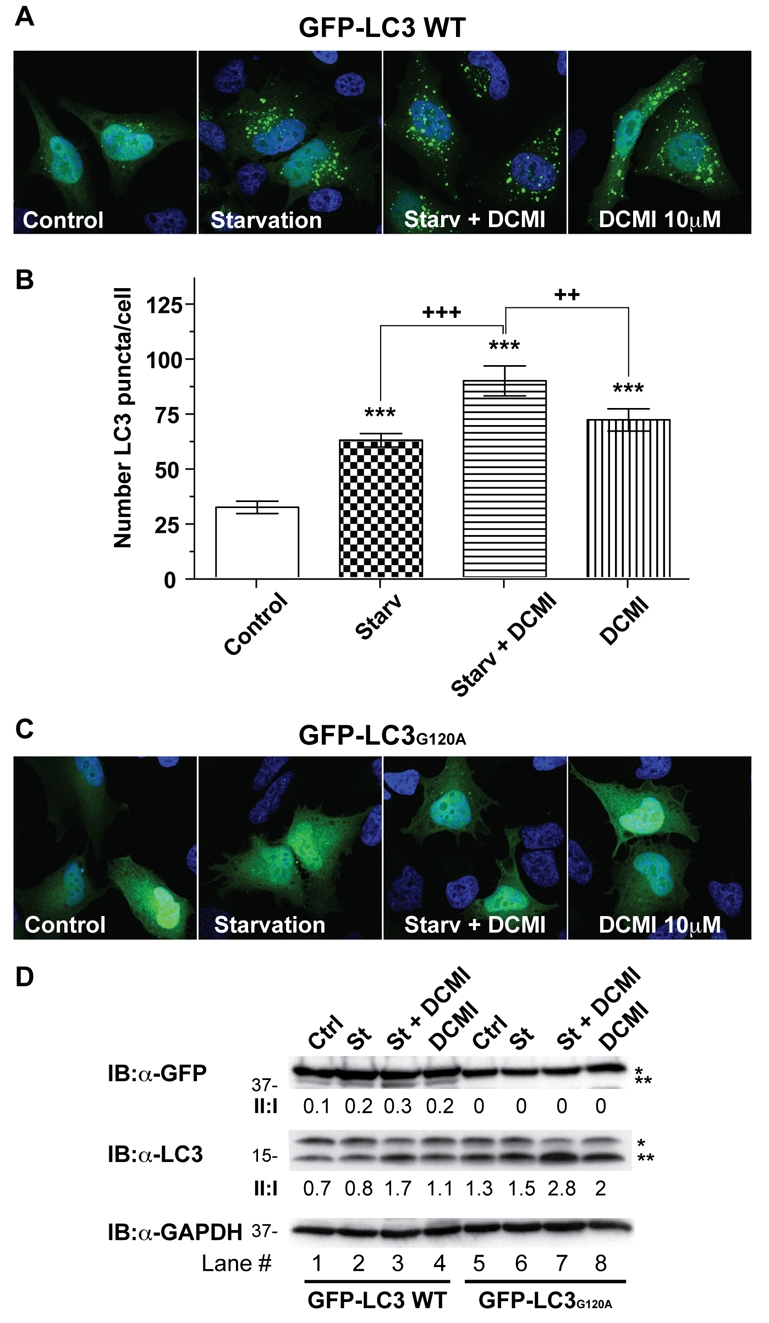
A single point mutation that blocks LC3 activation abrogates the DCMI-dependent increase of GFP–LC3-II and punctate GFP-LC3 staining. (A,C) Parental HeLa cells were transiently transfected with either wild-type LC3 (GFP-LC3 WT; A) or with the EGFP-LC3 mutant version G120A (GFP-LC3G120A; C). At 24 hours post-transfection, cells were treated for 2 hours as indicated: (Control) DMEM complete medium, (Starv) EBSS nutrient-starvation medium and (DCMI) 10 μM of DCMI. Direct GFP fluorescence was then analysed. (B) Statistical analysis of the numbers of fluorescent punctate structures per cell in each treatment in A. The values reported are means ± s.d.; ***P<0.0001 vs control; +++, _P_<0.0001, ++, _P_>0.001 vs starvation plus DCMI. (D) Western blot analysis for overexpressed GFP-LC3 (upper panel) and endogenous LC3 (middle panel) of samples described in A and C. Asterisk (*) indicates endogenous or overexpressed LC3-I and double asterisks (**) indicate endogenous or overexpressed LC3-II. Equal loading was verified by anti-GAPDH immunoblotting.
Taken together, these observations confirmed that the accumulation of autophagosomal markers induced by DCMI resulted from inhibition of autophagic flux and not from an induction of non-specific protein aggregation.
DCMI sensitises cells to cytotoxic agents in an autophagy-dependent manner
Finally, we decided to explore potential therapeutic applications for the inhibitory action of DCMI on autophagic flux, particularly in the context of cancer therapy. In fact, although our understanding of the role of autophagy in tumour biology is at an early stage, increasing evidence indicates that autophagy might protect cancer cells against the effect of cytotoxic compounds and allow continued survival of transformed cells (Kondo et al., 2005;Levine, 2007;Mathew et al., 2007). Genetic or pharmacological inhibition of autophagy has already been shown to enhance the anti-tumour efficacy of different chemotherapeutic agents in the treatment of tumour cells that have become chemo-resistant (Amaravadi et al., 2007;Carew et al., 2007;Dang, 2008;Degtyarev et al., 2008;Maclean et al., 2008). In addition, it has been demonstrated recently that the beneficial effect of blocking autophagy in order to increase the cytotoxic effect of chemotherapeutic agents depends on both the mechanism of cellular injury and the compensatory changes in other forms of autophagy (Wang et al., 2008). This highlights the diversity of response of different tumour cells to chemotherapeutic treatments and the necessity to expand our arsenal of potential compounds in order to develop tailored treatment for specific types of cancer.
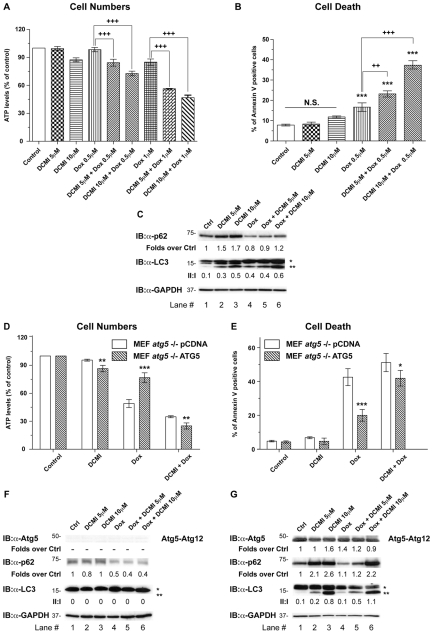
In this regard, we investigated whether DCMI could potentiate the cytotoxic effect of doxorubicin, a DNA-damaging agent widely used in cancer therapy, known to synergise with inhibitors of autophagy (Lambert et al., 2008;Meschini et al., 2008;Munoz-Gamez et al., 2009). To this end we treated HeLa cells for 24 hours with both compounds, either alone or in combination. Whereas DCMI had minimal effect on cell survival, it strongly sensitised the cells to the toxic effects of doxorubicin as assessed by both estimation of the number of surviving cells (ATP levels) and cells undergoing cell death that externalised phosphatidylserine (PS) but did not lose plasma-membrane integrity (single annexin-V positive) (Fig. 7A,B, respectively). In order to verify that, in these experimental conditions, DCMI was exerting the inhibitory effect on the autophagic flux reported in the previous sections, we analysed the levels of endogenous LC3 and p62. As observed inFig. 7C, treatment with DCMI alone or in combination with doxorubicin induced accumulation of p62 and LC3-II, confirming a DCMI-dependent impairment of the autophagic flux.
Fig. 7.
DCMI increases doxorubicin cytotoxicity in an autophagy-dependent manner. (A,B) HeLa cells were treated with the indicated concentrations of doxorubicin and DCMI, alone or in combination. After 24 hours, cytotoxicity was assessed by either quantisation of the ATP present (indicating number of viable cells; A) or by PS externalisation using annexin-V–FITC and 7-ADD for DNA staining (B). In B, only the single-positive annexin-V cells are plotted. The values reported are means ± s.d. of three independent experiments in triplicate; ***P<0.0001; +++, P<0.0001; ++,P<0.001 vs doxorubicin. (C) Western blot analysis of endogenous p62 (upper panel) and endogenous LC3 (middle panel). The ratio of treatment vs control p62, and the LC3-II to LC3-I ratio (II:I) are shown below the upper and middle panel, respectively. (D,E) To investigate whether the effect observed was autophagy-dependent, pCDNA MEFs (white bars) or ATG5 MEFs (striped bars) were incubated for 24 hours with the indicated concentrations of doxorubicin and DCMI, alone or in combination. Cytotoxicity was evaluated by either quantisation of the ATP present (indicating number of viable cells; D) or by PS externalisation using annexin-V–FITC and 7-ADD for DNA staining (E). In E, only the single-positive annexin-V cells are plotted. The values reported are means ±s.d. of three independent experiments in triplicate; ***P<0.0001;**P<0.001; *P<0.05 ATG5 MEFs vs pCDNA MEFs. (F,G) Western blot analysis for endogenous Atg5 (upper panel), endogenous p62 (second panel) and endogenous LC3 (third panel). The ratios of treatment vs control of Atg5 immunoreactive band and of p62 are shown below the upper and second panel, respectively. The LC3-II to LC3-I ratio (II:I) is shown below the third panel. Asterisk (*) indicates endogenous LC3-I and double asterisks (**) indicate endogenous LC3-II. Equal loading was verified by anti-GAPDH immunoblotting.
We next investigated whether enhancement of doxorubicin cytotoxicity by DCMI was a result of the inhibitory effect of DCMI on the autophagic pathway. For this purpose we used the reconstituted autophagy-deficient_Atg5–/–_ MEFs described before. Treatment of ATG5 MEFs with doxorubicin together with DCMI for 24 hours significantly reduced cell number and increased cell death (Fig. 7D,E, respectively, diagonally striped bars,). By contrast, pCDNA MEFs were more sensitive to the cytotoxic effect of doxorubicin alone and this level of toxicity was not significantly increased by addition of DCMI (Fig. 7D,E, solid white bars), suggesting that the potentiating effect of DCMI was mainly due to an inhibition of the autophagy pathway. In agreement, combination indices (CIs) (Chou and Talalay, 1984), as determined using the CalcuSyn software (Biosoft), showed synergistic cytotoxicity between doxorubicin and DCMI in ATG5 reconstituted MEFs but not in pCDNA reconstituted MEFs (supplementary material Fig. S7). As described above, only in ATG5 MEFs, but not in pCDNA MEFs, did we observe a DCMI-dependent increase in the protein levels of both LC3-II and p62 (Fig. 7F,G). Interestingly, the vast majority of the cells treated with doxorubicin alone or in combination with DCMI that externalised PS were negative for DNA staining with 7-aminoactinomycin (7-ADD), indicating that plasma-membrane integrity was not compromised (compare Fig. 7 and supplementary material Fig. S8). This suggested that apoptosis, rather than necrosis, was the major mechanism of cell death induced by the different treatments in both HeLa cells and MEFs.
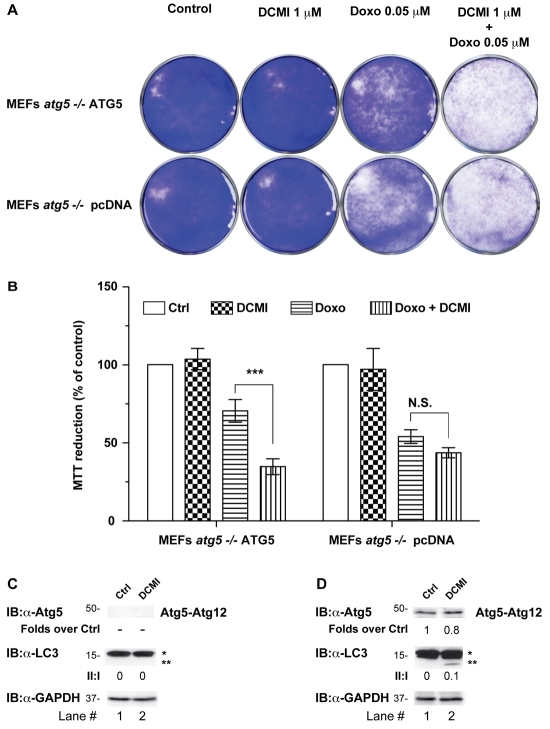
To complement the analysis of the combination of DCMI and doxorubicin, we performed a colony-formation assay and estimated the number of surviving cells using a standard cell-viability assay (MTT reduction). As shown inFig. 8, although DCMI alone had virtually no effect on cell survival, we observed a very strong reduction in the number of colonies when ATG5 MEFs were treated with DCMI in combination with doxorubicin (Fig. 8A,B), even at a concentration that was one order of magnitude lower than that used in previous experiments. Interestingly, the concentration of DCMI used in this experiment was very close to previously reported steady-state DCMI plasma levels of patients treated with CMI (Della Corte et al., 1979; Nielsen et al., 1992; Vandel et al., 1982). In agreement with our previous results, pCDNA MEFs were more sensitive to doxorubicin alone and the potentiating effect of DCMI on doxorubicin cytotoxicity in this cell line was very modest compared with ATG5 MEFs (Fig. 8A,B). As a control, we also measured the levels of endogenous LC3-II in replica experiments and observed an increase in this autophagosomal marker after 10 days of treatment with 1 μM DCMI (Fig. 8C,D). This result confirmed that, in this experimental setup, DCMI also interfered with autophagosomal degradation.
Fig. 8.
DCMI potentiates the inhibitory effect of doxorubicin on colony formation. (A) Reconstituted ATG5 MEFs or pCDNA MEFs were incubated with 1 μM of DCMI and 0.05 μM of doxorubicin, alone or in combination. After 24 hours, drug-free medium was applied to the samples and, 10 days later, colonies were fixed in methanol, stained with Crystal Violet, washed with water and photographed. (B) In order to estimate the number of cells remaining in the plates after the different treatments, replica samples were stained with 3-(4,5-dimethylthiazol-2-yl)-2,5-diphenyltetrazolium (MTT) for 1 hour, then lysed in DMSO and absorbance was read at 570 nm using a standard plate reader. The values reported are means ± s.d. of three independent experiments in triplicate; ***P<0.0001 Doxo vs Doxo+DCMI. (C,D) Western blot analysis for endogenous Atg5 (upper panel) and endogenous LC3 (middle panel). The ratio of treatment vs control of the Atg5 immunoreactive band is shown below the upper panel. The LC3-II to LC3-I ratio (II:I) is shown below middle panel. Asterisk (*) indicates endogenous LC3-I and double asterisks (**) indicate endogenous LC3-II. Equal loading was verified by anti-GAPDH immunoblotting.
Taken together, these results strongly indicated that DCMI potentiates doxorubicin toxicity and this potentiation requires the inhibitory action of DCMI on autophagic flux.
Discussion
Tricyclic antidepressants such as CMI and DCMI are FDA-approved compounds that have been in clinical use for many years (Gillman, 2007), and a wealth of information is already available on their bioavailability, toxicity and dosing. Therefore, their use in an alternative setting would avoid one of the major time- and effort-consuming issues in drug discovery, namely gaining FDA approval for a new chemical entity (O'Connor and Roth, 2005).
In relation to the ideas outlined above, our observations describe a new function for this group of drugs as autophagy inhibitors that might have therapeutic implications outside the field of depressive illness. In particular, we show that DCMI-dependent blockage of autophagy enhances the efficacy of doxorubicin, a genotoxic chemotherapeutic agent used in the treatment of a wide variety of cancers. Importantly, we also provide compelling evidence showing that this action of DCMI occurs at doses comparable with those used in anti-depressive therapy, underscoring its potential for therapeutic use.
Taken together, these observations provide a platform for future studies to explore the combination of antidepressants with cytotoxic agents for the treatment of chemo-refractory malignant disease in which autophagy plays an important role in the chemo-resistance.
Materials and Methods
Cell culture
HeLa cell lines were routinely cultured in MEM medium supplemented with 10% foetal calf serum (FCS). SV40-immortalised Atg5+/+ (wild type) and Atg5–/– MEFs were maintained in DMEM supplemented with 10% FCS. Autophagy was induced by different methods: with the addition of 0.2 μM rapamycin for 4 hours and by amino acid starvation. For the latter, cells were washed twice with Earl's balanced salt solution (EBSS) and incubated in EBSS for the indicated periods. HeLa cells stably expressing EGFP-LC3 and immortalized Atg5–/– MEFs were a gift from Aviva Tolkovsky (University of Cambridge, Cambridge, UK).
Transfection and cell-line selection
SV40-immortalised and Atg5–/– MEFs were transfected with Atg5 cDNA in a pCDNA-hygro vector (or with vector alone) using a Calcium Phosphate Transfection kit (Invitrogen). Cells stabling carrying the plasmids indicated above were selected using increasing concentrations of hygromycin over 3 weeks and single clones picked and expanded. pCDNA-hygro-Atg5 plasmid was a gift from Gerry Cohen (MRC Toxicology Unit, Leicester, UK). HeLa cells were transfected with pEGFP-LC3 WT or pEGFP-LC3G120A mutant using the same method.
Western blotting
HeLa cell lines were treated with MEM containing 10% FCS or starvation medium with either DCMI, 20 nM bafilomycin A1 (Sigma) or 10 μM chloroquine (Sigma). Cells were lysed in RIPA buffer (150 mM NaCl; 10 mM Tris-HCl, pH 7.2; 0.1% Triton X-100; 1% sodium deoxycholate; 5 mM EDTA), sonicated and finally clarified by centrifugation (15,700 g for 10 minutes). Total protein (30 μg) was loaded and resolved on 10% SDS-PAGE gels. Proteins were transferred to nitrocellulose and probed with anti-GFP antibody (1:2000, Invitrogen). To confirm that EGFP-LC3 conversion matched that of endogenous LC3, the same protein extracts were run on a separate 13% SDS-PAGE gel and the blot was probed with anti-LC3 antibody (1:1000, Sigma). To detect endogenous p62, 15 μg of total cell protein were run on 10% SDS-PAGE gels and blots were probed with anti-p62 antibody (1:3000, Biomol). To detect overexpressed Atg5, blots were probed with anti-Atg5 antibody (1:500, Abcam). Equal protein loading was confirmed by blotting with anti-GAPDH antibody (1:10,000, Santa Cruz Biotechnology). All blots were subsequently probed with peroxidase-conjugated secondary antibodies and immunoreactive proteins were revealed using the ECL Plus detection system (Amersham). Western blot results were quantified by densitometric analysis using GeneTools software (Syngene).
Immunocytochemistry
Cells cultured under the same conditions as those used for western blot experiments were grown on coverslips: at the same time points, these cells were fixed in 4% paraformaldehyde for 10-15 minutes, washed twice in PBS and stained with 1 μg/ml Hoechst 33342, rinsed a further three times and mounted in ProLong Gold anti-fade reagent (Invitrogen). For indirect immunofluorescence, cells were fixed in 4% paraformaldehyde for 10-15 minutes and post-fixed for 5 minutes in methanol at –20°C. Coverslips were incubated overnight at 4°C with anti-LC3 antibody (1:750) diluted in blocking solution (1% gelatin; 2.5% goat serum; 0.5% Triton X-100; 100 mM Na2HPO4; 200 mM NaCl). After three rinses in washing buffer (20 mM Na2HPO4; 500 mM NaCl), coverslips were incubated for 30 minutes with anti-rabbit Alexa-Fluor-488-conjugated antibodies (0.5 μg/ml in blocking buffer). Cells were counterstained with 1 μg/ml Hoechst 33342, rinsed a further three times with washing buffer and mounted in ProLong Gold anti-fade reagent (Invitrogen). All imaging was performed on a Zeiss LMS510 confocal microscope using a 63× objective. Quantitative analysis of the numbers of LC3 fluorescent punctate structures per cell was determined using ImproVision Volocity software.
Electron microscopy and immunoelectron microscopy
Cells were fixed in 2% glutaraldehyde in 0.1 M sodium cacodylate buffer (pH 7.4) at 4°C overnight and post-fixed with 1% osmium tetroxide/1% potassium ferrocyanide for 1 hour at room temperature. After fixation, cells were stained en bloc with 5% aqueous uranyl acetate overnight at room temperature, dehydrated, and embedded in Taab epoxy resin (Taab Laboratories Equipment). Duplicate samples were embedded in LR-white resin (Agar Scientific) and labelled with immunogold using a modification of the published technique (Zaccheo et al., 2004). Ultra-thin sections were stained with lead citrate/uranyl acetate and examined in a Zeiss 902A or a Jeol 100-CXII electron microscope.
Degradation of long-lived proteins
As previously described (Pattingre et al., 2004), HeLa cells stably expressing EGFP-LC3 were incubated for 24 hours with 0.25 μCi/ml L-[U-14C]valine (Amersham). Cells were rinsed three times with PBS to remove unincorporated radioisotope and then chased in fresh complete medium containing 10 mM unlabelled valine for 1 hour to allow degradation of short-lived proteins. After this, cells were pretreated with complete medium supplemented with 10 mM valine, bafilomycin A1 or DCMI for 30 minutes. Cells were rinsed three times in EBSS and incubated for 2 hours with either complete media or EBSS supplemented with 10 mM HEPES, 10 mM valine with bafilomycin A1 or DCMI. Cells were then scraped and lysed in RIPA buffer as described above. Using trichloroacetic acid (TCA), proteins were precipitated from both the incubation media and the cell lysates. Proteolysis was assessed as the TCA-soluble radioactivity divided by TCA-insoluble radioactivity.
Cell-death and cell-proliferation assays
HeLa cells and immortalised MEFs were grown in 96-well plates and treated with doxorubicin (Sigma) and DCMI alone or in combination. After 24 hours, cell proliferation was evaluated using the Cell-Titer 96 Assay (Promega) according to the manufacturer's instructions. To assess cell death, cell lines were grown in 60-cm dishes and were treated with doxorubicin and DCMI alone or in combination. After 24 hours, cells were collected and stained with annexin-V–FITC and 7-ADD (BD Biosciences) in annexin-binding buffer (10 mM HEPES; 150 mM NaCl; 5 mM KCl; 1 mM MgCl; 1.8 mM CaCl2) to detect PS externalisation. Samples were processed with the FACScan cytofluorimeter and analysed with the Cellquest software (both BD Biosciences).
Drug interaction and CI
To calculate CIs, ATG5 MEFs and pCDNA MEFs were treated with drug-free medium (control), or the indicated concentration of DCMI and doxorubicin alone or in combination. After 24 hours, cells were collected and stained with annexin-V–FITC and 7-ADD as described before to detect PS externalisation. Drug interaction was assessed using CalcuSyn software version 2.1 (Biosoft), which performs multiple drug dose-effect calculations using the median effects method described by Chou and Talalay (Chou and Talalay, 1984), to determine the CI of the combined treatment of doxorubicin and DCMI. A CI value of <0.9 indicates synergy, and CI of >0.9 and <1.2 indicates additivity.
Colony-formation assay and MTT assays
A total of 25,000 MEFs were plated in 35-mm-diameter plates and incubated with different concentrations of DCMI, doxorubicin alone or in combination. After 24 hours, drug-free medium was applied to the samples. After 10 days, colonies were fixed in methanol, stained with crystal violet, washed with water, counted and photographed. In order to evaluate the long-term effect of the different treatments on cell viability, an equivalent set of samples were stained with 3-(4,5-dimethylthiazol-2-yl)-2,5-diphenyltetrazolium (MTT) for 1 hour, then lysed in DMSO and absorbance was read at 570 nm using a standard plate reader.
Statistical analysis
The statistical significance of differences was determined by one-way or two-way analysis of variance (ANOVA) followed by multiple comparison tests (Bonferroni's test). A significance level of 95% (P<0.05) was accepted.
Supplementary Material
[Supplementary Material]
The authors would like to thank Judy McWilliam and Tim Smith for the preparation of samples for electron microscopy. The work was supported by grants from the Medical Research Council, Telethon AIRC, EU (LSGBH-2005-019067-Epistem), Philip Morris USA Inc., FIRB-RBNE01KJHT_004 (Marino), MIUR, MinSan, ISS `Program Italia-USA' N526D5 and ACC12, Italian Human ProteomeNet: (RBRN07BMCT_007) to G.M. Deposited in PMC for release after 6 months.
References
- Amaravadi, R. K., Yu, D., Lum, J. J., Bui, T., Christophorou, M. A., Evan, G. I., Thomas-Tikhonenko, A. and Thompson, C. B. (2007). Autophagy inhibition enhances therapy-induced apoptosis in a Myc-induced model of lymphoma. J. Clin. Invest. 117, 326-336. [DOI] [PMC free article] [PubMed] [Google Scholar]
- Bampton, E. T., Goemans, C. G., Niranjan, D., Mizushima, N. and Tolkovsky, A. M. (2005). The dynamics of autophagy visualized in live cells: from autophagosome formation to fusion with endo/lysosomes. Autophagy 1, 23-36. [DOI] [PubMed] [Google Scholar]
- Carew, J. S., Nawrocki, S. T., Kahue, C. N., Zhang, H., Yang, C., Chung, L., Houghton, J. A., Huang, P., Giles, F. J. and Cleveland, J. L. (2007). Targeting autophagy augments the anticancer activity of the histone deacetylase inhibitor SAHA to overcome Bcr-Abl-mediated drug resistance. Blood 110, 313-322. [DOI] [PMC free article] [PubMed] [Google Scholar]
- Chou, T. C. and Talalay, P. (1984). Quantitative analysis of dose-effect relationships: the combined effects of multiple drugs or enzyme inhibitors. Adv. Enzyme Regul. 22, 27-55. [DOI] [PubMed] [Google Scholar]
- Ciechomska, I. A. and Tolkovsky, A. M. (2007). Non-autophagic GFP-LC3 puncta induced by saponin and other detergents. Autophagy 3, 586-590. [DOI] [PubMed] [Google Scholar]
- Colombo, M. I. (2005). Pathogens and autophagy: subverting to survive. Cell Death Differ. 12 Suppl. 2, 1481-1483. [DOI] [PMC free article] [PubMed] [Google Scholar]
- Daley, E., Wilkie, D., Loesch, A., Hargreaves, I. P., Kendall, D. A., Pilkington, G. J. and Bates, T. E. (2005). Chlorimipramine: a novel anticancer agent with a mitochondrial target. Biochem. Biophys. Res. Commun. 328, 623-632. [DOI] [PubMed] [Google Scholar]
- Dang, C. V. (2008). Antimalarial therapy prevents Myc-induced lymphoma. J. Clin. Invest. 118, 15-17. [DOI] [PMC free article] [PubMed] [Google Scholar]
- Degtyarev, M., De Maziere, A., Orr, C., Lin, J., Lee, B. B., Tien, J. Y., Prior, W. W., van Dijk, S., Wu, H., Gray, D. C. et al. (2008). Akt inhibition promotes autophagy and sensitizes PTEN-null tumors to lysosomotropic agents. J. Cell Biol. 183, 101-116. [DOI] [PMC free article] [PubMed] [Google Scholar]
- Della Corte, L., Broadhurst, A. D., Sgaragli, G. P., Filippini, S., Heeley, A. F., James, H. D., Faravelli, C. and Pazzagli, A. (1979). Clinical response and tricyclic plasma levels during treatment with clomipramine. Br. J. Psychiatry 134, 390-400. [DOI] [PubMed] [Google Scholar]
- Gillman, P. K. (2007). Tricyclic antidepressant pharmacology and therapeutic drug interactions updated. Br. J. Pharmacol. 151, 737-748. [DOI] [PMC free article] [PubMed] [Google Scholar]
- Ichimura, Y., Kumanomidou, T., Sou, Y. S., Mizushima, T., Ezaki, J., Ueno, T., Kominami, E., Yamane, T., Tanaka, K. and Komatsu, M. (2008). Structural basis for sorting mechanism of p62 in selective autophagy. J. Biol. Chem. 283, 22847-22857. [DOI] [PubMed] [Google Scholar]
- Kim, J. and Klionsky, D. J. (2000). Autophagy, cytoplasm-to-vacuole targeting pathway, and pexophagy in yeast and mammalian cells. Annu. Rev. Biochem. 69, 303-342. [DOI] [PubMed] [Google Scholar]
- Klingenstein, R., Lober, S., Kujala, P., Godsave, S., Leliveld, S. R., Gmeiner, P., Peters, P. J. and Korth, C. (2006). Tricyclic antidepressants, quinacrine and a novel, synthetic chimera thereof clear prions by destabilizing detergent-resistant membrane compartments. J. Neurochem. 98, 748-759. [DOI] [PubMed] [Google Scholar]
- Klionsky, D. J., Cuervo, A. M. and Seglen, P. O. (2007). Methods for monitoring autophagy from yeast to human. Autophagy 3, 181-206. [DOI] [PubMed] [Google Scholar]
- Klionsky, D. J., Abeliovich, H., Agostinis, P., Agrawal, D. K., Aliev, G., Askew, D. S., Baba, M., Baehrecke, E. H., Bahr, B. A., Ballabio, A. et al. (2008). Guidelines for the use and interpretation of assays for monitoring autophagy in higher eukaryotes. Autophagy 4, 151-175. [DOI] [PMC free article] [PubMed] [Google Scholar]
- Kochl, R., Hu, X. W., Chan, E. Y. and Tooze, S. A. (2006). Microtubules facilitate autophagosome formation and fusion of autophagosomes with endosomes. Traffic 7, 129-145. [DOI] [PubMed] [Google Scholar]
- Komatsu, M., Ueno, T., Waguri, S., Uchiyama, Y., Kominami, E. and Tanaka, K. (2007a). Constitutive autophagy: vital role in clearance of unfavorable proteins in neurons. Cell Death Differ. 14, 887-894. [DOI] [PubMed] [Google Scholar]
- Komatsu, M., Waguri, S., Koike, M., Sou, Y. S., Ueno, T., Hara, T., Mizushima, N., Iwata, J., Ezaki, J., Murata, S. et al. (2007b). Homeostatic levels of p62 control cytoplasmic inclusion body formation in autophagy-deficient mice. Cell 131, 1149-1163. [DOI] [PubMed] [Google Scholar]
- Kondo, Y., Kanzawa, T., Sawaya, R. and Kondo, S. (2005). The role of autophagy in cancer development and response to therapy. Nat. Rev. Cancer 5, 726-734. [DOI] [PubMed] [Google Scholar]
- Kundu, M. and Thompson, C. B. (2008). Autophagy: basic principles and relevance to disease. Annu. Rev. Pathol. 3, 427-455. [DOI] [PubMed] [Google Scholar]
- Lambert, L. A., Qiao, N., Hunt, K. K., Lambert, D. H., Mills, G. B., Meijer, L. and Keyomarsi, K. (2008). Autophagy: a novel mechanism of synergistic cytotoxicity between doxorubicin and roscovitine in a sarcoma model. Cancer Res. 68, 7966-7974. [DOI] [PMC free article] [PubMed] [Google Scholar]
- Levine, B. (2007). Cell biology: autophagy and cancer. Nature 446, 745-747. [DOI] [PubMed] [Google Scholar]
- Levine, B. and Kroemer, G. (2008). Autophagy in the pathogenesis of disease. Cell 132, 27-42. [DOI] [PMC free article] [PubMed] [Google Scholar]
- Lunemann, J. D. and Munz, C. (2008). Autophagy in CD4(+) T-cell immunity and tolerance. Cell Death Differ. 16, 79-86. [DOI] [PubMed] [Google Scholar]
- Maclean, K. H., Dorsey, F. C., Cleveland, J. L. and Kastan, M. B. (2008). Targeting lysosomal degradation induces p53-dependent cell death and prevents cancer in mouse models of lymphomagenesis. J. Clin. Invest. 118, 79-88. [DOI] [PMC free article] [PubMed] [Google Scholar]
- Maiuri, M. C., Tasdemir, E., Criollo, A., Morselli, E., Vicencio, J. M., Carnuccio, R. and Kroemer, G. (2008). Control of autophagy by oncogenes and tumor suppressor genes. Cell Death Differ. 16, 87-93. [DOI] [PubMed] [Google Scholar]
- Mathew, R., Karantza-Wadsworth, V. and White, E. (2007). Role of autophagy in cancer. Nat. Rev. Cancer 7, 961-967. [DOI] [PMC free article] [PubMed] [Google Scholar]
- Meschini, S., Condello, M., Calcabrini, A., Marra, M., Formisano, G., Lista, P., De Milito, A., Federici, E. and Arancia, G. (2008). The plant alkaloid voacamine induces apoptosis-independent autophagic cell death on both sensitive and multidrug resistant human osteosarcoma cells. Autophagy 4, 1020-1033. [DOI] [PubMed] [Google Scholar]
- Mizushima, N. (2004). Methods for monitoring autophagy. Int. J. Biochem. Cell Biol. 36, 2491-2502. [DOI] [PubMed] [Google Scholar]
- Mizushima, N. and Klionsky, D. J. (2007). Protein turnover via autophagy: implications for metabolism. Annu. Rev. Nutr. 27, 19-40. [DOI] [PubMed] [Google Scholar]
- Mizushima, N., Levine, B., Cuervo, A. M. and Klionsky, D. J. (2008). Autophagy fights disease through cellular self-digestion. Nature 451, 1069-1075. [DOI] [PMC free article] [PubMed] [Google Scholar]
- Munoz-Gamez, J. A., Rodriguez-Vargas, J. M., Quiles-Perez, R., Aguilar-Quesada, R., Martin-Oliva, D., de Murcia, G., de Murcia, J. M., Almendros, A., de Almodovar, M. R. and Oliver, F. J. (2009). PARP-1 is involved in autophagy induced by DNA damage. Autophagy 5, 61-74. [DOI] [PubMed] [Google Scholar]
- Nielsen, K. K., Brøsen, K. and Gram, L. F. (1992). Steady-state plasma levels of clomipramine and its metabolites: impact of the sparteine/debrisoquine oxidation polymorphism. Danish University Antidepressant Group. Eur. J. Clin. Pharmacol. 43, 405-411. [DOI] [PubMed] [Google Scholar]
- O'Connor, K. A. and Roth, B. L. (2005). Finding new tricks for old drugs: an efficient route for public-sector drug discovery. Nat. Rev. Drug Discov. 4, 1005-1014. [DOI] [PubMed] [Google Scholar]
- Orvedahl, A. and Levine, B. (2008). Eating the enemy within: autophagy in infectious diseases. Cell Death Differ. 16, 57-69. [DOI] [PMC free article] [PubMed] [Google Scholar]
- Pattingre, S., Petiot, A. and Codogno, P. (2004). Analyses of Galpha-interacting protein and activator of G-protein-signaling-3 functions in macroautophagy. Methods Enzymol. 390, 17-31. [DOI] [PubMed] [Google Scholar]
- Pilkington, G. J., Parker, K. and Murray, S. A. (2008). Approaches to mitochondrially mediated cancer therapy. Semin. Cancer Biol. 18, 226-235. [DOI] [PubMed] [Google Scholar]
- Ravikumar, B., Vacher, C., Berger, Z., Davies, J. E., Luo, S., Oroz, L. G., Scaravilli, F., Easton, D. F., Duden, R., O'Kane, C. J. et al. (2004). Inhibition of mTOR induces autophagy and reduces toxicity of polyglutamine expansions in fly and mouse models of Huntington disease. Nat. Genet. 36, 585-595. [DOI] [PubMed] [Google Scholar]
- Rubinsztein, D. C., Gestwicki, J. E., Murphy, L. O. and Klionsky, D. J. (2007). Potential therapeutic applications of autophagy. Nat. Rev. Drug Discov. 6, 304-312. [DOI] [PubMed] [Google Scholar]
- Sarkar, S., Perlstein, E. O., Imarisio, S., Pineau, S., Cordenier, A., Maglathlin, R. L., Webster, J. A., Lewis, T. A., O'Kane, C. J., Schreiber, S. L. et al. (2007). Small molecules enhance autophagy and reduce toxicity in Huntington's disease models. Nat. Chem Biol. 3, 331-338. [DOI] [PMC free article] [PubMed] [Google Scholar]
- Scarlatti, F., Granata, R., Meijer, A. J. and Codogno, P. (2008). Does autophagy have a license to kill mammalian cells? Cell Death Differ. 16, 12-20. [DOI] [PubMed] [Google Scholar]
- Szeto, J., Kaniuk, N. A., Canadien, V., Nisman, R., Mizushima, N., Yoshimori, T., Bazett-Jones, D. P. and Brumell, J. H. (2006). ALIS are stress-induced protein storage compartments for substrates of the proteasome and autophagy. Autophagy 2, 189-199. [DOI] [PubMed] [Google Scholar]
- Vandel, B., Vandel, S., Jounet, J. M., Allers, G. and Volmat, R. (1982). Relationship between the plasma concentration of clomipramine and desmethylclomipramine in depressive patients and the clinical response. Eur. J. Clin. Pharmacol. 22, 15-20. [DOI] [PubMed] [Google Scholar]
- Wang, Y., Singh, R., Massey, A. C., Kane, S. S., Kaushik, S., Grant, T., Xiang, Y., Cuervo, A. M. and Czaja, M. J. (2008). Loss of macroautophagy promotes or prevents fibroblast apoptosis depending on the death stimulus. J. Biol. Chem. 283, 4766-4777. [DOI] [PMC free article] [PubMed] [Google Scholar]
- Zaccheo, O., Dinsdale, D., Meacock, P. A., Glynn, P. (2004). Neuropathy target esterase and its yeast homologue degrade phosphatidylcholine to glycerophosphocholine in living cells. J. Biol. Chem. 279, 24024-24033. [DOI] [PubMed] [Google Scholar]
- Zhang, L., Yu, J., Pan, H., Hu, P., Hao, Y., Cai, W., Zhu, H., Yu, A. D., Xie, X., Ma, D. et al. (2007). Small molecule regulators of autophagy identified by an image-based high-throughput screen. Proc. Natl. Acad. Sci. USA 104, 19023-19028. [DOI] [PMC free article] [PubMed] [Google Scholar]
Associated Data
This section collects any data citations, data availability statements, or supplementary materials included in this article.
Supplementary Materials
[Supplementary Material]
