Genome-Wide Analysis in Vivo of Translation with Nucleotide Resolution Using Ribosome Profiling (original) (raw)
. Author manuscript; available in PMC: 2009 Sep 18.
Published in final edited form as: Science. 2009 Feb 12;324(5924):218–223. doi: 10.1126/science.1168978
Abstract
Techniques for systematically monitoring protein translation have lagged far behind methods for measuring messenger RNA (mRNA) levels. Here, we present a ribosome-profiling strategy that is based on the deep sequencing of ribosome-protected mRNA fragments and enables genome-wide investigation of translation with subcodon resolution. We used this technique to monitor translation in budding yeast under both rich and starvation conditions. These studies defined the protein sequences being translated and found extensive translational control in both determining absolute protein abundance and responding to environmental stress. We also observed distinct phases during translation that involve a large decrease in ribosome density going from early to late peptide elongation as well as widespread regulated initiation at non—adenine-uracil-guanine (AUG) codons. Ribosome profiling is readily adaptable to other organisms, making high-precision investigation of protein translation experimentally accessible.
The ability to monitor the identity and quantity of proteins that a cell produces would inform nearly all aspects of biology. Microarray-based measurements of mRNA abundance have revolutionized the study of gene expression (1). However, for several reasons there is a critical need for techniques that directly monitor protein synthesis. First, mRNA levels are an imperfect proxy for protein production because mRNA translation is subject to extensive regulation (2-4). Second predicting the exact protein product from the transcript sequence is not possible because of effects such as internal ribosome entry sites, initiation at non-AUG codons, and nonsense read-through (5, 6). Finally, programmed ribosomal pausing during protein synthesis is thought to aid the cotranslational folding and secretion of some proteins (7-9).
Polysome profiling, in which mRNAs are recovered from translating ribosomes for subsequent microarray analysis, can provide a useful estimate of protein synthesis (10). However, this approach suffers from limited resolution and accuracy. Additionally, upstream open reading frames (uORFs)—short translated sequences found in the 5′ untranslated region (5′UTR) of many genes—result in ribosomes that are bound to an mRNA and yet are not translating the encoded gene (11). Advances in quantitative proteomics circumvent some of these problems (2, 3), but there currently are substantial limits on their ability to independently determine protein sequences and measure low-abundance proteins.
The position of a translating ribosome can be precisely determined by using the fact that a ribosome protects a discrete footprint [∼30 nucleotides (nt)] on its mRNA template from nuclease digestion (12). We reasoned that advances in deep-sequencing technology, which make it possible to read tens of millions of short (∼35 base pairs) DNA sequences in parallel (13), would allow the full analysis of ribosome footprints from cells. Here, we present a ribosome-profiling strategy that is based on the deep sequencing of ribosome-protected fragments and provides comprehensive high-precision measurements of in vivo translation with subcodon precision.
Quantifying RNA with deep sequencing
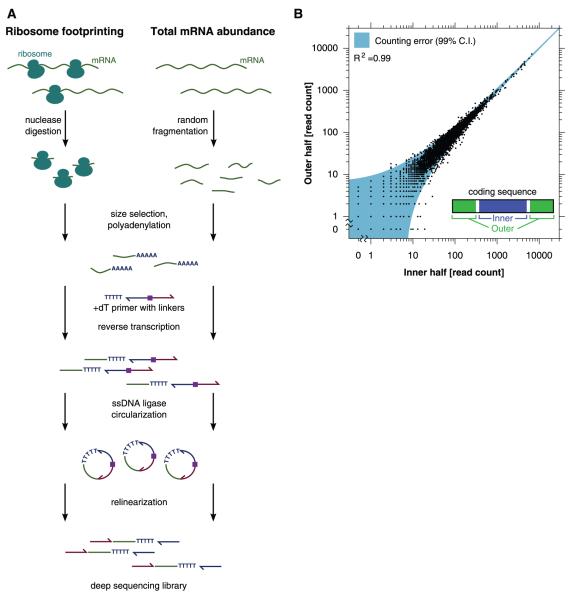
To establish ribosome profiling as a quantitative tool for monitoring translation, we needed to implement three steps: (i) robustly generate ribosome-protected mRNA fragments (“footprints”) whose sequences indicate the position of active ribosomes; (ii) convert these RNA footprints into a library of DNA molecules in a form that is suitable for deep sequencing with minimal distortion; and (iii) measure the abundance of different footprints in this library by means of deep sequencing. We first established that counting the number of times a sequence is read by a deep-sequencing experiment provides a quantitative measurement of its abundance in a complex library (fig. S1) (14). We then optimized nuclease conditions for obtaining ribosome footprints from in vivo translating ribosomes (fig. S2, A and B). Finally, we tested various strategies for preparing sequencing libraries from a pool of randomly fragmented yeast mRNAs, reasoning that the abundance of different fragments of the same mRNA should be comparable. Using this benchmark, we optimized a strategy, outlined in Fig. 1A, that avoided RNA ligases that typically are used in previous approaches for converting small RNAs to DNA (15) because they caused large distortions in the distribution of RNA species (figs. S3 and S4) (16).
Fig. 1.
Quantifying mRNA abundance and ribosome footprints by means of deep sequencing. (A) Schematic of the protocol for converting ribosome footprints or randomly fragmented mRNA into a deep-sequencing library. (B) Internal reproducibility of mRNA-abundance measurements. CDSs were conceptually divided as shown, and the mRNA counts on the two regions are plotted. The error estimate is based on the χ2 statistic.
We performed deep sequencing on a DNA library that was generated from fragmented total mRNA in order to measure abundances of different transcripts (table S1), focusing on 5295 genes that were relatively free of repetitive sequences and overlapping transcribed features (14). We conceptually divided each coding sequence (CDS) into two regions of equal length. The number of reads aligning to these two regions thus represents independent measurements of the abundance of the full-length mRNA before fragmentation. The error between these two counts only slightly exceeded the theoretical minimum dictated by sampling statistics (Fig. 1B), demonstrating the accuracy and sequence independence of our library-generation strategy. The mRNA density measurements were highly reproducible [correlation coefficient (_R_2) = 0.98; SD in log ratio between biological replicates corresponded to a 1.2-fold change] (fig. S5). Our measurements also agreed well with previous microarray-based measurements of mRNA abundance (_R_2 = 0.66) (fig. S6) (17, 18). A particular advantage of our strategy for quantitating mRNA levels is that it retained strand information and, by fragmenting messages to a small uniform size, minimized distortions caused by RNA secondary structure, allowing accurate quantifications of specific subregions (for example, individual exons) of transcripts.
Monitoring ribosome position with single-codon resolution with deep sequencing
We sequenced 42 million fragments that were generated by using the ribosome protection assay on the budding yeast Saccharomyces cerevisiae (14). 7.0 million (16%) of sequencing reads aligned to CDSs, whereas most of the remainder were derived from ribosomal RNA (rRNA) (table S1). Because most contaminating rRNA is derived from a few specific sites, it should be straight-forward to remove them by means of subtractive hybridization before sequencing.
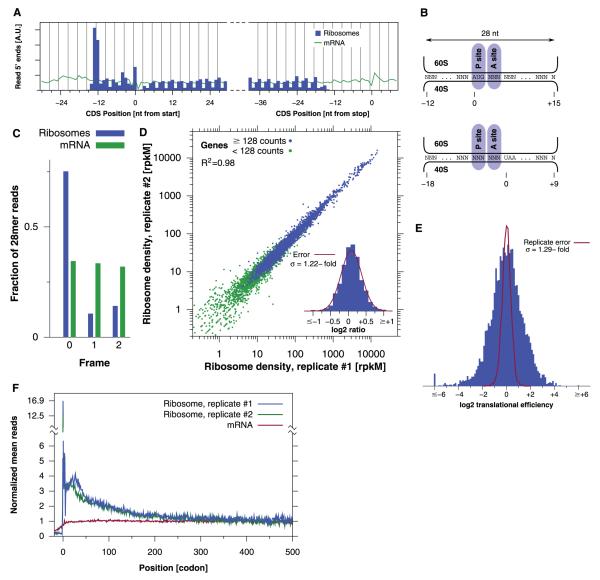
Along a given message, we found that the positions of the 5′ ends of the footprint fragments started abruptly 12 to 13 nt upstream of the start codon, ended 18 nt upstream from the stop codon, and showed a strong 3-nt periodicity (Fig.2, A and B). Thus, coverage by ribosome footprints defines the sequence being translated. The high precision of ribosome positions allowed us to monitor the reading frame being translated. For example, 75% of the 28-nt oligomer ribosome-protected fragments started on the first nucleotide of a codon (Fig. 2C). Although each individual footprint provides imperfect statistical evidence of the ribosome position, averaging multiple codons allows unambiguous determination of the reading frame. This should enable genome-wide studies of programmed frameshifting and readthrough of stop codons (5).
Fig. 2.
Ribosome footprints provide a codon-specific measurement of translation. (A) Total number of ribosome footprints falling near the beginning or end of CDSs. (B) The offset between the start of the footprint and the P- and A-site codons at translation initiation and termination (34). (C) Positionof28-nt ribosome footprints relative to the reading frame. (D) Ribosome footprint densities in two complete biological replicates. Density in terms of reads per kilobase per million (rpkM) is corrected for total reads and CDS length (21). (Inset) Histogram of log2 ratios between replicates for genes with low counting statistics error (fig. S7) along with the normal error curve (mean = 0.084, SD = 0.291 in log2 units; σ is SD expressed as a fold change). (E) Histogram of translational efficiency, the ratio of ribosome footprint density to mRNA density. The error shows actual ratios between biological replicates (SD = 0.367 in log2 units). (F) Read density as a function of position. Well-expressed genes were each individually normalized and then averaged with equal weight (14).
Genome-wide measurements of translation
We next sought to use ribosome profiling data to quantify the rate of protein synthesis. We estimated protein expression from the density of ribosome footprints (14), although further improvements could incorporate variations in the speed of translation along a message (see below). From 7.0 million footprint sequences, we were able to measure the translation of 4648 of 5295 genes with a precision (fig. S7) and reproducibility comparable with our mRNA abundance measure (_R_2 = 0.98; ∼20% error between biological replicates) (Fig. 2D).
Comparing the rate of translation with mRNA abundance from the same samples revealed a roughly 100-fold range of translation efficiency (as measured by the ratio of ribosome footprints to mRNA fragments) between different yeast genes, in addition to a subset of transcripts that were translationally inactive (Fig. 2E and fig. S8A). Thus, differences in translational efficiency, which are invisible to mRNA abundance measurements, contribute substantially to the dynamic range of gene expression (table S2).
The rate of protein synthesis is expected to be a better predictor of protein abundance than measurements of mRNA levels. Indeed, estimates of the absolute abundance of proteins from proteome-wide mass spectrometry had a correlation coefficient of _R_2 = 0.42 with our translation-rate measurements versus _R_2 = 0.17 with our mRNA abundance (fig. S9) (19). Differences in protein stability contribute to the imperfect correlation between the rate of a protein’s synthesis and its steady-state levels. Thus, comparison between changes in synthesis measured by ribosome profiling and abundance measured by mass spectrometry should reveal examples of the regulated degradation of proteins (19).
Ribosome profiling reveals different phases of translation
Previous polysome studies found that shorter genes tended to have a higher ribosome density (10). We saw a similar, though weaker, trend and an overall agreement between ribosome profiling and polysome profiling (figs. S8B and S10). This phenomenon was surprising because it suggested that the rate of translation initiation was sensitive to the total length of the gene, thus causing shorter messages to be better translated. Alternatively, there may be a higher ribosome density in a region of constant length at the start of each gene, which would contribute a larger fraction of the total ribosome occupancy for shorter genes. However, a previous study found no evidence for higher ribosome density at the 5′ end of six individual mRNAs (20).
Our genome-wide position-specific measurements of ribosome occupancy let us test this possibility more broadly. An averaging over hundreds of well-translated genes revealed considerably greater (approximately threefold) ribosome density for the first 30 to 40 codons (Fig. 2F), which after 100 to 200 codons relaxed to a uniform density that persisted until translation termination (fig. S11A). The excess of ribosomes at the start of genes explained the higher ribosome density on shorter genes and was not an artifact of immobilizing ribosomes with cycloheximide treatment or stalled ribosomes on the 5′ end of genes (fig. S12). Elevated 5′ ribosome density appears to be a general feature of translation that is independent of the length of the CDS, its translation level, and the presence of an N-terminal signal sequence (fig. S11, B to D). Correcting the estimate of protein-synthesis rates for this effect substantially improved the correlation with protein abundance (_R_2 =0.60 versus _R_2 = 0.42) (fig. S13). This argues that the decrease in ribosome density along a transcript results from either increases in the rate of translation elongation and/or premature translation termination.
Codon-specific measurements of ribosome positions
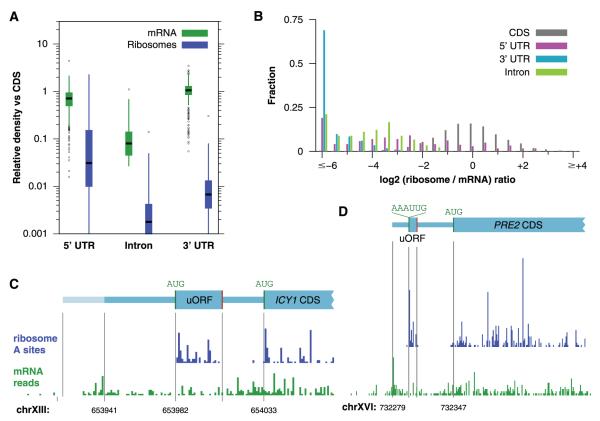
Ribosome profiling reports on the precise positions of ribosomes, making it possible to delineate what parts of a transcript are being decoded. Almost all (98.8%) of the ribosome footprints in our data set mapped to protein-coding regions. Nonetheless, this left 56,105 unexplained footprints, which probably represent true translation events because they copurified with the 80_S_ ribosomes. Furthermore, they were far more common in the 5′UTRs (Fig. 3A), whereas we expect background resulting from the spurious capture of RNAs to be evenly distributed across transcripts. Introns and 3′UTRs, in particular, typically had less than 1% of the ribosome density seen in a CDS (fig. S14), and most had no observed footprints. The absence of reads in unspliced introns indicates that the intronic regions detected from mRNA sequencing experiments (21) are rarely translationally active; thus, ribosome profiling can simplify the analysis of expression of spliced genes.
Fig. 3.
Ribosome occupancy of upstream open-reading frames and other sequences. (A) Density of mRNA fragments and ribosome footprints on non—protein-coding sequences relative to the associated CDS. (B) Histogram of translational efficiencies for different classes of sequences. (C) Ribosome and mRNA density showing the uORF in the ICY1 5′UTR. (D) Ribosome and mRNA density showing non-AUG uORFs in the PRE2 5′ UTR. The proposed AAAUUG translational initiation site is shown along with the subsequent open reading frame and stop codon (indicated by a vertical line).
In contrast, about one quarter of the 5′UTRs showed substantial translational activity, in many cases comparable to that of CDSs (Fig. 3B). One source of translation in 5′UTRs is the presence of uORFs, short translated reading frames upstream of the CDS that can play an important role in translational regulation (11). We identified 1048 candidate uORFs in the yeast genome on the basis of the presence of an upstream AUG codon (table S3) (22, 23). We focused on the 86 upstream AUG codons in the most abundant messages (14), in which we could reliably quantify even low levels of translation. Among this set, only 20 of the uORFs were well-translated, a prominent example being ICY1 (Fig. 3C and table S4). More broadly, among all annotated 5′UTRs we found evidence for the translation of 153 uORFs (table S5), fewer than 30 of which had previously been experimentally evaluated.
Nonetheless, these uORFs account for only a fraction of the 706 genes in which we found substantial translation in the 5′UTR. Some genes, such as PRE2 and PDR5, had a discrete region of ribosome density that was terminated by a stop codon but lacked an AUG codon (Fig. 3D and fig. S15). In both cases, the translated region could be accounted for by initiation at a UUG codon. There are two known examples in which translation initiates at a non-AUG codon in yeast, the tRNA synthetases GRS1 (24) and ALA1 (25), and both are apparent in our data (fig. S16). Initiation at non-AUG codons is strongly dependent on the surrounding sequence context (26), in contrast to canonical initiation in yeast (27), and the non-AUG initiation sites in PRE2 and PDR5 both match an experimentally verified strong initiation sequence (26).
On the basis of this finding, we searched for other candidate non-AUG initiation sites where a codon with a single mismatch against AUG had a favorable initiation context (14). Most of these start sites would lead to short uORFs, as seen in PRE2 and PDR5, although there was evidence for N-terminal extensions in a few genes, including the cyclin CLB1 (fig. S17). In aggregate, these 1615 predicted uORFs had a much greater (approximately threefold) translational efficiency than other regions of 5′UTRs, particularly when the start codon differed from AUG at the first position (approximately six-fold; see below). We found a strong bias for 28-nucleotide oligomer footprints to align with the predicted reading frame just downstream of these non-AUG initiation sites, which is similar to the effect we saw in protein-coding genes (fig S18).
Furthermore, when elongation was not inhibited, ribosome footprints were depleted from 5′UTRs just as they were from the beginning of protein-coding genes, indicating that they were active ribosomes capable of runoff elongation (fig. S19). Overall, we found 143 non-AUG uORFs with evidence of translation (table S6), which account for 20% of 5′UTR ribosome footprints. Thus, there is pervasive initiation at specific, favorable, non-AUG sites.
Translational responses to starvation
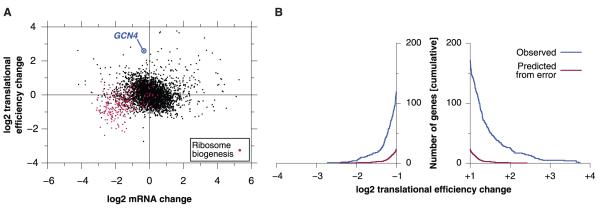
The ability to evaluate rates of translation as well as mRNA abundance with high precision enables quantitative measurements of translational regulation. Acute amino acid starvation in yeast produces substantial transcriptional and translational changes (28), including a global decrease in translational initiation (29). We subjected yeast to 20 min of amino acid deprivation and made ribosome-footprint and mRNA-abundance measurements (fig. S20). We then compared starvation and log-phase growth measurements for the 3769 genes for which statistical counting error did not compromise our ability to detect translational regulation (Fig. 4A and fig. S7). One-third of the genes showed changes in relative translational efficiency upon starvation (fig. S21), with 291 strongly affected (greater than twofold) genes (Fig. 4B and table S7). Forty-three of the 111 down-regulated genes (P < 10-40) are involved in ribosome biogenesis (Fig. 4A and table S8), a process that is repressed at many different levels in response to stresses such as starvation (30, 31).
Fig. 4.
Translational response to starvation. (A) Changes in mRNA abundance and translational efficiency in response to starvation. (B) Distribution of translational efficiency changes in response to starvation. Measurement error was estimated from the actual distribution of ratios between biological replicates. A false discovery rate threshold of 10% corresponds to a twofold change in translational efficiency.
The fraction of each gene’smRNAthat is associated with polysomes had previously been used to provide a semiquantitative measurement of translational efficiency (32). Many ribosome biogenesis transcripts leave the polysome fraction in response to starvation, in agreement with our observations, and changes in polysome association were significantly correlated with changes in translation that were measured with ribosome profiling (up-regulated genes, P < 10-12 and down-regulated genes, P < 10-6) (fig. S22). Ribosome profiling also allowed us to detect the sevenfold translational induction of GCN4, a well-studied and translationally regulated gene (29) whose response to starvation was not detected by the earlier polysome studies (32).
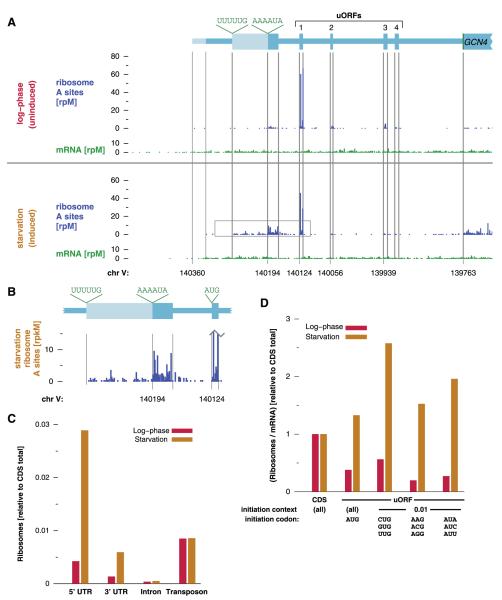
The regulation of GCN4 translation results from four uORFs in its 5′UTR [reviewed in (29)]. During log-phase growth, we saw translation of GCN4 uORF 1, along with some translation of uORFs 2 to 4, but very little translation of the main GCN4 CDS (Fig. 5A). This pattern of ribosome occupancy is consistent with the standard model of GCN4 5′UTR function, in which uORF 1 is constitutively translated but permissive for downstream reinitiation. In log-phase growth, reinitiation occurs at uORFs 2 to 4 rather than at GCN4 itself. Upon starvation, however, reinitiation bypasses uORFs 2 to 4 and reaches the main CDS, thereby relieving the translational repression of GCN4. Indeed, we saw a decrease in ribosome occupancy of the repressive uORFs as well as an increase in translation of the protein-coding region upon starvation. Unexpectedly, we also observed additional translation in the 5′UTR upstream of the characterized uORFs. This region was detectably translated even in log-phase growth, and its translation was greatly enhanced under starvation (Fig. 5B). Most translation in this region started from a noncanonical AAA_AUA_ site, although there was also initiation from an upstream in-frame noncanonical UUU_UUG_ site. Sequences overlapping this region are required for proper translational regulation by uORF 1 (33), which supports the idea of these non-AUG uORFs having a functional role.
Fig. 5.
Changes in 5′UTR translation during starvation. (A) Ribosome and mRNA densities in the GCN4 5′UTR in repressive and inducing conditions. The four known uORFs are indicated along with the proposed initiation sites for upstream translation. (B) Non-AUGuORF upstream of GCN4. Shown is an enlargement of the gray boxed area in (A). (C) Ribosome occupancy of noncoding sequences. The number of ribosome footprints mapping to different classes of regions is shown relative to the number of CDS reads. (D) Aggregate translational efficiency of uORFs (14).
More broadly, during starvation we found a large (sixfold) increase in the fraction of ribosome footprints derived from 5′UTRs but little change in introns (Fig. 5C). There was also a less pronounced increase in ribosome occupancy of 3′UTRs, although the overall density remained low. The non-AUG uORFs showed a particularly dramatic increase in ribosome occupancy during starvation, apparently exceeding the translation not only of canonical AUG uORFs but of the CDSs themselves (Fig. 5D). Non-AUG uORFs upstream of genes such as GLN1 and PRE9, which were marginally translated during log-phase growth, had much higher ribosome densities after starvation (figs. S23 and S24). However, even in the case of GLN1, it is clear that no single uORF can account for the entire distribution of ribosomes on the 5′UTR. Instead, there is a more general change in the stringency of initiation codon selection that favors certain noncanonical start sites but has broader effects as well (fig. S25). The initiation factor eIF2α, whose phosphorylation mediates the effect of starvation on translation (29), also has a prominent role in initiator codon selection (34) and thus may contribute to this relaxation.
Perspective
Ribosome profiling greatly increases our ability to quantitatively monitor protein production, as is underscored by our considerably improved predictions of protein abundance. This technique should become a central tool in the repertoire available for studying the internal state of cells. The basic strategy is readily adaptable to other organisms, including mammals, and it can allow tissue-specific translational profiling by using the restricted expression of epitope-tagged ribosomes (35). Immediate applications of ribosome profiling include studies of the translational control of gene expression and molecular characterization of disease states such as cancer, in which associated cellular stress will probably directly affect translation (36). Additionally, the ability to determine precisely what regions of a message are being decoded should greatly aid efforts to experimentally define the full proteome of complex organisms such as humans.
Our approach also allows in-depth analysis of the process of translation in vivo. For example, ribosome profiling revealed an unanticipated complexity to translation that leads to differences in ribosome density along the length of CDSs. This presumably reflects differences in the functional states of the ribosome that affect its rate of elongation or processivity. The switch from the early to the late elongation phase begins with the first emergence of the nascent peptide from the ribosome, allowing interactions between the nascent chain and molecular chaperones (37). Measurements of the effects of starvation on translational activity also revealed widespread and regulated initiation at non-AUG codons, suggesting a new effect of the well-studied eIF2α-mediated stress response. Finally, high-resolution gene-specific ribosome density profiles will enable efforts to explore how variations in the rate of translation, as well as effects such as ribosomal pausing, modulate protein synthesis and folding.
Supplementary Material
MS 131482 Supplementary Data
Acknowledgments
We thank C. Chu, J. deRisi, and K. Fischer for help with sequencing; D. Bartel, H. Guo, D. Herschlag, J. Hollien, S. Luo, and G. Schroth for helpful discussions of RNA methods; P. Walter and T. Aragon for the use of a density gradient fractionator; the 2008 Woods Hole Physiology course students for data analysis; and members of the Weissman lab, L. Lareau, and T. Ingolia for critical commentary on the manuscript. Sequencing data have been deposited in the National Center for Biotechnology Information’s Gene Expression Omnibus (www.ncbi.nlm. nih.gov/geo/) under accession number GSE13750. This investigation was supported by a NIH P01 grant (AG10770) and a Ruth L. Kirschstein National Research Service Award (GM080853) (to N.T.I.) and by the Howard Hughes Medical Institute (to J.S.W.). N.T.I. and J.S.W. are the inventors on a patent application, assigned to the Regents of the University of California, on the ribosome profiling and sequencing library generation techniques described in this work. S.G. and J.R.S.N. developed a microarray-based approach that served as a proof of principle for the present studies; N.T.I. and J.S.W. designed the experiments; N.T.I. performed the experiments and analyzed the data; and N.T.I. and J.S.W. interpreted the results and wrote the manuscript.
References and Notes
- 1.Brown PO, Botstein D. Nat. Genet. 1999;21:33. doi: 10.1038/4462. [DOI] [PubMed] [Google Scholar]
- 2.Baek D, et al. Nature. 2008;455:64. doi: 10.1038/nature07242. [DOI] [PMC free article] [PubMed] [Google Scholar]
- 3.Selbach M, et al. Nature. 2008;455:58. doi: 10.1038/nature07228. [DOI] [PubMed] [Google Scholar]
- 4.Sonenberg N, Hinnebusch AG. Mol. Cell. 2007;28:721. doi: 10.1016/j.molcel.2007.11.018. [DOI] [PubMed] [Google Scholar]
- 5.Namy O, Rousset JP, Napthine S, Brierley I. Mol. Cell. 2004;13:157. doi: 10.1016/s1097-2765(04)00031-0. [DOI] [PubMed] [Google Scholar]
- 6.Touriol C, et al. Biol. Cell. 2003;95:169. doi: 10.1016/s0248-4900(03)00033-9. [DOI] [PubMed] [Google Scholar]
- 7.Komar AA, Lesnik T, Reiss C. FEBS Lett. 1999;462:387. doi: 10.1016/s0014-5793(99)01566-5. [DOI] [PubMed] [Google Scholar]
- 8.Lakkaraju AK, Mary C, Scherrer A, Johnson AE, Strub K. Cell. 2008;133:440. doi: 10.1016/j.cell.2008.02.049. [DOI] [PMC free article] [PubMed] [Google Scholar]
- 9.Wolin SL, Walter P. EMBO J. 1988;7:3559. doi: 10.1002/j.1460-2075.1988.tb03233.x. [DOI] [PMC free article] [PubMed] [Google Scholar]
- 10.Arava Y, et al. Proc. Natl. Acad. Sci. U.S.A. 2003;100:3889. doi: 10.1073/pnas.0635171100. [DOI] [PMC free article] [PubMed] [Google Scholar]
- 11.Meijer HA, Thomas AA. Biochem. J. 2002;367:1. doi: 10.1042/BJ20011706. [DOI] [PMC free article] [PubMed] [Google Scholar]
- 12.Steitz JA. Nature. 1969;224:957. doi: 10.1038/224957a0. [DOI] [PubMed] [Google Scholar]
- 13.Bentley DR, et al. Nature. 2008;456:53. doi: 10.1038/nature07517. [DOI] [PMC free article] [PubMed] [Google Scholar]
- 14.Materials and methods are available as supporting material on Science Online.
- 15.Berezikov E, Cuppen E, Plasterk RH. Nat. Genet. 2006;38(suppl):S2. doi: 10.1038/ng1794. [DOI] [PubMed] [Google Scholar]
- 16.Romaniuk E, McLaughlin LW, Neilson T, Romaniuk PJ. Eur. J. Biochem. 1982;125:639. doi: 10.1111/j.1432-1033.1982.tb06730.x. [DOI] [PubMed] [Google Scholar]
- 17.Holstege FC, et al. Cell. 1998;95:717. doi: 10.1016/s0092-8674(00)81641-4. [DOI] [PubMed] [Google Scholar]
- 18.Nagalakshmi U, et al. Science. 2008;320:1344. doi: 10.1126/science.1158441. [DOI] [PMC free article] [PubMed] [Google Scholar]
- 19.de Godoy LM, et al. Nature. 2008;455:1251. doi: 10.1038/nature07341. [DOI] [PubMed] [Google Scholar]
- 20.Arava Y, Boas FE, Brown PO, Herschlag D. Nucleic Acids Res. 2005;33:2421. doi: 10.1093/nar/gki331. [DOI] [PMC free article] [PubMed] [Google Scholar]
- 21.Mortazavi A, Williams BA, McCue K, Schaeffer L, Wold B. Nat. Methods. 2008;5:621. doi: 10.1038/nmeth.1226. [DOI] [PubMed] [Google Scholar]
- 22.Vilela C, McCarthy JE. Mol. Microbiol. 2003;49:859. doi: 10.1046/j.1365-2958.2003.03622.x. [DOI] [PubMed] [Google Scholar]
- 23.Zhang Z, Dietrich FS. Curr. Genet. 2005;48:77. doi: 10.1007/s00294-005-0001-x. [DOI] [PubMed] [Google Scholar]
- 24.Chang KJ, Wang CC. J. Biol. Chem. 2004;279:13778. doi: 10.1074/jbc.M311269200. [DOI] [PubMed] [Google Scholar]
- 25.Tang HL, et al. J. Biol. Chem. 2004;279:49656. doi: 10.1074/jbc.M408081200. [DOI] [PubMed] [Google Scholar]
- 26.Chen SJ, Lin G, Chang KJ, Yeh LS, Wang CC. J. Biol. Chem. 2008;283:3173. doi: 10.1074/jbc.M706968200. [DOI] [PubMed] [Google Scholar]
- 27.Yoon H, Donahue TF. Mol. Microbiol. 1992;6:1413. doi: 10.1111/j.1365-2958.1992.tb00861.x. [DOI] [PubMed] [Google Scholar]
- 28.Hinnebusch AG. Microbiol. Rev. 1988;52:248. doi: 10.1128/mr.52.2.248-273.1988. [DOI] [PMC free article] [PubMed] [Google Scholar]
- 29.Hinnebusch AG. Annu. Rev. Microbiol. 2005;59:407. doi: 10.1146/annurev.micro.59.031805.133833. [DOI] [PubMed] [Google Scholar]
- 30.Jorgensen P, et al. Genes Dev. 2004;18:2491. doi: 10.1101/gad.1228804. [DOI] [PMC free article] [PubMed] [Google Scholar]
- 31.Pleiss JA, Whitworth GB, Bergkessel M, Guthrie C. Mol. Cell. 2007;27:928. doi: 10.1016/j.molcel.2007.07.018. [DOI] [PMC free article] [PubMed] [Google Scholar]
- 32.Smirnova JB, et al. Mol. Cell. Biol. 2005;25:9340. doi: 10.1128/MCB.25.21.9340-9349.2005. [DOI] [PMC free article] [PubMed] [Google Scholar]
- 33.Grant CM, Miller PF, Hinnebusch AG. Nucleic Acids Res. 1995;23:3980. doi: 10.1093/nar/23.19.3980. [DOI] [PMC free article] [PubMed] [Google Scholar]
- 34.Kapp LD, Lorsch JR. Annu. Rev. Biochem. 2004;73:657. doi: 10.1146/annurev.biochem.73.030403.080419. [DOI] [PubMed] [Google Scholar]
- 35.Heiman M, et al. Cell. 2008;135:738. doi: 10.1016/j.cell.2008.10.028. [DOI] [PMC free article] [PubMed] [Google Scholar]
- 36.Holcik M, Sonenberg N. Nat. Rev. Mol. Cell Biol. 2005;6:318. doi: 10.1038/nrm1618. [DOI] [PubMed] [Google Scholar]
- 37.Nelson RJ, Ziegelhoffer T, Nicolet C, Werner-Washburne M, Craig EA. Cell. 1992;71:97. doi: 10.1016/0092-8674(92)90269-i. [DOI] [PubMed] [Google Scholar]
Associated Data
This section collects any data citations, data availability statements, or supplementary materials included in this article.
Supplementary Materials
MS 131482 Supplementary Data
