Discharge Profiles of Identified GABAergic in Comparison to Cholinergic and Putative Glutamatergic Basal Forebrain Neurons across the Sleep–Wake Cycle (original) (raw)
Abstract
Whereas basal forebrain (BF) cholinergic neurons are known to participate in processes of cortical activation during wake (W) and paradoxical sleep (PS or P, also called REM sleep), codistributed GABAergic neurons have been thought to participate in processes of cortical deactivation and slow-wave sleep (SWS or S). To learn the roles the GABAergic neurons might play, in relation to cholinergic and glutamatergic neurons, we juxtacellularly recorded and labeled neurons during natural sleep–wake states in head-fixed rats. Neurobiotin (Nb)-labeled cells were identified immunohistochemically as choline acetyltransferase (ChAT)+, glutamic acid decarboxylase (GAD)+, or ChAT−/GAD−. Of the latter, some were identified as glutamatergic by immunostaining of their terminals with the vesicular glutamate transporter (VGluT2). In contrast to ChAT+ neurons, which all discharged maximally during W and PS, GAD+ neurons comprised multiple sleep–wake subgroups. Some GABAergic neurons discharged maximally during W and PS, as WP-max active cells (36%), and in positive correlation with gamma electroencephalographic (EEG) activity. Some discharged maximally during SWS, as S-max active cells (28%), and in positive correlation with delta EEG activity. Others increased their discharge progressively during sleep to discharge maximally during PS, as P-max active cells (36%), and in negative association with electromyographic (EMG) activity. ChAT−/GAD− cells comprised WP-max (46%), S-max (17%), P-max (17%), and W-max active cells (14%), whose discharge was positively correlated with EMG activity. GABAergic neurons would thus play similar or reciprocal roles to other cholinergic and glutamatergic BF neurons in regulating cortical activity and muscle tone along with behavior across sleep–wake states.
Introduction
Considerable pharmacological and physiological evidence has indicated that cholinergic neurons in the basal forebrain (BF) play an important role in stimulating cortical activation, which occurs during wake (W) and paradoxical sleep (PS, also called rapid eye movement sleep, REMS) (Berntson et al., 2002; Jones, 2004). Yet, from early studies using stimulation and lesions, evidence also indicated that neurons in the BF could promote slow-wave sleep (SWS, also called non-REMS) (Szymusiak, 1995; Jones, 2005a). It has been thought that the latter BF neurons would comprise noncholinergic neurons and very likely GABAergic neurons, which are intermingled with the cholinergic neurons through the BF (Gritti et al., 1993, 1994, 1997). Single-unit recording studies using juxtacellular labeling for immunohistochemical identification of recorded cells made possible study of the discharge of identified cholinergic and GABAergic neurons in anesthetized rats and revealed that cholinergic neurons discharged maximally with cortical activation, whereas some GABAergic neurons discharged maximally with cortical slow-wave activity (Duque et al., 2000; Manns et al., 2000a,b). In addition, noncholinergic, non-GABAergic, possibly glutamatergic BF neurons also discharged in association with cortical activation (Manns et al., 2001, 2003a). However, the discharge of these cell types in association with cortical activity in anesthetized animals could not reveal their actual discharge in association with natural sleep–wake states.
More recently, development of single-unit recording in head-fixed rats has permitted juxtacellular labeling and thus identification of BF neurons recorded during natural sleeping and waking (Lee et al., 2004). The BF cell population was found to include neurons that discharged maximally in different states, including W, SWS, or PS, similarly to units previously recorded in freely moving animals (Szymusiak and McGinty, 1986; Szymusiak et al., 2000). In this preparation, we discovered that all identified cholinergic BF neurons discharged maximally with gamma and theta electroencephalographic (EEG) activity during W and PS (Lee et al., 2005b).
In the current study, we aimed to record and identify GABAergic BF neurons in head-fixed rats to determine whether they discharged in association with cortical activation and/or slow waves on the EEG or perhaps in association with changes in electromyographic (EMG) activity, reflecting changes in muscle tone and behavioral arousal, across the sleep–wake cycle and in relation to sleep–wake states (Jones, 2005b). We compared their discharge profile and properties to those of cholinergic neurons [as previously described (Lee et al., 2005b)] and of noncholinergic/non-GABAergic neurons, which we recently proved comprise glutamatergic neurons (Henny and Jones, 2006b, 2008). Using the juxtacellular technique, we recorded and labeled BF neurons with Neurobiotin (Nb) and subsequently identified them immunohistochemically by staining for glutamic acid decarboxylase (GAD) and choline acetyltransferase (ChAT). Putative glutamatergic, ChAT-negative (−)/GAD− cells were examined for staining of the vesicular glutamate transporter (VGluT2) in their terminals and thus proof of their neurotransmitter phenotype as glutamatergic (Fremeau et al., 2001; Henny and Jones, 2006b, 2008). As briefly reported (Hassani et al., 2006), GABAergic and glutamatergic BF neurons were found to comprise diverse yet overlapping sleep–wake subgroups, which are either similar or complementary in their discharge profiles and potential roles across sleep–wake states.
Materials and Methods
Animals, surgery, and recording.
All experiments were performed on 83 adult male Long–Evans rats (200–250 g, Charles River). Procedures were in conformity with the guidelines of the Canadian Council on Animal Care and were approved by the McGill University Animal Care committee. Animals were housed under a 12:12 h light–dark schedule with lights on from 7:00 A.M. to 7:00 P.M. and had ad libitum access to food and water. Under deep anesthesia (ketamine, xylazine, and acepromazine: 65/5/1 mg/kg in a mixture of 2 ml/kg initial dose and 1 ml/kg booster if needed, i.p.), rats were implanted with a metal u-frame to hold the head by screws to a sliding carriage adapter within a stereotaxic frame (Lee et al., 2004). They were simultaneously implanted with electrodes for recording EEG [epidural screws over olfactory bulb (OB), anterior medial prefrontal (PF), and retrosplenial (RS) cortices] and EMG (silver wire loops in neck muscles), as described previously. Following recovery from surgery (∼2 d), the rats were positioned in the carriage adapter for fixing their heads with their bodies lying in a small Plexiglas box, which prevented twisting but not moving of their bodies or limbs. Indeed, they could engage in running movements by sliding their paws on the floor of the box, scratching, grooming, and taking food into their mouth when provided. They were habituated to the head fixation over a period of 6–9 d by increasing gradually the time spent in the apparatus (from ½ to 1, 2, 3, and ultimately 5 or 6 h) and by providing a cereal treat as reward at the end of each session. Under these conditions, the rats learned to sleep in the head-fixation apparatus for the majority of the time during recording, as they do naturally during the afternoon (see below). Following full habituation, the animals were anesthetized again (as described above) and operated to drill holes in the skull (anterior–posterior, −1.0 mm from bregma, and lateral, ±2.5 mm from midline) and open the dura over the BF on each side of the brain. Daily recording sessions of a maximum of ∼6 h (11:00 A.M. to 5 P.M.) were performed over a maximum of 5 d.
Single units were recorded using glass micropipettes (∼1 μm tip) that were filled with ∼5% Nb (Vector Laboratories) in 0.5 m NaCl solution and an intracellular amplifier (Neurodata IR-283A, Cygnus Technology). They were recorded in association with EEG and EMG (CyberAmp380, Molecular Devices) as well as behavior by video, simultaneously acquired by EEG and sleep-waking software (Harmonie version 5.2, Stellate), as described previously (Lee et al., 2004, 2005b). Before labeling, cells were generally recorded for 5 min or more and during at least one full sleep–wake cycle that included at least one epoch of active W, SWS, and PS. As typical of the normal afternoon sleep–wake cycle in the rat, equivalent periods of W and PS were obtained with longer periods of SWS during unit recording (see below). Following successful recording of a full sleep–wake cycle, one cell per side was submitted to juxtacellular labeling, as previously described (Manns et al., 2000a; Lee et al., 2005b). Of >1000 units recorded in the BF, 133 were submitted to juxtacellular labeling on one or two sides in the brains of 83 rats. Within 2–6 h after applying the juxtacellular labeling, animals received an overdose of sodium pentobarbital (Somnotol, ∼100 mg/kg, i.p.) and were perfused with a 4% paraformaldehyde solution.
Data analysis.
Only units recorded during at least one episode of active W, SWS, and PS were considered for analysis. Together with synchronized video images of behavior, electrophysiological records of EEG and EMG were scored by 10 s epochs for sleep–wake state and stage classification into active W (aW), quiet W (qW), transition to SWS (tSWS), SWS, transition to PS (tPS), and PS [as described previously (Maloney et al., 1997; Lee et al., 2004)]. The average percentages of time spent in W (22%, including ∼11% aW plus ∼11% qW), SWS (62%, including ∼19.5% tSWS, ∼35% SWS, and 7.5% tPS), and PS (16%) during recording of units (for 64 units included in the results) was found to be similar to proportions previously obtained during the same afternoon period in freely moving rats (Maloney et al., 1999).
The unit activity was quantified as number of spikes per second. Units were classified in sleep–wake subgroups according to whether their discharge rate per second varied significantly across states (p < 0.05 by ANOVA) and if so, according to the principal state of aW, SWS, or PS in which their maximal discharge rate(s) occurred (_p_ < 0.05 by _post hoc_ paired comparisons) (Lee et al., 2004). These tests were performed on spike rate per second with 10 s and thus measurements per epoch. Units whose discharge was significantly greater in aW and PS than in SWS were classified as “WP-max”; those whose discharge was greater in SWS than aW or PS, as “S-max” (which also included some cells whose rate was equivalent in SWS and PS but greater in tPS than PS); those whose discharge was greater in PS than aW and SWS, as “P-max”; those whose discharge was greater in aW than SWS or PS, as “W-max”; and those whose discharge did not vary significantly across aW, SWS, and PS, as “wsp-eq” (equivalent). To be sure that the classification was not dependent on recording time and thus sampling from the principal states, an ANOVA was performed for the number of (10 s) epochs per state (repeated measures for 3 levels: aW, SWS, and PS) and state classification (between measures for 5 levels: WP, S, P, W, and wsp). There was a significant difference between the number of epochs per state, aW (6.20 ± 1.25, mean ± SEM), SWS (19.03 ± 2.16), and PS (8.53 ± 0.74) (for 64 units, _F_ = 13.24; df = 2, 118; _p_ < 0.000), whereby the number of SWS epochs was significantly greater than the number of aW and PS epochs, but the numbers of aW and PS epochs were not significantly different from each other (_p_ > 0.05, according to pairwise comparisons for within measures). On the other hand, there was no significant interaction between the number of epochs per state and the state classification of units (F = 1.37; df = 8, 118; p > 0.05), indicating that the unit classification was not dependent on the number of aW, SWS, or PS epochs and thus recording time of these principal states across subgroups.
In addition to their average discharge rate (ADR, as spikes per second or hertz), the instantaneous firing frequency (IFF) was calculated using the first modal peak of the interspike interval histogram (ISIH) per state and stage. According to the IFF, each unit was classified first as “fast” (>14.5 Hz) or “slow” (<14.5 Hz), and second, as “tonic regular,” “tonic irregular,” or “phasic” by comparing the ADR to the IFF, or specifically the corresponding interval of the ADR to the ISI distribution. The pattern was considered tonic regular if the ADR interval fell within 82% of the ISI distribution, tonic irregular if outside 82%, and phasic if outside 95% of the ISI distribution. Among tonic irregular and phasic units, their firing was further distinguished according to the IFF as comprised of high-frequency spike bursts, as >80 Hz, or lower frequency spike clusters, as <80 Hz. Rhythmicity of firing and its frequency was examined using autocorrelation histograms (ACHs) and cross-correlation with EEG activity using spike-triggered averages (STAs) (Manns et al., 2000a; Lee et al., 2005b). Gamma (30–58 Hz) amplitude, delta (1–4.5 Hz) amplitude, and theta activity (4.5–8 Hz) were measured per epoch along with EMG amplitude (30–100 Hz) for correlation with unit spike rate. The correlation of the average spike rate with delta or gamma EEG activity and EMG amplitude was examined across the full recording of each unit per 10 s epoch and reported as significant with p ≤ 0.05 if r ≥ 0.31 (for ≥30 epochs). Spike duration was determined from the average of all spikes and was measured from the initial positive deflection to the return to baseline following the secondary negative deflection or “second zero crossing” (where the crossing was measured at 10% of the peak amplitude of the positive wave above and below the initial resting level or “zero” to avoid slight variations in “zero” upon return to resting level). Data analysis was performed using Matlab (5–7, MathWorks) and further statistical analysis using Systat (10–12, Systat Software).
Histochemistry.
For revelation of Nb, sections of 25 μm thickness were incubated in Cy2-conjugated streptavidin (1:1000, Jackson ImmunoResearch Laboratories) for 2.5 h. After location of an Nb-labeled neuron, the relevant section containing the neuron was further incubated for a dual staining for GAD (mouse anti-GAD 67 monoclonal antibody, MAB5406, Millipore) or for ChAT (rabbit anti-ChAT polyclonal antibody, AB143, Millipore) and subsequently coincubated for 2 h in Cy3-conjugated donkey anti-mouse IgG antiserum (1:1000, Jackson) and Cy5-conjugated donkey anti-rabbit IgG antiserum (1:800, Jackson). Immunostaining of Nb-labeled cells was assessed and acquired by epifluorescence using a Nikon Eclipse E800 equipped with a digital camera (Optronics, Microfire S99808). The labeled cells were mapped onto a computer resident atlas with the aid of Neurolucida (version 7, MicroBrightField).
For the purpose of identifying Nb+/ChAT−/GAD− cells as glutamatergic, sections adjacent to Nb-labeled neurons were examined for the presence of Nb-labeled axonal varicosities and immunostaining for VGluT2 or vesicular GABA transporter (VGAT) (Henny and Jones, 2006a,b, 2008). For immunostaining of Nb-labeled varicosities, sections were incubated with primary antibodies against VGluT2 [Rb polyclonal, 1:5000, generous gift from R. H. Edwards and R. T. Fremeau Jr (Fremeau et al., 2001)] or VGAT (Rb polyclonal, 1:500, Millipore) in the presence of 0.1% Triton X-100 (TX) and then with Cy3-conjugated anti-rabbit IgG antiserum (from donkey, Dky) together with Cy2-conjugated streptavidin for Nb.
Of 133 cells submitted to juxtacellular labeling, 76 cells were successfully labeled and recovered in histochemical processing (57%). Of these, 66 cells were unequivocally positively (“+” with bright fluorescence in soma) immunostained or negatively (“−” with no fluorescence in soma) immunostained for GAD or ChAT and located within the cholinergic cell area of the BF to thus be included in the results of the present study. Axons with clear varicosities were located in adjacent sections of 11 Nb+ cells, which included 1 Nb+/ChAT+, 4 Nb+/GAD+, and 6 Nb+/ChAT−/GAD− cells.
Results
Neurotransmitter cell types and sleep–wake subgroups
Of units recorded, submitted to juxtacellular labeling and successfully immunostained, 66 Nb-labeled neurons were located in the cholinergic cell area of the BF and situated within or near the substantia innominata (SI) and magnocellular preoptic area (MCPO) to be thus included in the current results (Table 1). The Nb+ BF cells included 6 neurons, which were immunostained for ChAT (Nb+/ChAT+) as in part previously reported (Lee et al., 2005b), and 25 neurons, which were immunostained for GAD (Nb+/GAD+) (Fig. 1, Table 1). The remaining 35 neurons were unequivocally negatively immunostained for both ChAT and GAD, Nb+/ChAT−/GAD− (Fig. 2, Table 1). For some neurons (n = 11), Nb+ axonal varicosities could be found in adjacent sections within the BF and processed for immunostaining with VGAT or VGluT2. In one Nb+/ChAT+ cell, axonal varicosities were immunonegative for both VGAT and VGluT2 (data not shown). In four Nb+/GAD+ cells, axonal varicosities were established as positive for VGAT (in 13/28 Nb+ varicosities) and negative for VGluT2 (Fig. 1C). In five of six Nb+/ChAT−/GAD− cells, axonal varicosities were established as positive for VGluT2 (in 31/53 Nb+ varicosities) and negative for VGAT (Fig. 2B–D). The latter cells were thus considered to be glutamatergic.
Table 1.
Frequencies of anatomical and physiological characteristics within Nb-labeled ChAT+, GAD +, and ChAT−/GAD− BF cell groups
| All cells | Nb+/ChAT+ | Nb+/GAD+ | Nb+/ChAT−/GAD− | χ2 statistic (df) |
|---|---|---|---|---|
| n | 66 | 6 | 25 | 35 |
| Anatomy (area) | 0.72 (2) | |||
| MCPO | 39 | 4 | 16 | 19 |
| SI | 27 | 2 | 9 | 16 |
| Physiology | ||||
| Firing frequencya | 1.2 (2) | |||
| Slow (<14.5 Hz) | 3 | 0 | 2 | 1 |
| Fast (>14.5 Hz) | 63 | 6 | 23 | 34 |
| Firing patternb | 8.18 (4) | |||
| Tonic regular | 7 | 0 | 2 | 5 |
| Tonic irregular | 26 | 0 | 13 | 13 |
| Phasic | 33 | 6 | 10 | 17 |
| Discharge profilec | 16.4 (8)* | |||
| WP-max | 31 | 6 | 9 | 16 |
| S-max | 13 | 0 | 7 | 6 |
| P-max | 15 | 0 | 9 | 6 |
| W-max | 5 | 0 | 0 | 5 |
| wsp-eq | 2 | 0 | 0 | 2 |
Figure 1.
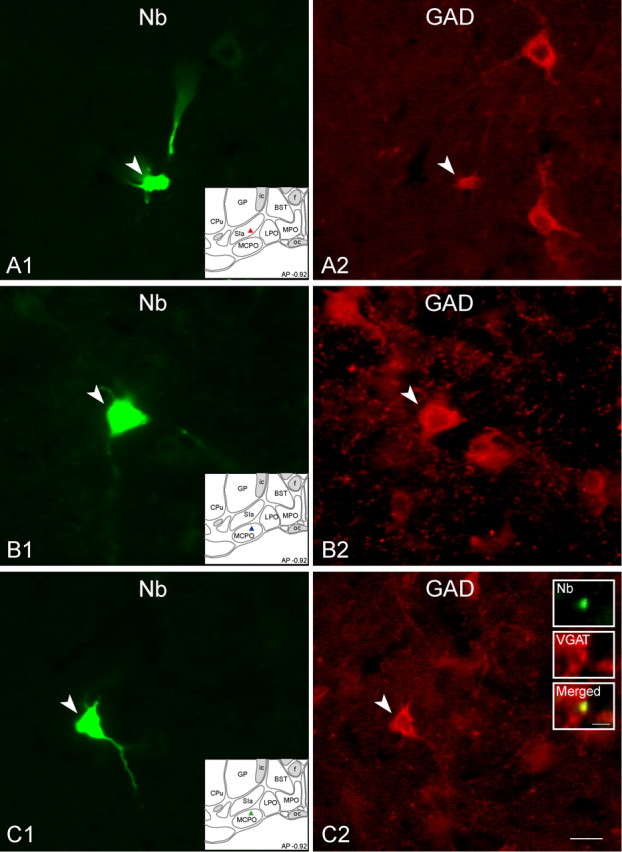
Images of recorded, Nb-labeled GAD+ neurons. Shown are three Nb+ (A1, B1, and C1, green Cy2, filled arrowheads) revealed as immunopositive for GAD (A2, B2, and C2, red Cy3, filled arrowheads) and located within the BF cholinergic cell area (atlas in insets). A, Nb+/GAD+ unit (c78u10) located in the SI, which discharged maximally during aW and PS, as “WP-max” (shown in Fig. 4). B, Nb+/GAD+ unit (c120u04) located in the MCPO that discharged maximally during SWS, as “S-max” (shown in Fig. 5). C, Nb+/GAD+ unit (c78u11) located in the MCPO, which discharged maximally during PS, as “P-max” (shown in Fig. 6). Shown in the inset to C2, an Nb-labeled axon varicosity found in an adjacent section was also revealed to be immunopositive for VGAT. Scale bar in C2 for all large panels, 20 μm. Scale bar within insets in C2, 2 μm.
Figure 2.

Images of recorded, Nb-labeled ChAT−/GAD− neurons. A, Nb-labeled unit (c106u05) (A1, green Cy2, filled arrowhead) revealed as immunonegative for ChAT (A2, red Cy3, open arrowhead) and GAD (A3, blue Cy5, open arrowhead), was located in the MCPO (atlas in inset) and discharged maximally during aW, as “W-max” (shown in Fig. 7). B–D, Nb-labeled cell with VGAT-/VGluT2+ terminals (c84u01, B1, green Cy2, filled arrowhead) which was immunonegative for ChAT (B2, red Cy3, open arrowhead) and GAD (B3, blue Cy5, open arrowhead), was located in the MCPO (atlas in inset) and discharged maximally during aW, as “W-max” (data not shown). C, From an adjacent section, Nb-labeled varicosities (C1 and C1′ at slightly different focal planes, green Cy2, arrowheads) along a fiber from the same cell were immunopositive for VGluT2 (C2 and C2′, red Cy3, and C3 and C3′, yellow merged). D, From another adjacent section, another Nb-labeled varicosity (D1, green Cy2, arrowhead) from the same cell was immunonegative for VGAT (D2, red Cy3 and D3, yellow merged). Scale bars in A3 and B3 for A and B, 20 μm. Scale bar in D3 for C and D, 5 μm.
Whereas Nb+/ChAT+ neurons were homogeneous in their firing characteristics and discharge profiles across sleep– wake states, the Nb+/GAD+ and Nb+/ChAT−/GAD− were heterogeneous (Table 1). Whereas the ChAT+ cells all had fast instantaneous firing frequencies and manifested a phasic discharge pattern, the GAD+ cells and ChAT−/GAD− cells included units with slow firing frequencies and with tonic regular, tonic irregular, and phasic patterns of discharge (Table 1). Whereas all ChAT+ cells showed the same discharge profile across sleep–wake states as WP-max cells (Lee et al., 2005b), Nb+/GAD+ cells and Nb+/ChAT−/GAD− cells showed different discharge profiles to belong to multiple sleep–wake subgroups (Table 1). Accordingly, “WP-max” cells, which discharge at higher rates during W and PS than SWS and represented the largest sleep–wake subgroup of the Nb+ cells (47%), were comprised of ∼19% ChAT+ cells, 29% GAD+ cells, and ∼52% ChAT−/GAD− cells. “S-max” cells, which discharge at higher rates during SWS than during PS or W and represented a smaller proportion of the Nb+ cells (∼20%), were comprised of 54% GAD+ cells and 46% ChAT−/GAD− cells. “P-max” cells, which discharge at higher rates during PS than SWS and W and also represented a smaller proportion of the Nb+ cells (∼23%), were comprised of ∼60% GAD+ cells and ∼40% ChAT−/GAD− cells. “W-max” cells, which discharge at higher rates during aW than during SWS or PS and represented only a small proportion of the Nb+ BF cells (8%), included 0 GAD+ cells and 100% ChAT−/GAD− cells. Finally, “wsp-eq” cells, which did not show significant variation of average discharge rate across sleep–wake states and represented a very small proportion of the Nb+ cells (3%), were comprised entirely by ChAT−/GAD− cells. Given the similarity of the proportions of sleep–wake subgroups within the Nb+ cell sample compared with those of all recorded, including unlabeled neurons, which were originally randomly sampled in the BF (Lee et al., 2004), the Nb+ cell sample appeared to be fairly representative of the BF cell population, except perhaps for the wsp-eq subgroup, which was somewhat smaller. The proportions of all Nb-labeled ChAT+ (9%), GAD+ (38%), and ChAT−/GAD− cells (53%) were also fairly representative of the proportions comprised of these neurotransmitter cell types in the BF (Gritti et al., 2006). The sleep–wake subgroup frequencies of the ChAT+, GAD+, and ChAT−/GAD− cell types differed significantly among the Nb-labeled cells, indicating different functional subgroups of these cell types (Table 1).
The Nb+/ChAT+, Nb+/GAD+, and Nb+/ChAT−/GAD− cells were codistributed through the BF and within the SI and MCPO (or immediately adjacent lateral preoptic area, LPO) (Fig. 3). Moreover, members of most sleep–wake subgroups, except W-max, were found in both the SI and MCPO (Fig. 3). Among the cells established as glutamatergic by staining of their varicosities for VGluT2, members of WP (n = 2), S (n = 1), W (n = 1), and wsp (n = 1) subgroups were included and located in both the SI (n = 2) and MCPO (n = 3).
Figure 3.
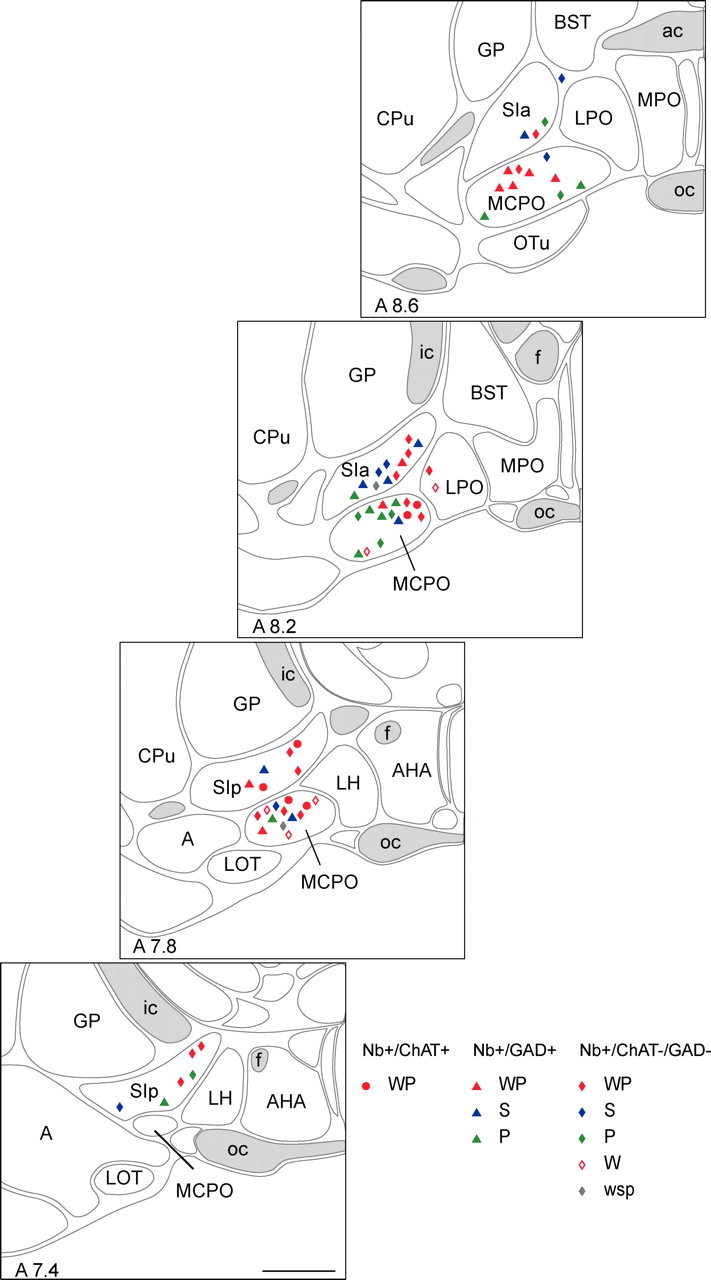
Mapping of Nb+ cell types distinguished by sleep–wake subgroup. Nb+/ChAT+ cells (circles), Nb+/GAD+ cells (triangles), and Nb+/ChAT−/GAD− (diamonds) cells (n = 66) were plotted on computer-based atlas sections through the BF [A ∼7.4, 7.8, 8.2, and 8.6 mm from interaural zero (Gritti et al., 2006)]. They were further distinguished according to the sleep–wake state(s) during which they discharged maximally: aW and PS as “WP-max” (WP, filled red), SWS as “S-max” (S, blue), PS as “P-max” (P, green), aW as “W-max” (W, open red), or equivalently as “wsp-eq” (wsp, gray) (see Table 1). A, Amygdaloid area; ac, anterior commissure; AHA, anterior hypothalamic area; BST, bed nucleus of the stria terminalis; CPu, caudate putamen; f, fornix; GP, globus pallidus; ic, internal capsule; LH, lateral hypothalamus; LOT, lateral olfactory tract nucleus; LPO, lateral preoptic area; MCPO, magnocellular preoptic nucleus; MPO, medial preoptic nucleus; oc, optic chiasm; OTu, olfactory tubercle; SIa, substantia innominata pars anterior; SIp, substantia innominata pars posterior. Scale bar, 1 mm.
The three cell types did not differ significantly according to their average spike duration, instantaneous firing frequency, or average discharge rate (Table 2). This lack of difference was due to the large variation among cells of each type and resulting overlap of their distributions for each of these characteristics, such that any individual cell could not be identified as cholinergic, GABAergic, or noncholinergic/non-GABAergic based on its electrophysiological properties (see supplemental Fig. 1, available at www.jneurosci.org as supplemental material). Among cell types of each sleep–wake subgroup, the ChAT+, GAD+, and ChAT−/GAD− cell types differed in instantaneous firing frequency in the WP subgroup, due to the high-frequency burst firing of the cholinergic cells (Table 2). On the other hand, neither for this or any other subgroup, nor for any other property, did the GAD+ cells differ significantly from the ChAT−/GAD− cells. The discharge properties will be presented in detail for the major GAD+ cell subgroups (Figs. 4–6) and compared with the ChAT+ and ChAT−/GAD− cells of the same subgroups or additional subgroup (Figs. 7, 8, Tables 1–3).
Table 2.
Discharge properties of Nb-labeled ChAT+, GAD +, and ChAT−/GAD− BF neurons
| Cell type and subgroup | n | Spike duration (ms) | Instantaneous firing frequency (Hz) | Average discharge rate (Hz) |
|---|---|---|---|---|
| ChAT+a | ||||
| WP-max | 6 | 1.59 ± 0.20 | 113.59 ± 15.45bc | 14.44 ± 2.00 |
| Average | 6 | 1.59 ± 0.20 | 113.59 ± 15.45 | 14.44 ± 2.00 |
| GAD+b | ||||
| WP-max | 9 | 1.54 ± 0.10 | 63.07 ± 9.54a | 27.78 ± 5.70 |
| S-max | 7 | 1.41 ± 0.13 | 93.26 ± 24.73 | 6.72 ± 1.72 |
| P-max | 9 | 1.41 ± 0.10 | 103.34 ± 14.70 | 32.36 ± 5.71 |
| Average | 25 | 1.46 ± 0.06 | 84.38 ± 9.39 | 23.54 ± 3.43 |
| ChAT−/GAD−c | ||||
| WP-max | 16 | 1.66 ± 0.14 | 70.98 ± 9.75a | 14.59 ± 4.38 |
| S-max | 6 | 1.62 ± 0.15 | 123.80 ± 18.18 | 13.82 ± 9.11 |
| P-max | 6 | 1.42 ± 0.15 | 59.62 ± 8.73 | 20.76 ± 5.24 |
| W-max | 5 | 1.54 ± 0.15 | 49.96 ± 7.23 | 19.69 ± 4.36 |
| wsp-eq | 2 | 0.94 ± 0.21 | 94.01 ± 17.09 | 17.60 ± 16.54 |
| Average | 35 | 1.55 ± 0.08 | 76.40 ± 6.88 | 16.42 ± 2.77 |
| ANOVA (type) | ||||
| (WP) | F = 2.21; df = 2, 28; p = 0.129 | F = 3.97; df = 2, 28; p = 0.030 | F = 0.16; df = 2, 28; p = 0.850 | |
| (S) | t = −0.83; df = 11; p = 1.000 | t = −0.96; df = 11; p = 1.000 | t = −1.03; df = 11; p = 0.970 | |
| (P) | t = 1.41; df = 13; p = 0.547 | t = 2.24; df = 13; p = 0.130 | t = −0.06; df = 13; p = 1.000 | |
| (Average) | F = 0.51; df = 2, 63; p = 0.602 | F = 1.78; df = 2, 63; p = 0.178 | F = 1.50; df = 2, 63; p = 0.232 |
Figure 4.

Discharge of Nb+/GAD+, WP-max active unit across sleep–wake states. Data from Nb-labeled cell (c78u10) shown in Figure 1A to be GAD+ and located in the SI. A, Sleep–wake recording scored (per 10 s epoch) for sleep–wake stages is shown with simultaneous EEG amplitude (μV/Hz with frequency on y_-axis and amplitude differentially scaled according to color from blue to red, over the low frequency, 0–30 Hz from ∼0 to 100 μV, and the high frequency, ∼30–60 Hz from 0 to 25 μV), EMG amplitude (arbitrary units) and unit spike rate (Hz) over the recording session. Note that the unit discharged during epochs of tPS, PS, and aW, when the EEG was marked by theta activity (4.5–8 Hz) along with gamma (30–58 Hz) and was relatively quiescent during epochs of tSWS and particularly SWS marked by delta EEG activity (1–4.5 Hz). Across stages, its discharge rate was significantly, positively correlated with the amplitude of gamma EEG activity (r = 0.81). Horizontal lines (marked as 1, 2, and 3) indicate 10 s recording epochs of aW, SWS, and PS, respectively, shown in C. B, Bar graph showing mean spike rate (Hz) of the unit across sleep–wake stages. The unit discharged at moderate rates during aW (17.8 Hz), progressively lower rates in qW and the tSWS to reach minimal rates during SWS (3.23 Hz); it increased its discharge during tPS to reach maximal rates during PS (47.76 Hz). C, Polygraphic records from 10 s epochs (indicated in A) of the unit together with EEG and EMG activity during aW (1), SWS (2), and PS (3). Note that during aW, the unit fired in an irregular manner with phasic modulation (C1). It discharged minimally during SWS (C2). It fired tonically at its highest rates during PS though in an irregular manner with some phasic modulation (C3). During this state, the instantaneous firing frequency was very high (90.91 Hz) in a range of bursts. However, its firing did not show rhythmicity (by ACH) or cross-correlation with theta or other EEG activity (by STA) (see supplemental Fig. 2_A, available at www.jneurosci.org as supplemental material). Calibrations: horizontal, 1 s; vertical, 1 mV (EEG, EMG), 2 mV (unit). OB, Olfactory bulb; PF, prefrontal cortex; RS, retrosplenial cortex.
Figure 5.

Discharge of Nb+/GAD+, S-max active unit across sleep–wake states. Data from Nb-labeled cell (c120u04) shown in Figure 1B to be GAD+ and located in the MCPO. A, Sleep–wake recording scored (per 10 s epoch) for sleep–wake stages is shown with simultaneous EEG amplitude (μV/Hz with frequency on y_-axis and amplitude scaled according to color as in Fig. 4), EMG amplitude (arbitrary units), and unit spike rate (Hz) over the recording session. Note that the unit discharged during epochs of tSWS and SWS, when the EEG was marked by delta activity (1–4.5 Hz), and was virtually silent during epochs of aW and PS, when the EEG was marked by theta (4.5–8 Hz). Across sleep–wake stages, the unit's discharge rate was significantly, positively correlated with delta EEG amplitude (r = 0.60). Horizontal lines (marked as 1, 2, or 3) indicate 10 s epochs of aW, SWS, or PS, respectively, shown in C. B, Bar graph showing mean spike rate (Hz) of the unit across sleep–wake stages. The unit discharged at minimal rates during aW (0.1 Hz), increased slightly during qW, then increased substantially with tSWS to reach the highest rates during SWS (4.74 Hz), decrease slightly during tPS and decrease substantially during PS (0.4 Hz). C, Polygraphic records from 10 s epochs (indicated in A) of the unit spiking together with EEG and EMG activity during aW (1), SWS (2), and PS (3). Note that the unit was virtually silent during aW and PS (C1 and C3). It discharged during SWS (C2) in a tonic irregular manner with an instantaneous firing frequency (10.53 Hz) indicative of groups of spikes. However, this pattern of firing did not show any rhythmicity (by ACH) or cross-correlation (by STA) with delta or other EEG activity during SWS (see supplemental Fig. 2_B, available at www.jneurosci.org as supplemental material). Calibrations: horizontal, 1 s; vertical, 1 mV (EEG, EMG), 2 mV (unit). OB, Olfactory bulb; PF, prefrontal cortex; RS, retrosplenial cortex.
Figure 6.

Discharge of Nb+/GAD+, P-max active unit across sleep–wake states. Data from Nb-labeled cell (c78u11) shown in Figure 1C to be GAD+, to contain VGAT in its terminals and to be located in the MCPO. A, Sleep–wake recording scored (per 10 s epoch) for sleep–wake stages is shown with simultaneous EEG amplitude (μV/Hz with frequency on y_-axis and amplitude scaled according to color as in Fig. 4), EMG amplitude (arbitrary units), and unit spike rate (Hz) over the recording session. Note that across sleep–wake stages, the unit discharged maximally during epochs of tPS and PS when the EEG was marked by theta (4.5–8 Hz) and EMG amplitude was relatively low. The unit discharge rate was significantly, negatively correlated with EMG amplitude (r = −0.53). Horizontal lines (marked as 1, 2, or 3) indicate 10 s epochs of aW, SWS, or PS, respectively, shown in C. B, Bar graph showing mean spike rate (Hz) of the unit in sleep–wake stages. The unit discharged during all stages at the lowest during aW (10.7 Hz), slightly higher during qW, tSWS, and SWS (14.85 Hz), increasing rates during tPS to discharge at a substantially higher and maximal rate during PS (48.05 Hz). C, Polygraphic records from 10 s epochs (indicated in A) of the unit discharge together with EEG and EMG activity during aW (1), SWS (2), and PS (3). Note that the unit discharged across states in a tonic irregular manner, most irregular in aW (C1) and more tonically at a higher rate in SWS (C2), reaching maximal rates during PS (C3). In this state, its instantaneous firing frequency is very high (142.86 Hz) in a range of bursts. There was, however, no evidence of rhythmicity (by ACH) of the bursting or cross-correlation (by STA) with theta or any other EEG activity (see supplemental Fig. 2_C, available at www.jneurosci.org as supplemental material). Calibrations: horizontal, 1 s; vertical, 1 mV (EEG, EMG), 2 mV (unit). OB, Olfactory bulb; PF, prefrontal cortex; RS, retrosplenial cortex.
Figure 7.

Discharge of Nb+/ChAT−/GAD−, W-max active unit across sleep–wake states. Data from Nb-labeled cell (c106u05) shown in Figure 2A to be ChAT−/GAD− and located in the MCPO. A, Sleep–wake recording scored (per 10 s epoch) for sleep–wake stages is shown with simultaneous EEG amplitude (μV/Hz with frequency on y_-axis and amplitude scaled according to color as in Fig. 4), EMG amplitude (arbitrary units), and unit spike rate (Hz) over the recording session. Note that the unit discharged maximally during epochs of aW, when the EMG amplitude was high. It decreased firing with the passage through qW, tSWS, SWS into PS, when it reached minimal levels. Across stages, its discharge rate was significantly, positively correlated with the EMG amplitude (r = 0.49). Horizontal lines (marked as 1, 2, and 3) indicate 10 s recording epochs of aW, SWS, and PS, respectively, shown in C. B, Bar graph showing mean spike rate (Hz) of the unit across sleep–wake stages. The unit discharged at its highest rate during aW (22.95 Hz), decreased firing progressively during qW through tSWS, SWS, and into tPS to reach its minimal rate during PS (1.24 Hz). C, Polygraphic records from 10 s epochs (indicated in A) of the unit together with EEG and EMG activity during aW (1), SWS (2), and PS (3). Note that during aW, the unit fired at its highest rates in a tonic but irregular manner (C1). It greatly diminished firing during SWS (C2) and was virtually silent during PS (C3). During aW, the instantaneous firing frequency was moderately high (47.6 Hz) reflecting a phasic modulation of its discharge. However, its firing did not show rhythmicity (by ACH) or cross-correlation with theta or other EEG activity (by STA) (see supplemental Fig. 2_D, available at www.jneurosci.org as supplemental material). Calibrations: horizontal, 1 s; vertical, 1 mV (EEG, EMG), 2 mV (unit). OB, Olfactory bulb; PF, prefrontal cortex; RS, retrosplenial cortex.
Figure 8.

Average discharge rates across sleep–wake stages of different cell types and subgroups in relation to EEG and EMG activity. A, WP-max cells discharged maximally during aW and PS when EEG gamma amplitude was maximal (as shown on right for cell c74u03) across sleep–wake stages. They included cholinergic (Nb+/ChAT+ cell c30u13 from (Lee et al., 2005b)), GABAergic (Nb+/GAD+ cell c78u10 from Fig. 4) and putative glutamatergic (Nb+/ChAT−/GAD− cell c74u03) BF neurons, whose discharge rate was positively correlated with gamma activity (r = 0.76, 0.81, and 0.84, respectively) and could thus promote cortical activation during W and PS. B, S-max cells discharged maximally during SWS when EEG delta amplitude was maximal (as shown on right for cell c104u01) across sleep–wake stages. They included GABAergic (Nb+/GAD+ cell c120u04 from Fig. 5) and putative glutamatergic (Nb+/ChAT−/GAD− cell c104u01) BF neurons, whose discharge rate was positively correlated with delta activity (r = 0.60 and 0.74, respectively) and could thus promote delta activity and/or reciprocally dampen gamma activity during SWS. C, P-max cells discharged maximally during PS when EMG amplitude was minimal (as shown on right for c70u12) across sleep–wake stages. They included GABAergic (Nb+/GAD+ cell c78u11 from Fig. 6) and putative glutamatergic (Nb+/ChAT−/GAD− cell c70u12) BF neurons, whose discharge rate was negatively correlated with EMG amplitude (r = −0.53 and −0.57, respectively) and could thus promote muscle atonia along with behavioral quiescence during sleep. D, W-max cells discharged maximally during aW when EMG amplitude was maximal (as shown on right for c106u05) across sleep–wake stages. They included only putative glutamatergic (Nb+/ChAT−/GAD− cell, c106u05 from Fig. 7) BF neurons, whose discharge rate was positively correlated with EMG amplitude (r = 0.49) and could thus promote muscle tone along with behavioral arousal during waking. Bar charts of unit average discharge rates present data from representative cells of each subgroup (see Table 3), and those of EEG and EMG amplitudes (right) present corresponding data from the Nb+/ChAT−/GAD− cells.
Table 3.
Average discharge rates for Nb-labeled ChAT+, GAD+, and ChAT−/GAD− BF cell types and subgroups across sleep–wake states
| Cell type and subgroup | n | aW | SWS | PS |
|---|---|---|---|---|
| ChAT+ | ||||
| WP-max | 6 | 6.55 ± 1.69 | 0.71 ± 0.37 | 14.44 ± 2.00 |
| GAD+ | ||||
| WP-max | 9 | 21.50 ± 5.21 | 16.73 ± 5.30 | 27.12 ± 6.01 |
| S-max | 7 | 2.27 ± 0.82 | 6.56 ± 1.62 | 2.53 ± 1.80 |
| P-max | 9 | 11.93 ± 2.58 | 14.72 ± 2.97 | 32.36 ± 5.71 |
| ChAT−/GAD− | ||||
| WP-max | 16 | 11.52 ± 4.44 | 6.22 ± 2.69 | 13.99 ± 4.41 |
| S-max | 6 | 9.59 ± 7.82 | 13.82 ± 9.11 | 9.01 ± 6.93 |
| P-max | 6 | 11.21 ± 4.95 | 11.23 ± 4.64 | 20.76 ± 5.24 |
| W-maxa | 4 | 23.34 ± 3.08 | 15.73 ± 4.98 | 9.06 ± 4.46 |
WP-max active cells
The “WP-max” subgroup was the only one to include all three types of cells and to represent a substantial proportion of each. As previously reported (Lee et al., 2005b), all Nb+/ChAT+ neurons (n = 6) discharged at significantly higher rates during W and PS than during SWS and at their highest rate during PS (as shown for the cell c30u13 in Fig. 8). They were all fast-spiking neurons firing in clusters (<80 Hz, _n_ = 2) or high-frequency bursts (>80 Hz, n = 4) of spikes and in a phasic pattern with a high mean instantaneous firing frequency (113.59 ± 15.45 Hz) that was much higher than their average discharge rate during PS (14.44 ± 2.00 Hz; Table 2). Their phasic firing was rhythmic (in ACHs) and cross-correlated with EEG theta activity (in STAs) during PS [in 4 cells (Lee et al., 2005b)]. Their average discharge rate was strongly modulated across sleep–wake states, as they virtually ceased firing during SWS, such that the mean rate during SWS was ∼5% of that during PS (Table 3). Their rate changed in the transitional stages, decreasing in qW relative to aW, reducing to minimal levels in both tSWS and SWS, then increasing slightly in tPS to reach the highest rates during PS (Fig. 8). It was significantly positively correlated with gamma EEG amplitude across sleep–wake stages in 6/6 cells (r = 0.68 ± 0.03, n = 6), as typical of the WP sleep–wake subgroup of cells (Fig. 8).
WP-max cells represented 36% of Nb+/GAD+ cells (n = 9). They were predominantly fast-spiking neurons (n = 8) that discharged at their highest rates during W or PS, as shown for the cell in Figure 4 (c78u10, also illustrated in Fig. 1A and supplemental Fig. 2_A_, available at www.jneurosci.org as supplemental material, and for cell c62u07 in supplemental Fig. 3_A_, available at www.jneurosci.org as supplemental material). Their firing pattern was predominantly tonic irregular (n = 5) or phasic (n = 3) (except for one tonic regular cell) and comprised of clusters (<80 Hz, n_ = 6) or high-frequency bursts (>80 Hz, n = 2) of spikes. The average instantaneous firing frequency (63.07 ± 9.54 Hz) was higher than the average discharge rate (27.78 ± 5.70) during W or PS (Table 2), reflecting their irregular or phasic firing patterns (see supplemental Fig. 2_A, available at www.jneurosci.org as supplemental material). None of the GAD+ WP-max cells showed theta rhythmicity (in ACHs) or cross-correlation with EEG theta (or other) activity (in STAs) during W or PS (see supplemental Fig. 2_A_, available at www.jneurosci.org as supplemental material). As for the cell shown in Figure 4 (and supplemental Fig. 3_A_, available at www.jneurosci.org as supplemental material), some of the WP-max GAD+ cells (n = 3) (Fig. 4) showed, like the ChAT+ cells, very strong modulation of their discharge rate across sleep–wake stages and virtually ceased firing during SWS. However, most (n = 6) merely reduced their discharge rate, such that the mean rate during SWS was ∼60% of that during PS (Table 3). Nonetheless, the discharge rate commonly decreased progressively from aW through qW into tSWS and SWS and increased progressively during tPS proceeding into PS in this GAD+ WP subgroup (Fig. 4). As typical of WP-max cells (Fig. 8), the average discharge rate of the GAD+ WP cells was significantly, positively correlated with gamma EEG amplitude across sleep–wake stages in 6/9 neurons (r = 0.59 ± 0.05; n = 6).
WP-max cells represented 46% of the Nb+/GAD−/ChAT− cells (n = 16). Like GAD+ WP cells, they were predominantly fast-spiking cells (n = 15) that reached their maximal discharge rates during W or PS (as shown for the cell c74u03 in Fig. 8). They included cells with tonic regular (n = 2), tonic irregular (n = 5), and phasic (n = 9) patterns of firing. The latter groups discharged in clusters (<80 Hz, _n_ = 7) or bursts (>80 Hz, n = 6) of spikes. Their average instantaneous firing frequency (70.98 ± 9.75 Hz) was much higher than their average discharge rate (14.59 ± 4.38 Hz) (Table 2), reflecting their phasic or irregular firing during their maximal discharge in W or PS. The vast majority (n = 14) showed no rhythmicity in their firing (in the ACHs) or relationship to EEG (in the STAs). Only two cells showed some cross-correlated discharge in association with theta EEG activity (6–7 Hz in STAs) during PS (data not shown). Although many cells (n = 9) showed a substantial reduction in their discharge rate during SWS, like the ChAT+ and some GAD+ WP cells (above), others showed a lesser reduction, such that the mean average discharge rate during SWS was ∼45% of that during PS (Table 3). Their discharge rate showed progressive slowing proceeding from aW through qW into tSWS and SWS and acceleration during tPS proceeding into PS (Fig. 8). As typical for cells of the WP subgroup (Fig. 8), their discharge rate was significantly, positively correlated with gamma EEG amplitude across sleep–wake stages in 14/16 cells (r = 0.59 ± 0.04; n = 14).
S-max active cells
S-max neurons represented 28% of the Nb+/GAD+ neurons (n = 7). They discharged at higher rates during SWS than during PS and aW, as shown for the cell in Figure 5 (c120u04, also illustrated in Fig. 1B and supplemental Fig. 2_B_, available at www.jneurosci.org as supplemental material, and for cell c119u04 in supplemental Fig. 3_B_, available at www.jneurosci.org as supplemental material). They were predominantly (except for one cell) fast spiking (n = 6) and discharged in a tonic irregular (n = 2) or phasic manner (n = 5) in clusters (<80 Hz, n_ = 3) or bursts (>80 Hz, n = 4) of spikes during SWS. Their mean instantaneous firing frequency was quite high (93.26 ± 24.73 Hz) and an order of magnitude higher than the mean average discharge rate during SWS (6.72 ± 1.72 Hz) (Table 2), reflecting their irregular or phasic discharge pattern. However, their firing did not manifest rhythmicity (in the ACHs) nor manifest cross-correlated activity with slow waves (in STAs) during SWS (see supplemental Fig. 2_B, available at www.jneurosci.org as supplemental material), except minimally (in the STA) in one cell (data not shown). Across the sleep–wake cycle, many GAD+ S-max neurons (n = 5) (Fig. 5 and supplemental Fig. 3_B_, available at www.jneurosci.org as supplemental material) showed a minimal rate of discharge during aW and PS, when they were virtually silent; however, others showed a more moderate rate, such that across all cells, the mean rate during aW was ∼35% of that during SWS (Table 3). Their rate of discharge increased slightly from aW to qW, but increased markedly in tSWS to be relatively high during tSWS, SWS, and tPS and then decrease markedly with PS (Fig. 5). As is typical of S-max neurons (Fig. 8), the average discharge rate was significantly, positively correlated with delta EEG amplitude across sleep–wake stages in 6/7 GAD+ neurons (r = 0.56 ± 0.08; n = 6).
The S-max neurons represented 17% of Nb+/GAD−/ChAT− neurons (n = 6). Similar to GAD+ S neurons, they were generally fast-spiking neurons (n = 6) that discharged at a higher rate during SWS than during PS or W (as shown for the cell c104u01 in Fig. 8). Except for one cell (tonic regular), they manifested a phasic pattern of spiking (n = 5) at a bursting frequency (>80 Hz, n = 5). Similar to GAD+ neurons, their average instantaneous firing frequency was quite high (123.80 ± 18.18 Hz) and much higher than the average discharge rate (13.82 ± 9.11 Hz) during SWS (Table 2). The phasic discharge during SWS was neither rhythmic (by ACH) nor cross-correlated with slow-wave EEG activity, except in one cell of this subgroup (data not shown). Although many cells (n = 4) showed a much lower discharge rate during aW or PS, being virtually silent, than that during SWS, like some GAD+ S-max cells (above), other cells showed higher rates such that the mean discharge rate during aW was ∼70% of that during SWS (Table 3). The rate increased progressively from aW through qW and tSWS into SWS and decreased progressively in tPS proceeding into PS (Fig. 8). As typical of S-max neurons (Fig. 8), the average discharge rate was significantly positively correlated with delta EEG amplitude across sleep–wake stages in 4/6 neurons (r = 0.59 ± 0.08; n = 4).
P-max active cells
P-max cells represented 36% of Nb+/GAD+ cells (n = 9). They were all fast-spiking cells that discharged at their highest rates during PS, as shown for the cell in Figure 6 (c78u11, also illustrated in Fig. 1C and supplemental Fig. 2_C_, available at www.jneurosci.org as supplemental material, and for cell c100u07 in supplemental Fig. 3_C_, available at www.jneurosci.org as supplemental material). Except for one cell (tonic regular), they fired predominantly in a tonic irregular (n = 6) or phasic mode (n = 2) in clusters (n = 2) or bursts (n = 6) of spikes. They had a high average instantaneous firing frequency (103.34 ± 14.70 Hz) that was much higher than their average discharge rate (32.36 ± 5.71 Hz) during PS (Table 2), reflecting their irregular firing (see supplemental Fig. 2_C_, available at www.jneurosci.org as supplemental material). They did not manifest rhythmicity in their discharge (in ACHs) or relationship to theta EEG activity (in STAs) during PS (see supplemental Fig. 2_C_, available at www.jneurosci.org as supplemental material), except (in the STAs) in two cells (at 6–7 Hz, data not shown). They all discharged during aW, increased their discharge somewhat during qW to discharge often at a slightly higher rate during tSWS and SWS and increase further during tPS to reach maximal rates during PS, whereby the mean average rate during aW was ∼35% of that during PS (Table 3, Fig. 6). As typical of P-max cells (Fig. 8), their discharge rate was significantly negatively correlated with EMG amplitude across sleep–wake stages in 7/9 cells (r = −0.53 ± 0.05; n = 7).
The P-max cells comprised 17% of the Nb+/ChAT−/GAD− neurons (n = 6). They were all fast-spiking neurons, which discharged at their highest rate during PS (as shown for the cell c70u12 in Fig. 8). Except for one cell (tonic regular), they fired predominantly in a tonic irregular (n = 3) or phasic pattern (n = 2) in clusters (n = 4) or bursts (n = 2) of spikes. Their mean instantaneous firing frequency was relatively fast (59.62 ± 8.73) and faster than their average discharge rate (20.76 ± 5.24). None of these cells showed rhythmicity in their firing or cross-correlated firing with theta EEG activity. They increased their discharge rate from aW to PS and particularly in tPS and PS to differing degrees, whereby the mean average rate during aW was ∼55% of that during PS (Table 3, Fig. 8). As typical of P-max cells (Fig. 8), their discharge rate was significantly negatively correlated with EMG amplitude (in rats having good EMG recordings: r = −0.53 ± 0.04; n = 2).
W-max active cells
The W-max cells were all ChAT−/GAD− neurons (n = 5) and comprised ∼14% of the negatively stained cells. As for the cell shown in Figure 7 (c106u05, also illustrated in Fig. 2A and supplemental Fig. 2_D_, available at www.jneurosci.org as supplemental material), they were all fast spiking. Except for one cell, they were predominantly tonic irregular (n = 4) in their firing pattern and fired in clusters (n = 3) or bursts (n = 1) of spikes. The average instantaneous firing frequency of ChAT−/GAD− neurons was moderately high (49.96 ± 7.23 Hz) and higher than their average discharge rate (19.69 ± 4.36 Hz) during aW (Table 2) (see supplemental Fig. 2_D_, available at www.jneurosci.org as supplemental material). None of the cells showed rhythmicity in their discharge (by ACH) or cross-correlated activity with theta EEG on the cortex (by STA) during aW (see supplemental Fig. 2_D_, available at www.jneurosci.org as supplemental material). Their discharge rate decreased progressively to differing degrees from aW through qW, tSWS, SWS, and tPS to reach its lowest during PS (Fig. 7), such that the mean rate during PS represented ∼40% of that during aW (Table 3). As typical of the W-max cell group (Fig. 8), their discharge rate was significantly, positively correlated with EMG amplitude (r = 0.49 ± 0.08; n = 4).
Comparison across sleep–wake subgroups
Despite variable firing properties, ChAT+, GAD+, and ChAT−/GAD− cells had similar discharge profiles such as to be classified collectively in the WP-max subgroup (Table 3, Fig. 8). Other GAD+ and ChAT−/GAD− cells had similar profiles such as to be grouped together in the S-max and P-max subgroups (Table 3, Fig. 8). On the other hand, only ChAT−/GAD− cells had a discharge profile to be classified in the W-max subgroup (Table 3, Fig. 8). Given the large variability within each cell type, ChAT+, GAD+ and ChAT−/GAD− cells could not actually be distinguished according to their firing properties, including spike duration, instantaneous firing frequency or average discharge rate (see supplemental Fig. 1, available at www.jneurosci.org as supplemental material). Only within the WP subgroup, did the ChAT+ cells differ significantly from the GAD+ and ChAT−/GAD− cell types according to mean instantaneous firing frequency (Table 2). Even so, individual units within or across sleep–wake subgroups could not be distinguished as cholinergic, GABAergic, or putative glutamatergic by their electrophysiological characteristics. They accordingly partially shared discharge properties and profiles.
Across different sleep–wake subgroups, the discharge profiles of different cell types were reciprocal (Fig. 8). The ChAT+, GAD+, and ChAT−/GAD− WP-max cells showed a reciprocal profile of discharge to GAD+ and ChAT−/GAD− S-max cells, and the discharge rates of these subgroups were inversely correlated with gamma and delta activity across sleep–wake stages. Similarly, the GAD+ and ChAT−/GAD− P-max cells showed a reciprocal profile of discharge to the ChAT−/GAD− W-max cells, and the discharge rates of these subgroups were inversely correlated with EMG amplitude across sleep–wake stages.
Discussion
By recording and labeling neurons using the juxtacellular technique in head-fixed rats, we characterized for the first time the discharge profiles of identified GABAergic BF neurons across natural sleep–wake states. These cells comprise WP-max active cells, which like cholinergic BF cells, discharged in positive association with gamma EEG activity, but also S-max active cells, which inversely discharged in positive association with delta EEG activity and P-max active neurons, which discharged in negative association with EMG amplitude. Putative and identified glutamatergic neurons included WP-max, S-max, P-max, and W-max active cells, which discharged in positive association with EMG amplitude. The discharge profiles of the different cell subgroups were thus reciprocally related to EEG gamma or delta activity or to EMG amplitude across sleep–wake states, revealing potentially similar and complementary roles of intermingled cells containing different neurotransmitters and likely projecting to different targets, such as to collectively regulate cortical and behavioral changes across W, SWS, and PS.
The Nb-labeled, ChAT+, GAD+, and ChAT−/GAD− neurons were intermingled through the MCPO and SI in a manner and proportions (9%, 38%, and 53%, respectively) similar to the distribution of these cell types in the BF (5%, 35%, and 60%, respectively) (Gritti et al., 2006). In 85% of Nb-labeled ChAT−/GAD− cells, for which varicosities could be located in adjacent sections, their terminals were established as positively immunostained for VGluT2 and thus proven to use glutamate as a neurotransmitter (Fremeau et al., 2001; Henny and Jones, 2006b, 2008). We thus consider likely that the vast majority of noncholinergic/non-GABAergic cells described here were glutamatergic neurons.
The cholinergic, GABAergic, and putative glutamatergic cells belonged to different sleep–wake subgroups. Neurons of the WP-max and S-max subgroups, whose discharge was correlated with EEG activity, were intermingled in the BF with neurons of the P-max and W-max subgroups, whose discharge was correlated with EMG activity. Their codistribution is comparable to that of neurons having ascending projections to the cortex with those having descending projections to the hindbrain (Semba et al., 1989; Gritti et al., 1994, 1997). It is likely that cells whose discharge is most highly correlated with EEG activity give rise predominantly to ascending projections, as is the case for the cholinergic neurons. Indeed, it was established by antidromic activation in anesthetized rats that GABAergic and putative glutamatergic neurons, whose discharge was cross-correlated with cortical activity, like cholinergic neurons, also project to the cortex (Manns et al., 2000a,b, 2003a). In the present study, the proportions represented by ChAT+ (14%), GAD+ (36%), and ChAT−/GAD− cells (22%) of the WP-max plus S-max subgroups correspond approximately to the proportions constituted by cholinergic (19%), GABAergic (52%), and glutamatergic (∼15%) BF terminals in the cortex (Henny and Jones, 2008). On the other hand, BF neurons whose discharge is correlated with EMG amplitude might well comprise neurons giving rise predominantly to descending projections to the hypothalamus and perhaps brainstem. The W- and P-max cell subgroups together were constituted entirely by GAD+ (45%) and ChAT−/GAD− (55%) cells in proportions not discordant with those of GABAergic (50%) and glutamatergic (25%) BF terminals innervating the hypothalamus (Henny and Jones, 2006b). In addition, as previously suggested (Semba et al., 1987) and indicated in the present study, in which Nb+ varicosities could be located in sections adjacent to labeled soma, cholinergic, GABAergic, and glutamatergic BF neurons of the varied sleep–wake subgroups as either projection neurons or interneurons also give rise to local collaterals or projections by which they can influence other BF neurons.
Unlike cholinergic neurons, GABAergic neurons comprise three functionally different sleep–wake subgroups, WP-max (36%), S-max (28%), and P-max (36%). The GABAergic WP-max active cells were predominantly fast-spiking neurons whose discharge rate was positively correlated with gamma EEG activity. In contrast to the cholinergic neurons of this subgroup (Manns et al., 2000a; Lee et al., 2005b), no GABAergic WP-max active neurons were found to discharge rhythmically or in correlation with theta on the EEG during PS or waking. Some such rhythmically firing GABAergic cells were previously found in the medial septum/diagonal band (Simon et al., 2006) and in the MCPO/SI of anesthetized rats (Manns et al., 2003a). The GABAergic WP-max cells found here resembled tonic, fast-spiking “cortical activation-On” and cortically projecting cells recorded in anesthetized rats (Manns et al., 2000b). These WP-max active GABAergic neurons would thus appear to influence fast cortical activity in a tonic or more phasic yet arrhythmic manner. As cortically projecting, they could promote fast cortical activity either by disinhibition (Freund and Meskenaite, 1992) or alternatively fast pacing (Somogyi and Klausberger, 2005) of pyramidal cells through the different interneurons they innervate (Henny and Jones, 2008).
The GABAergic S-max active neurons were largely fast, phasically spiking neurons, whose discharge rate was positively correlated with delta EEG activity, and which resembled “cortical activation-Off”, cortically projecting GABAergic cells, previously identified in anesthetized animals (Manns et al., 2000b). The latter cells and sleep active cells revealed by c-Fos were previously distinguished from other GABAergic cells as bearing α2-adrenergic receptors (α2-ARs) and thus being inhibited by noradrenaline (NA) (Manns et al., 2003b; Modirrousta et al., 2004; Jones, 2005b). Yet, in contrast to the GABAergic cells recorded in anesthetized animals, almost none recorded here showed cross-correlated firing with slow delta EEG activity. The previously observed cross-correlated discharge was perhaps due to corticofugal output during highly synchronous slow EEG activity associated with anesthesia (Steriade et al., 1994). Although they would accordingly not pace slow delta EEG activity, the GABAergic BF neurons could nonetheless inhibit pyramidal cells or particular interneurons in the cortex (Henny and Jones, 2008) in a manner to prevent fast cortical activity and thereby favor slow-wave activity that is generated by cortical and thalamic oscillatory networks (Steriade et al., 1994). As projection or interneurons, GABAergic S-max active neurons could also through local projections inhibit BF WP-max active cells, including the cholinergic neurons, whose activity can be homeostatically regulated through dynamically changing GABAA receptors (Modirrousta et al., 2007).
GABAergic P-max active, fast-spiking neurons increased their discharge progressively across sleep stages to attain rates, which were maximal during PS and negatively correlated with EMG activity across states. They could accordingly exert inhibitory influences on other neural systems which stimulate muscle tone and behavioral arousal, such as neurons in the brainstem (Semba et al., 1989) or hypothalamus to which GABAergic BF neurons project (Gritti et al., 1994; Henny and Jones, 2006b). Indeed, GABAergic BF neurons make inhibitory synapses upon orexin neurons (Henny and Jones, 2006a), which are W-max active neurons (Lee et al., 2005a). Such an influence could serve to diminish muscle tone and promote behavioral quiescence of sleep culminating in PS with muscle atonia. As projection or interneurons, the GABAergic P-max active cells could also inhibit through local projections BF glutamatergic W-max active neurons.
ChAT−/GAD− cells comprise all sleep–wake subgroups, including WP-max (46%), S-max (17%), P-max (17%), and W-max (14%). In at least one cell of most subgroups, ChAT−/GAD− cells were proven to be glutamatergic by the presence of VGluT2 in their terminals (Fremeau et al., 2001). Glutamatergic neurons could thus share a role with cholinergic and GABAergic neurons in cortical activation during W and PS, with GABAergic neurons in cortical deactivation during SWS and with GABAergic neurons in muscle tone attenuation and behavioral quiescence, culminating in PS. Given the documented projections of glutamatergic neurons to the cortex which parallel those of the cholinergic neurons onto particular interneurons (Henny and Jones, 2008), it is not surprising that they participate in processes of cortical activation as WP-max active cells. As fast-spiking neurons, they could stimulate fast gamma activity. As to their role and actions as S-max active neurons, the putative glutamatergic neurons could excite other S-max active cells, including GABAergic neurons in the BF. Similarly, P-max active glutamatergic neurons could excite other P-max cells, such as MCH neurons in the hypothalamus (Hassani et al., 2009) or GABAergic neurons in the BF. According to their singular profile as W-max active, discharging in positive association with EMG amplitude, glutamatergic BF neurons could play a unique role in facilitating muscle tone and behavioral arousal. They could exert an excitatory influence on neurons in the brainstem (Semba et al., 1989) or hypothalamus, including orexin neurons, onto which glutamatergic BF neurons make excitatory synapses (Henny and Jones, 2006a,b).
Among the most striking features of this study is on the one hand, the similarity of discharge profiles among the transmitter cell types within the same sleep–wake subgroup and on the other, the reciprocity of discharge profiles among the transmitter cell types between different sleep–wake subgroups. Accordingly cholinergic, GABAergic, and glutamatergic WP-max active cells, whose discharge is positively correlated with gamma, might be redundant in their roles of stimulating cortical activation, albeit through different mechanisms and actions upon different neurons in the cortex. It is likely for this reason, together with the varied and complementary roles of the noncholinergic cell types, that the effects of neurotoxic lesions in the BF targeting the cholinergic neurons are minimal, and those concerning predominantly noncholinergic neurons, including GABAergic neurons, are more marked on EEG activity, yet also minimal or complex on sleep–wake states and their homeostatic regulation (Blanco-Centurion et al., 2007; Kaur et al., 2008). Indeed, multiple lines of evidence including the current results indicate that collectively, through similar and reciprocal profiles of discharge, intermingled cholinergic, GABAergic, and glutamatergic BF neurons having different projections and bearing different receptors can effectively orchestrate changes in cortical activity and behavior across sleep–wake states (Jones, 2004).
Footnotes
This work was supported by the Canadian Institutes of Health Research (CIHR MOP-13458) and National Institutes of Health (NIH R01 MH-60119-01A). We thank for their assistance Lynda Mainville in immunohistochemistry, Frederic Brischoux in neuroanatomy, Soufiane Boucetta in experimentation, and Chris Cordova in data analysis. We also thank Robert H. Edwards and Robert T. Fremeau (Departments of Neurology and Physiology, University of California San Francisco School of Medicine, San Francisco, CA) for kindly supplying the antibodies for VGluT2.
References
- Berntson GG, Shafi R, Sarter M. Specific contributions of the basal forebrain corticopetal cholinergic system to electroencephalographic activity and sleep/waking behaviour. Eur J Neurosci. 2002;16:2453–2461. doi: 10.1046/j.1460-9568.2002.02310.x. [DOI] [PubMed] [Google Scholar]
- Blanco-Centurion C, Gerashchenko D, Shiromani PJ. Effects of saporin-induced lesions of three arousal populations on daily levels of sleep and wake. J Neurosci. 2007;27:14041–14048. doi: 10.1523/JNEUROSCI.3217-07.2007. [DOI] [PMC free article] [PubMed] [Google Scholar]
- Duque A, Balatoni B, Detari L, Zaborszky L. EEG correlation of the discharge properties of identified neurons in the basal forebrain. J Neurophysiol. 2000;84:1627–1635. doi: 10.1152/jn.2000.84.3.1627. [DOI] [PubMed] [Google Scholar]
- Fremeau RT, Jr, Troyer MD, Pahner I, Nygaard GO, Tran CH, Reimer RJ, Bellocchio EE, Fortin D, Storm-Mathisen J, Edwards RH. The expression of vesicular glutamate transporters defines two classes of excitatory synapse. Neuron. 2001;31:247–260. doi: 10.1016/s0896-6273(01)00344-0. [DOI] [PubMed] [Google Scholar]
- Freund TF, Meskenaite V. Gamma-aminobutyric acid-containing basal forebrain neurons innervate inhibitory interneurons in the neocortex. Proc Natl Acad Sci U S A. 1992;89:738–742. doi: 10.1073/pnas.89.2.738. [DOI] [PMC free article] [PubMed] [Google Scholar]
- Gritti I, Mainville L, Jones BE. Codistribution of GABA- with acetylcholine-synthesizing neurons in the basal forebrain of the rat. J Comp Neurol. 1993;329:438–457. doi: 10.1002/cne.903290403. [DOI] [PubMed] [Google Scholar]
- Gritti I, Mainville L, Jones BE. Projections of GABAergic and cholinergic basal forebrain and GABAergic preoptic-anterior hypothalamic neurons to the posterior lateral hypothalamus of the rat. J Comp Neurol. 1994;339:251–268. doi: 10.1002/cne.903390206. [DOI] [PubMed] [Google Scholar]
- Gritti I, Mainville L, Mancia M, Jones BE. GABAergic and other non-cholinergic basal forebrain neurons project together with cholinergic neurons to meso- and iso-cortex in the rat. J Comp Neurol. 1997;383:163–177. [PubMed] [Google Scholar]
- Gritti I, Henny P, Galloni F, Mainville L, Mariotti M, Jones BE. Stereological estimates of the basal forebrain cell population in the rat, including neurons containing choline acetyltransferase, glutamic acid decarboxylase or phosphate-activated glutaminase and colocalizing vesicular glutamate transporters. Neuroscience. 2006;143:1051–1064. doi: 10.1016/j.neuroscience.2006.09.024. [DOI] [PMC free article] [PubMed] [Google Scholar]
- Hassani OK, Lee MG, Jones BE. Discharge properties of identified GABAergic basal forebrain neurons across the sleep-waking cycle in head-fixed rats. Soc Neurosci Abstr. 2006;32:458–417. [Google Scholar]
- Hassani OK, Lee MG, Jones BE. Melanin-concentrating hormone neurons discharge in a reciprocal manner to orexin neurons across the sleep-wake cycle. Proc Natl Acad Sci U S A. 2009;106:2418–2422. doi: 10.1073/pnas.0811400106. [DOI] [PMC free article] [PubMed] [Google Scholar]
- Henny P, Jones BE. Innervation of orexin/hypocretin neurons by GABAergic, glutamatergic or cholinergic basal forebrain terminals evidenced by immunostaining for presynaptic vesicular transporter and postsynaptic scaffolding proteins. J Comp Neurol. 2006a;499:645–661. doi: 10.1002/cne.21131. [DOI] [PMC free article] [PubMed] [Google Scholar]
- Henny P, Jones BE. Vesicular glutamate (VGluT), GABA (VGAT), and acetylcholine (VAChT) transporters in basal forebrain axon terminals innervating the lateral hypothalamus. J Comp Neurol. 2006b;496:453–467. doi: 10.1002/cne.20928. [DOI] [PMC free article] [PubMed] [Google Scholar]
- Henny P, Jones BE. Projections from basal forebrain to prefrontal cortex comprise cholinergic, GABAergic and glutamatergic inputs to pyramidal cells or interneurons. Eur J Neurosci. 2008;27:654–670. doi: 10.1111/j.1460-9568.2008.06029.x. [DOI] [PMC free article] [PubMed] [Google Scholar]
- Jones BE. Activity, modulation and role of basal forebrain cholinergic neurons innervating the cerebral cortex. Prog Brain Res. 2004;145:157–169. doi: 10.1016/S0079-6123(03)45011-5. [DOI] [PubMed] [Google Scholar]
- Jones BE. Basic mechanisms of sleep-wake states. In: Kryger MH, Roth T, Dement WC, editors. Principles and practice of sleep medicine. Ed 4. Philadelphia: Elsevier Saunders; 2005a. pp. 136–153. [Google Scholar]
- Jones BE. From waking to sleeping: neuronal and chemical substrates. Trends Pharmacol Sci. 2005b;26:578–586. doi: 10.1016/j.tips.2005.09.009. [DOI] [PubMed] [Google Scholar]
- Kaur S, Junek A, Black MA, Semba K. Effects of ibotenate and 192IgG-saporin lesions of the nucleus basalis magnocellularis/substantia innominata on spontaneous sleep and wake states and on recovery sleep after sleep deprivation in rats. J Neurosci. 2008;28:491–504. doi: 10.1523/JNEUROSCI.1585-07.2008. [DOI] [PMC free article] [PubMed] [Google Scholar]
- Lee MG, Manns ID, Alonso A, Jones BE. Sleep-wake related discharge properties of basal forebrain neurons recorded with micropipettes in head-fixed rats. J Neurophysiol. 2004;92:1182–1198. doi: 10.1152/jn.01003.2003. [DOI] [PubMed] [Google Scholar]
- Lee MG, Hassani OK, Jones BE. Discharge of identified orexin/hypocretin neurons across the sleep–waking cycle. J Neurosci. 2005a;25:6716–6720. doi: 10.1523/JNEUROSCI.1887-05.2005. [DOI] [PMC free article] [PubMed] [Google Scholar]
- Lee MG, Hassani OK, Alonso A, Jones BE. Cholinergic basal forebrain neurons burst with theta during waking and paradoxical sleep. J Neurosci. 2005b;25:4365–4369. doi: 10.1523/JNEUROSCI.0178-05.2005. [DOI] [PMC free article] [PubMed] [Google Scholar]
- Maloney KJ, Cape EG, Gotman J, Jones BE. High-frequency gamma electroencephalogram activity in association with sleep-wake states and spontaneous behaviors in the rat. Neuroscience. 1997;76:541–555. doi: 10.1016/s0306-4522(96)00298-9. [DOI] [PubMed] [Google Scholar]
- Maloney KJ, Mainville L, Jones BE. Differential c-Fos expression in cholinergic, monoaminergic and GABAergic cell groups of the pontomesencephalic tegmentum after paradoxical sleep deprivation and recovery. J Neurosci. 1999;19:3057–3072. doi: 10.1523/JNEUROSCI.19-08-03057.1999. [DOI] [PMC free article] [PubMed] [Google Scholar]
- Manns ID, Alonso A, Jones BE. Discharge properties of juxtacellularly labeled and immunohistochemically identified cholinergic basal forebrain neurons recorded in association with the electroencephalogram in anesthetized rats. J Neurosci. 2000a;20:1505–1518. doi: 10.1523/JNEUROSCI.20-04-01505.2000. [DOI] [PMC free article] [PubMed] [Google Scholar]
- Manns ID, Alonso A, Jones BE. Discharge profiles of juxtacellularly labeled and immunohistochemically identified GABAergic basal forebrain neurons recorded in association with the electroencephalogram in anesthetized rats. J Neurosci. 2000b;20:9252–9263. doi: 10.1523/JNEUROSCI.20-24-09252.2000. [DOI] [PMC free article] [PubMed] [Google Scholar]
- Manns ID, Mainville L, Jones BE. Evidence for glutamate, in addition to acetylcholine and GABA, neurotransmitter synthesis in basal forebrain neurons projecting to the entorhinal cortex. Neuroscience. 2001;107:249–263. doi: 10.1016/s0306-4522(01)00302-5. [DOI] [PubMed] [Google Scholar]
- Manns ID, Alonso A, Jones BE. Rhythmically discharging basal forebrain units comprise cholinergic, GABAergic, and putative glutamatergic cells. J Neurophysiol. 2003a;89:1057–1066. doi: 10.1152/jn.00938.2002. [DOI] [PubMed] [Google Scholar]
- Manns ID, Lee MG, Modirrousta M, Hou YP, Jones BE. Alpha 2 adrenergic receptors on GABAergic, putative sleep-promoting basal forebrain neurons. Eur J Neurosci. 2003b;18:723–727. doi: 10.1046/j.1460-9568.2003.02788.x. [DOI] [PubMed] [Google Scholar]
- Modirrousta M, Mainville L, Jones BE. GABAergic neurons with alpha2-adrenergic receptors in basal forebrain and preoptic area express c-Fos during sleep. Neuroscience. 2004;129:803–810. doi: 10.1016/j.neuroscience.2004.07.028. [DOI] [PubMed] [Google Scholar]
- Modirrousta M, Mainville L, Jones BE. Dynamic changes in GABAA receptors on basal forebrain cholinergic neurons following sleep deprivation and recovery. BMC Neurosci. 2007;8:15. doi: 10.1186/1471-2202-8-15. [DOI] [PMC free article] [PubMed] [Google Scholar]
- Semba K, Reiner PB, McGeer EG, Fibiger HC. Morphology of cortically projecting basal forebrain neurons in the rat as revealed by intracellular iontophoresis of horseradish peroxidase. Neuroscience. 1987;20:637–651. doi: 10.1016/0306-4522(87)90116-3. [DOI] [PubMed] [Google Scholar]
- Semba K, Reiner PB, McGeer EG, Fibiger HC. Brainstem projecting neurons in the rat basal forebrain: neurochemical, topographical, and physiological distinctions from cortically projecting cholinergic neurons. Brain Res Bull. 1989;22:501–509. doi: 10.1016/0361-9230(89)90102-0. [DOI] [PubMed] [Google Scholar]
- Simon AP, Poindessous-Jazat F, Dutar P, Epelbaum J, Bassant MH. Firing properties of anatomically identified neurons in the medial septum of anesthetized and unanesthetized restrained rats. J Neurosci. 2006;26:9038–9046. doi: 10.1523/JNEUROSCI.1401-06.2006. [DOI] [PMC free article] [PubMed] [Google Scholar]
- Somogyi P, Klausberger T. Defined types of cortical interneurone structure space and spike timing in the hippocampus. J Physiol. 2005;562:9–26. doi: 10.1113/jphysiol.2004.078915. [DOI] [PMC free article] [PubMed] [Google Scholar]
- Steriade M, Contreras D, Amzica F. Synchronized sleep oscillations and their paroxysmal developments. Trends Neurosci. 1994;17:199–208. doi: 10.1016/0166-2236(94)90105-8. [DOI] [PubMed] [Google Scholar]
- Szymusiak R. Magnocellular nuclei of the basal forebrain: substrates of sleep and arousal regulation. Sleep. 1995;18:478–500. doi: 10.1093/sleep/18.6.478. [DOI] [PubMed] [Google Scholar]
- Szymusiak R, McGinty D. Sleep-related neuronal discharge in the basal forebrain of cats. Brain Res. 1986;370:82–92. doi: 10.1016/0006-8993(86)91107-8. [DOI] [PubMed] [Google Scholar]
- Szymusiak R, Alam N, McGinty D. Discharge patterns of neurons in cholinergic regions of the basal forebrain during waking and sleep. Behav Brain Res. 2000;115:171–182. doi: 10.1016/s0166-4328(00)00257-6. [DOI] [PubMed] [Google Scholar]