LIN28B confers radio-resistance through the posttranscriptional control of KRAS (original) (raw)
Abstract
To screen the differentially expressed microRNAs related to radio-resistance, we compared the microRNA profiles of lung cancer cells with different responses to ionizing radiation (IR). Of 328 microRNAs in microarray, 27 microRNAs were differentially expressed in NCI-H460 (H460) and NCI-H1299 (H1299) cells. Among them, let-7g was down-regulated in radio-resistant H1299 cells, and the level of let-7g was higher in radio-sensitive cells like Caski, H460, and ME180 in qRT-PCR analysis than in radio-resistant cells like A549, H1299, DLD1, and HeLa. Over-expression of let-7g in H1299 cells could suppress the translation of KRAS, and increase the sensitivity to IR. When we knockdown the expression of LIN28B, an upstream regulator of let-7g, the level of mature let-7g was increased in H1299 cells and the sensitivity to IR was also enhanced in LIN28B knockdown cells. From these data, we suggest that LIN28B plays an important role in radiation responses of lung cancer cells through inhibiting let-7g processing and increasing translation of KRAS.
Keywords: gene expression profiling; KRAS protein, human; LIN28B protein, human; lung neoplasms; microRNAs; mirnlet7 microRNA, human; radiation, ionizing
Introduction
Together with surgery and chemotherapy, ionizing radiation (IR) plays a central role in the treatment of human cancers. Approximately half of all cancer patients can be treated with radiotherapy, but the therapeutic strategy must be carefully adjusted to achieve an effective therapeutic dose while minimizing side effects (Wu et al., 2002). Nonetheless, a sizable proportion of patients do not respond to radiotherapy. There have been a lot of efforts to improve the delivery of high doses to tumors while saving normal tissues during last decades. Such efforts are mainly focused on the physical aspects such as planning and delivery, rather than the biological parameters determining the radio-sensitivity of each patient.
Radio-resistance has been shown to be related to the expression of several genes such as TP53 (Biard et al., 1994), BCL2 (Lee et al., 1999), and BIRC5 (Asanuma et al., 2000). Over-expression of RAS (Sklar, 1988) confers radio-resistance, while ATM increases sensitivity to ionizing radiation (Westphal et al., 1997). Although such findings have helped establish models for the molecular mechanisms responsible for radio-sensitivity, the whole process is still poorly understood. Microarray technology permits simultaneous analysis of the expression levels of multiple genes at the whole genome level (Park et al., 2002). Genome-wide analysis can lead to the identification of gene regulatory pathways that result in the development of resistance to therapeutic procedures. Differential gene expression profiles of radio-resistant breast cancer, esophageal cancer, and uterine cervical cancer cell lines have been examined using microarray analysis (Hanna and Shrieve, 2001; Kitahara et al., 2002).
Translational suppression by microRNA is one of the major regulatory mechanisms in carcinogenesis, development, and immune system function (He et al., 2007; Flynt and Lai, 2008). The microRNA let-7 has been reported to regulate the radiation response in human cancers (He et al., 2007; Weidhaas et al., 2007). In this study, we compared the microRNA expression profiles of two lung cancer cells with different responses to IR and listed 27 microRNA candidates related to the differential responses to IR. let-7g was down-regulated in radio-resistant H1299 cells and could not suppress the translation of KRAS. When we knockdown LIN28B by siRNA, the maturation of let-7g was restored and the radio-sensitivity of H1299 cells was increased.
Results
Differential expression of microRNAs in lung cancer cells
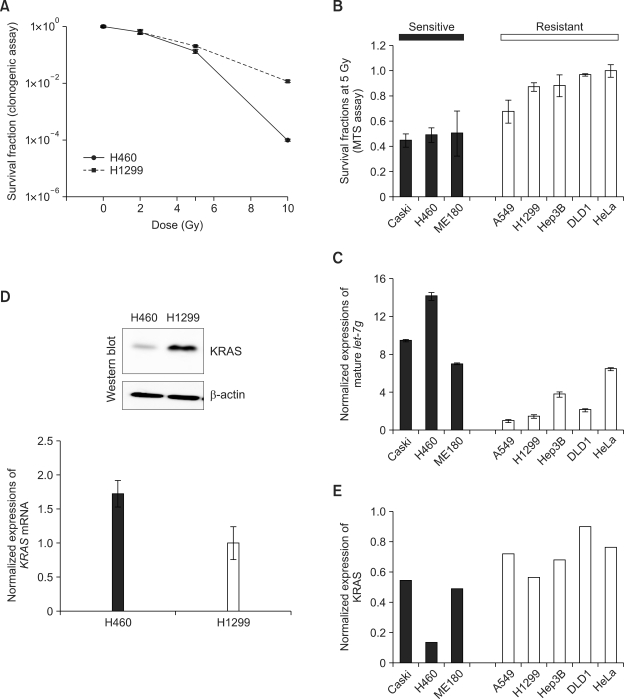
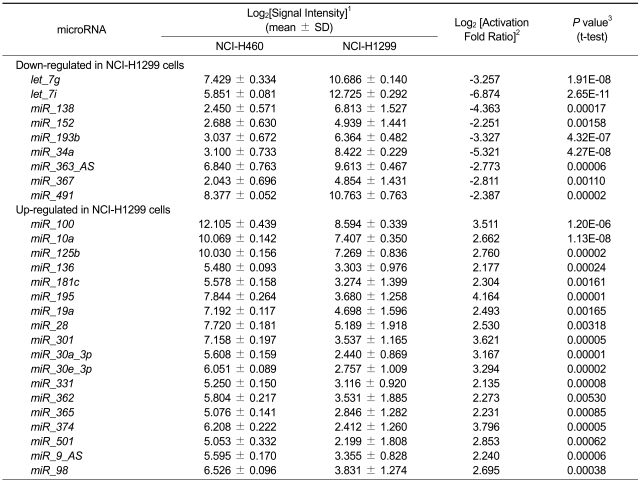
To understand the post-transcriptional regulation related to radio-resistance, we chose H460 and H1299 human non-small cell lung cancer cells. H460 cells showed more sensitive response to IR than H1299 (Figure 1A). Using these two cells, we examined the profiles of microRNA expression and selected differentially expressed microRNAs. Using microRNA microarray, we could compare the expression of 328 human microRNAs among 622 probes in the microarray. From eight-times replicated data from two independent experiments, we selected 27 differentially expressed microRNAs by statistical analysis (log2 (signal intensity) > 2, log2 (activation fold ratio) > 2 or < -2 and _t_-test P < 0.001), as listed in Table 1.
Figure 1.
Differential expression of let-7g and post-transcriptional regulation of KRAS. Following γ-irradiation at 0, 2, 5, and 10 Gy, the numbers of foci were scored to measure survival faction in H460 and H1299 lung cancer cells (A). Sensitivity of eight cancer cell lines (Caski, H460, ME180, A549, H1299, Hep3B, DLD1, and HeLa) to ionizing radiation at 5 Gy was determined by MTS assay (B). Determination of the level of mature let-7g by qRT-PCR (C). Expression of KRAS mRNA and protein in H460 and H1299 cells was measured qRT-PCR and western blot analysis (D). KRAS protein levels in eight cancer cells were also quantified from the western blot and densitometric measurement (E).
Table 1.
List of differentially expressed microRNAs in radio-resistant H1299 cells.
Nine microRNAs were down-regulated in radio-resistant H1299 cell, and we selected let-7g to check its expression in eight cancer cells with different radio-sensitivity. We could classify them into two groups according to their survival fractions after irradiating 5 Gy (Figure 1B). Caski, H460, and ME180 cells were more sensitive to IR than A549, H1299, Hep3B, DLD1, and HeLa cells. Using qRT-PCR against mature let-7g, we checked the level of mature let-7g to find the up-regulation of let-7g in radio-sensitive cells (Figure 1C).
Post-transcriptional control of KRAS by let-7g
Oncogenic activation of KRAS is closely related to clinical course of lung cancer including the responsiveness to radiotherapy. As a target of let-7g, the protein level of KRAS was examined in H460 and H1299 cells to find the down-regulation of KRAS in H460 cells (Figure 1D). In addition, we also examined KRAS expression in eight cancer cells to find the reverse correlation with the level of let-7g (Figure 1E). These data suggest that KRAS expression is regulated at the post-transcriptional level in H460 cells.
Control of radio-sensitivity by let-7g
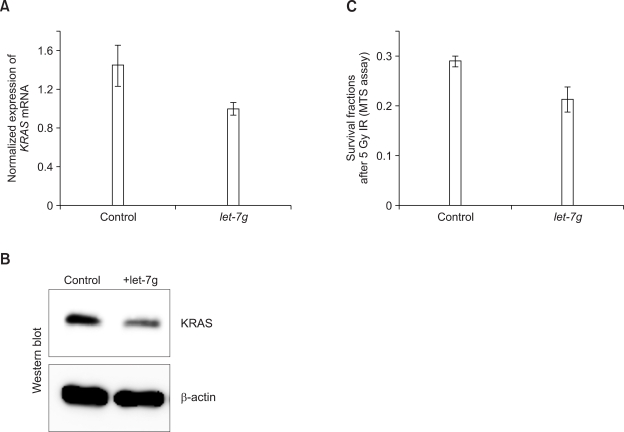
To further investigate the role of let-7g in radio-resistance, we over-expressed let-7g in radio-resistant H1299 cells to determine whether radio-sensitivity was affected by suppression of KRAS translation. Ectopically expressed let-7g could down-regulate KRAS expression in H1299 cells at both the protein and mRNA level (Figures 2A and 2B). In addition, the let-7g could enhance the radio-sensitivity (Figure 2C).
Figure 2.
Regulation of radio-sensitivity by let-7g. let-7g expression vector was introduced into radio-resistant H1299 cells, and the expression of KRAS was determined by qRT-PCR (A) and western blot (B). The effect of let-7g on cell survival following γ-irradiation was measured by MTS assay (C).
LIN28B regulates let-7g and KRAS expression
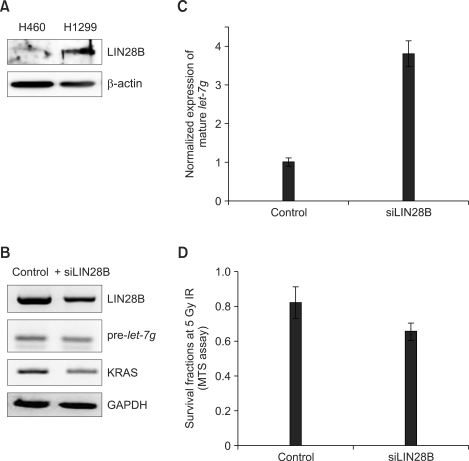
Because LIN28B can selectively block the processing of primary let-7 microRNA, we investigated the level of LIN28B in H460 and H1299 lung cancer cells (Figure 3A). To test whether the suppression of let-7g maturation by LIN28B in H1299 cells, we introduced siRNA against LIN28B into H1299 cells (Figure 3B). Knockdown of LIN28B by siRNA induced the decreased level of pre-let-7g (Figure 3B) and increased the level of mature let-7g (Figure 3C). KRAS protein levels were also decreased in siLIN28B-transfected cells as well (Figure 3B). Moreover, knockdown of LIN28B led H1299 cells to increase their sensitivity to IR (Figure 3D).
Figure 3.
Knockdown of LIN28B enhances the radio-sensitivity. The protein levels of LIN28B in H460 and H1299 cells were measured by western blot (A). After the introduction of siLIN28B into H1299 cells, the level of LIN28B, pre-let-7g and KRAS were measured by RT-PCR (B). The level of mature let-7g was also measured in LIN28B-knockdown H1299 cells by qRT-PCR (C). LIN28B-knockdown H1299 cells were irradiated at 5 Gy and survival was determined by MTS assay (D).
Discussion
To understand the post-transcriptional control of radio-sensitivity by microRNA, we analyzed microRNA profiles from two lung cancer cells with different responses to IR. Among 27 differentially expressed microRNAs, we focused on let-7g because it was known to suppress the translation of KRAS previously (Johnson et al., 2005). To evaluate the role of let-7g in radio-sensitivity, we examined the level of mature let-7g in eight cancer cells. An increased level of let-7g was confirmed in other radio-sensitive cells like ME180 and Caski. Although we need to validate the correlation of let-7g and outcome of radiotherapy in patients, we can suggest that the level of let-7g was correlated with radio-sensitivity.
Direct control of microRNA processing by LIN28B or LIN28 may determine the level of mature let-7g in cancer cells (Viswanathan et al., 2008; Chang et al., 2009). LIN28 and LIN28B RNA binding proteins were recently demonstrated to negatively regulate let-7 biogenesis. We tested hypothesis on the regulation of radio-sensitivity by LIN28B by knockdown experiment.
We also reconstituted the effect of let-7g by the over-expression of let-7g in a radio-resistant H1299 cells to enhance the radio-sensitivity. Over-expression of let-7 can suppress many target mRNAs including KRAS and HMGA2 (Johnson et al., 2005; Pillai et al., 2005; Dahiya et al., 2008). We selected KRAS as a candidate gene downstream of let-7g that is involved in radiation response. Oncogenic activation of KRAS is a candidate marker for determination of prognosis, and there are many reports suggesting that mutations in KRAS might play an important role in patient outcome (Guerrero et al., 1984; Bengala et al., 2009). The findings of this study suggest that post-transcriptional activation of KRAS may also regulate the response to radiotherapy.
Methods
Cell culture
H460, H1299, ME180, and Hep3B cells were maintained in Roswell Park Memorial Institute medium 1640 (RPMI 1640) enriched with 10% FBS (Hyclone, Logan, UT), 1% penicillin/streptomycin (Gibco-BRL, Carlsbad, CA), and 2 mM L-glutamine (Gibco-BRL, Carlsbad, CA). HeLa, A549, DLD1 and Caski cells were maintained in DMEM enriched with 10% FBS, 1% penicillin/streptomycin, and 2 mM L-glutamine.
Clonogenic assay and MTS assay
Cells were seeded into 6-well plates at a density of 200-500 cells/well and incubated overnight. After exposure to ionizing radiation from an accelerator (Clinac 4/100, Varian, Palo Alto, CA), cells were cultured for 10-15 days. Colonies were fixed with 100% chilled methanol and stained with crystal violet (Sigma, St. Louis, MO).
The MTS assay was performed using the CellTiter Aqueous OneSolution kit (Promega, Madison, WI). Cells were seeded into 96-well plates at a density of 5,000 cells/well and incubated overnight. After exposure to ionizing radiation, cells were incubated for 4-5 days, MTS (3-(4,5-dimethylthiazol-2-yl))-5-(3-carboxymethoxyphenyl)-2-(4-sulfophenyl)-2H-tetrazolium) was added to each well and incubated for 1 h, and absorbance was measured at 490 nm.
MicroRNA microarray and data analysis
Small RNAs from H460 and H1299 cells were isolated using mirVana microRNA isolation kit (Applied Biosystems/Ambion, Austin, TX) as described by the manufacturer. The purity and integrity of total RNA were checked using Bioanalyzer (Agilent, Santa Clara, CA). Synthesis of probes from total RNA samples, hybridization, detection, and scanning were performed according to standard protocols from Ambion (Applied Biosystems/Ambion, Austin, TX). We used samples from duplicated experiments and a mirVana microRNA microarray containing 2,000 spots with quaduplicates for 600 microRNAs from human, mouse, and rat. For data analysis, fluorescence intensity was processed and measured using a Exon scanner or GeneChip scanner 3,000. The raw intensity values were corrected and normalized with GeneSpring program (Agilent, Santa Clara, CA)(Park et al., 2002).
Western blot analysis
Whole cell extracts were prepared using RIPA lysis buffer containing protease inhibitor cocktail (Roche, Basel, Switzerland). Protein extracts were separated in a 12% SDS-PAGE gel and transferred to a nitrocellulose membrane. Membranes were blocked with 5% BSA and incubated with mouse anti-KRAS (Oncogene Research Products, La Jolla, CA), rabbit anti-LIN28B (Abcam, Cambridge, MA), or mouse anti-beta-actin (Sigma, St. Louis, MO) antibody. Membranes were then incubated with HRP-conjugated anti-mouse IgG (Santa Cruz Biotechniques, Santa Cruz, CA) and anti-rabbit IgG (Jackson ImmunoResearch Laboratories, West Grove, PA) and visualized with SuperSignal West Pico Cheminoluminescent Substrate (Pierce, Rockford, IL).
qRT-PCR
The relative Ct method with SYBR green was performed with the 7,000 Real-Time PCR System (Applied Biosystems, Austin, TX). The following primers were used: KRAS, 5'-CGTAGGCAAGATGCCTTGA-3' and 5'-CCTCTTGACCTGCTGTGTCG-3'; LIN28B, 5'-TGCACTTCAACTCTCCCTCG-3' and 5'-GAACTGAAGGCCCCTTTTTG-3'. Levels of mature microRNA species were measured by quantitative PCR using commercially available TaqMan probes (Applied Biosystems, Austin, TX) according to the manufacturer's instructions using U6B small RNA as an internal standard for normalization.
Cloning
Primary let-7g sequence was amplified from HeLa genomic DNA and cloned into the pCR-8-Topo vector (Invitrogen, Carlsbad, CA) for direct use in in vitro transcription. Cloned pri-miRNAs were subcloned into pcDNA-Dest47 for expression study. Full-length KRAS was cloned into the pCEP4 vector (Invitrogen, Carlsbad, CA).
Knockdown with siRNA
siRNA targeting LIN28B (siLIN28B) was purchased from Dharmacon (Lafayette, CO). siLIN28B or non-targeting siRNA was transfected to H460 and H1299 cells at 100nM. Total RNA was collected at 24 h after transfection to quantify LIN28B mRNA by quantitative RT-PCR with GAPDH as a normalization control. The protein levels were measured by western blot analysis using anti-LIN28B antibody (Abcam, Cambridge, MA).
Acknowledgements
This paper is supported by a grant from Korea Science and Engineering Foundation (KOSEF), the Ministry of Education, Science and Technology, Korea (M20706000020-07M0600-02010 to W.Y.P), and Brain Korea21 (BK21) Program (S.H.J. and W.Y.P.).
Abbreviations
KRAS
v-Ki-ras2 Kirsten rat sarcoma viral oncogene homolog
LIN28B
lin-28 homolog B (C. elegans)
MTS
3-(4,5-dimethylthiazol-2-yl))-5-(3-carboxymethoxyphenyl)-2-(4-sulfophenyl)-2H-tetrazolium
qRT-PCR
quantitative real-time reverse transcriptase polymerase chain reaction
References
- 1.Asanuma K, Moriai R, Yajima T, Yagihashi A, Yamada M, Kobayashi D, Watanabe N. Survivin as a radioresistance factor in pancreatic cancer. Jpn J Cancer Res. 2000;91:1204–1209. doi: 10.1111/j.1349-7006.2000.tb00906.x. [DOI] [PMC free article] [PubMed] [Google Scholar]
- 2.Bengala C, Bettelli S, Bertolini F, Salvi S, Chiara S, Sonaglio C, Losi L, Bigiani N, Sartori G, Dealis C, Malavasi N, D'Amico R, Luppi G, Gatteschi B, Maiorana A, Conte PF. Epidermal growth factor receptor gene copy number, K-ras mutation and pathological response to preoperative cetuximab, 5-FU and radiation therapy in locally advanced rectal cancer. Ann Oncol. 2009;20:469–474. doi: 10.1093/annonc/mdn647. [DOI] [PubMed] [Google Scholar]
- 3.Biard DS, Martin M, Rhun YL, Duthu A, Lefaix JL, May E, May P. Concomitant p53 gene mutation and increased radio-sensitivity in rat lung embryo epithelial cells during neoplastic development. Cancer Res. 1994;54:3361–3364. [PubMed] [Google Scholar]
- 4.Chang TC, Zeitels LR, Hwang HW, Chivukula RR, Wentzel EA, Dews M, Jung J, Gao P, Dang CV, Beer MA, Thomas-Tikhonenko A, Mendell JT. Lin-28B transactivation is necessary for Myc-mediated let-7 repression and proliferation. Proc Natl Acad Sci USA. 2009;106:3384–3389. doi: 10.1073/pnas.0808300106. [DOI] [PMC free article] [PubMed] [Google Scholar]
- 5.Dahiya N, Sherman-Baust CA, Wang TL, Davidson B, Shihle M, Zhang Y, Wood W, 3rd, Becker KG, Morin PJ. MicroRNA expression and identification of putative miRNA targets in ovarian cancer. PLoS ONE. 2008;3:e2436. doi: 10.1371/journal.pone.0002436. [DOI] [PMC free article] [PubMed] [Google Scholar]
- 6.Flynt AS, Lai EC. Biological principles of microRNA-mediated regulation: shared themes amid diversity. Nat Rev Genet. 2008;9:831–842. doi: 10.1038/nrg2455. [DOI] [PMC free article] [PubMed] [Google Scholar]
- 7.Guerrero I, Villasante A, Corces V, Pellicer A. Activation of a c-K-ras oncogene by somatic mutation in mouse lymphomas induced by gamma radiation. Science. 1984;225:1159–1162. doi: 10.1126/science.6474169. [DOI] [PubMed] [Google Scholar]
- 8.Hanna E, Shrieve DC, Ratanatharathorn V, Xia X, Breau R, Suen J, Li S. A novel alternative approach for prediction of radiation response of squamous cell carcinoma of head and neck. Cancer Res. 2001;61:2376–2380. [PubMed] [Google Scholar]
- 9.He X, He L, Hannon GJ. The guardian's little helper: microRNAs in the p53 tumor suppressor network. Cancer Res. 2007;67:11099–11101. doi: 10.1158/0008-5472.CAN-07-2672. [DOI] [PubMed] [Google Scholar]
- 10.Johnson SM, Grosshans H, Shingara J, Byrom M, Jarvis R, Cheng A, Labourier E, Reinert KL, Brown D, Slack FJ. RAS is regulated by the let-7 microRNA family. Cell. 2005;120:635–647. doi: 10.1016/j.cell.2005.01.014. [DOI] [PubMed] [Google Scholar]
- 11.Kitahara O, Katagiri T, Tsunoda T, Harima Y, Nakamura Y. Classification of sensitivity or resistance of cervical cancers to ionizing radiation according to expression profiles of 62 genes selected by cDNA microarray analysis. Neoplasia. 2002;4:295–303. doi: 10.1038/sj.neo.7900251. [DOI] [PMC free article] [PubMed] [Google Scholar]
- 12.Lee JU, Hosotani R, Wada M, Doi R, Kosiba T, Fujimoto K, Miyamoto Y, Tsuji S, Nakajima S, Nishimura Y, Imamura M. Role of Bcl-2 family proteins (Bax, Bcl-2 and Bcl-X) on cellular susceptibility to radiation in pancreatic cancer cells. Eur J Cancer. 1999;35:1374–1380. doi: 10.1016/s0959-8049(99)00134-3. [DOI] [PubMed] [Google Scholar]
- 13.Park WY, Hwang CI, Im CN, Kang MJ, Woo JH, Kim JH, Kim YS, Kim H, Kim KA, Yu HJ, Lee SJ, Lee YS, Seo JS. Identification of radiation-specific responses from gene expression profile. Oncogene. 2002;21:8521–8528. doi: 10.1038/sj.onc.1205977. [DOI] [PubMed] [Google Scholar]
- 14.Pillai RS, Bhattacharyya SN, Artus CG, Zoller T, Cougot N, Basyuk E, Bertrand E, Filipowicz W. Inhibition of translational initiation by Let-7 MicroRNA in human cells. Science. 2005;309:1573–1576. doi: 10.1126/science.1115079. [DOI] [PubMed] [Google Scholar]
- 15.Sklar MD. The ras oncogenes increase the intrinsic resistance of NIH 3T3 cells to ionizing radiation. Science. 1988;239:645–647. doi: 10.1126/science.3277276. [DOI] [PubMed] [Google Scholar]
- 16.Viswanathan SR, Daley GQ, Gregory RI. Selective blockade of microRNA processing by Lin28. Science. 2008;320:97–100. doi: 10.1126/science.1154040. [DOI] [PMC free article] [PubMed] [Google Scholar]
- 17.Weidhaas JB, Babar I, Nallur SM, Trang P, Roush S, Boehm M, Gillespie E, Slack FJ. MicroRNAs as potential agents to alter resistance to cytotoxic anticancer therapy. Cancer Res. 2007;67:11111–11116. doi: 10.1158/0008-5472.CAN-07-2858. [DOI] [PMC free article] [PubMed] [Google Scholar]
- 18.Westphal CH, Rowan S, Schmaltz C, Elson A, Fisher DE, Leder P. atm and p53 cooperate in apoptosis and suppression of tumorigenesis, but not in resistance to acute radiation toxicity. Nat Genet. 1997;16:397–401. doi: 10.1038/ng0897-397. [DOI] [PubMed] [Google Scholar]
- 19.Wu HG, Bang YJ, Choi EK, Ahn YC, Kim YW, Lim TH, Suh C, Park K, Park CI. Phase I study of weekly docetaxel and cisplatin concurrent with thoracic radiotherapy in Stage III non-small-cell lung cancer. Int J Radiat Oncol Biol Phys. 2002;52:75–80. doi: 10.1016/s0360-3016(01)01739-4. [DOI] [PubMed] [Google Scholar]


